
Downloads
Download the report as a PDF
PDF | 1.65 MB
Download the summary as a PDF
PDF | 616.43 KB
This final report of the Pensions Review, a major project launched in April 2023 by the Institute for Fiscal Studies, in partnership with abrdn Financial Fairness Trust, examines the main risks to today’s working-age individuals in the UK pension system and sets out policy proposals primarily focused on improving outcomes for future generations of retirees. This report does further analysis and draws on the large number of reports we have published as part of this review.
Challenges within the current system
The current UK pension system, with automatic enrolment of most employees into private pensions alongside a flat-rate state pension payable from a single state pension age, offers significant advantages. This simple design encourages private pension saving while also providing flexibility for those who wish to either opt out of saving or alternatively contribute more. It does not need a complete overhaul. But despite its strengths, the system faces significant challenges.
An ageing population places pressures on the public finances through increased spending on state pensions and in particular on health and social care. A generously indexed state pension adds to these growing pressures. The ‘triple lock’ increases the value of the state pension in an unpredictable way and it could reasonably be expected to push up state pension spending by anywhere between £5 billion and £40 billion a year in 2050 in today’s terms. Rising state pension ages have substantially pushed up the risk of income poverty among those in their mid 60s. Those reaching retirement in the private rented sector, increasing in number, are also at a heightened risk of poverty throughout their retirement.
Additionally, many employees – and an even higher fraction of the self-employed – are not saving enough privately for their retirement. As shown in Figure ES.1, 39% of private sector employees are not on track to reach their ‘target replacement rate’ – a benchmark for avoiding large falls in standards of living at retirement as defined by the 2002–06 Pensions Commission. The graph also shows that 13% are not on track for the Pensions and Lifetime Savings Association (PLSA) minimum standard (a post-tax income of £13,400 per year for a single pensioner or £21,600 for a pensioner couple, after housing costs and living outside London). Low earners are considerably more likely not to meet the PLSA minimum standards (32% are projected not to meet this level on the basis of their individual incomes). Middle and higher earners are particularly likely to face a significant drop in living standards at retirement (e.g. 50% of those in the third quartile of the earnings distribution would miss their target replacement rate). With low rates of pension participation among the self-employed, 63% of self-employed workers are projected to fall short of their target replacement rate and 66% are projected to miss the PLSA minimum standard. More saving is needed.
Figure ES.1. Retirement income adequacy: percentage of private sector employees saving into a defined contribution pension, and self-employed, projected to fall short of selected benchmarks
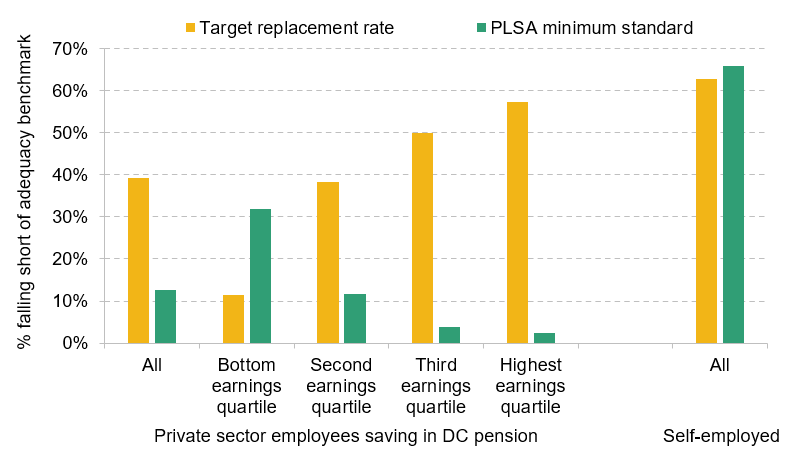
Source: The sample contains 25- to 59-year-olds in Round 7 of the Wealth and Assets Survey. We simulate their projected future retirement income under their current saving rate, modelling everyone at the individual level and without accounting for future housing costs or receipt of inheritances.
At the same time, while there is a clear case for many working-age people to save more for retirement, it is important to recognise that increasing saving – and therefore reducing spending – of working-age households who are currently on a low income and struggling would create greater hardship today. Evidence suggests that this trade-off remains the case if the saving is undertaken by employers on behalf of their employees, as wages would likely fall (or grow less quickly) – at least somewhat – in response to higher mandated employer contributions.
There are also clear challenges in the current pension system for when and how pension wealth is accessed. The introduction of ‘pension freedoms’, which means that since 2015 no one is obliged to purchase an annuity with their pension pots, has had advantages for many. But it also exposes some people to risks they would not have faced had they either had a defined benefit pension or purchased an annuity, and then spent their income each year. Many are insufficiently supported on how best to manage longevity, investment and inflation risk when drawing down on their pension wealth through retirement, especially at older ages. This is an even bigger challenge when each change of employer creates a new pension pot for employees, which fragments retirement savings, making them easier to lose track of and unduly hard to manage well.
Combined, these factors are a recipe for too many to have poor financial security through retirement. In this report, we therefore make a set of proposals designed to address these key issues facing the pension system.
Reforms for an improved pension policy framework
Our proposals aim to ensure that the state pension system provides a reliable foundation for private saving. We focus on reforms to improve outcomes for those most at risk of poor retirement outcomes under the current system. We recognise that not everyone can afford to save more every year, so our recommendations help protect take-home pay for lower-income groups. More needs to be done to simplify decision-making for individuals, to help strike a fairer balance of responsibility among the state, individuals and employers when it comes to pension saving.
To achieve these outcomes, we propose a series of reforms, set out in more detail in Chapter 2. The key themes of these reforms are:
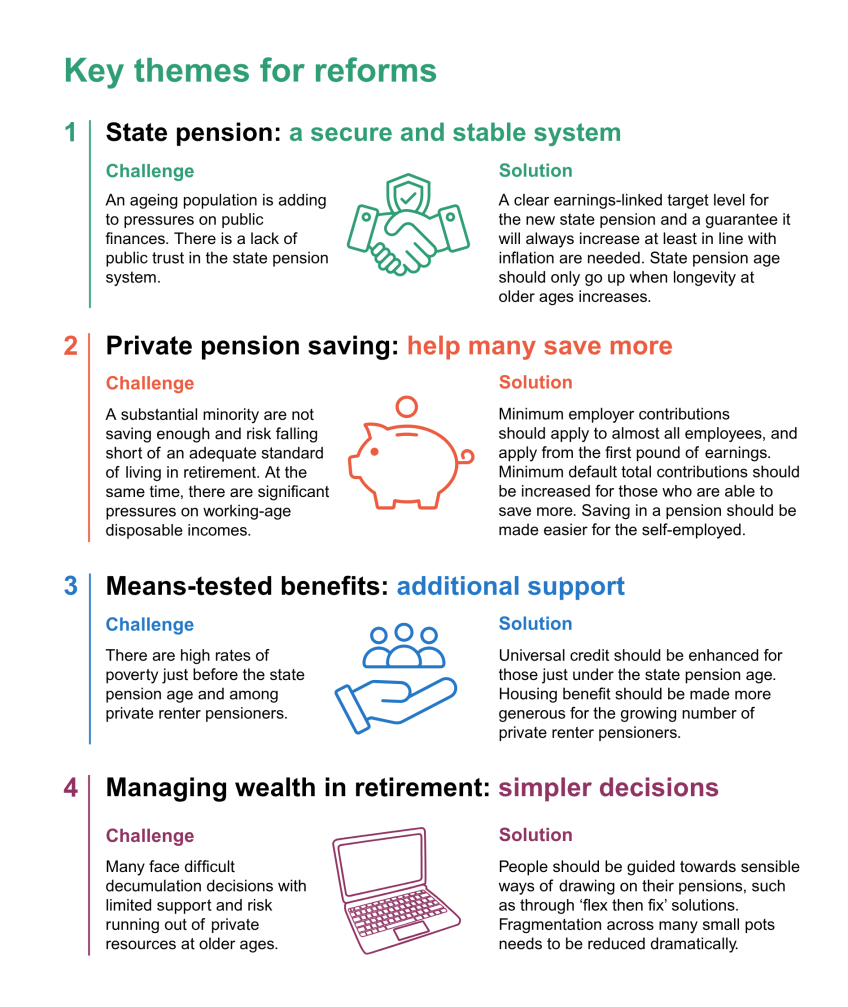
- State pension. We propose a ‘four-point guarantee’ for the state pension to increase confidence in the state pension as a stable and secure basis of the pension system. This guarantee means that: (1) a clear earnings-linked target for the new state pension should be set to improve predictability and to make sure that pensioner incomes keep up with increases in living standards; (2) the state pension will always increase in line with at least inflation; (3) the state pension will never be means-tested; and (4) the state pension age should continue to increase as longevity at older ages rises, but not by as much as that increase in longevity.
- Private pension saving. Many need more income in retirement. Too many employees miss out on employer pension contributions, so minimum employer contributions should be extended to almost all employees and apply from the first pound of their earnings. The automatic enrolment system should help people save at points of life when it is easier for them to do so. By increasing defaults for total pension contributions when individuals are on (and above) average earnings, the government can protect take-home pay when individuals are on low earnings, but still deliver a boost to many people’s retirement incomes. The government should make it easier for self-employed people to participate in a private pension, utilising HMRC’s Self Assessment system and drawing on the lessons of what has made automatic enrolment such a success in boosting workplace pension participation among private sector employees.
- Means-tested support. As the state pension age continues to rise, universal credit should be enhanced for those in the run-up to that age. This can be done for a small fraction of the fiscal savings from increasing the state pension age, and would help to alleviate the increase in poverty that would otherwise occur. Means-tested support for pensioners should be streamlined to boost take-up, and housing benefit should be made more generous for the growing number of pensioners residing in the private rental sector.
- Managing retirement incomes. Pensions need to be easier to manage, particularly through retirement. Fragmentation across many small pots needs to be reduced dramatically, with the level for automatic consolidation of pensions rising once it has been successfully implemented for the very smallest pots. People should be guided towards sensible ways of drawing on their pensions that reduce the risk of them running out of private resources, such as hybrid ‘flex then fix’ solutions (combining the flexibility of drawdown earlier in retirement and the purchase of an annuity later in retirement). However, even very well-designed default solutions will not be right for all, and people should be able to get high-quality information to make sensible decisions without having to take expensive financial advice.
Benefits of our policy reforms
Our proposals for the state pension would improve the predictability of the future level of the state pension and guarantee that state pension income is never means-tested, building confidence in the state pension system and allowing it to provide a stable foundation upon which to build private retirement savings.
Our proposed reforms to private pensions would result in more private saving – our modelling suggests around £11 billion a year – on top of the foundation provided by the state pension. Our suggested enhancements to automatic enrolment would reduce the share of people with an ‘inadequate’ income in retirement, and the largest percentage increase in retirement incomes would come for those currently most at risk of low retirement incomes. Importantly, the effects would be substantial for younger adults, who would see the benefits of our proposals over the whole course of their working lives (see Figure ES.2). The share of 25- to 34-year-old employees saving in defined contribution pensions who are projected to miss their target replacement rates would fall by 14 percentage points, from 38% to 25%, while the share predicted to fall short of the PLSA minimum retirement living standard would more than halve under our proposals, from 13% to 6%.
Figure ES.2. Share of 25- to 34-year-old employees saving in defined contribution pensions projected to be on course for an inadequate retirement income, under current system and under our proposed reforms to automatic enrolment
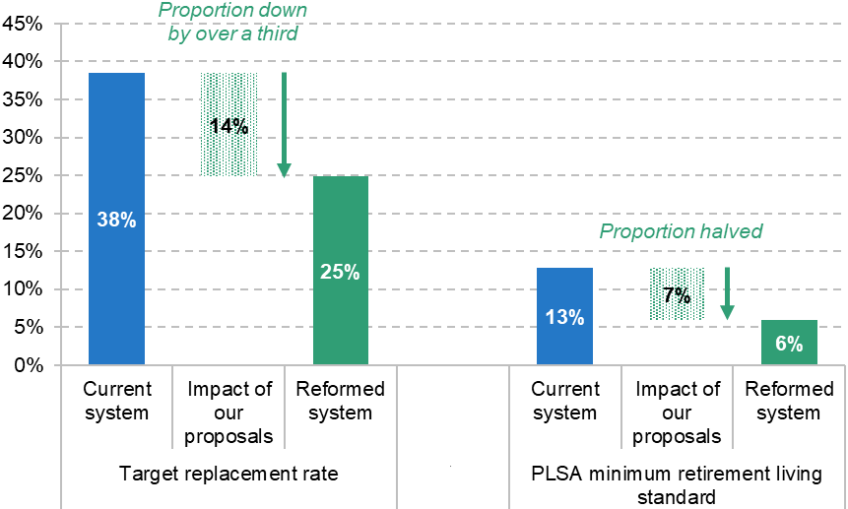
Note: The sample contains 25- to 34-year-old private sector employees saving into a defined contribution pension in Round 7 of the Wealth and Assets Survey. We simulate their projected future retirement income under their current saving rate, and under our automatic enrolment proposals, modelling everyone at the individual level and without accounting for future housing costs or receipt of inheritances.
The effects on pension adequacy for older working-age adults are smaller, as they have fewer years before retirement to save more. This highlights the cost of delay. Acting swiftly ensures more generations have time to benefit for longer from increases in private pension saving. By implementing these policies sooner rather than later, the pension system can better help more of today’s working-age population build a more financially resilient retirement.
In addition to reducing the fraction of workers facing inadequate retirement incomes, what really sets our proposals apart is that, by carefully targeting increased saving, we would achieve this while mitigating falls in working-life take-home pay for those struggling on lower earnings. And, by both increasing the level and extending the reach of minimum employer contributions, we would ensure this extra saving is the shared responsibility of both employees and their employers. Our automatic enrolment proposals would boost private pension saving by around £11 billion a year, with roughly half of this coming from increased employer contributions and half from increased employee contributions. This increase in contributions would attract around £3 billion a year of additional up-front tax relief. Our proposals to facilitate pension saving for the self-employed would also benefit this group which has particularly – and worryingly – low pension participation.
However, just helping people to accumulate more savings is not enough. Currently, people are reaching retirement with too little assistance in how to put the savings they have built up to good use. Our proposals would reduce the risk of people making poor financial decisions with their retirement savings by helping them consolidate their pension pots, thereby simplifying the problem, and guiding them towards good decisions – for example, through default product offers – without necessarily having to access expensive ongoing financial advice.
Finally, there will always be some who need extra financial support from the state in old age. Our proposed reforms would help these people in a well-targeted way by boosting means-tested support for some of those hardest hit by increases in the state pension age and the growing numbers living in the private rented sector in retirement.
Detailed summary of proposals
1. Our proposed reforms can help move towards a pension system that will: (1) provide a secure and stable state pension; (2) provide increased support to many hit hardest by state pension age rises and others particularly at risk of poverty in retirement; (3) increase the number of people saving into a private pension and help many others save more; and (4) offer solutions to help people manage their pension wealth through retirement.
The state pension
2. The current flat-rate state pension, first claimable from a single age and with a simple structure, has many benefits. However, the state pension system faces significant challenges. The ageing population will add considerable additional pressure on the public finances in coming decades, and ‘triple lock’ indexation ratchets up the value of the state pension over time, increasing the cost of the system in a way that creates additional uncertainty compared with increasing the state pension in line with earnings growth. Relying only on raising the state pension age to rein in spending would hit those with lower life expectancy – disproportionately including many on lower incomes – harder. And despite its new-found simplicity, there is a mixture of confusion and pessimism about the state pension.
3. To help with these challenges, we propose a ‘four-point guarantee’ for the state pension. This is designed to give people more confidence and certainty over what they can expect their state pension to provide; help them avoid old-age poverty; and provide a bedrock on top of which private pension saving can be built.
4. The four points are:
4.1 There will be a government target level for the new state pension, expressed as a share of median full-time earnings. Increases in the state pension will in the long run keep pace with growth in economy-wide average earnings, which ensures that pensioners benefit when the incomes of working-age households rise.
4.2 Both before and after the target level is reached, the state pension will continue to increase at least in line with inflation every year. Together with the first point, this means that the state pension will follow a ‘smoothed earnings link’, as is used in Australia.
4.3 The state pension will not be means-tested.
4.4 The state pension age will only rise as longevity at older ages increases, and not by the full amount of that longevity increase. To increase confidence and understanding, the government will write to people around their 50th birthday stating what their state pension age is expected to be. Their state pension age would then be fully guaranteed 10 years before they reach it.
5. A key feature of this guarantee is for the government to set a target level of the state pension, expressed as a fraction of average (median full-time) earnings. A full new state pension is currently worth 30.2% of average earnings. As an illustration, a 9% boost to its value would mean a full new state pension being worth 33% of average earnings – and on average give a bigger percentage boost to the incomes of lower-income retirees. But it would cost around £15 billion more per year in 2050 than if the target was the current level of 30.2%.
6. The target level will ultimately be based on political priorities, but under our guarantee the government would not have to move away from the triple lock immediately. Rather, it could communicate what level it wants the state pension to reach, and commit to keeping the triple lock in place until then, introducing the Australian-style smoothed earnings link set out above from the point the target is reached.
7. The smoothed earnings link is an important improvement to the system. Retaining the triple lock while raising the state pension age would hit poorer people more because the loss of a year of state pension income is more important for those with lower life expectancy, as they spend fewer years above the state pension age. On the other hand, those with a higher life expectancy benefit relatively more from the triple lock, as they are more likely to be receiving a generously indexed state pension in their 90s and beyond.
Means-tested benefit system
8. We do not think that early access to a state pension at an actuarially reduced rate is desirable, as it would add complexity to the system and increase individuals’ risk of income poverty at older ages. Instead, there is a case for enhancing the working-age means-tested benefit system, especially as the state pension age continues to rise.
9. We therefore propose additional means-tested support for those within a year of their state pension age, i.e. those aged 66 from 2028 onwards. This support could either be offered to everyone with low incomes and assets (those receiving universal credit) or targeted only to those with low incomes and assets who are also receiving health-related benefits (alongside universal credit). This type of additional support comes at a cost to public finances (costing £600 million or £200 million, respectively). It also reduces work incentives and potentially increases the incentive to apply for health-related benefits if that is the basis of targeting. However, these kind of mitigation measures can play an important role in helping groups that are most harmed by a higher state pension age, as well as in maintaining political and public support for state pension age increases (which significantly increase employment). The public finance costs are a small fraction of the approximately £6 billion annual saving from increasing the state pension age by a year. And to the extent to which such mitigation boosts public support for increases in the state pension age, it might make such increases more likely to be successfully implemented.
10. For pensioners entitled to means-tested benefits, low take-up of pension credit remains an issue. It is essential that the government delivers its plans to integrate pension credit and housing benefit to help with the take-up issues. Private renter pensioners face higher poverty rates and risks due to lower housing security, and the fraction of privately renting retirees is set to grow significantly. We propose that the government increases the maximum housing benefit for private renter pensioners by allowing an extra bedroom in setting the maximum allowance (initially costing around £150 million per year). This would mean that, for example, a pensioner couple would be entitled to housing support that was always based on (at least) the local rents for two-bedroom properties, which would bring the treatment of privately renting pensioners closer to that of social renters. Furthermore, focus groups run alongside this Pensions Review revealed much support for pensioners being entitled to have a ‘spare’ bedroom.
Private pension saving – employees
11. Our modelling shows that many average and higher earners are not on track to reach commonly used benchmark retirement income replacement rates. A significant fraction of lower earners are not saving in a pension. Even if they are saving in a pension, a significant minority of employees are projected to fall short of their ‘target replacement rate’ – a benchmark for avoiding large falls in standards of living at retirement (as defined by the 2002–06 Pensions Commission). A smaller minority are on track for a retirement income that falls short of the ‘minimum standard’ defined by the Pensions and Lifetime Savings Association (£13,400 per year for a single person and £21,600 for a couple, measured after tax and after housing costs, living outside London). There is a clear challenge with two competing priorities: we need policies to help employees reach adequate levels of retirement income, while also mitigating concerns around lower take-home pay in working life. These concerns exist irrespective of whether increases in private pension saving come from employee or employer contributions, as evidence shows that a large fraction of mandated employer contributions are passed on to employees in the form of lower wage growth.
12. There is a strong case for employees to receive an employer pension contribution of at least 3% of their pay, regardless of the employee’s contribution. This would ensure that (most of) those who currently earn too little to have to be automatically enrolled, and those who opt out from saving for affordability reasons, do not miss out on an employer pension contribution. We think this should apply to anyone earning at least £4,000 per year, and for the contribution to be based on total earnings up to the annual equivalent of £50,270 (the higher-rate income tax threshold).
13. As the new state pension provides the same flat-rate amount to everyone with the full number of qualifying years, it alone takes lower earners much closer to their target replacement rates (though it alone does not ensure single people reach the PLSA ‘minimum standards’). Many middle and higher earners will need more significant private savings to ensure that they do not see a large fall in their material standards of living upon retirement. Thus, increases in minimum default total (i.e. employee plus employer) contributions should be targeted in particular at average – and above-average – earners. Those with low earnings in some years, but higher in others, would also (by default) end up saving more – but importantly targeted towards when they were more able to do so.
14. There are many ways in which this could be achieved, and in this report we propose a new set of rules for minimum default total contributions. For employees earning at least £10,000 per year, the minimum default total contribution would equal 3% of £9,000 (£270), plus 10% of the portion of earnings between £9,000 and £90,000. For a middle-earning employee on £35,000 per year, minimum default total contributions would rise by around £570 per year, from £2,300 to £2,870.
15. People should have the ability to contribute less, as well as more, than these defaults if they wish to. We also think the age range targeted by automatic enrolment (currently 22 to state pension age) should be extended to all who are eligible to make tax-relieved pension saving (i.e. all aged 16–74). To future-proof the system, thresholds should be uprated over time in line with earnings.
16. Our proposals would reduce the share of current 25- to 34-year-old employees saving in defined contribution pensions who are projected to fall short of their target replacement rates by more than a third (from 38% to 25%). There would also be falls in the share of employees failing to reach that standard for older groups, though they are much smaller (e.g. from 42% to 39% for current 50- to 59-year-olds) as they have less time to benefit from increased saving rates.
17. These proposals would boost private pension saving by around £11 billion per year. Roughly half of this increase would come from higher employee pension contributions, with the remaining half coming from higher employer pension contributions. Higher pension saving comes at a cost to the exchequer because of the tax advantages attached to private pensions. These proposed changes would result in a short-term cost to the public finances of up to £3.7 billion per year, falling to (at most) £2.1 billion per year in the long run. With a gradual implementation, these exchequer costs would not be realised for a few years. Small broad-based tax rises, or carefully designed reductions in some elements of pensions tax relief, could – if desired – be implemented to make these reforms revenue-neutral.
Private pension saving – self-employed
18. Pension saving rates of the self-employed have declined dramatically over time, with only around one-in-five of the self-employed now saving into a private pension. This fraction is worryingly low. Even among those who are saving in a private pension, over a quarter make unchanged regular contributions (in cash terms) after five years. Most self-employed people are on track for an inadequate retirement income if relying only on their own pensions, although the picture is improved once we include incomes of partners, inheritances and other wealth.
19. To help the self-employed, more should be done to facilitate their pension participation, drawing on lessons from the success of automatic enrolment. We propose that at a minimum, the self-employed should be required to make an active choice about the level of pension contributions when filling out a self-assessment tax return. Going further, they could be automatically enrolled into a private pension, or potentially a Lifetime ISA, at the point of self-assessment, with the option to opt out. For those who set up direct debits for pension saving, these should by default increase automatically over time.
Small pots consolidation and managing retirement incomes
20. The number of small, deferred private pension pots is large and growing. In 2024, there were around 23 million deferred defined contribution pots worth under £10,000. The number of deferred pots worth less than £1,000 increased by almost one million between 2023 and 2024 (to 13 million). Low earners and women are particularly likely to accumulate small pots. This proliferation of small, deferred pension pots is burdensome for savers as they are difficult to keep track of, and uneconomical for pension providers, thereby reducing the net returns available within pensions.
21. It is welcome that the government has announced it will move forward with small pots consolidation. It will do this by introducing a ‘multiple default consolidator approach’ in which small deferred pots (£1,000 or less) are by default consolidated into one of a small number of nominated pension schemes, with the option to opt out. This is a significant improvement on the status quo. While only deferred pots of £1,000 or less will be automatically consolidated initially, the Pensions Minister Torsten Bell has described the reforms as ‘the starting point’, which we hope indicates an ambition to increase this limit over time. However, as the size limit for automatic consolidation increases, more and more pots would flow into a small number of approved consolidator funds. This anti-competitive effect might cap how high the size limit can be set. People should typically end up with one, or a small number of, defined contribution pension pots at the point of retirement. Many will still need to consolidate their own pots to achieve this, and it needs to be made as easy as possible for individuals to do this sensibly.
22. There are stark challenges for people managing defined contribution pension wealth through retirement, with risks over how long they are going to live (longevity risk), asset returns (investment risk), inflation risk, risk related to the loss of a spouse, and risk of becoming less able to make good decisions at older ages due to cognitive decline. Together, these mean people risk either drawing on their wealth ‘too slowly’ or depleting their pension too quickly.
23. Most people are likely to need more protection against longevity risk than is currently provided by the state pension alone, as their living standards would see sharp falls if they were solely reliant on this. The recently published Pension Schemes Bill would require many pension schemes to introduce default retirement income solutions. A ‘flex then fix’ product, where people have the flexibility of drawdown earlier in retirement and the security of an annuity later in retirement, is likely to be a good model for many. However, the defaults should be carefully designed. They should be ‘soft’ so that they are easy to opt out of, and there should be the potential for different defaults for different types of individuals. The ability to deviate from the default will likely be particularly important for those with other annuitised income streams (such as defined benefit pensions) and those with a low life expectancy. For those who want to make a more active decision around decumulation, people should be able to receive high-quality information on their options without ongoing commitment to expensive financial advice, along the lines of the Financial Conduct Authority’s proposals for targeted support.
24. It is also important that people view pensions as pensions, rather than just another accessible savings pot. To ensure this, the age at which people are able to start to access their defined contribution pension pots should be gradually increased over time so that it reaches age 60 by the time the state pension age reaches 68 in the mid 2040s. In addition, the way in which tax benefits of private pensions are described should not accidentally encourage people to withdraw large amounts from their pensions early in retirement. The 25% tax-free element is invariably described as a ‘tax-free lump sum’. This risks inadvertently – and inappropriately – steering people towards taking 25% of their pension up front as a lump sum. It would be better if it were instead called the ‘tax-free component’ or ‘tax-free element’.
Implementation
25. There is a strong case for urgent action. Reforms to encourage more private pension saving can do more to support the future retirement incomes of those who are younger as they will spend more time under the improved system. Each year that passes without policy changes to help people spend their wealth wisely in retirement means an extra set of retirees being more likely to make mistakes in using their pension wealth, with potentially long-lasting adverse financial consequences.
26. While reform is urgently needed, that does not mean it all has to be implemented immediately. Changes to automatic enrolment should first be consulted on with schemes and employers to ensure a smooth implementation. Piloting some changes with larger employers – as was the case with the initial roll-out of automatic enrolment – is an additional option. Reforms should be announced as soon as possible but with a gradual phase-in period to allow employers and individuals time to adjust. There is a good case for announcing the target goal of the state pension sooner rather than later. Other reforms, in particular to help people use their wealth sensibly in retirement, should come more quickly, as there are fewer near-term barriers to implementation and the problems are more acute.
1. Introduction
In April 2023, the Pensions Review – led by the Institute for Fiscal Studies in partnership with abrdn Financial Fairness Trust – was launched, with the aim of comprehensively assessing the consequences of current pension policy, the economic environment and individual behaviour for the future of living standards in retirement. While the Pensions Commission’s final recommendations in 2005, and the subsequent implementation of these proposals, marked a change in direction, and improvement, in UK pensions policy, it has been around two decades since the publication of its final report, and much has changed in the intervening period.1
From the outset of this project, we argued that there was complacency about the retirement living standards of future pensioners (Cribb, Emmerson, Johnson, Karjalainen and O’Brien, 2023). Average pensioner incomes – after tax and after accounting for housing costs and household size and structure – are currently similar to those for people below state pension age. But many of today’s retirees benefited from generous final salary pensions, rising earnings and asset prices, and very high levels of homeownership, none of which is likely to apply to the next generations of retirees (although the next generation are more likely to receive a significant inheritance in their lifetime).
We outlined concerns about many employees making only modest pension contributions and about low pension participation for the self-employed. We set out the large number of risks that people face in the pension system, including the risk of running out of private resources at older ages, and the risk of poverty if people are still living in the private rental sector upon retirement. And these challenges are exacerbated by ongoing demographic pressures on the public finances, with an ageing population pushing up state spending both on state pensions (and pensioner benefits) and on health and social care.
In this context, as part of this Review, we have systematically reviewed the evidence on the challenges facing future pensioners and undertaken careful empirical analysis to understand recent economic trends and how people have responded to previous pension reforms. We have published a large number of reports (see Appendix D for a full list) and held events to publicise our findings and policy proposals.
We have also extensively engaged with policymakers and other stakeholders representing different groups in society to understand their views on the key challenges and trade-offs. We have worked with abrdn Financial Fairness Trust to commission opinion polling and public engagement activities, undertaken by Ignition House, to understand how people from across the country see the challenges of funding their own retirements and gather their thoughts on potential routes for reform. Summaries of findings from this work and quotes from participants are included throughout this report.
This report brings together our policy proposals which have been informed by the analysis conducted since the launch of this project. In this report, we provide recommendations for reform to improve outcomes for future generations of pensioners across the UK. Importantly, rather than looking at only one part of the pension system at a time, we look at the different aspects of the pension system together. In a system where a combination of public support and private saving is needed to ensure adequate standards of living for retirees, it is important to consider the big picture, rather than focusing on individual parts of the system on their own. The rest of this report proceeds as follows. Chapter 2 sets out our key proposals for improvements to the pensions system. Chapter 3 sets out analysis of the package of reforms, focusing on the effects on both employees and their employers. Chapter 4 sets out considerations regarding implementation of these proposals, including an indicative timeline for the different elements of the package, and the public finance consequences of the reforms. Chapter 5 provides a short conclusion.
2. Reforms needed to improve the current system
The building blocks of the UK pension system are strong – in particular, the flat-rate state pension and an automatic enrolment system that helps employees build private savings on top of it. But, as illustrated in the executive summary, urgent reform is needed to ensure that the pension system works better for those at risk of not achieving adequate standards of living in retirement. In this chapter, we introduce our proposed reforms which build on the successes of past policy reforms.
Most of these proposals were introduced in previous reports published as part of this Review, which provide a great deal of background analysis and detail for the reasoning behind them.2
2.1 Reforms to state support
State pension four-point guarantee – a better way forward
In the past, the UK’s state pension system was overly complicated, and it was difficult for people to understand how much state pension entitlement they had built up or were expected to build up (e.g. Bozio, Crawford and Tetlow, 2010). Too many people – in particular, too many married women – did not qualify for a full state pension. Successive reforms improved things for many groups, culminating in the introduction of the flat-rate new state pension for those reaching the state pension age from April 2016 onwards. Projections show that most new retirees (80%) will receive the full new state pension by 2030 (Department for Work and Pensions, 2013). It is commendably simple, and we believe it can, and should, provide a strong and reliable foundation for private saving decisions.
Given this, drastic changes to the structure of the state pension are not needed. However, we propose a set of reforms to help improve the sustainability and reliability of the state pension system. Our proposals are summarised in the four-point pension guarantee, first discussed in Cribb, Emmerson, Johnson and Karjalainen (2023), and illustrated in Figure 2.1.
Figure 2.1. The four-point pension guarantee
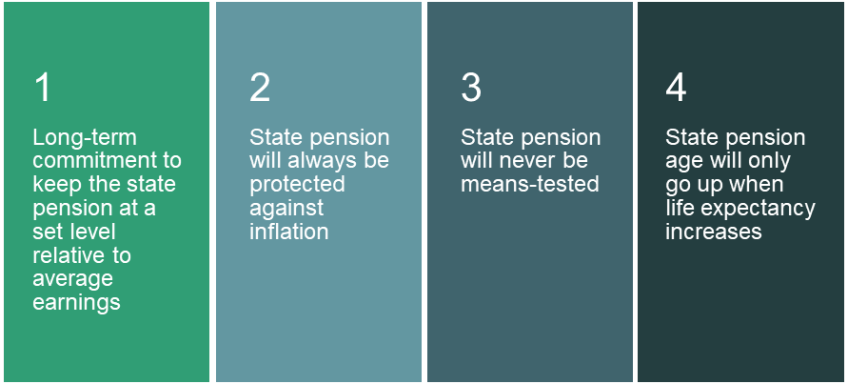
The first part of the guarantee states that the government should decide the level of state pension relative to economy-wide average earnings, which could be at or higher than the current level (of 30% of full-time median earnings). This target for state pension would then be maintained over the long run, providing people and government finances certainty over the level and cost of the state pension in the future. This would also ensure that pensioners’ incomes are boosted over time as standards of living more generally rise.
This would be an improvement over the current system, where the triple lock (by which the state pension rises each year by the highest of average earnings growth, inflation as measured by the CPI and 2.5%) boosts the value of the state pension relative to earnings, but does so in an unpredictable way, and only in periods of poor economic performance when average earnings growth is low (Cribb, Emmerson and Karjalainen, 2025). We estimate that under the triple lock, in 2050 a reasonable range (i.e. between the 10th and 90th percentiles, occurring 80% of the time) for the value of the new state pension in 2050 is between 31% and 37% of median full-time earnings. This creates uncertainty when it comes to future spending on the state pension. Based on our calculations, a reasonable estimate (taking place 80% of the time) for additional spending on the state pension in 2050 due to the triple lock, above and beyond earnings indexation, would be between £5 billion and £40 billion a year in today’s terms.
While some have argued that the triple lock should be supported to generate a higher state pension (e.g. Portes, 2023), if the government wants a more generous state pension relative to average earnings then it would be better to set that as an explicit goal than to use the triple lock which is a mechanism that may or may not deliver the sought-after higher state pension by any given future date.3
The second part of the guarantee states that the state pension will always be protected against inflation. This means that when average earnings growth is below the rate of inflation, the state pension should increase in line with inflation until the target level of the state pension is reached again. This is the system used to index the state pension in Australia and is illustrated in Figure 2.2. It protects the incomes of pensioners when inflation outpaces average earnings growth, while ensuring that the level of the state pension relative to average earnings remains stable over time. This is sometimes known as the ‘smoothed earnings link’, because of the way in which it maintains the link between the state pension and average earnings, while also making sure that the state pension rises in line with inflation in every period. This is also the type of indexation for the state pension that was recommended by the House of Commons Work and Pensions Committee (2015), which proposed that this form of indexation be introduced starting in 2020.
Figure 2.2. Illustration of how our suggested new style of indexation would operate

Note: Assumes inflation of 2% and average earnings growth of 5% in years 1–5 and 3% in years 6–9. In the first period of negative real earnings growth, average earnings growth falls to 0% for one year. In the second period of lower average earnings growth, which lasts four years, the rates are 0%, 1%, 2% and 3%. Between the periods of negative real earnings growth, the nominal average earnings growth rate is 4%, as it is in the final three years.
The third part of the guarantee is a promise that the state pension will never be means-tested. The temptation of an apparently lower-cost means-tested approach should be resisted as it would disincentivise saving for many and therefore risk undermining the success of automatic enrolment. This promise would help working-age people in planning their retirement, as they could have trust in the state pension being available to them in retirement. It is also worth noting that the state pension makes up a large part of incomes even for people on higher incomes. For recent retirees, the state pension on average accounts for 71% of income for low-income pensioners (bottom fifth of income), but even for the richest fifth the state pension makes up 23% of their overall income (Cribb, Emmerson, Johnson and Karjalainen, 2023). In the public engagement work commissioned for this Pensions Review, people tended to agree with not means-testing the state pension, with the state pension seen as an essential element of the welfare system.
‘[The state pension has] always been there and is part of the country’s DNA; as is the NHS. People need structure in their lives and to feel that the Government has their back when it comes to their working life, if they get ill, and retirement.’
Male, aged 65–74, homeowner
The final point of the guarantee relates to the state pension age. When longevity at older ages increases, the state pension age should also rise, but it should not increase by the full amount of that increase in longevity. Communicating the state pension age clearly and effectively is also important. To increase confidence and understanding, we propose that the government should write to people around their 50th birthday stating what their state pension age is expected to be. Their state pension age should then be guaranteed 10 years before they reach it.
Choosing the level of the state pension and phasing it in
A key part of our vision for the state pension is that the government should choose a level for the state pension relative to average earnings. It is worth noting that if the state pension is indexed to average earnings in the medium run, the value of the state pension rises over time as living standards improve, meaning real pensioner incomes should rise over time. In choosing this level of the new state pension, the government has to consider the trade-off between a higher income for pensioners and the public finance implications – namely, higher taxation or lower government spending on other items – that would have. Spending on the state pension is currently (in 2025–26) £146 billion per year.4
To illustrate the cost of increasing the value of the state pension relative to average earnings, Figure 2.3 shows the cost in 2050 of different levels of the state pension (measured in today’s terms) relative to keeping the state pension, as today, at 30% of median full-time earnings. We also show in Table 2.1 how much the target levels of the state pension would save the government in 2050, relative to the central expected path of the triple lock. Any target level up to 34% would be expected to lead to a public finance saving in 2050 relative to the triple lock – although due to the nature of the triple lock there is a lot of uncertainty around this, as the additional cost of the triple lock in 2050 is uncertain. The table illustrates the central scenario, but the savings could be much more (or less) than this based on how the economy performs over the next 25 years.
Figure 2.3. The trade-off between the level of the state pension and the cost to public finances
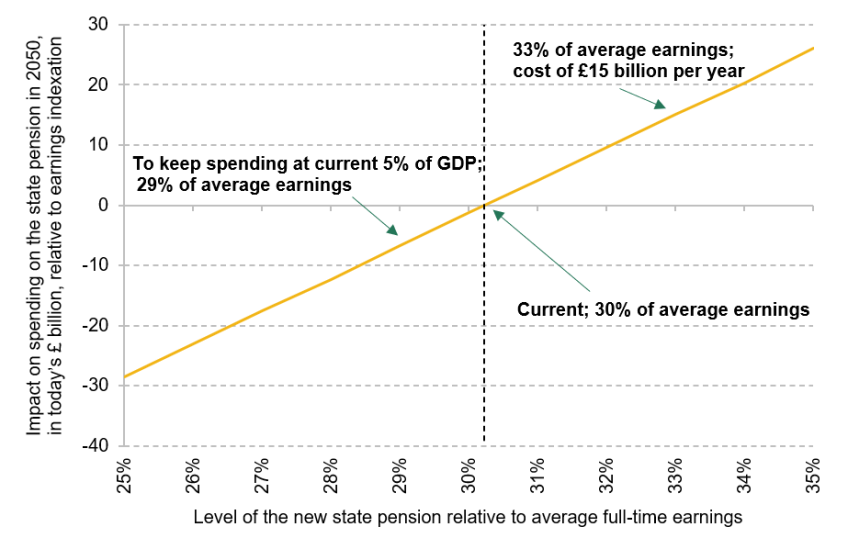
Table 2.1. Level and cost of the state pension, for different relativities to average earnings
| 2025 | 2025 | 2025 | 2050 | 2050 |
|
Value of new state pension relative to average earnings | Weekly nSP (£) | nSP difference relative to current | Cost relative to current (£bn) | Cost relative to earnings indexation from now (£bn) | Expected saving relative to triple lock central case (£bn) | When triple lock central case would achieve this level |
31% | 236 | +2.5% | 3.1 | 4.2 | 16.4 | 2030 |
32% | 244 | +5.8% | 7.2 | 9.7 | 11.0 | 2037 |
33% | 251 | +9.1% | 11.3 | 15.1 | 5.5 | 2043 |
34% | 259 | +12.5% | 15.4 | 20.3 | 0.3 | 2050 |
Memo: current level (30.2%) | 230 | N/A | Current cost: £146bn | N/A | 20.6 | N/A |
Note: nSP refers to the new state pension.
Figure 2.3 shows that, for example, increasing the state pension to be at 33% of average earnings in 2050 would cost an additional £15 billion per year in today’s terms (about 0.5% of national income), compared with keeping the state pension at its current share of average earnings. That would be a saving of £5.5 billion compared with our central expectation of spending under the triple lock. It would also deliver a state pension equivalent (in terms of today’s earnings) to £251 per week, i.e. £21 (or 9%) higher than today’s full new state pension of £230 per week. More options are illustrated in Table 2.1.
Setting the level of the state pension is ultimately a question of political priorities. The government needs to decide how high a foundation level of income in retirement it wants to provide, and hence what level of taxation it is willing to impose in order to achieve that, and the resulting balance between state and private pensions.
One aspect of the state pension is that it helps protect most people from income poverty in retirement. But – unlike over the 1970s and 1980s when most pensioners were low-income – using a higher state pension to achieve further pensioner poverty reduction is a blunt tool (a point also recently made by others, such as Otto (2025)). Increasing the state pension benefits not only pensioners on low incomes, but those on middle and higher incomes, whose incomes are well above the poverty line. Increasing the level of the state pension is therefore an expensive way of reducing pensioner poverty. The state pension should also not be considered in isolation as the only possible way to target pensioner poverty in a system where private pensions and the means-tested benefit system also play a key role (though the effectiveness of the means-tested system at reducing pensioner poverty would be boosted by further addressing long-standing issues of far from complete take-up of pension credit).
Most parties across the political spectrum have stated their commitment to the triple lock in election manifestos including at the 2024 general election. The Pensions Minister Torsten Bell also reiterated the current government’s support for the triple lock in April 2025.5 There may be political costs from moving away from the triple lock, especially in this parliament, given the Labour party manifesto committing to it in 2024.
However, assuming that the government desires a higher level for the state pension (relative to average earnings) than we have currently, it can still choose a pre-specified target that would allow it simultaneously to: increase the value of the state pension (in real terms and relative to earnings); keep the triple lock in the short run (e.g. during this parliament); and move to the ‘smoothed earnings link’ when it has achieved its announced aim of reaching its target.
Table 2.1 shows the central estimate for when the triple lock is expected to lead to specific levels of the state pension relative to average earnings. However, this central estimate is based on economic outcomes from 1992 to 2025 and, depending on how the economy performs in the future, reaching any specific level could take more – or less – time than anticipated. It is also worth noting that even with earnings indexation from 2025, spending on the state pension would rise by 0.2% of GDP, or £5 billion in today’s terms, by 2050, in particular due to the rising number of pensioners.
As part of this Pensions Review, public engagement work was commissioned, where people were asked for their views on a higher state pension (32% or 34% of average earnings). Overall, people tend to prefer the highest state pension presented; but when confronted with the public finance costs, many then opted for the more moderate increase. Many seemed surprised at how expensive even small increases in the level of the state pension are for public finances – the expense follows from the fact that the state pension is received by 13.2 million pensioners.6 Increasing the level of the state pension by 1% of average earnings (which is around a 3% increase in the state pension) costs an additional £4 billion per year.
When people were asked in our public engagement work how they would like to pay for a higher state pension, most had negative reactions to funding a higher state pension through increasing the state pension age – many believe it is already too high.
‘It should not be raised. People cannot work as well in their 60s. I know because I know how much my own skills have reduced. People should not have to work until they die. It will create an even bigger rich poor divide – with the poor working till 70 and then dying and the rich retiring early cos they don’t really need the state pension to retire.’
Female, aged 55–64, homeowner
When pushed, people preferred tax rises over a higher state pension age, in particular VAT increases (rather than income tax rises) as they believed that would mean everyone pays more, which is seen as appropriate as everyone will benefit from a higher state pension. However, people expressed surprise at the cost associated with any pension increase and recognised it was a difficult situation. Most people were looking for a ‘third way’ of finding savings rather than tax rises, mentioning MPs’ expenses for example. However, spending on categories such as MPs’ expenses is only a tiny fraction of the cost of a higher state pension.
‘[A higher state pension should be paid for by increases in] VAT because everyone will get a pension, so everyone should help pay for it.’
Male, aged 35–44, homeowner
‘This is a nightmare choice either way.’
Female, aged 35–44, homeowner
The state pension age
The state pension age was 65 for men and 60 for women from 1940 to 2010. Since 2010, it has risen to age 66 for both. Longevity at older ages during the late 20th century and early 21st century has increased dramatically. For example, between 1975 and 2020 life expectancy of men at age 50 increased by 8 years, while the state pension age (for men) increased by just 1 year, meaning that the time for which men aged 50 could expect to receive the state pension age increased by 7 years. And even though the state pension age for women rose by 6 years over this period, women are still expected to spend on average 20 years receiving the state pension (Cribb, Emmerson, Johnson and Karjalainen, 2023).
The state pension age is legislated to rise further to 67 between 2026 and 2028, and to 68 between 2044 and 2046. The government is also required to conduct periodic independent reviews of the state pension age, to be published within six years from the previous report. There have been two such reports so far, undertaken in 2017 and 2022 (Department for Work and Pensions, 2017 and 2023a), which both recommended that the SPA should rise to 68 earlier than currently legislated, but governments have not made any changes to state pension age legislation as a result of either of these.
Increasing the state pension age is a reasonable way for a government to control the increased public finance pressures arising from rising longevity at older ages. Our modelling (Cribb, Emmerson and Karjalainen, 2024) shows that increasing the state pension age by one year would save the exchequer around £6 billion per year, which is about one-and-a-half times the increase in spending from a 1 percentage point increase in the value of the state pension relative to average earnings.7
However, state pension age increases will also have a different distributional effect from that of other tools for controlling the rising cost of the state pension, especially a policy change of moving away from the triple lock. Retaining the triple lock while raising the state pension age would hit poorer people more because the loss of a year of state pension income is more important for those with lower life expectancy (which poorer people tend to have), as they spend fewer years above the state pension age. On the other hand, those with a higher life expectancy benefit relatively more from the triple lock, as they are more likely to be receiving a generously indexed state pension in their 90s and beyond.
Modelling in the 2022 Independent Review (Department for Work and Pensions, 2023a) shows that the increases in the state pension age required to keep spending on the state pension below a certain level of national income would also have to be substantial. That modelling shows that to keep public spending on the state pension below 6% of national income while retaining the triple lock, the state pension age would have to rise to 69 by 2048–49 and 74 by 2068–69.
While we think that the state pension age should rise as longevity at older ages rises, but not by the whole increase in longevity, this still leaves room for different political parties to prioritise increasing, or holding down, the state pension age to different extents. Our proposal is also consistent with, for example, the principle of keeping the ratio of adult life spent above the state pension age constant.
In this report, we do not take a view on the exact degree to which the state pension age should rise in coming decades. As with the choice around the level of the state pension, the state pension age is just one parameter to consider in a system where other factors such as availability of private resources and the generosity of the working-age means-tested benefit system will also change the way in which increases in the state pension age affect people’s outcomes. However, given that in 2017 the Conservative government accepted the recommendation of the 2017 Independent Review of bringing the state pension age rise to 68 forward, but did not legislate this change, the current government should clearly set out a plan for when we will get to a state pension age of 68 – and specifically whether this should be brought forward. This is particularly timely and important now, as both independent reviews of the state pension age have sensibly recommended that any changes to the state pension age be communicated to people at least 10 years in advance.
The government should promptly conduct a new review of the state pension age, using the latest projections of longevity, and make a swift decision on when (not if) these increases should come in, to provide more guidance to people on what they can expect. This review should also assess the latest data to see how evenly recent changes in mortality have been felt.
The means-tested benefit system in the lead-up to state pension age
A higher state pension age will not affect all groups to the same extent. Lower-income people are more reliant on a state pension in retirement and have less private savings to fall back upon. Moreover, people with lower lifetime earnings and incomes have, on average, lower life expectancies, so for those who survive to pension age, missing out on a year of state pension payments reduces their expected receipt of the state pension by a much greater proportion than it does for better-off groups. Many find it hard to remain in paid work up to the state pension age – the employment rate at age 65 (i.e. just below the current state pension age of 66) is 44% for men and 34% for women. While some of those not in paid work will have made a voluntary choice to retire, a significant minority (12% of 65-year-olds) report being economically inactive due to ill health (Cribb, 2023). When the state pension age is increased, more should be done to support those who are at risk of being left behind on a low income. Without action, we can expect the gap between income poverty rates among those just below, and those just above, the state pension age to continue to rise.
Despite this, in our judgement, the UK should maintain a single universal state pension age, rather than introduce an ‘early access’ age in return for an actuarially reduced award as is possible in many countries. This often occurs in settings with much more generous state pensions – and less reliance on private savings for retirement incomes – than is the case in the UK. In contrast, opting for early access at a permanently reduced rate of state pension in the UK would mean receiving a potentially fairly low state pension throughout retirement, increasing individuals’ risk of income poverty at older ages. We therefore think that rather than allowing early access, additional support for those hardest hit by increases in the state pension age should come from enhancements to the working-age benefits system.
We therefore recommend that a small fraction of the fiscal savings from any future increase in the state pension age should be recycled into making universal credit (UC) more generous for those in the run-up to that age. In our Pensions Review report on the means-tested benefit system around state pension age (Cribb, Emmerson and Karjalainen, 2024), we discussed two broad options – targeting additional support to those aged one year below the state pension age who are in receipt of UC, or to those in the year before state pension age who are receiving UC as well as disability benefits.
There are good reasons for providing additional support for this specific group. People in the year below state pension age are close to being able to access the pensioner benefit system. This means that while additional support would affect the work incentives for this group, we may worry less about the long-run effects of this as they are close to the state pension age in any case. It is also the case that there is a big step up in the amount of out-of-work financial support available at the state pension age – our proposal replaces this large step up with two steps up which are each half as big.
We modelled the cost of these two policies as £600 million a year (for the reform where increases apply to all receiving UC) or £200 million a year (for those receiving UC and disability benefits) – these are relatively modest costs in that they are equivalent to around 10% and 3% of the savings from a one-year increase in the state pension age. It is worth noting that the final cost would, of course, depend on the exact uplift the government chooses. In the Spring Statement in March 2025, the government also proposed changes to working-age health-related benefits which will reduce these costings. In particular, the government is making it more difficult for some to receive personal independence payment (PIP). While the Office for Budget Responsibility (OBR) has estimated this will reduce the number of claimants by 800,000, this estimate is highly uncertain as it will depend on how claimants and assessors change their behaviour, which may also vary by age. The balance of how much the basic element of UC is worth relative to the health element is also changing – the government has suggested an increase in the UC basic element and a reduction in the health-related benefit. These changes will also affect the costing of our proposed policies, if the adjustments to support for those below the state pension age change.
The qualitative research commissioned alongside our Pensions Review suggests that the public also support additional help for some of those most affected by state pension age increases. Increased support was particularly favoured for those with disabilities, as this group was seen to require more support and be more reliant on state benefits. International evidence from the IMF (International Monetary Fund, 2025) also indicates that pension age rises are more publicly acceptable – and politically easier to implement – when accompanied by such mitigation measures. This means that dedicating some of the savings from raising the state pension age to targeted support for poorer groups could also improve political sustainability of the principle of increasing the state pension age as longevity at older ages rises.
‘People who suffer from disabilities or ill health should not be penalised, and should have access to the equivalent pension rate. Ten years is a long time to wait for your state pension if you are too ill to work. The worry and having to live on a reduced income cannot help with their health issues.’
Male, aged 75–84, private renter
The means-tested benefit system for pensioners
The means-tested benefit system for pensioners is much more generous than that for working-age people. However, two changes should be made that would improve state support for low-income pensioners. First, means-tested benefits for pensioners should be streamlined so that they are made easier to claim. It is therefore welcome that the government is working on integrating pension credit and housing benefit for pensioners, which should increase take-up of both as people only have to submit one (higher-stakes) application for most state support.
Second, pensioners should be entitled to more generous housing benefit. The maximum housing benefit that people can receive is based on the distribution of local rents and the size of the household – for example, the maximum housing benefit for couples and single people is (typically) based on the 30th percentile of rents of one-bedroom properties in the local area. We propose that pensioners’ maximum housing benefit should be based on an additional bedroom. This means that for couples and singles, pensioners’ maximum housing benefit would be based on the distribution of local rents of (at least) two-bedroom properties rather than of one-bedroom properties. This would immediately benefit all pensioners whose housing benefit does not fully cover their rents. Support for an additional room compared with working-age individuals can be justified on the basis that pensioners often spend more time at home than working-age people. They may also have adult children, and/or disabilities, which make a second bedroom particularly useful, especially if they require care. It would also more closely align support with housing benefit for those in the social rented sector, where pensioners are not subject to the so-called ‘bedroom tax’. We model the current cost of the policy as £150 million per year, although this would likely rise in the future as more retirees enter retirement as private renters (Cribb, Emmerson and Karjalainen, 2024).8 However, the relatively modest cost reflects the targeted approach of our proposal. As illustrated by the quote below, we found widespread support for this proposal in the public engagement work.
‘An extra bit of space for carers/relatives to stay in times of ill health would be good.’
Male, aged 65–74, homeowner
We think this policy should be introduced in addition to LHA rates being permanently linked to the 30th percentile of local rents for all of those receiving state support with their housing costs, as has been highlighted by other advocacy groups (e.g. Independent Age, 2025).
2.2 Reforming the private pension system
The majority of private pension saving in the UK is done in workplace pensions that are facilitated by employers. All employers have to enrol ‘eligible’ employees automatically into a workplace pension with at least minimum levels of contributions. Eligible employees are those aged between 22 and state pension age and earning at least £10,000 per year. Employers can also delay automatically enrolling new employees for up to three months.
Under automatic enrolment, there is both a minimum default employer contribution of 3% of qualifying earnings (the portion of earnings between £6,240 and £50,270 per year) and a minimum default total (i.e. employee plus employer contribution) of 8% of qualifying earnings. Employees can choose to opt out of workplace pension saving entirely, meaning neither the employee nor the employer contributes to the pension. Employers choose a workplace pension provider for their employees, meaning that when people move employer they generally start saving into a new pension pot. Private pensions can be accessed, in any way that the individual wishes, from age 55 (rising to 57 in Apil 2028).
How to help employees not saving enough
Irrespective of the exact level that the flat-rate state pension could reasonably be set at, we need a private pension system that facilitates many to have a higher income in retirement than that provided by a full state pension. Large numbers of private sector employees – our modelling suggests a majority – are on course to achieve commonly used benchmarks for retirement saving adequacy. But a substantial minority (39%) – and in our view too many – appear on course to fall short of their target replacement rate (as shown in Figure ES.1 in the executive summary). A smaller, but still important, minority, appear on track to fall short of a ‘minimum’ standard of living in retirement. For any realistic value of the new state pension, more private saving for retirement is needed to help more middle- (and higher-) income people achieve a standard of living in retirement that does not fall well short of what they experienced in working life. More pension saving will mean some combination of lower take-home pay for working-age households and increased obligations for employers, and it will mean more tax relief which is attracted by those higher pension contributions.
The obvious lever to facilitate more pension saving among employees is through enhancements to automatic enrolment. Public engagement work shows that there is a great deal of support for automatic enrolment, with many employees acknowledging they would not be saving otherwise.
‘I think if left to me I would not be disciplined enough to save for retirement. I think I would always find something more important at the time to spend the money on. In the current economic climate, there is little disposable income, and paying for something now is a greater need than investing in the future.’
Female, aged 55–64, homeowner
However, any enhancements to the current system need to be carefully designed. Increasing the saving – and therefore reducing the spending – of working-age households who are currently on a low income and struggling would create greater hardship today. This is true even when extra contributions come from employers, as the majority of higher employer pension contributions would likely be passed through to lower wages.9 Among lower earners who are currently targeted by automatic enrolment (i.e. earning between £10,000 and £15,000 per year), over a fifth are in relative poverty and half have less than £1,500 in liquid savings (Cribb, Karjalainen and O’Brien, 2024). Some of this group will have low living standards consistently throughout working life, but will have the state pension to rely on in retirement. Encouraging these people to save more – and spend less – in working life, and for those savings to be locked away in a pension, is hard to justify. Other low earners will only have low earnings temporarily, but would be better served by saving more for retirement at other points of life when their earnings are higher rather than saving more when their earnings are low.10
These considerations point towards targeting higher minimum default pension contribution rates at those on middle (and higher) earnings, and potentially those at older ages, who are often more able to bear increased saving due to lower costs of living (e.g. due to lower (or no) mortgage payments, and children often having moved out of the family home). In addition, employees earning more than the upper limit for qualifying earnings (£50,270) currently face a declining minimum pension contribution rate (as a percentage of their pay) as they earn more. These people should generally be saving a higher share of their earnings as they earn more, to help them smooth their incomes over their lifetime, so the current automatic enrolment minimums are not guiding them to make good savings decisions. One-in-six of those earning between £50,270 and £70,000 are making minimum contributions currently – and this is the case for only 2% of those earning £70,000–£100,000 (see Figure C.4 in Appendix C).
Despite the success of automatic enrolment, around 20% of private sector employees are not saving in a workplace pension (O’Brien, Sturrock and Cribb, 2024). Roughly half of this group are not in the target group for automatic enrolment (which includes many women who work part-time and so earn below the ‘earnings trigger’ of £10,000 per year), while the other half are targeted but have chosen to opt out. These employees do not receive an employer pension contribution.
Making the minimum employer pension contribution almost universal for employees, as first suggested in Cribb, Emmerson, Johnson, O’Brien and Sturrock (2024), so that employees receive it whether or not they themselves contribute, would boost employer pension contributions particularly for lower earners. And it would do so in a way that is less likely to depress their wages, as any resulting slowdown in wage growth cannot easily be targeted at those who would otherwise have opted out of their workplace pension. Arguably, this increases the fairness of the system – those who perhaps cannot afford their own contributions do not lose out on employer contributions. This reform would, though, reduce the financial incentive for some employees to save in a pension and might therefore lead to a fall in the share of employees making contributions themselves. However, as discussed in Cribb, Emmerson, Johnson, O’Brien and Sturrock (2024), previous evidence suggests that the fall in employees making contributions would likely be limited. If the government was particularly worried about an increase in opt-outs, it could trial the ‘non-contingent’ employer contribution in a limited number of employers before universal roll-out.
In addition, there are good reasons to extend the age range eligibility for automatic enrolment to boost saving and to simplify the system. Indeed, it is not clear why the age range for automatic enrolment should exclude some employees who are allowed to save into a tax-advantaged pension (all those aged 16–74). Extending the age range for eligibility would also further expand the number of employees benefiting from the minimum employer contribution: we estimate that around 1.5 million employees who are younger than 22 or older than 65 would benefit from an increase in employer pension contributions.
There are several potential reforms to automatic enrolment that could achieve our aims of higher total contribution rates for middle and higher earners alongside introducing a ‘non-contingent’ element to the employer pension contribution. Below is one set of parameters:
- age range for eligibility: 16–74;
- earnings trigger for eligibility: those earning at least the equivalent of £4,000 per year;
- minimum employer pension contribution: 3% on the band of earnings from £0 up to £50,270 and irrespective of whether the employee contributes;
- minimum default total (i.e. employee plus employer) pension contribution:11
- 3% of earnings for employees earning at least £4,000 and less than £10,000 per year;
- 3% of £9,000 (i.e. £270) plus 10% of earnings between £9,000 and £90,000 for employees earning at least £10,000 per year;
- employees have the option to ‘opt down’, reducing their total contribution below the minimum default total contribution without losing the minimum employer pension contribution.
Figure 2.4 shows the minimum default total contribution rate, as a percentage of total earnings, for different levels of earnings under both the current automatic enrolment system and our proposals. The corresponding graphs for the minimum employer contribution rate, and the implied default employee contribution rate when employers make minimum contributions, are Figures C.1 and C.2. Our proposals imply an increase in the minimum default total contribution rate at all levels of earnings, and indeed increases that are larger (both in cash terms and as a percentage of earnings) for people on middle and higher earnings than for people on lower earnings, with the exception of people earning between £4,000 and £10,000 who would under our proposals receive an employer pension contribution for the first time.
Figure 2.4. Minimum default total (employee + employer) contribution rate, % of total earnings, under different potential automatic enrolment systems
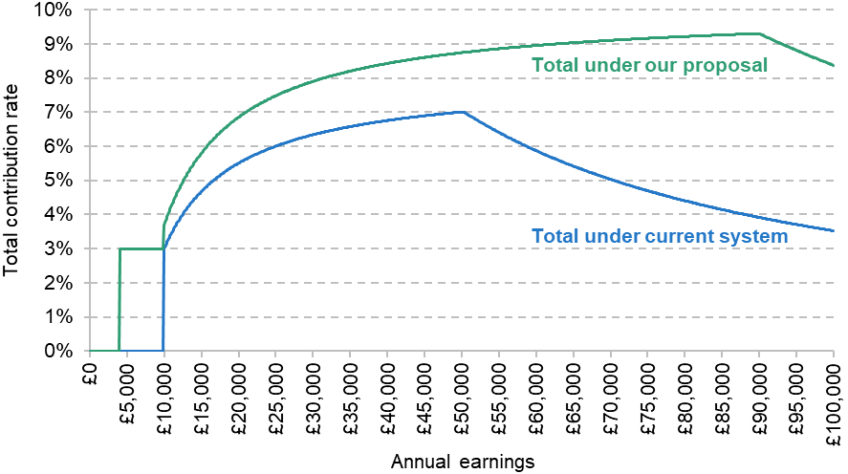
How these proposals impact incomes and savings is determined both by the change in the minimum default contributions and by the extent to which different groups are actually affected by these changes. Middle and higher earners are much more likely than lower earners to contribute more than the current default minimum amounts, meaning middle and higher earners are typically less affected by changes to these minimums. Among private sector employees currently saving in a defined contribution pension, over half of those earning between £10,000 and £20,000 have (current) minimum pension contributions, compared with only one-in-six of those earning between the higher-rate tax threshold (£50,270) and £70,000, as shown in Figure C.4. In Chapter 3, we show explicitly how this set of reforms would affect different groups of employees and employers.
It is also worth emphasising why we are not recommending some reforms that are commonly suggested by others. One such suggestion is to reduce the lower limit for qualifying earnings to zero, so that contributions are calculated from the ‘first pound’. Indeed, enabling legislation for this change to be made in England, Scotland and Wales was passed in 2023.12 However, this change would lead to the highest percentage increase in contributions for those earning just over £10,000 per year (as discussed in Cribb, Karjalainen and O’Brien (2024)), and many in this group might struggle to afford the associated reduction in take-home pay. Others have suggested increasing the minimum total contribution rate to 12% (of which 6% would come from the employer) alongside reducing the lower limit for qualifying earnings to zero as a way of increasing pension saving (e.g. Pensions and Lifetime Savings Association, 2022a). This would risk an even larger fall in take-home pay for lower earners. Improving pension outcomes for lower earners is important, but it is crucial that this is done in a way that minimises hardship during working life. And neither extending to the first pound, nor increasing the minimum contribution rate to 12%, would do anything to help the fifth of employees who are not a member of their workplace pension. In contrast, it might lead to more employees opting out of pension saving altogether if they cannot afford the higher employee contribution. We model the effects of our proposals relative to these other suggestions in Chapter 3 and show that, while the reforms have similar distributional effects on retirement incomes – although the magnitude of the increase is larger for the move to a 12% contribution rate – the reductions in take-home pay arising from our proposals are much less focused on lower earners.
Our proposals take as given that most private sector employees currently save into defined contribution pension arrangements. Some stakeholders are enthusiastic about the potential for collective defined contribution pensions (‘CDC’), with proponents highlighting they can potentially generate higher returns for savers and help manage longevity risk. But there is a great degree of uncertainty around the development of these schemes, such as if (or when) these products will be available at a large scale, whether the products would be more likely to be whole-life or ‘decumulation-only’, and how well they can actually provide insurance against investment and inflation risk (in addition to longevity risk) across successive generations (while retaining pension freedoms). We see the prospect of CDC becoming more widely available as ‘complementary’ to our other proposals, but it seems likely that defined contribution schemes will remain the predominant form of private pension provision in the coming years.
Other measures have also been suggested to mitigate or balance concerns about affordability and increased retirement savings. In particular, Nest Insight has run extensive trials on ‘sidecar’ models of saving where some of the automatic workplace savings initially go to liquid savings products rather than being locked away in a pension for retirement. These have shown promising results in terms of effects on building up financial resilience (e.g. Nest Insight, 2023). While not a core part of this report, in our previous work (Cribb, Emmerson, Johnson, O’Brien and Sturrock, 2024) we suggested that the government should consider these types of hybrid saving options especially if automatic enrolment is amended so that employee contributions are calculated from the first pound of earnings.
How to help self-employed workers not saving enough
Reform is also needed to make it easier for the self-employed to make pension contributions. While considerable policy effort and reform over the past two decades have put in place structures to make it much easier for employees to save in a workplace pension, self-employed workers still have to arrange their own personal pension. It is hardly surprising that a much smaller fraction of self-employed workers save in a private pension than employees, though the big reduction in the fraction of the self-employed saving in a pension, from 60% of self-employed workers earning over £10,000 in 1998 down to around 20% today, is more of a puzzle (see Figure A.1 in Appendix A). A detailed discussion on trends in pension saving among the self-employed and the options for reform can be found in Cribb, Emmerson, O’Brien and Sturrock (2024); we summarise our policy recommendation below.
HM Revenue & Customs (HMRC) should be tasked with making it easier for the self-employed to make pension contributions when they are completing their tax return. One option is to require all self-employed workers to make an active choice about the level of contributions they wish to make when filling out their tax return (with zero being an option), while being shown the default minimum contributions that an employee with their level of earnings would contribute. Any contributions made would then go either into a nominated private pension plan, a government-chosen default pension plan or (perhaps) a Lifetime ISA.
The second option is a form of automatic enrolment for the self-employed, again administered by HMRC at the point of filling out a tax return. This would be similar to the first option, but the contribution box on the (online) form would be pre-filled with a positive contribution amount, which the self-employed worker could adjust up or down as they wished. As defaults can be powerful, this should only be targeted at self-employed workers with income above a certain trigger (such as £10,000). In addition, the default contributions could start at a relatively low level and be increased over time.13 Quotes from public engagement work also show support for these types of default options to help self-employed people who would otherwise struggle with decision-making around pension saving.
‘If you’re employed, somebody basically says: here’s a pension scheme set up for you – do you want to opt out – yes or no? I appreciate it can’t be quite that straightforward for self-employed, but ideally, for me it’d be something similar where I don’t have to worry about setting the scheme up. I don’t have to consider various options. It’s a case of here’s a basic scheme, do you want it?’
Male, aged 35–44, private renter
‘I suppose for somebody like me that’s a bit lazy and doesn’t have any knowledge of finance then if it’s set up and it starts and the payments start rolling, I would probably just maybe keep going with it. I would probably say to myself, oh, I’ll look into this and get some independent advice. Whether I would or not, who knows, but at least it would get a 20-year-old or a young self-employed person started.’
Female, 35–44, social renter
There are also concerns that those self-employed who are saving tend to make relatively low contributions. One reason for this is that many self-employed workers make the same cash-terms contributions year after year, as this is typically the norm when saving through a monthly direct debit. This contrasts with employees, where contributions typically rise in line with earnings. To address this, people setting up personal pension schemes should have to choose how much their contributions will rise over time, with the default rate of increase in line with the Consumer Prices Index.
How to help those accessing their pension pots
Finally, the rise in defined contribution (DC) pension wealth, combined with ‘pension freedoms’, gives people the ability to access private pension wealth from their late 50s however they choose. These freedoms will be put to good use by many. There will be individuals for whom a smooth annuity income purchased from DC pension savings is not appropriate, perhaps due to their spending needs and their other income changing over time in unaligned ways. But pension freedoms also mean that many people need to make complicated decisions about how to draw on their pension wealth and people have greater opportunities to make bad financial decisions than they did previously.
More needs to be done to help individuals make good use of these freedoms without having to be a pensions expert. This will be increasingly important over time as the number of individuals approaching retirement with a significant amount of defined contribution pension wealth – and without significant defined benefit pension wealth – is increasing over time. Among 55- to 64-year-olds in 2021–23, six-in-ten (59%) had some DC pension wealth, up from around 44% fifteen years earlier. And the typical amounts held in DC pensions at retirement are set to rise. Boileau, Cribb and Emmerson (2025a) find that median DC wealth at retirement (for those with at least some DC wealth) for people born in 1960–64 will be around £74,000, but it is set to almost double to £131,000 for those born fifteen years later.
A key risk that lots of retirees will need to balance is the risk of drawing on their accumulated pension pots either too quickly (and running out of private resources) or too slowly as they are so worried about the prospects of running out. How to manage the combined risks of living longer than expected (longevity risk), and the rate of return (or investment) risk led William Sharpe, the Nobel-Prize-winning economist to describe the problem of how to draw down on retirement wealth as the ‘nastiest, hardest problem in finance’.14
One way to eliminate longevity risk is to purchase an annuity – a guaranteed income for life. But the number of annuities purchased since the announcement of pension freedoms has been low. This has been the result of a range of factors, including the facts that many DC pension pots are small (generating only a small income if annuitised), that annuities have been perceived to be of poor value (with low government bond yields for many years translating into low annuity prices) and that the path of least resistance is not for people to buy an annuity (but instead is to leave the pot untouched). While many people do misperceive their own life expectancy (with younger retirees in particular underestimating), uncertainty over life expectancy is relatively low early in retirement (as discussed by LCP (2021) and Boileau, Cribb and Emmerson (2025b)), meaning that the value of longevity insurance is limited for people in their 60s. But uncertainty over remaining life expectancy rises substantially as individuals reach their 70s and 80s. This means that while the insurance value of people purchasing an annuity in their 60s may not be that high, as people get older the longevity insurance of an annuity becomes increasingly attractive. In addition, having annuities at older ages means that people avoid having to make complex decisions over their pensions and finances at advanced ages, when the risk of cognitive decline setting in will be elevated.
We think that hybrid retirement income solutions, which have been termed a ‘flex then fix’ model and discussed in various forms in the pensions industry,15 would be a good model for many. Under this model, people can flexibly draw down on their DC pension wealth earlier in retirement, but later in retirement annuitise at least some of it. This preserves flexibility in the early stages of retirement, when cognitive function is likely to be better and relative uncertainty over remaining lifespan lower. And it guarantees an income at older ages when cognitive ability may be declining, the appetite for active management of wealth lower and relative uncertainty about lifespan higher. In the public engagement work, people generally reacted positively to the idea of ‘flex then fix’; it was perceived to offer the best of both worlds, allowing more security but also allowing for money to be passed on.
‘The flexibility looks like a good idea. I would certainly give it a go. While an annuity gives security, being able to draw down funds when necessary and doing so knowing you still have security is great.’
Female, 35–44, homeowner
The recently published Pension Schemes Bill would require many pension schemes to introduce default retirement income solutions.16 It could be sensible for many providers to make such hybrid solutions the default for most customers – i.e. unless someone actively requests it, their pension is automatically ‘flexed’ and then ‘fixed’. And the exact product that individuals are defaulted into could vary across groups with different characteristics. But because there is substantial variation in individual circumstances around retirement, any such defaults should be ‘soft’ – i.e. easy to opt out of – and individuals should be made aware of that. Further annuitisation of pension wealth would be likely to be less appropriate for people who already have a significant stream of income guaranteed by a defined benefit pension, for example. It would be easier for people to appropriately move away from the default option if pension schemes were to provide a menu of sensible alternatives that people could choose from if they do not think the default option is right for them.
Alongside this, more needs to be done to help individuals make good decisions over how to use their accumulated pension wealth, in particular as the default retirement income solutions will not be appropriate for everyone. As shown in Figure 2.5, the majority of defined contribution pension pots are accessed for the first time without any financial advice or guidance. While take-up of advice is more common in advance of a first withdrawal from larger pots, it is still the case that one-in-three pension pots worth £100,000 or more are first accessed without any financial advice or guidance being received. There is a clear need to find and deliver ways to boost take-up of advice and guidance, and to find a ‘middle way’ between guidance and advice in which people received information that takes account of their own circumstances but does not commit them to purchasing expensive and detailed regulated financial advice. The FCA’s current proposal is to introduce ‘targeted support’, which would involve collecting information from a customer, and providing them with a suggestion based on what would be appropriate for those with similar needs and circumstances (Financial Conduct Authority, 2024; HM Treasury 2024). This would fall short of personalised financial advice and should therefore be easier and cheaper to provide. But, done well, it could be of benefit to many individuals. Participants in the public engagement groups felt that it was important for people to be educated to make decisions about managing their pensions funds.
‘If they’re going to get this pot of money that they have to manage for 20, 30 years, are they going be told and sort of shown how? There has to be some sort of education so that people aren’t left high and dry.’
Female, 55–64, private renter
Figure 2.5. Use of advice or guidance when first accessing pension, 2023–24
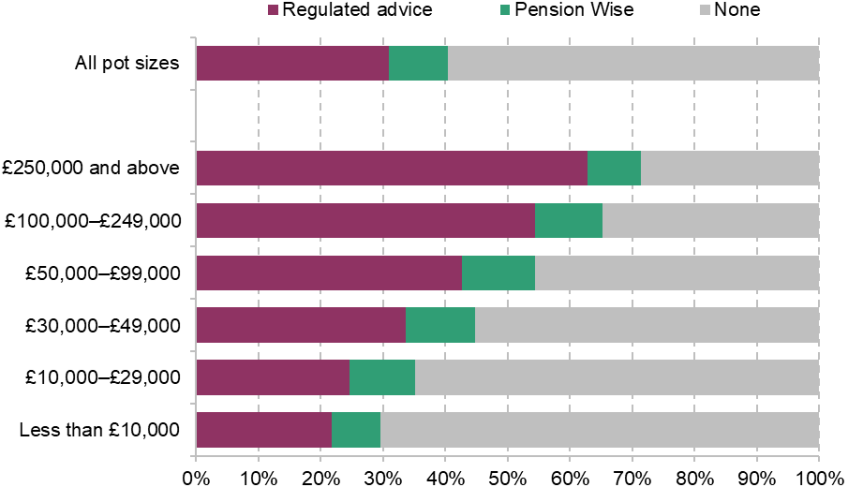
Note: Pension Wise is a government-run provider of free guidance relating to pensions. Appointments with Pension Wise explain the options for people withdrawing money from their defined contribution pensions.
Source: Authors’ calculations using Financial Conduct Authority data, 2023–24.
There are other changes that should be implemented in order to guide individuals towards better decisions over their defined contribution pensions in retirement, as discussed in Boileau, Cribb and Emmerson (2025b). One is around the earliest age at which funds from a tax-advantaged private pension can typically be drawn. This is currently 55 and is set to rise sharply to 57 in April 2028. Beyond this, rather than remaining fixed at 57, there is a strong case for it rising gradually over time so that it reaches age 60 by the time that the state pension age rises to age 68 in the mid 2040s. Even with this minimum access age reaching 60 in the mid 2040s, it would imply men being able to draw a pension for (on average) 26 years (and 29 years for women) based on current life tables. This is still a long period over which to draw down pension wealth. But at least raising this access age to 60 would help ensure that pensions are used to fund retirement rather than being an accessible pot of savings for people in late working life.
Another change relates to the framing of the 25% of an accumulated pension that can typically be withdrawn free of income tax. Invariably, this is described as the ‘tax-free lump sum’. While the funds can be withdrawn as a lump sum, it is also possible for 25% of every withdrawal to be taken free of income tax. It should therefore be referred to as something like ‘tax-free element’ or ‘tax-free component’ in order to avoid inadvertently steering an individual inappropriately towards making a larger initial lump-sum withdrawal than is desirable. While the benefits of these changes would likely be modest, they are also examples of relatively costless – and easily implementable – reforms.
Finally, there is the issue of individuals approaching retirement with several pension pots. It is often correctly highlighted that having lots of deferred small pension pots is uneconomic for pension providers, increasing charges and therefore lowering returns for savers. Another consequence is that having several – or potentially many – small pension pots, rather than one big pension pot, makes saving and drawdown decisions harder for individuals. While the forthcoming pensions dashboards should help, on their own they will not be sufficient to solve this problem.17 Furthermore, any defaults set by pension funds – or by the trustees of pension funds – will also typically only take into account the pension that the individual holds with them, and therefore are likely to be less well tailored than if they were able to see a more complete picture of their customer’s circumstances.
The status quo – whereby employees usually end up in a new pension every time they change employer – is not fit for purpose. In 2024, there were an astonishing 23 million defined contribution pension pots worth under £10,000 that were no longer being contributed to, with around half of these being worth under £1,000 (Department for Work and Pensions, 2025a). In a recent report (Cribb, Emmerson, O’Brien and Sturrock, 2025), we argued that small, deferred pensions should be automatically consolidated, with a limit initially set at £1,000 but that this should be raised over time. We set out two options for how to determine the pot into which small, deferred pots should be consolidated: either a ‘pot follows member’ approach where the individual’s most recent pension is used or a ‘default consolidator’ approach where one of a number of government-approved consolidator arrangements is used. It is welcome that the government has since announced a decision to go ahead with the consolidation of small, deferred pots, starting with a limit of £1,000 with the intention to increase that threshold over time (Department for Work and Pensions, 2025a).
Polling results also show public support for automatic pension pot consolidation. Results from a poll run by Opinium18 show that just under half (46%) support some sort of automatic consolidation, with 30% supporting the consolidation of all pots and 16% supporting automatic consolidation for small pension pots. One-in-four (25%) say individuals should be in charge of consolidation, with the remaining 29% responding either ‘Don’t know’ or ‘None of these’.
The government has elected to go for the ‘default consolidator’ model (Department for Work and Pensions, 2025a). This may avoid concerns about large amounts of funds moving around the private pensions system as employees move employer. But it will limit the extent to which the £1,000 should (or realistically can) be raised: too high could risk creating anti-competitive effects as increasingly large fractions of the market would be taken up by the default consolidators. A consequence of this is that while many small, deferred pots will be consolidated, many individuals will continue to approach retirement with multiple pensions. The government might want to consider whether the £1,000 limit – or whatever it is eventually increased to – for moving small, deferred pensions into a selected default consolidator should be set at a higher level for those within (say) five years of the state pension age (or above it). Clearer guidance should also be provided by the government to individuals looking to consolidate their own pension pots. The fact that many are still likely to approach state pension age with multiple pension pots also increases the importance of having pensions dashboards up and running and being well used by those who need them, and more generally increases the importance of individuals being provided with high-quality information to aid their decisions on how to draw on their private pensions.
3. Impact of proposed reforms to automatic enrolment on employees and employers
Our proposed reforms to automatic enrolment into private pensions are designed to improve the prospects for future retirement incomes, while mitigating falls in take-home pay for those who can least afford them. In this chapter, we show the modelled effects of these proposals on the distributions of both future retirement incomes and current take-home pay. In addition, we show how the effects of the reforms differ by age, sex and ethnicity, and highlight which employers might be most affected by the increase in employer contributions that we suggest.
It should be emphasised that the exact numbers produced by our modelling are subject to uncertainty and depend on many assumptions. For example, the results we present here come from modelling people at the individual level, ignoring that many people in couples will share income in retirement, and we do not include the impact of non-pension wealth, inheritances or housing costs. In addition, as pointed out in O’Brien, Sturrock and Cribb (2024), assumptions about the rate of return on pension saving and the rate of earnings growth can have a notable impact on the exact share of people with an ‘adequate’ retirement income. However, it is the case that others who have conducted similar empirical exercises – such as the Department for Work and Pensions (2023b) and the Pensions Policy Institute (Pike, 2022) – come to qualitatively similar conclusions around the share of working-age individuals on course for an inadequate retirement income.
3.1 Impact on private sector employees
Impact of automatic enrolment proposals across the income distribution
Figure 3.1 shows how our proposed reform to automatic enrolment would affect the distribution of future retirement incomes, focusing on private sector employees who are currently saving in a defined contribution pension. We also compare the estimated effects with those of two other, commonly suggested, changes to automatic enrolment. The first is to reduce the lower limit of qualifying earnings to zero, so that the 8% total default minimum contribution rate applies ‘from the first pound’, while the second is to combine a zero lower limit to qualifying earnings with a higher 12% default minimum total contribution rate and an increase in the default minimum employer contribution rate to 6%.
Figure 3.1. Modelled percentage change in projected retirement incomes from different automatic enrolment policies, for each quintile of the retirement income distribution
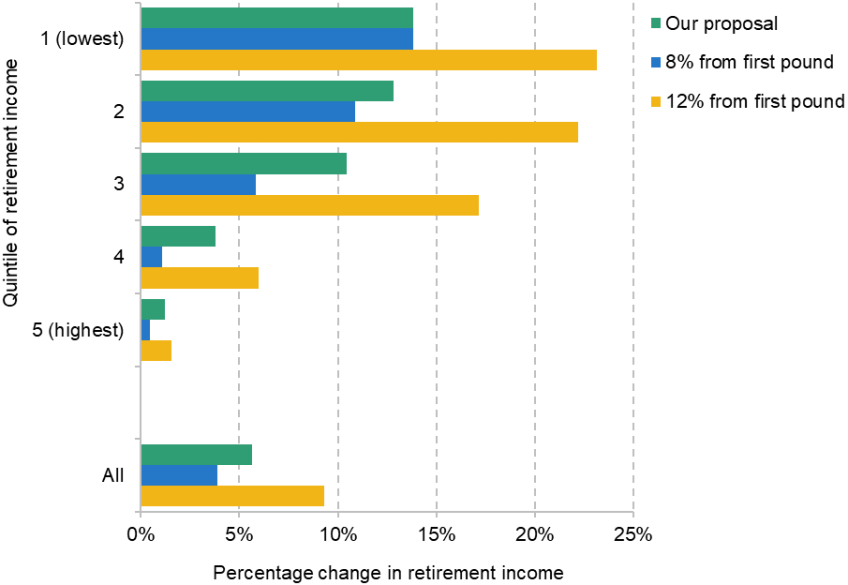
Note: The sample contains 25- to 59-year-old private sector employees saving into a defined contribution pension in Round 7 of the Wealth and Assets Survey. We simulate their projected future retirement income under their current saving rate, and under different automatic enrolment reforms, modelling everyone at the individual level and without accounting for future housing costs or receipt of inheritances. The graph then shows, for each reform, the percentage increase in average retirement incomes for each quintile of the retirement income distribution. Incomes are modelled at the individual level.
Our suggested reform leads to a 6% increase in future retirement income overall. This is larger than the 4% increase in retirement incomes from an 8% contribution rate from the first pound, but significantly smaller than the 9% increase from a 12% contribution rate from the first pound. Despite these differences in the magnitudes of the effects, the distributional effects of the reforms are fairly similar, with larger increases in retirement incomes in the bottom half of the distribution, which then gradually dissipate in the top half of the distribution. One reason for this pattern, despite increases in minimum contributions that are significant for higher earners, is that many higher earners already make, or receive from their employers, pension contributions that are much higher than automatic enrolment minimums, as shown in Figure C.4 in Appendix C.
Although the three reforms have similar distributional effects on future retirement incomes, they have starkly different impacts on take-home pay, as shown in Figure 3.2. Moving to either an 8% or 12% contribution rate from the first pound leads to significantly larger falls in take-home pay for the bottom half of the distribution, with the largest fall for employees in the lowest fifth of the take-home pay distribution. The falls in take-home pay would be fairly substantial, at over 4%, in the bottom half of the distribution for the move to a 12% contribution rate from the first pound, assuming that employers offset higher employer pension contributions one-for-one with lower pay.
Figure 3.2. Modelled percentage change in take-home pay from different automatic enrolment policies, for each quintile of the take-home pay distribution, with and without the possible impact of changing employer contributions
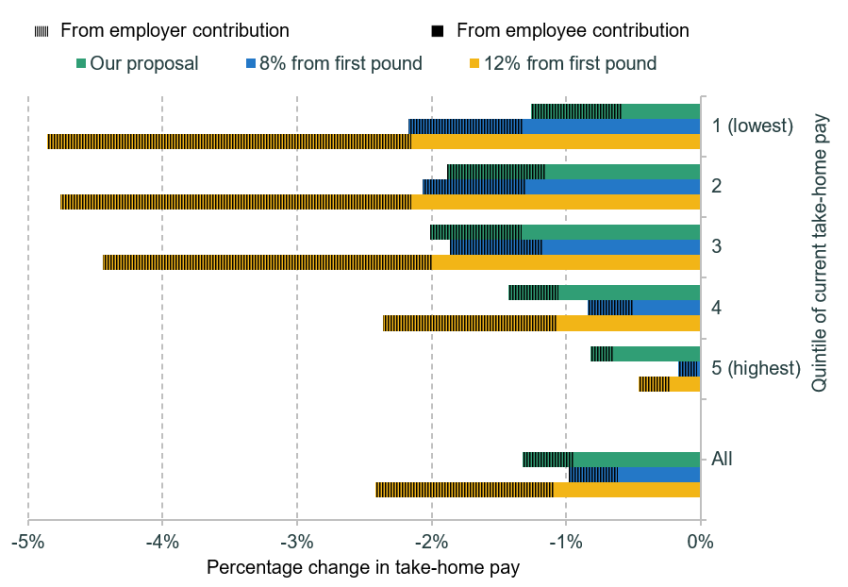
Note: The sample contains 25- to 59-year-old private sector employees saving into a defined contribution pension in Round 7 of the Wealth and Assets Survey. We calculate the average percentage fall in take-home pay (relative to today) for each quintile of the take-home pay distribution under three different automatic enrolment policies. We separate out falls from higher employee contributions and falls from higher employer contributions for the scenario where employers reduce wages one-for-one.
In contrast, our proposed set of reforms leads to smaller falls in take-home pay for lower-paid employees. The bottom fifth of the take-home pay distribution would experience one of the lowest falls in take-home pay under our reform, in direct contrast to the other two reforms, under which this group experiences the largest fall in take-home pay. Employees in the middle of the take-home pay distribution would experience the largest fall in take-home pay in our reform.
Figures 3.1 and 3.2 demonstrate the benefits of our suggested reforms compared with other commonly suggested changes to automatic enrolment: they encourage more saving at those points of life when employees are best placed to afford it. However, they still lead to a significant increase in retirement incomes at the bottom of the distribution because people move up (and down) the earnings distribution over their working life, as incorporated in our model.
Figure 3.3 shows the combined effect on future retirement incomes of our proposed changes to automatic enrolment alongside different potential (higher) levels of the new state pension.19 Clearly, a higher state pension leads to a larger percentage increase in retirement income for those with lower levels of retirement income to start with, as any increase to the value of the state pension is an equal increase in cash terms for everyone. The combined effect therefore also has larger increases in future retirement income at the bottom of the distribution. Turning to the magnitudes, we estimate that our suggested reforms to automatic enrolment lead to a larger increase in future retirement incomes than increasing the state pension to 33% of average earnings for the bottom 60% of the income distribution. This highlights that our automatic enrolment proposals can have a substantial impact on future retirement incomes, particularly for people at the bottom of the retirement income distribution. We can also calculate the effect of a higher state pension on the proportion of people reaching the Pensions and Lifetime Savings Association (PLSA) minimum retirement living standard in retirement.20 We find that increasing the value of the state pension by 1% of average earnings increases by around 2 percentage points the share of retirees reaching the PLSA minimum retirement living standard.
Figure 3.3. Modelled percentage change in projected retirement incomes from our suggested automatic enrolment policy and different levels of the state pension, for each quintile of the retirement income distribution
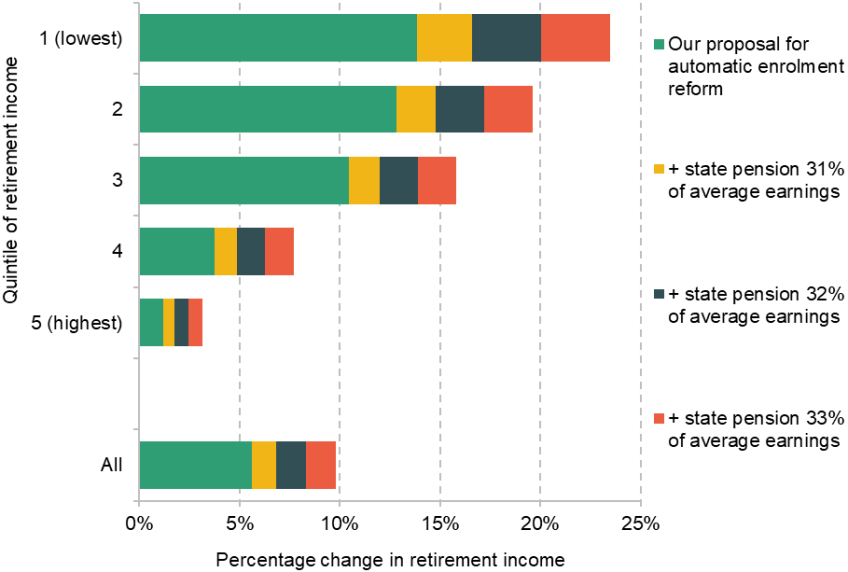
Note: The sample contains 25- to 59-year-old private sector employees saving into a defined contribution pension in Round 7 of the Wealth and Assets Survey. We simulate their projected future retirement income under their current saving rate, and under different state pension scenarios with our suggested automatic enrolment policy, modelling everyone at the individual level and without accounting for future housing costs or inheritances. The graph then shows, for each scenario, the percentage increase in average retirement incomes for each quintile of the retirement income distribution. Incomes are modelled at the individual level.
Figure C.7 shows how our automatic enrolment proposals affect the share of private sector employees currently saving in a defined contribution pension with an ‘inadequate’ retirement income by earnings. The proposals lead to the largest reduction in the share missing their target replacement rates for middle earners,21 with the smallest reduction for higher earners. This is consistent with table 4.2 of O’Brien, Sturrock and Cribb (2024), which showed that higher earners who were projected to miss their target replacement rates were typically further from reaching them than those on lower earnings who were projected to fall short. Our proposals would lead to the largest decreases in the share missing the PLSA minimum retirement living standard among lower earners, because very few higher earners are on track to miss this standard to start with.
Illustrating the effects of our proposals through example case studies
To help illustrate how our proposed reforms to automatic enrolment would impact different types of employees, we consider the effects for three example ‘case studies’:
- Mohammed, a lifetime average full-time earner: earns median full-time male earnings at each age 18–64 and leaves paid work at 65. Mohammed always remains in a workplace pension.
- Jane, a lifetime average earner with 15 years working part-time due to childcare commitments: earns median full-time female earnings at each age 18–29, then earns median part-time female earnings at each age 30–44, then earns median full-time female earnings again at each age 45–64 and leaves paid work at 65. Jane always remains in a workplace pension.
- Olivia, a lifetime low earner: earns 20th percentile of earnings at each age 18–59 and leaves paid work at 60. Olivia opts out of a workplace pension between ages 22 and 27, 30 and 36, and 46 and 49.
We assume that, when enrolled, these three employees save at the default minimum under both the current automatic enrolment system and our proposed reforms. Figure B.1 in Appendix B shows the earnings of the three example individuals over the life cycle, while Figure B.2 shows minimum pension contributions under the current automatic enrolment system and under our proposals. The effects of our proposals are summarised in Figure 3.4.22
Figure 3.4. Effect of proposed changes to private pension saving (under minimum contributions) on three example individuals
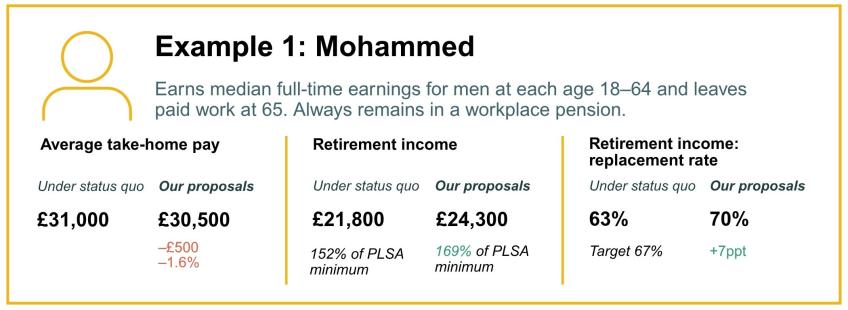
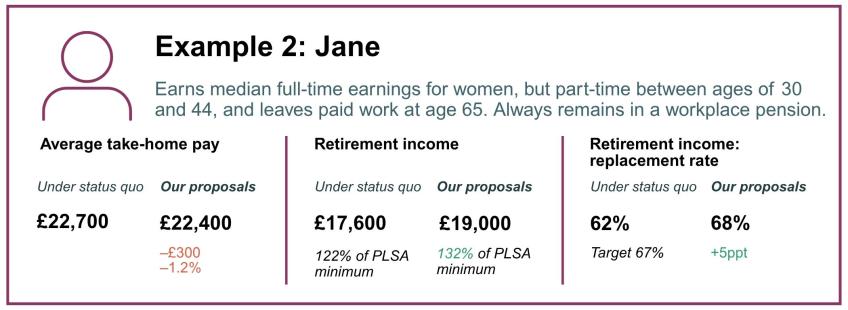
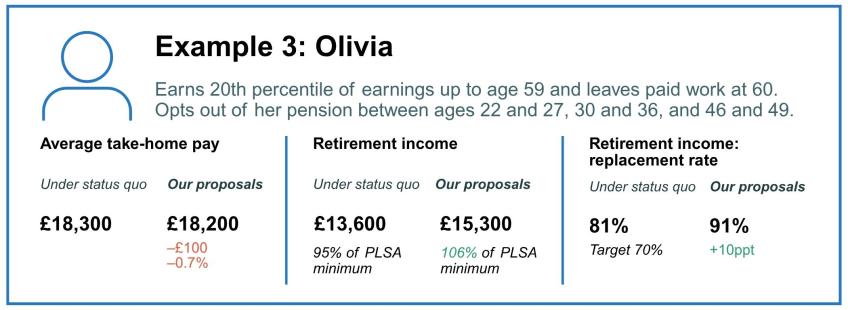
Note: For more detail, see Appendix B.
Under the current automatic enrolment system, both Mohammed and Jane would, through having long working lives, achieve the PLSA minimum retirement living standard. But they would both still miss their target replacement rate (of 67%). Under our proposals, they would reach their target replacement rates as their employee contributions would be raised in years when they were earning relatively more. Olivia would meet her target replacement rate under the current system, despite opting out of her pension in many years. This is because, as we have outlined, the state pension on its own replaces a high share of lower earners’ pre-retirement incomes on its own. However, she is on track to miss the PLSA minimum retirement living standard under the status quo. Our proposals would change this, so that her retirement income is actually around 6% higher than this standard.
The flip side of this increase in retirement incomes is that all three of our example case studies would have lower take-home pay during working life under our proposals. The decrease in take-home pay is largest for Mohammed, worth £500 on average in each year or 1.6% of his average take-home pay, and smallest for Olivia, where it is only £100 or 0.7% of her average take-home pay. This is one illustration of the benefit of our reforms – that falls in take-home pay are concentrated among those who can most afford them. This is also true for each of our three individuals: their take-home pay falls the most in the years when their income is highest – for example, for Mohammed and Jane this is during their late 40s and 50s – as shown in Figure B.3.
How do the effects of the reforms differ for different groups?
Different age groups
As shown in Figure 3.5, the share of private sector employees saving in a defined contribution (DC) scheme who are projected to fall short of an ‘adequate’ retirement income on current trends is reasonably similar across the three age groups we look at. However, our proposed reforms lead to a larger decrease in the share of 25- to 34-year-olds missing adequacy than among older age groups, particularly when comparing with target replacement rates. There are two key reasons for this.
Figure 3.5. Effect of our automatic enrolment proposals on the percentage of people projected to have inadequate retirement income, by age group
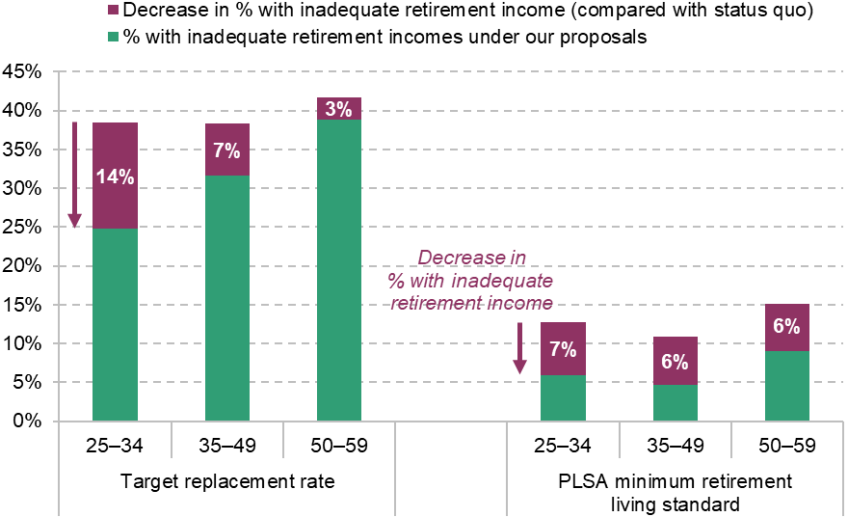
Note: The sample contains 25- to 59-year-old private sector employees saving into a DC pension in Round 7 of the Wealth and Assets Survey. We simulate their projected future retirement income under their current saving rate, and under our automatic enrolment proposals, modelling everyone at the individual level and without accounting for future housing costs or inheritances.
First, there is substantially more dispersion in levels of pension wealth among the 50- to 59-year-old age group than among the younger age groups (O’Brien, Sturrock and Cribb, 2024). Over one-in-five of the 50–59 group have no more than £10,000 of private pension wealth saved. This is likely because some people in their 50s will have missed out on many years of pension saving as pension participation fell in the 2000s. On the other hand, one-in-four of this age group have at least £250,000 of pension wealth, indicating that others might have accrued a large defined benefit pension, either from a spell working in the public sector, or from a private sector employer earlier in their career when these typically generous schemes were more prevalent. As a result, while on average the rates missing adequacy are similar across age groups, for the older age group there are more people with particularly high/low retirement incomes than around a ‘typical’ level. In other words, people aged 50–59 who are not projected to reach an adequate retirement income are generally further away from the adequacy target than younger people who are not projected to reach an adequate retirement income.
Second, and perhaps more importantly, younger employees have more years of working life in which to make up for any previous undersaving than older employees, who are closer to retirement. Our proposed reforms therefore have more time to take effect for these younger employees. This highlights why these reforms are urgent – we do not want to end up in a situation where the next generation reaches their 50s with similar shortfalls to today’s older employees.
However, even under our reforms, 6% of current 25- to 34-year-olds currently saving in a DC pension are projected to fall short of the PLSA minimum retirement living standard. Among these people projected to fall short, 92% leave paid work before state pension age (compared with only 13% of this group as a whole), and 73% spend at least ten years outside of paid work overall (compared with only 10% of this group as a whole). Clearly, our reforms do not lead to any extra saving in years when people are not in paid work, which is one reason why this small minority do not reach the PLSA minimum standard.23 However, they would be more likely to benefit from the additional targeted means-tested support through universal credit that we proposed; more generally, policies that are able to help people stay in work for longer can boost both working-age and retirement incomes.
Quotes from public engagement work show that some people regret not having saved more when they were younger, and believe this is due to not having enough awareness around pensions at the time. Our proposed changes to default rates can help young people who would otherwise not engage with the pension system start saving earlier in life.
‘I feel like it is necessary to make wise investments now to prepare for the future. I wish I’d had more awareness 20 years ago. I feel like my pension won’t be enough to live on and will just cover some basic bills. I think we are not financially educated or taught to be financially aware.’
Female, aged 35–44, homeowner
Differences by sex
On current trends, our modelling suggests that fairly similar shares of men and of women are on track to fall short of their target replacement rate, among private sector employees saving in a DC pension (Figure 3.6). On the other hand, men are more likely to reach the PLSA minimum retirement living standard because they have higher earnings on average, and higher earners find it easier to reach a fixed level of retirement income.
Figure 3.6. Effect of our automatic enrolment proposals on the percentage of men and women projected to have inadequate retirement income
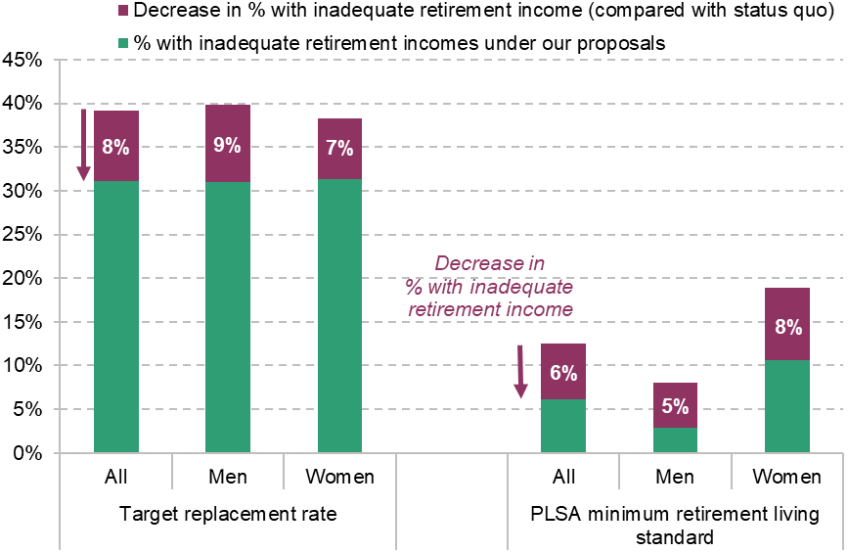
Note: The sample contains 25- to 59-year-old private sector employees saving into a DC pension in Round 7 of the Wealth and Assets Survey. We simulate their projected future retirement income under their current saving rate, and under our automatic enrolment proposals, modelling everyone at the individual level and without accounting for future housing costs or inheritances.
Our proposed reforms lead to fairly similar decreases in the shares of men and of women falling short of an adequate retirement income. The decrease is slightly larger for men than for women when considering target replacement rates; however, the overall share projected to reach their target replacement rate is almost identical for men and for women under our proposed reforms. Our proposals lead to a slightly larger fall in the share of women missing the PLSA minimum retirement living standard than for men. Expressed differently, we estimate that our reforms would lead to a 6% increase in future retirement incomes for men on average, compared with 5% for women, only including private sector employees currently saving in a DC pension.
Differences by ethnicity
Statistics from the Office for National Statistics (2020) highlight that there are large differences in the average amount of private pension wealth between ethnic groups in the UK. One of the reasons behind these differences will be differences in average earnings between ethnic groups, with employees of Bangladeshi, Pakistani and Black African ethnic origin having significantly lower levels of earnings than White British employees on average (Office for National Statistics, 2023). As shown in Figure 3.1, our proposed reforms lead to a larger percentage increase in retirement incomes for lower earners than for higher earners, while mitigating falls in their take-home pay. While we cannot model the impacts of our reforms by ethnicity directly, this pattern does suggest our reforms would lead to a higher-than-average increase in future retirement incomes for private sector employees of Bangladeshi, Pakistani and Black African ethnic origin.
In addition, recent research at IFS has highlighted that employees of Pakistani and Bangladeshi ethnic origin are more likely to opt out of their workplace pension, even controlling for differences in age, earnings and the types of employers worked for between ethnicities (Cribb, O’Brien and Sturrock, 2025). The introduction of a minimum non-contingent employer contribution would therefore disproportionately benefit employees from these ethnic backgrounds.
3.2 Impact on employers
Which employers are most affected by our automatic enrolment recommendation on employer contributions?
Our recommended reform to the minimum employer pension contribution under automatic enrolment would increase employer costs for two reasons. First, our proposal would increase the number of employees receiving an employer pension contribution, as all employees earning at least £4,000 would have to receive a contribution, even if they opt out of making an employee contribution. Second, our proposal would entail a higher minimum employer pension contribution than under existing minimums, as the minimum contribution would (for those earning at least £4,000 a year) be calculated from the first pound of earnings, rather than above the lower limit for qualifying earnings (£6,240) as currently.
Figure 3.7 shows which private sector employers would be most affected by the increase in costs from our reforms, based on calculations from the Annual Survey of Hours and Earnings, accounting for the fact that some employers already contribute more than 3% of earnings. The graph shows that, overall, the increase in employer pension contributions due to our reform is equal to about 0.5% of current total remuneration (i.e. pay plus employer pension contributions). This is relatively modest. There is some variation in this cost for different types of employers. In particular, employers in accommodation & food services and employers with fewer than 25 employees face larger increases in labour costs, worth over 1.0% of total remuneration. That is because these types of employers tend to offer lower employer pension contributions currently and have a higher share of employees not currently saving in a pension. However, as is outlined in the next chapter, if the reforms are announced several years in advance of their implementation, employers could respond by increasing wages more slowly than they would have otherwise done. In this case, in the extreme, employers’ labour costs would not increase at all.
Figure 3.7. Percentage increase in total remuneration due to suggested reform to default minimum employer pension contributions under automatic enrolment, by employer type
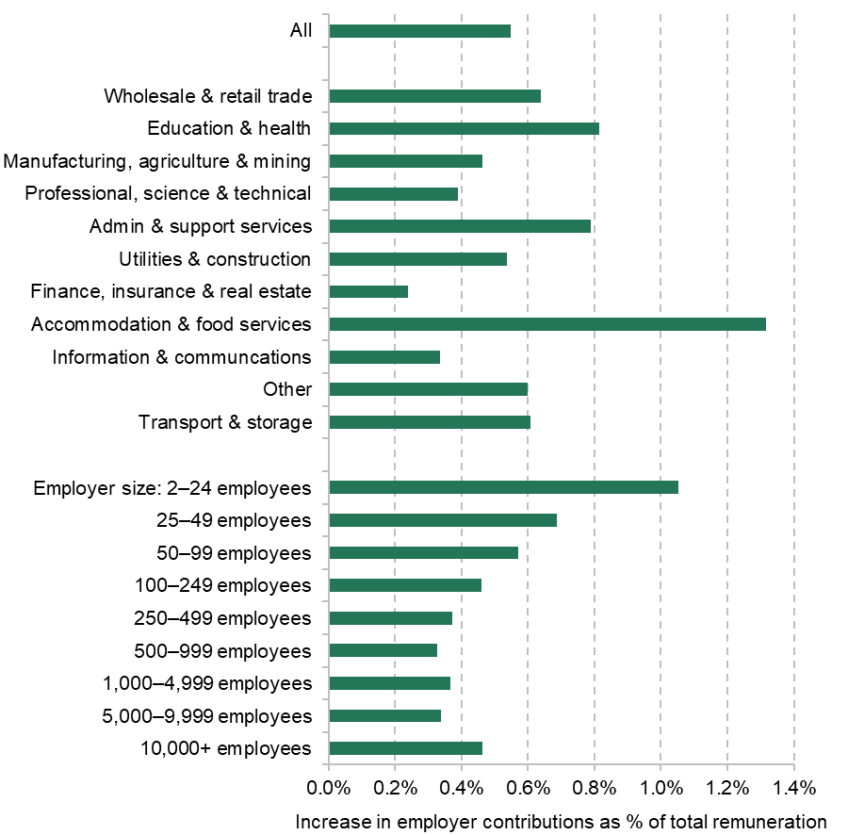
Note: Industries are sorted by number of workers.
Source: Authors’ calculations using the Annual Survey of Hours and Earnings.
4. Implementing the reforms
Our recommendations for reform would ensure the state pension provides a more reliable and resilient foundation for private saving, would improve the prospects for future retirement incomes by increasing private pension savings while mitigating falls in take-home pay for those on low pay, and would simplify decision-making for individuals in financially preparing for retirement. However, there are a number of real-world constraints that complicate the implementation of all of our proposed reforms. In this chapter, we discuss a phased timeline for implementation, and the public finance implications of the proposals.
4.1 Indicative timeline for implementation
While timely action is needed to ensure that future generations of retirees benefit from our proposed policy reforms, immediately implementing all our proposed reforms would be unwise and difficult.
First, the fiscal situation facing the government remains challenging and, as outlined in the next section, as a package our proposed reforms would entail modestly lower tax revenues and higher spending for the government.
The Labour manifesto promised to keep the state pension triple lock in place for the duration of the current parliament, which may mean it is unlikely the government would change from this policy in the short run. However, what the government could do during this parliament is set a target level for the state pension as a share of average earnings, committing to move to a smoothed earnings link once that target is met.
Our proposal for a higher default minimum employer pension contribution for almost all employees, regardless of whether they contribute themselves, would increase costs for employers by around £5.0 billion, as shown in Table 4.1 later. While this is only 0.5% of total remuneration, the government may well not want to implement this immediately, especially given the recent rises in employer costs from the increases in employer National Insurance contributions (NICs) and the minimum wage that have come into effect in April 2025.
Instead of an immediate implementation, we suggest that many of our proposals could be phased in over time. Indeed, there may be significant benefits from a phased approach, allowing employers and the public finances more time to adjust to the reforms. However, this phasing should start soon. As we have stressed throughout this report, there are serious costs to continued inaction, and the sooner our proposed reforms are implemented, the more people can benefit from them.
Phased implementation of private pension reforms
The original implementation of automatic enrolment was announced several years beforehand, and was phased in gradually, though any more marginal proposed changes in the automatic enrolment system would not need to be as gradual as the initial introduction.
We therefore recommend that our proposed changes to automatic enrolment should be consulted on as soon as possible, allowing details around the implementation to be worked through and an announcement to follow swiftly after. However, the reforms should be announced to take effect a while after the announcement. Ideally, changes to default contribution rates should happen in April, when many people might otherwise receive a boost in take-home pay in cash terms due to a higher minimum wage or an increase in direct tax thresholds due to indexation.
Announcing our proposed changes to the minimum employer contribution several years ahead of the actual implementation would allow employers to adjust to the higher pension costs ahead of the change – for example, by increasing wages more slowly than they would otherwise have done. This would reduce the impact of the higher employer costs on employment, which is especially important given the recent increases in employer NICs and the minimum wage. If this reform were announced in 2025–26 for implementation in 2029–30, and if employers passed the entire cost onto employees’ wages, then we estimate that average nominal earnings would increase by 8.7% between these years, compared with 9.3% under current OBR forecasts.
As well as the direct costs of higher employer contributions, there will likely be some extra administrative costs for employers associated with complying with our proposals – for example, due to the additional trigger for minimum employer contributions at £4,000 – though costs that are likely to be much lower than those involved in the initial introduction of automatic enrolment. The government could help with reducing these costs to some extent – for example, by providing an online calculator on minimum employer and minimum default total contributions based on earnings. In addition, the reforms could be rolled out to affect large employers first. Starting with larger employers would allow those firms, which tend to have larger human resources and finance functions and thus more dedicated administrative resources, to test this new offer in practice first. If it turns out that our reforms are costlier than anticipated from a compliance perspective, there are options to ease the burden on employers of our proposals, such as linking the trigger for minimum employer contributions to the secondary threshold for National Insurance (when employer NICs are first liable to be paid, which is currently set at the equivalent of £5,000 a year). In addition, rolling out the reforms to larger employers first could provide valuable insights on the extent to which more employees opt out of making an employee contribution in response to non-contingent employer contributions.
There is also a strong case that the age range for automatic enrolment eligibility should be widened only gradually, given that the costs of hiring younger employees have risen especially quickly recently with the larger increases in the minimum wage for younger people in April 2025 (Ray-Chaudhuri and Xu, 2025).
In some ways, there are fewer barriers to immediate implementation for our proposals to help people manage their pensions in retirement, as they do not impose significant additional costs on employers or the government. These proposals should therefore be announced as soon as possible, especially as getting the design and implementation right will take some time. Every year that passes without reform means another set of retirees reaching the point where they start to make decisions on how to use their pension wealth without appropriate structures in place to help with these complex and consequential decisions. Without this help, some will make decisions they end up regretting, with long-term consequences for the rest of their retirement. Help from both the government and industry needs to come as soon as possible to mitigate these risks, in the form of sensible defaults coupled with more access to accessible, high-quality and low-cost financial advice and guidance. In this context, it is encouraging to see the recently published Pension Schemes Bill take forward policies to automatically consolidate small deferred pension pots and require pension schemes to provide default retirement income products.
Phased implementation of reforms to the state pension and means-tested benefit system
Turning to the state pension, there are clearly political reasons that make it hard to move away from triple lock indexation in the short term, not least the current government’s manifesto commitment. If the government set a target level of the state pension, as a share of earnings, at a higher level than the current one (which is likely to be the case given the current cross-party consensus to keep the triple lock), then one option for implementation would be to announce the target level and to then continue using triple lock indexation until this target level is reached.
Table 2.1 earlier showed how long it might take, under current forecasts, for the state pension to reach different levels as a share of earnings under the triple lock. Under the central case, the state pension would reach 31% of average earnings in 2030, 32% of earnings in 2037 and 33% of earnings only by 2043. However, it should be emphasised that there is considerable uncertainty about these timings: under a reasonable range of outcomes (25th and 75th percentiles of simulated outcomes), the triple lock could lead to a state pension worth 33% of average earnings by as early as 2037 or as late as in the mid 2050s. An alternative, more predictable, way to increase the state pension to the target level would be to provide a more explicit legislated pathway – for example, increasing the state pension at the growth rate of average earnings + 0.5 percentage points in years where this exceeds inflation.
Our proposals for the working-age means-tested benefit system entail increased spending on those receiving means-tested benefits aged a year below the state pension age. This additional support could also be phased in, most obviously together with future increases to the state pension age. Introducing additional support for those one year below the state pension age at the same time as the state pension age increases would mean that these costs are only incurred in periods when there are public finance savings arising from the higher state pension age. At the same time, these policies would add protections to those most vulnerable to the higher state pension age, which could help build public support for them as well.
4.2 Public finance implications of proposed reforms
In this section, we set out the public finance implications of our proposed reforms. Throughout, the costings are indicative not least as they do not consider any changes to individual behaviour that may happen due to the reforms. For example, we assume that our proposed changes to automatic enrolment policies for employees have no effect on opt-out rates, and that targeted enhancements to the working-age means-tested benefit system have no effect on people’s decisions to work or to claim benefits. Were some employees to respond to their employers’ pension contributions no longer being contingent on them making contributions themselves by opting out of making any individual pension contribution, then this would reduce the cost of the additional tax relief arising from our reforms. In contrast, were the targeted enhancements to means-tested support to lead to some responding by working less, then this would add to the fiscal costs.
Additional tax relief from increased private pension saving
Our proposed reforms to automatic enrolment would boost private pension saving and, since pension saving is relatively tax-favoured, therefore reduce income tax and NICs revenues. The overall boost in saving is estimated to be around £11 billion per year, split roughly equally between increased employer and employee contributions (£5 billion and £6 billion, respectively, as shown in Table 4.1). These additional employee contributions would be exempt from up-front income tax, and the increase in employer contributions would – to the extent to which wages grow less quickly as a result – reduce receipts of income tax and also employer and employee NICs.
Table 4.1. Modelled effect of three automatic enrolment policies on aggregate employer and employee pension contributions, and up-front and long-run tax relief
Policy reform | Extra employer contributions (£bn) | Extra employee contributions (£bn) | Extra | Extra |
Our proposals | 5.0 | 6.0 | 3.7 | 2.1 |
Of which: |
|
|
|
|
From current non-savers | 3.5 |
| 1.4 | 0.8 |
From current DC savers | 1.4 | 6.0 | 2.3 | 1.2 |
Memo: |
|
|
|
|
8% from first pound | 1.4 | 3.8 | 1.4 | 0.6 |
12% from first pound | 9.9 | 8.9 | 6.4 | 3.6 |
Note: This table shows the effect of three automatic enrolment policies on aggregate employer pension contributions, employee contributions, and up-front and long-run tax relief (both income tax and National Insurance contributions). The sample is all private sector employees aged between 16 and 74 in the Annual Survey of Hours and Earnings in 2021. We uprate earnings to 2025 prices. To calculate the up-front and long-run tax relief, we assume that employer pension contributions are fully incident on wages and that additional employee contributions are not made via salary sacrifice.
We estimate that, under the assumption that wage growth is depressed to offset fully the cost of the increase in employer contributions, our reform would reduce revenues by £3.7 billion per year in the near term.24 Were wages to fall by less than the boost to employer contributions, then the reduction in tax revenues would be smaller. In addition, over the longer term, the additional private pension saving would lead to greater income tax revenues from the resultingly higher pension withdrawals. We estimate that this would reduce the cost of the additional tax relief to £2.1 billion a year. Of this, £0.8 billion would be the result of 5 million employees being brought into pension saving, while £1.2 billion would be the result of additional pension saving among 9 million existing members of workplace pensions (with the remaining 7 million existing workplace pension members unaffected).
This would be a small – but not negligible – reduction in tax revenues. We estimate it would be bigger (in terms of the change in tax revenue) than a policy of moving to an 8% total minimum contribution rate applying from the first pound. This is because our suggested reform would lead to a bigger boost in private pension saving (£11 billion rather than £5 billion a year) and one that is more targeted at increased employer rather than employee contributions (and employer contributions are particularly tax-favoured). However, it would lead to a much smaller increase in tax relief than a policy of moving to a 12% contribution rate (applying from the first pound). This is because that alternative reform would boost private pension saving by about 70% more than the one we suggest (£19 billion rather than £11 billion a year), thereby leading to the public finance costs in both the near term and the longer term also being about 70% bigger. Of the £3.7 billion additional up-front tax relief from our proposed reform, around 60% would benefit people currently earning less than the higher-rate tax threshold (£50,270 a year).
Our proposals to make it much easier for the self-employed to save in a pension would also lead to a reduction in tax revenues. The magnitude of this reduction would depend on how much extra pension saving our reforms induced, and the marginal tax rates of those doing the extra saving. As an indicative example of the implications for tax revenues, if we assume that half of self-employed workers who are not currently saving in a pension were to start saving at 8% of qualifying earnings, and all current savers saved at least this amount too, this would lead to a £3.2 billion increase in pension contributions as well as a £0.8 billion reduction in up-front tax revenues, falling to a £0.4 billion fall in the long run. These are only ballpark figures, rather than anything like exact costings, but they highlight that the public finance cost of induced pension saving among the self-employed is several times smaller than the cost of our automatic enrolment proposals – because there are many fewer self-employed workers than employees, because self-employed workers on average tend to have lower incomes than employees and because, by definition, self-employed workers cannot make employer pension contributions, which are especially tax-advantaged.
Changes in public spending
The level of the state pension will be the most important determinant of the amount of public spending supporting retirement incomes. Currently, a full new state pension is worth £230.25 a week, which is equivalent to 30.2% of average (median full-time) earnings. Increasing the new state pension by 1% of earnings – a boost of around £7.60 per week – would cost about £4 billion in the current year and about £5 billion in 2050 (by when there will be more pensioners in receipt of a full new state pension). Under current policy, triple lock indexation can be expected to deliver an increase in the value of the new state pension relative to average earnings over time, albeit in an unpredictable way.
Under our central expectation, holding the new state pension at its current level relative to average earnings would reduce public spending, relative to retaining the triple lock, by around £21 billion in 2050 – as was shown in Table 2.1, although once again there is a great deal of uncertainty around this costing due to the unpredictable nature of the triple lock. Alternatively, it might be deemed desirable to use the triple lock to boost the new state pension relative to average earnings until it rose to its desired share. For example, a target of 33% of average earnings – implying a full new state pension of just over £250 per week in today’s terms – might be expected to be delivered by the triple lock in 2043. Meeting this target would, relative to average earnings indexation, add £15 billion to public spending in 2050. But moving off the triple lock once the new state pension had reached 33% of average earnings could, relative to retaining the triple lock, be expected to reduce public spending in 2050 by £5 billion.
The policies we put forward on universal credit and housing benefit are deliberately tightly targeted and therefore of less fiscal significance. Increased support through housing benefit for pensioners residing in private rented accommodation would add to the pensioner housing benefit bill. We estimate that using an additional bedroom to calculate the pensioner housing benefit rate – so that all single and couple pensioners are entitled to maximum housing benefit based on local rents for (at least) a two-bedroom property – would initially cost around £150 million per year. This cost would rise over time for two reasons: first, as the policy leads to some pensioners choosing to reside in more expensive properties (which would, in part, be the intent of the policy); and second, as the prevalence of private renting in retirement increases.
An enhancement to universal credit (UC) for those a year below the state pension age would, all else equal, also have the direct impact of increasing working-age benefit spending. The suggested boost to UC would cost £600 million a year if it applied to all receiving UC or £200 million if it was targeted solely at UC recipients who are also in receipt of disability benefits.25 Again, this is before any behavioural response; to the extent to which individuals reduced their incomes or made greater successful effort to claim disability benefits this would increase the costs further. Working in the other direction are the reforms to UC and disability benefits announced in the recent DWP Green Paper (Department for Work and Pensions, 2025b) which should – to some extent – reduce the cost of our suggested reforms.26
But all else might not be equal. A key rationale for boosting the working-age means-tested benefit system for those who are within one year of the state pension age is to provide a substantial mitigation of the impact of increasing the state pension age. A cost of £600 million a year is equivalent to just one-tenth of the estimated public finance saving from a one-year increase in the state pension age (and £200 million a year being equivalent to one-thirtieth). To the extent to which such mitigations make further rises in the state pension age more palatable – and therefore more likely to happen – they could even be seen as contributing towards a strengthening of the public finances. Indeed, a recent study of policy reforms by the International Monetary Fund (2025) – focusing on reforms to energy subsidies and public pension reforms – found that ‘increasing benefits for low-income retirees can also mitigate perceived unfairness’ and thereby boost support for reforms, citing the example of Australia ‘where pension ages increased alongside increases in benefits for vulnerable older households’.27
Options for funding the reforms
The discussion above suggests that it is unclear how much additional public spending, relative to current policy, would arise from our recommendations for the state pension and benefits. In particular, it depends on the extent to which the triple lock would deliver increases in the level of the state pension anyway (and therefore the extent to which the main UK political parties are implicitly committed to meeting these costs already). The fiscal cost of the suggested enhancements to means-tested support is relatively modest, due to them being tightly targeted, and their cost is dwarfed by the fiscal savings from delivering increases in the state pension age.
What is clearer is that significant increases in private pension saving would increase the cost of pension tax reliefs. We, and others, deem this an appropriate (and unavoidable) outcome of policies to encourage private pension saving to reduce the number of working-age individuals who would otherwise remain on course to see their retirement income fall below commonly applied benchmarks. In this context, the amounts involved should not be overstated. The long-run cost of our proposed reform to automatic enrolment for private sector employees is estimated to be around £2 billion a year. And even the short-run reduction in revenue is only £3.7 billion a year.
This is around one-third of the revenue that would be raised by a 1 percentage point increase in the main rate of VAT, or in the basic and higher rates of income tax, or (perhaps more likely) from extending the current freeze in National Insurance and income tax thresholds for two more years.28 And it is less than one-tenth of the headline £40 billion tax rise in Rachel Reeves’s Autumn 2024 Budget. More broadly, £3.7 billion is only around ¼% of what the government raises in revenue, or spends, in a given year. In other words, any revenue-raising or cost-cutting responses to the public finance implications of our proposals would be similar in magnitude to the Chancellor dealing with other typical changes to the fiscal outlook during fiscal events.
An alternative approach for funding pension reforms – which we would welcome – would be for the government to make improvements to the pensions tax system, and for these to be designed in such a way as to raise revenue. An earlier report by IFS authors (Adam, Delestre, Emmerson and Sturrock, 2023) – also supported by the abrdn Financial Fairness Trust – looked at the pensions tax system and set out a blueprint for reform. One of the recommended reforms – for unannuitised wealth held within defined contribution pensions at death to be included in the value of the estate for inheritance tax purposes – has already been adopted by the Chancellor.29 But other proposals, which could be implemented in a way that would raise revenue, were put forward. Two in particular stand out.
First, there could be a cap on the amount of pension from which a 25% tax-free element can be withdrawn. Jeremy Hunt’s March 2023 Budget – published in the month after the IFS report – implemented such a cap. But this was set at just over £1 million, meaning that wealthy individuals can still withdraw over £250,000 from a private pension without paying any income tax. The suggested limit in the report published by IFS was £400,000. This would still allow individuals to withdraw a six-figure sum free of income tax, but would raise an estimated £2 billion a year in revenue. The analysis suggested such a limit would affect only one-in-five retirees (although half of those with public sector pensions). Of the total stock of pension wealth, just over 40% of pension wealth would lose the benefit of the tax-free component. Geographically, those affected are disproportionately found in the South East of England (although not London), where the concentration of individuals with pension pots exceeding £400,000 is disproportionately high.
A reform of this type would likely need to be phased in – as individuals could legitimately point out that they had saved in a private pension in the expectation of being able to withdraw more tax-free – and an attempt to implement it might lead to it being subject to legal challenge. But, unreformed, the tax-free element remains badly targeted: providing additional taxpayer support to encourage even those with £900,000 already in their pension to save more, and providing a more generous rate of relief to those who are higher-rate taxpayers in retirement than the majority who pay basic-rate tax in retirement.
The second proposal we consider from Adam, Delestre, Emmerson and Sturrock (2023) relates to the fact that employer pension contributions escape National Insurance contributions entirely: no employee or employer National Insurance is paid either on pension contributions when they are made or on pension income when it is drawn. This is an expensive, opaque and badly targeted subsidy on pension saving, and one that becomes more generous whenever rates of National Insurance are increased (such as in April 2025). One option – which would be a step in the right direction – would be to make all employer pension contributions subject to employer NICs, alongside the introduction of a new subsidy on all employer pension contributions. Setting this subsidy at 10% would raise an estimated £4.5 billion a year (because 10% is lower than the 15% standard rate of employer NICs). And such a subsidy could apply to all employer pension contributions, rather than not applying in cases where employer NICs do not apply (Adam, Delestre, Emmerson, Miller and Sturrock, 2024).
Of course, the government might not be keen to impose additional costs on employers, especially following the April 2025 increases in employer NICs. The change would have the biggest impact on big employers – and employers of high earners – as they are more likely to offer particularly generous pension contributions. Public sector employers would be particularly affected, as they tend to make relatively high employer pension contributions. If those public sector employers required additional government funding to cover these increased costs, this would of course reduce the revenue this measure would raise. To help, the change could be announced some time in advance of implementation – and could be phased in over a few years if needed – in order to ease the transition to a new system.
5. Conclusion
Our proposals would build on the many successes of the current pension system, and address some of the key weaknesses, leading to a significantly improved system that would help millions of people enjoy a better retirement in the future. These are achievable reforms for any government to introduce and implement within a decade. And, based on the extensive engagement with a wide range of relevant stakeholders that was undertaken for us by Ignition House as part of our Pensions Review, we are not alone in these opinions.
Nevertheless, even if there is general agreement that these reforms would be beneficial, the timing of them may never seem quite right. The government undoubtedly has other commitments and priorities that could push pension reforms down the to-do list. It is all too easy to see why measures that will reduce take-home pay, that may increase costs on employers and that will increase the cost of up-front tax relief on pension contributions are ones that governments might look to defer. Given that the current generation of pensioners has considerably higher average incomes than previous generations, and the policy success of automatic enrolment, there is a risk of complacency when it comes to the UK pension system, with tough policy decisions continually being postponed.
However, complacency and inaction would have huge costs. Delays in implementing these reforms would mean more of today’s workers reaching retirement with an inadequate pension – or that the solutions to avoid this are restricted to increases in state support or much-delayed retirements. In addition, each year that passes without policy changes to help people decide how to spend their wealth in retirement mean an extra year of retirees who are more likely to make mistakes which they may come to regret and which could have long-lasting financial consequences.
Reform is needed urgently, but that does not mean it all has to be implemented immediately. There are political barriers preventing an immediate move away from triple lock indexation of the state pension, but there is a good case for announcing sooner rather than later the target goal for the state pension as a share of average earnings, which would allow policymakers to deliver a higher state pension generated by the triple lock in the short term and a pre-specified move towards a smoothed earnings link in the medium term. Changes to automatic enrolment should first be consulted on with schemes and employers to ensure a smooth implementation, but should be announced as soon as possible thereafter. These changes should then be gradually phased in, to give employers and employees time to adjust. Other reforms – in particular, to help people use their wealth wisely in retirement – should be announced more quickly, as there are fewer near-term barriers to implementation.
Despite the risks of complacency, there are reasons to be hopeful. Ultimately, more money in pensions has to come from somewhere, either employees, employers or the government. But the costs of our proposals are not prohibitive. Our proposed changes to automatic enrolment involve extra saving of approximately £11 billion per year split roughly equally between employees and employers. The reduction in tax revenue from these changes, while non-negligible, is small, at £3.7 billion per year in the near term, or around ¼% of what the government spends in a given year. This also means the near-term reduction in private resources induced by the reform is reduced by around one-third (£3.7 billion out of £11 billion). Implementing these proposals would not necessitate a large offsetting tax rise. Our proposal to move towards smoothed earnings link indexation of the state pension would actually lead to a decrease in public spending, at least relative to a world where the government continues with the triple lock indefinitely. Our proposals would reduce the public finance uncertainty around the costs of state support as well as reducing many of the risks that individuals currently face – for example, around the state pension age being increased dramatically, or of the triple lock delivering an uncertain income (relative to average earnings) in retirement, or of having to pay private rent through retirement, or of living longer than expected and depleting retirement resources too soon.
Another reason to be hopeful is that we have been here before. The recommendations of the Pensions Commission constituted a big change in direction for UK pensions policy, and yet were implemented essentially in full to broad cross-party support. This is despite the fact that many of the reforms were only implemented in the 2010s, a time of low growth and immense fiscal pressures and under a Conservative-led coalition government rather than the previous Labour government that had set up the Pensions Commission. The phased and gradual implementation of these reforms suggests a feasible path for our proposals.
These proposals would build on the Pensions Commission recommendations, further improving the pension system for future generations of pensioners in the UK. They would provide a more secure and stable state pension system, while also supporting those most affected by increases in the state pension age and other groups most at risk of income poverty in older age. They would lead to increases in private pension saving, particularly targeted at points in people’s working lives when they can most afford it. And they would offer solutions to help people use their wealth in retirement in a sensible way. With cross-party political will, these proposals can – and should – form a blueprint to improve outcomes for future generations of pensioners across the UK.
Appendix A. Background and context
The Pensions Commission heralded a big change in direction
The UK’s current pension policy framework is to a large extent the result of the implementation of recommendations made by the Pensions Commission. This independent commission, which was set up by the government in the early 2000s and chaired by Lord Adair Turner with two other commissioners – Sir John Hills and Baroness Jeannie Drake – carried out a comprehensive, evidence-based, review of the UK pensions system and made a number of proposals designed to improve the adequacy of retirement saving (Pensions Commission, 2004 and 2005).
By the mid 2000s, the state pension had been price-indexed for a quarter of a century and increases in the UK’s state pension age (for men) had never been legislated for. At this point, prior to the Pensions Commission, the then (Labour) government’s stated objective was to shift the balance of pension income from 60% state and 40% private to 40% state and 60% private through continuing the policy of price indexation of the state pension and requiring most employers to facilitate their employees making contributions to a low-cost (stakeholder) pension direct from their pay packet. In contrast, low-income pensioners were to be supported through more means-tested support that was more generous than the state pension and was to be earnings-indexed over time.
The Pensions Commission identified a number of problems with this approach. In particular, many were undersaving – some dramatically – for their retirement. The share of employees contributing to a pension was falling over time (Figure A.1), and private sector employers were shifting from generous defined benefit (DB) arrangements to defined contribution (DC) pensions into which contributions were typically much lower. (The shift from DB to DC can be seen in Figure A.2.) The Pensions Commission modelling at the time showed that 60% of working people over 35 were on course to have inadequate pensions. As a result, the share of pensioners who would be entitled to means-tested support would increase dramatically over time as the gap between (earnings-uprated) means-tested benefits and (price-uprated) state pensions would grow faster than earnings. Already in April 2003, before the introduction of pension credit, more than half of families in the UK with an individual aged 60 or over were entitled to means-tested benefits (Blundell and Emmerson, 2003). While projections suggested that state pension spending as a share of national income would fall over successive decades, in reality it was far from clear – to say the least – that this was a sustainable pension system. Indeed, the Pensions Commission reported that under the system at the time, in order to maintain pensioners’ living standards, the proportion of GDP transferred to pensioners would have to rise from 10% to 15% by 2050.
Figure A.1. Share currently saving into a pension among employees and the self-employed aged 22–59
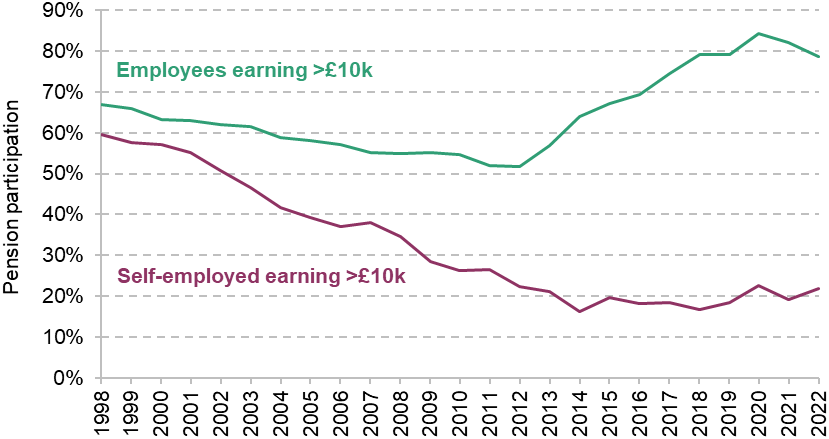
Source: Reproduced from figure 1.1 of Cribb, Emmerson, O’Brien and Sturrock (2024), which uses the Family Resources Survey, 1998–2022. People with strictly positive earnings are defined as employees or self-employed based on their own self-reported main economic activity.
Figure A.2. Share of 55- to 64-year-olds with (a) just defined contribution, (b) both defined contribution and defined benefit and (c) just defined benefit pension wealth
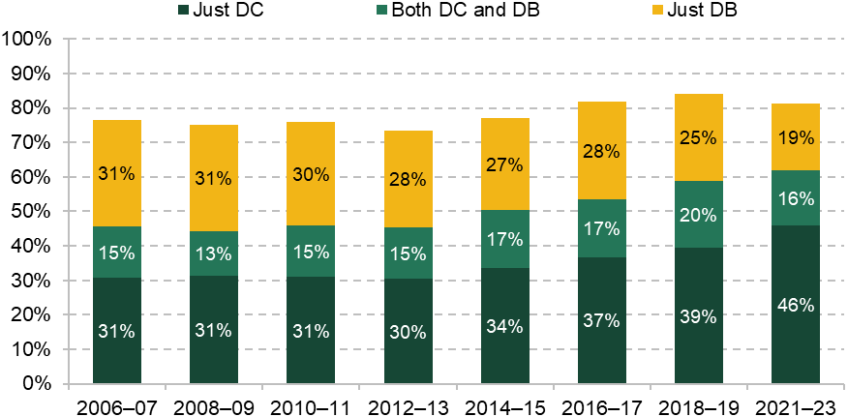
Source: Reproduced from figure 2.2 of Boileau, Cribb and Emmerson (2025a), which uses the English Longitudinal Study of Ageing, waves 1 to 10.
The Pensions Commission proposed a return to earnings indexation of the state pension, with this partially (but by no means fully) paid for through the first increases in the universal state pension age (from 65 to 66, then to 67 and then to 68). The state pension was, over the very long run, to move to being a flat-rate (rather than earnings-related) system. Earnings replacement was therefore to be done entirely through private pension provision. Workplace pension participation among employees was to be increased through a system of automatic enrolment of most employees. Relatively low minimum default contribution rates meant these were only ever intended to generate relatively low replacement rates. The Pensions Commission calculations showed a scenario where a median earner would need to contribute twice the minimum default amounts in order to achieve a baseline income replacement rate at retirement (figure 6.33 of Pensions Commission (2005)).
The Pensions Commission proposals were implemented broadly as intended with, in particular, automatic enrolment receiving cross-party support and leading to a huge increase in workplace pension membership and an increase in the overall amount being contributed to private pensions. This is an exemplar of how public policy – and, in particular, pensions policy – would ideally always be made. Specifically, it was evidence-based, it was well thought through, it received and maintained broad support, and it was carefully executed – for example, being gradually introduced with plenty of notice.
Many reforms since have built upon the Pensions Commission’s proposals. The timetable for increases in the state pension age has been brought forwards, and the increase from 65 to 66 was implemented between 2019 and 2020. The shift to a flat-rate state pension has been hugely accelerated by the introduction of the new state pension for those reaching the state pension age from April 2016. This flat-rate state pension – while just over 30% of median full-time earnings – is much more generous than the 19% of average earnings that the basic state pension was worth when the Pensions Commission reported (see Figure A.3). As discussed above, automatic enrolment successfully boosted private pension participation rates among private sector employees. In contrast, the significant reform not envisaged by the Pensions Commission was the introduction of ‘pension freedoms’.
Figure A.3. State pension over time relative to full-time median earnings
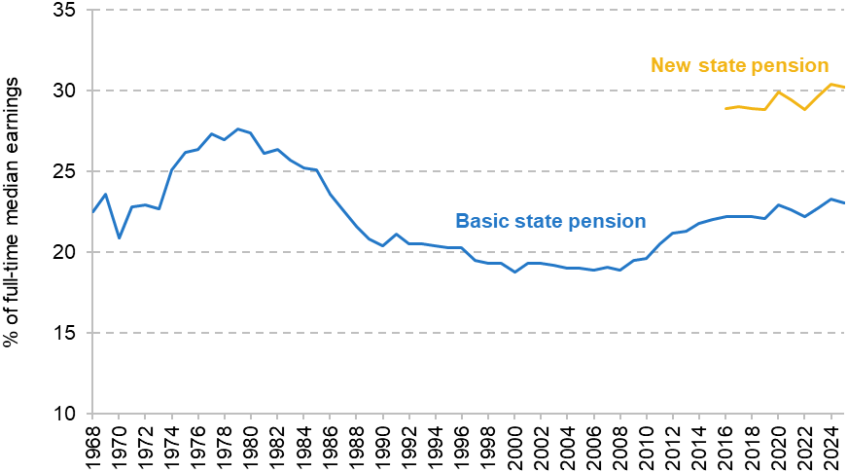
Note: Median full-time earnings since 1984 are from DWP benefit rate statistics; values for earlier years are calculated using the growth rate of nominal full-time median earnings from the Family Expenditure Survey (FES). The 2025 values are calculated using OBR projections for average earnings growth.
Source: Adapted from figure 2.1 of Cribb, Emmerson, Johnson and Karjalainen (2023), which uses https://www.gov.uk/government/statistics/abstract-of-dwp-benefit-rate-statistics-2024 and authors’ calculations.
A number of problems remain and some new ones have emerged
Private pension saving – many left behind despite automatic enrolment
While automatic enrolment has delivered a bigger boost to workplace pension membership than might have been expected, most of those brought into pensions as a result contribute only the relatively low minimum default amounts. Additionally, the retirement resources that these would be expected to deliver are lower than what the Pensions Commission envisaged, as financial returns – and economic growth more generally – since the 2008 financial crisis have continued to disappoint. While most employees contribute more than the minimum defaults set out by the government, a large minority of those in defined contribution plans still look likely to fall short of income adequacy in retirement (see Figure ES.1 in the executive summary).
In addition, while about four-in-five employees earning over £10,000 per year are now saving in a workplace pension, there are many workers who are not saving into a private pension at all. Among employees, this is either because they are ineligible for automatic enrolment (e.g. due to earning under £10,000 in a given job) or because they have been automatically enrolled and then subsequently opted out. This is more likely among young people, women and low earners (see Figure A.4) and also among those from Pakistani or Bangladeshi communities (Cribb, O’Brien and Sturrock, 2025).
Figure A.4. Percentage of working-age private sector employees not saving in a pension, by automatic enrolment eligibility and group
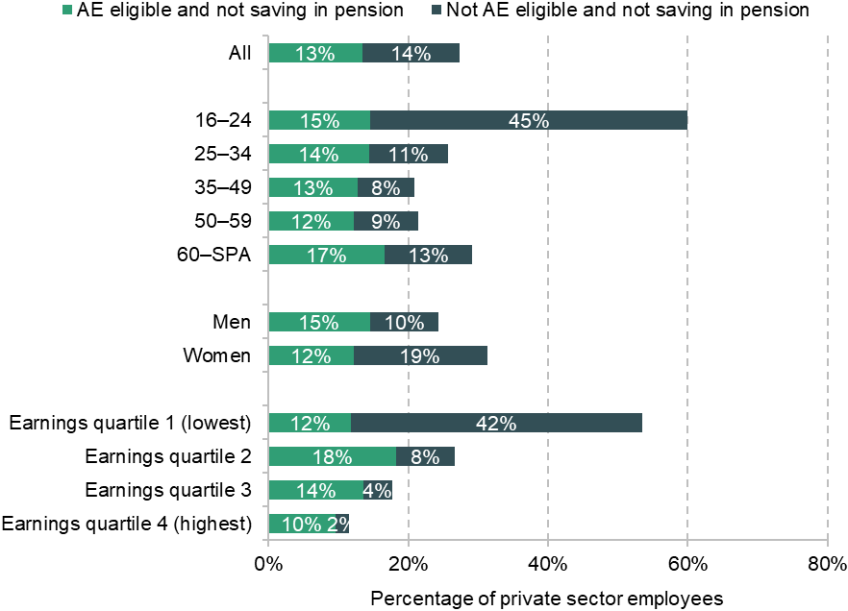
Note: AE = automatic enrolment. SPA = state pension age. The sample contains all private sector employees aged between 16 and 63 (for women) and between 16 and 64 (for men), inclusive, in Round 7 of the Wealth and Assets Survey.
Source: Reproduced from figure 4.5 of O’Brien, Sturrock and Cribb (2024).
Additionally, the self-employed, who are not covered by automatic enrolment, have become increasingly likely not to contribute to a private pension (as illustrated in Figure A.1). And even among the self-employed who do engage with pensions, contributions are often remarkably sticky (staying constant in cash terms) over time. As a result, many are not on track for pension adequacy, even when considering other wealth they hold.
Use of pension wealth in retirement – retirees face large risks
The introduction of ‘pension freedoms’ has many advantages. In particular, for those wanting to work part-time and partially retire prior to reaching the state pension age, it can facilitate a much more tailored approach to drawing down accumulated pension funds than having to use three-quarters of the pension pot to purchase an annuity at the first point of access. Flexibility is particularly useful for those who already have a guaranteed income stream from a defined benefit pension or have debts to pay off later in working life. But it also exposes many individuals to risks they would not have faced had they purchased an annuity and then spent their income each year. Most obviously, some might draw down their pension very slowly and therefore forgo valuable spending. Some might exhaust their pension pots too quickly. Others will live far longer than they might have reasonably expected and could end up having to make relatively complicated financial decisions around pension access at advanced ages – by which point they could be widowed and experiencing cognitive decline.
The issues around decumulation are exacerbated by the fact that the number of small, deferred private pension pots is large and growing. In 2024, there were around 23 million deferred DC pots worth under £10,000. The number of deferred pots worth less than £1,000 increased by almost 1 million between 2023 and 2024 (to 13 million). This means that many savers have a large number of pots that are difficult to keep track of and add complexity to decision-making on how to access those pensions. This proliferation of small, deferred pension pots is also uneconomical for pension providers, thereby reducing the net returns available within pensions.
Means-tested support – increases in state pension age and high private rents put some at risk of income poverty
While increases in the state pension age are a coherent policy response to the fiscal challenges from rising longevity at older ages, and they have been shown to lead to some people remaining in paid work for longer, rates of income poverty are much higher among those approaching state pension age than they are among younger adults or among pensioners. The gap between the level of financial support that can be received by someone just below and someone just above the state pension age has grown considerably in recent decades and is set to continue to increase, as is shown in Figure A.5.
Figure A.5. Real levels of basic financial support through pension credit and jobseeker’s allowance / universal credit over time (April 2025 prices)
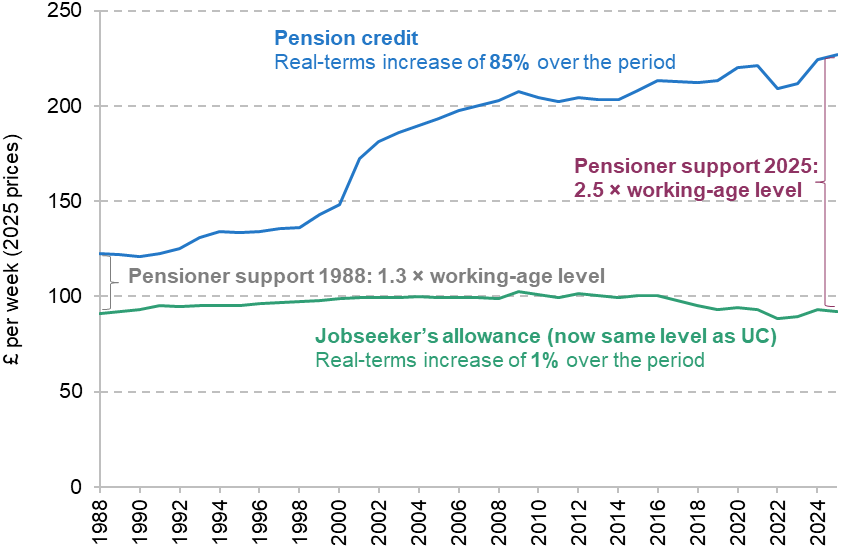
Note: Real levels in April of each year are shown. Cash values converted to real values (using the Consumer Prices Index). Entitlements shown are for single adults with no other income. Working-age support is based on jobseeker’s allowance (JSA), although since universal credit roll-out this is no longer available for new claimants. However, universal credit with no enhancements is currently set at the same level as JSA. Note that other forms of support are available to low-income people who are out of work above and below the SPA, such as housing benefit.
Source: Adapted from figure 1.1 of Cribb, Emmerson and Karjalainen (2024), which uses https://www.gov.uk/government/statistics/abstract-of-dwp-benefit-rate-statistics-2024 and authors’ calculations.
While there have always been some pensioners living in private rented accommodation, the prevalence of this is increasing, and it will increase further over the next couple of decades. Figure A.6 illustrates relative income poverty rates by housing tenure among those above state pension age. The poverty rates among both private and social renters are far higher than the rate among owner-occupiers – in 2022–23, 38% of private renters and 34% of social renters above state pension age had income below the poverty threshold, whereas the figure for owner-occupiers was 12%.
Figure A.6. Relative poverty rate for those above state pension age, by housing tenure
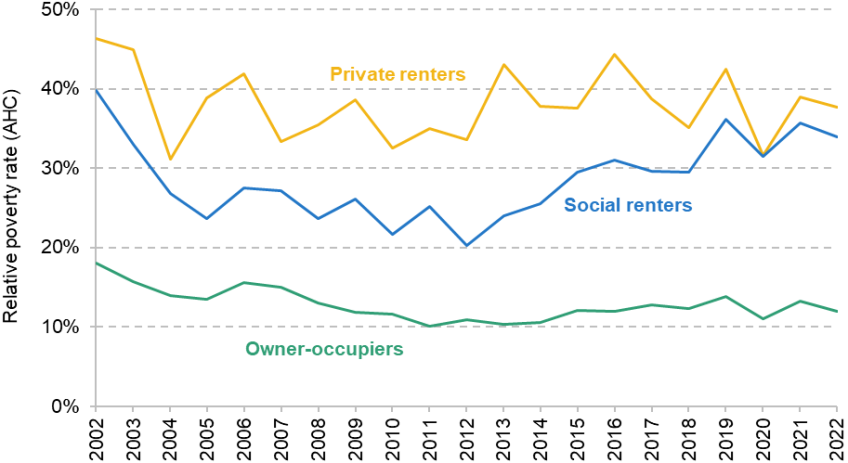
Note: Relative poverty rate is defined as having an equivalised household income (after deducting housing costs, AHC) of less than 60% of the contemporaneous median.
Source: Reproduced from figure 4.1 of Cribb, Emmerson and Karjalainen (2024), which uses the Family Resources Survey 2002–03 to 2022–23.
We can also consider how the current level of the full new state pension (and any means-tested benefits households would be entitled to), without any private pension provision, compares with the relative poverty threshold. Figure A.7 shows household income (after housing costs) relative to the poverty threshold for example pensioner households in different parts of Great Britain (where private renters face rents equivalent to the 30th percentile of rents in their local area and social renters the average social rents for their area). The maps show that private renters (both couples and singles) and social renter couples are most likely to have incomes below the current relative income poverty threshold, assuming no private sources of income. The largest shortfall relative to the poverty threshold is for private renter couples in London or the South East, where household income (after housing costs are deducted) for someone with two full new state pensions, any means-tested benefits, and rent at the 30th percentile of local area rents would be 8% (or £28) below the poverty threshold. At the same time, for owner-occupier couples in the same areas, the two new state pensions – without any private income – would ensure an income 19% above the poverty threshold.
Figure A.7. Income after housing costs for those with a full new state pension and no private income, as a percentage of the relative poverty threshold (% of current 66- to 70-year-olds in each group in parentheses)
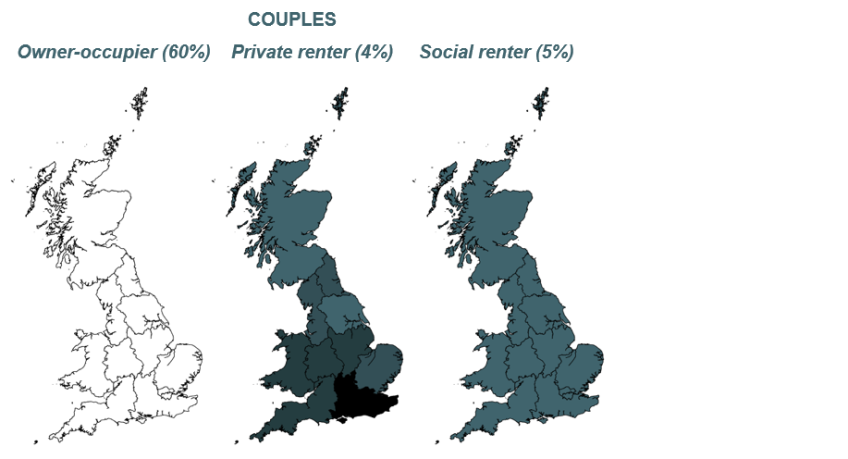
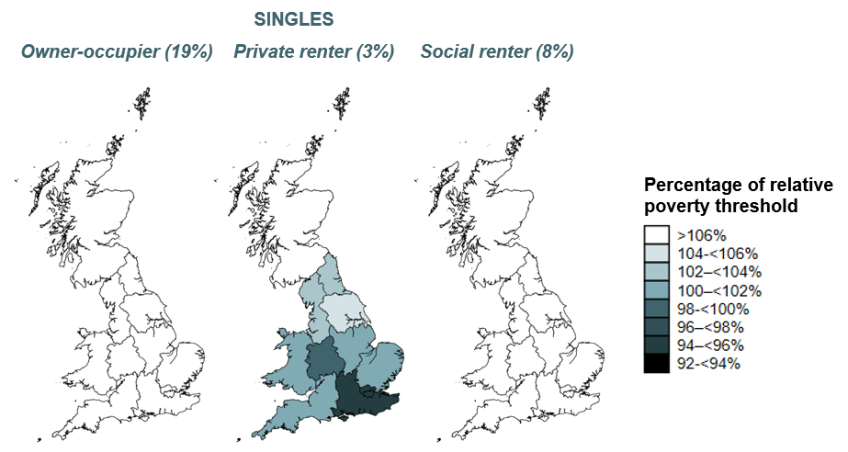
Source: Authors’ calculations using the IFS personal tax and benefit model, TAXBEN, based on example households of 66-year-olds. It is not currently possible to include Northern Ireland in these calculations. Private renters’ rents are based on 30th percentile rents for their local area. Social renters’ rents are based on average social rents for their area.
Fiscal challenges ahead
The fiscal environment is much more challenging than when the Pensions Commission reported two decades ago. Much reform is needed for the UK’s long-run public finances to be sustainable. Spending on the state pension is projected to increase as a share of national income as the ageing of the population and the increasing cost of the triple lock (relative to earnings indexation) are expected to push up spending by more than legislated increases in the state pension age will reduce it. In addition, the triple lock boosts the value of the state pension relative to earnings in an unpredictable way, and only in periods of poor economic performance when average earnings growth is low. A reasonable estimate (taking place 80% of the time) for additional spending on the state pension in 2050 due to the triple lock, above and beyond earnings indexation, would be between £5 billion and £40 billion a year in today’s terms. Even more substantially, absent a big boost to productivity in the health and social care sectors, population ageing will place considerable upwards pressure on public service spending (see Figure A.8).
Figure A.8. Projected spending on state pension, pensioner benefits, health and social care
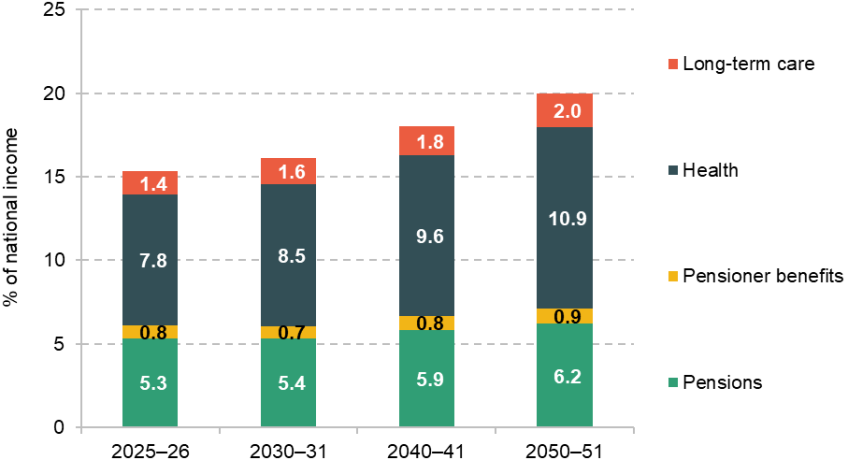
Note: ‘Pensions’ includes winter fuel payment and pension credit. ‘Pensioner benefits’ is all other benefits paid to people above the state pension age (such as attendance allowance, disability living allowance and housing benefit). Health and social care costs are total costs for the whole population, not just pensioners.
Source: Office for Budget Responsibility, 2024a.
Summary
The UK pensions system has undergone a series of significant reforms over the last two decades, most of which have followed the recommendations of the Pensions Commission. A (higher) flat-rate state pension provides a foundation income in retirement, and automatic enrolment means most employees are saving (and receiving an employer contribution) towards their private pension. However, there are new challenges, relating to the economic and fiscal environment, as well as the policy environment, that mean many future retirees are at risk of financial insecurity in retirement.
Appendix B. Example case studies
In Chapter 3, we model how our proposed reforms to automatic enrolment would affect three example ‘case studies’. In this appendix, we provide more detail on the modelling of these case studies. The modelling involves generating their earnings and pension contributions over their career, and then calculating their retirement incomes both under the current system of automatic enrolment (assuming they have the default minimum pension contributions) and under our proposed reforms.
We construct three life-cycle profiles of earnings based on data from the Annual Survey of Hours and Earnings in 2024. This dataset contains employer-reported data on earnings for a 1% sample of employees in Great Britain. The three earnings profiles are based on cross-sectional profiles of earnings by age in the data as follows:
- Mohammed, a lifetime average full-time earner: earns median full-time male earnings at each age 18–64 and leaves paid work at 65.
- Jane, a lifetime average earner with 15 years working part-time due to childcare commitments: earns median full-time female earnings at each age 18–29, then earns median part-time female earnings at each age 30–44, then earns median full-time female earnings again at each age 45–64 and leaves paid work at 65.
- Olivia, a lifetime low earner: earns 20th percentile of earnings at each age 18–59 and leaves paid work at 60.
We then further adjust the earnings profiles to account for economy-wide real earnings growth of 1.8% per year (consistent with projections from the Office for Budget Responsibility (2024b)), assuming that they start their career this year at age 18. The earnings profiles without this real earnings growth are shown in Figure B.1.
Figure B.1. Earnings by age for example case studies
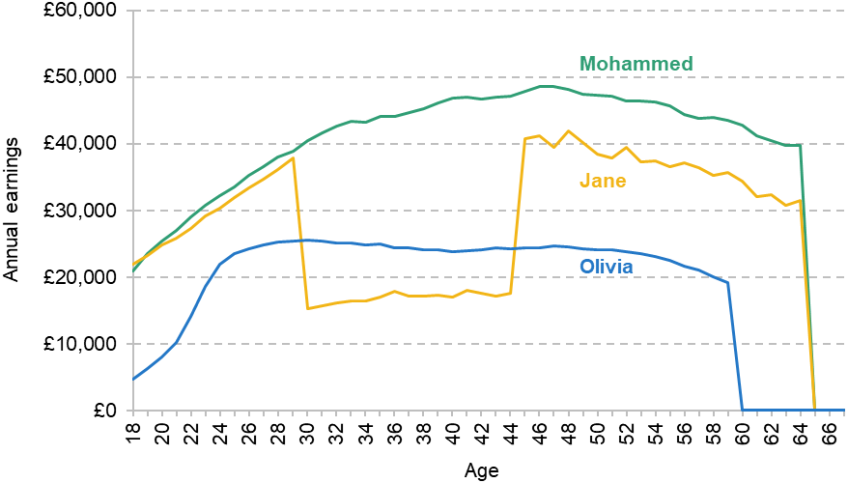
Note: This graph shows the life-cycle profiles of earnings for our three example case studies based on different points of the distribution of earnings from the Annual Survey of Hours and Earnings, 2024. In our calculations, we further assume that there is economy-wide real earnings growth of 1.8% per year; however, we do not show this in this graph.
The second step is to calculate private pension saving at each age for the three case studies under the current automatic enrolment system and under our proposed reforms. We assume that each individual saves at the default minimum total contribution rate under both systems when they are eligible for automatic enrolment, except in the years when they opt out. We assume that Mohammed and Jane never opt out of automatic enrolment; however, Olivia opts out between ages 22 and 27, 30 and 36, and 46 and 49, to capture the facts that a minority of private sector employees opt out of their pension at different points in time and that this is particularly true among lower earners. Throughout, we assume that the parameters of the automatic enrolment system are uprated in line with average earnings growth. Figure B.2 shows the level of pension contributions at each age for the three example case studies, split out by employee contributions in Panel A and employer contributions in Panel B (deflated to today by the assumed rate of real average earnings growth).
Figure B.2. Pension contributions by age for example case studies
A. Employee pension contributions
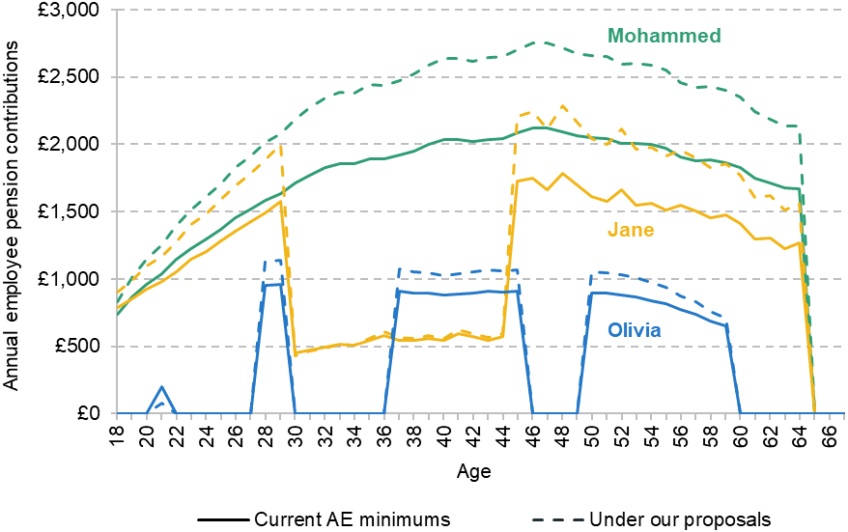
B. Employer pension contributions
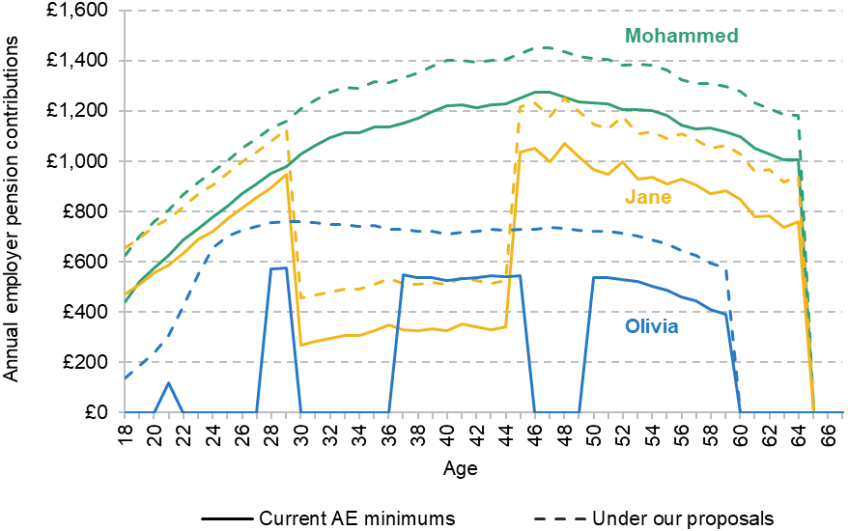
Note: AE = automatic enrolment. Contributions are deflated to today’s terms by the assumed rate of real average earnings growth.
We then calculate retirement incomes as follows. Assuming a real rate of return of 3.3% per year, we calculate the total value of each person’s pension pot by age 68. We then annuitise this pension pot to give us each person’s private retirement income, using a fair real annuity rate based on a 1.8% rate of return for annuity providers and 2020 life expectancies for someone born in 2005.30 We then add on state pension income, where for each individual we assume that they qualify for the full new state pension and that the state pension is indexed in line with average earnings growth of 1.8% per year. We measure retirement income at age 68.
We also calculate take-home pay in each year of working life for each individual. Under the current system of automatic enrolment, we calculate taxable income by subtracting employee pension contributions from earnings. We then subtract income tax and National Insurance contributions to calculate take-home pay. Under our proposals, we assume that higher employer contributions are spread out equally over all employees’ pay. We therefore reduce earnings by 0.57% in each year for each individual, consistent with the fact that the increase in employer pension contributions under our proposals is worth 0.57% of current total pay. We then subtract employee pension contributions and take off income tax and National Insurance contributions to calculate take-home pay. Figure B.3 shows the modelled impact of our proposals on take-home pay at each age for our three example case studies (deflated to today’s terms by the assumed rate of real average earnings growth).
Figure B.3. Impact on take-home pay for example case studies due to suggested automatic enrolment reform, by age
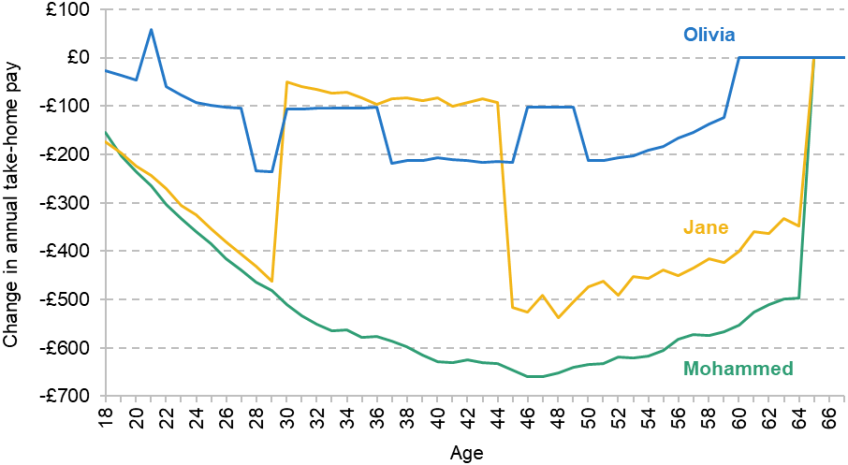
Note: Take-home pay is deflated to today’s terms by the assumed rate of real average earnings growth.
Appendix C. Additional tables and figures
Figure C.1. Minimum employer contribution rate, % of total earnings, under the current system of automatic enrolment and under our proposal
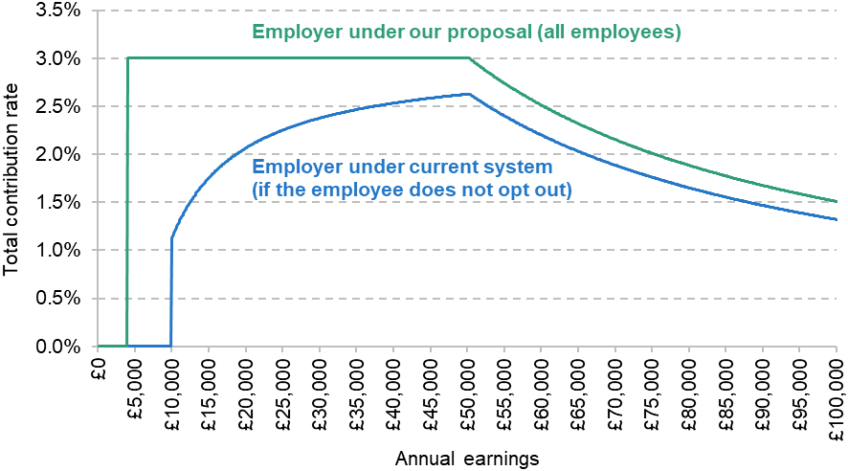
Figure C.2. Implied employee contribution rate, % of total earnings, assuming employee and employer make minimum contributions, under the current system of automatic enrolment and under our proposal
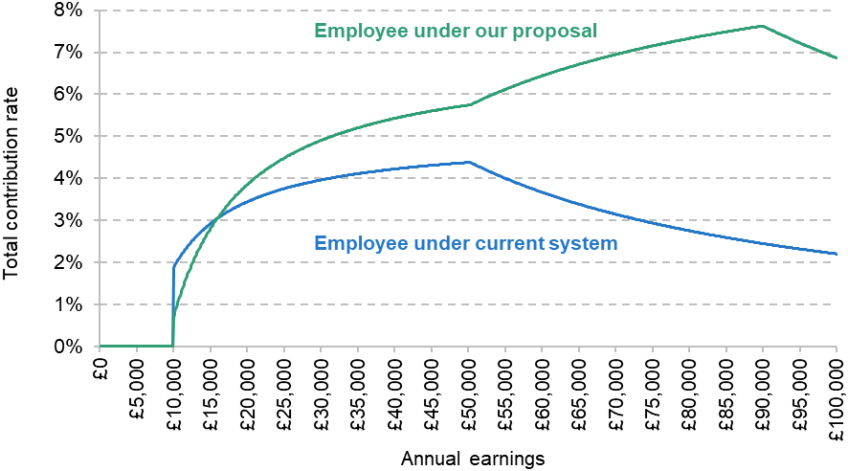
Figure C.3. Minimum default total (employee + employer) contribution rate, % of total earnings, under different potential automatic enrolment systems
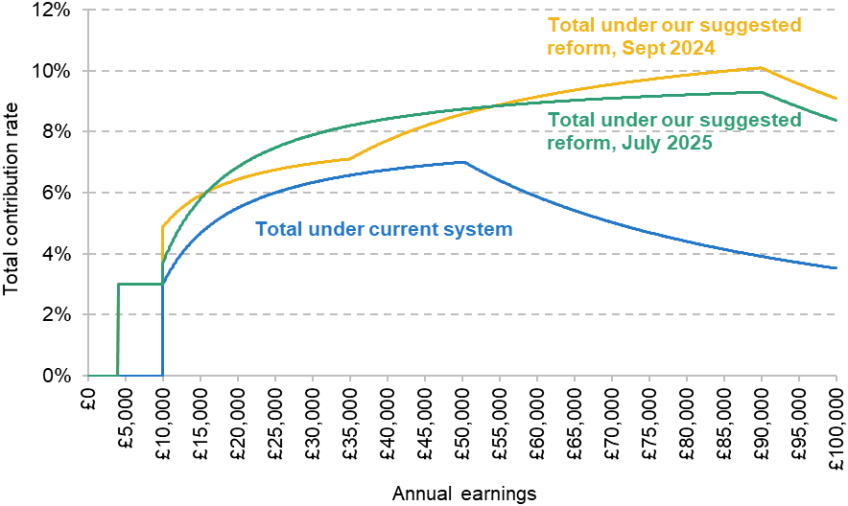
Note: ‘Our suggested reform, Sept 2024’ was suggested in Cribb, Emmerson, Johnson, O’Brien and Sturrock (2024).
Figure C.4. Percentage of private sector employees saving in a defined contribution pension who are making minimum total pension contributions, by earnings band
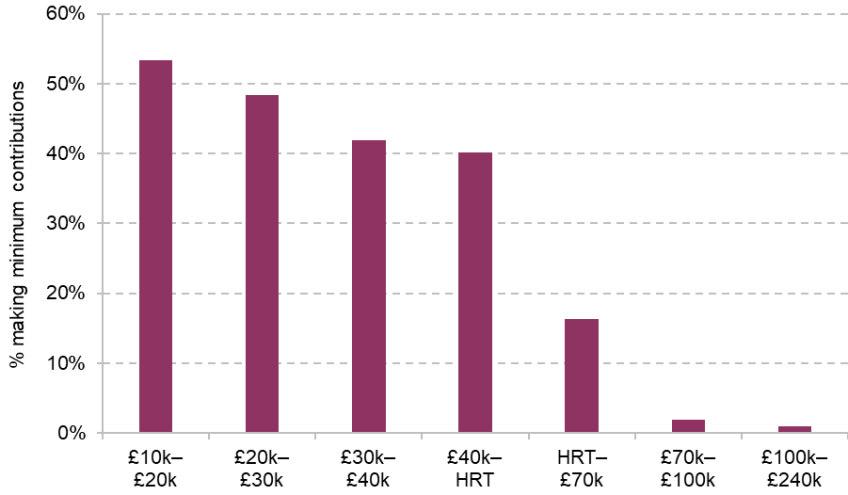
Note: HRT is the higher-rate tax threshold (equal to £50,270 per year). Minimum total pension contributions are 8% of qualifying earnings. Earnings uprated to 2025 prices.
Source: Authors’ calculations using the Annual Survey of Hours and Earnings, 2021.
Figure C.5. Modelled percentage change in projected retirement incomes from different automatic enrolment policies, for each quintile of the retirement income distribution
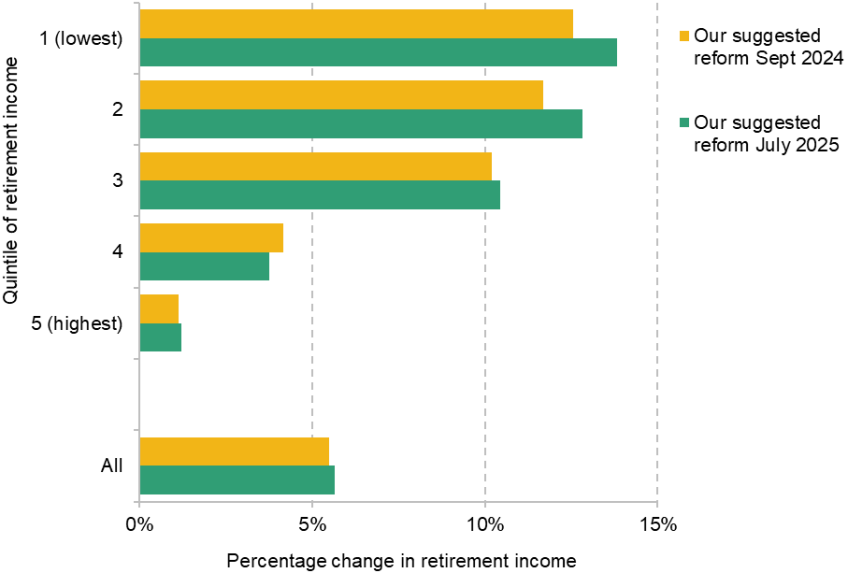
Note: The sample contains 25- to 59-year-old private sector employees saving into a defined contribution pension in Round 7 of the Wealth and Assets Survey. We simulate their projected future retirement income under their current saving rate, and under different automatic enrolment reforms, modelling everyone at the individual level and without accounting for future housing costs or inheritances. The graph then shows, for each reform, the percentage increase in average retirement incomes for each quintile of the retirement income distribution. Incomes are modelled at the individual level. ‘Our suggested reform, Sept 2024’ was suggested in Cribb, Emmerson, Johnson, O’Brien and Sturrock (2024).
Figure C.6. Modelled percentage change in take-home pay from different automatic enrolment policies for each quintile of the take-home pay distribution, with and without the possible impact of changing employer contributions
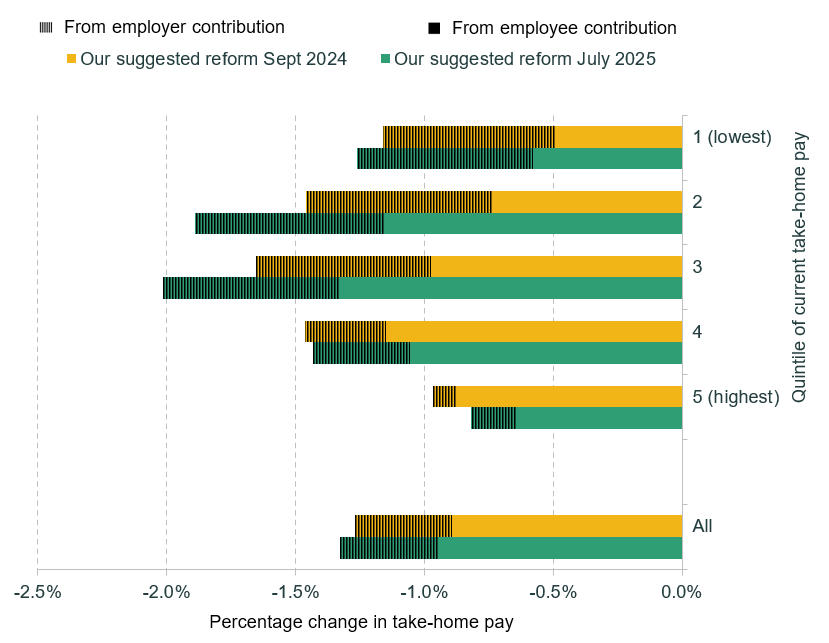
Note: The sample contains 25- to 59-year-old private sector employees saving into a defined contribution pension in Round 7 of the Wealth and Assets Survey. We calculate the average percentage fall in take-home pay (relative to today) for each quintile of the take-home pay distribution under two different automatic enrolment policies. We separate out falls from higher employee contributions and falls from higher employer contributions for the scenario where employers reduce wages one-for-one. ‘Our suggested reform, Sept 2024’ was suggested in Cribb, Emmerson, Johnson, O’Brien and Sturrock (2024).
Figure C.7. Effect of our automatic enrolment proposals on the percentage of private sector employees currently saving in a defined contribution pension projected to have inadequate retirement income, by earnings quartile
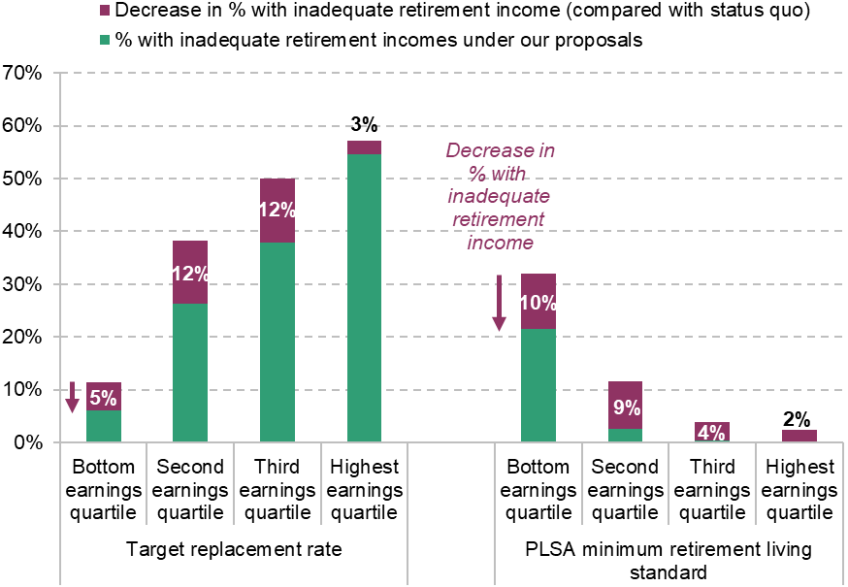
Note: The sample contains 25- to 59-year-old private sector employees saving into a defined contribution pension in Round 7 of the Wealth and Assets Survey. We simulate their projected future retirement income under their current saving rate, and under our automatic enrolment proposals, modelling everyone at the individual level and without accounting for future housing costs or inheritances. Earnings quartiles are based on pre-retirement earnings, i.e. simulated average earnings between ages 50 and 59.
Figure C.8. Share of people living in working households with income net of housing costs below the minimum PLSA retirement living standards, 2025–26
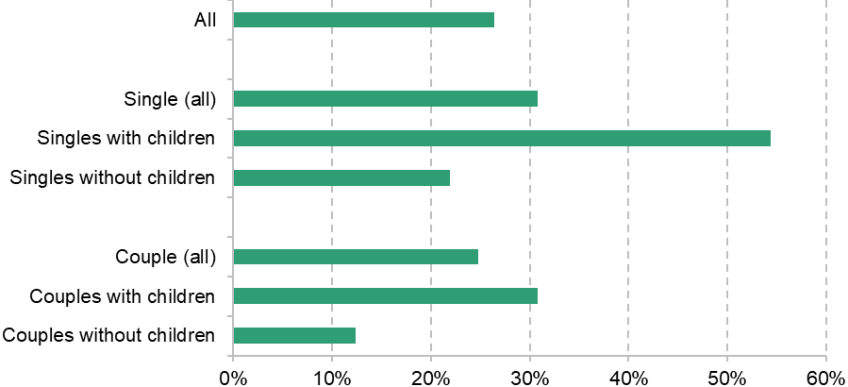
Note: Single/couple households with children have their income equivalised to the level of a single/couple household without children before being compared with the PLSA standards. Equivalisation uses the OECD modified scale. Working-age households with someone in paid work are included.
Source: Authors’ calculations using the Family Resources Survey, 2023–24, uprated to 2025–26.
Appendix D. Full list of Pensions Review reports
Cribb, J., Emmerson, C., Johnson, P., Karjalainen, H. and O’Brien, L., April 2023. Challenges for the UK pension system: the case for a pensions review. The Pensions Review, IFS Report, https://ifs.org.uk/publications/challenges-uk-pension-system-case-pensions-review.
Cribb, J., Emmerson, C. and Karjalainen, H., September 2023. The triple lock: uncertainty for pension incomes and the public finances. The Pensions Review, IFS Report, https://ifs.org.uk/publications/triple-lock-uncertainty-pension-incomes-and-public-finances.
Cribb, J., November 2023. Understanding retirement in the UK. The Pensions Review, IFS Report, https://ifs.org.uk/publications/understanding-retirement-uk.
Cribb, J., Emmerson, C., Johnson, P. and Karjalainen, H., December 2023. The future of the state pension. The Pensions Review, IFS Report, https://ifs.org.uk/publications/future-state-pension.
Cribb, J., Karjalainen, H. and O’Brien, L., June 2024. Pensions: five key decisions for the next government. The Pensions Review, IFS Report, https://ifs.org.uk/publications/pensions-five-key-decisions-next-government.
Cribb, J., Emmerson, C., O’Brien, L. and Sturrock, D., September 2024. Private pensions for the self-employed: challenges and options for reform. The Pensions Review, IFS Report, https://ifs.org.uk/publications/private-pensions-self-employed-challenges-and-options-reform.
Adam, S., Delestre, I., Emmerson, C., Miller, H. and Sturrock, D., September 2024. Raising revenue from reforms to pensions taxation. The Pensions Review, IFS Comment, https://ifs.org.uk/articles/raising-revenue-reforms-pensions-taxation.
O’Brien, L., Sturrock, D. and Cribb, J., September 2024. Adequacy of future retirement incomes: new evidence for private sector employees. The Pensions Review, IFS Report, https://ifs.org.uk/publications/adequacy-future-retirement-incomes-new-evidence-private-sector-employees.
Cribb, J., Emmerson, C., Johnson, P., O’Brien, L. and Sturrock, D., September 2024. Policies to improve employees’ retirement resources. The Pensions Review, IFS Report, https://ifs.org.uk/publications/policies-improve-employees-retirement-resources.
Cribb, J., Emmerson, C. and Karjalainen, H., December 2024. Means-tested support for people approaching and beyond state pension age. The Pensions Review, IFS Report, https://ifs.org.uk/publications/means-tested-support-people-approaching-and-beyond-state-pension-age.
Cribb, J., Emmerson, C., O’Brien, L. and Sturrock, D., February 2025. Small pension pots: problems and potential policy responses. The Pensions Review, IFS Report, https://ifs.org.uk/publications/small-pension-pots-problems-and-potential-policy-responses.
Boileau, B., Cribb, J. and Emmerson, C., April 2025. Individuals’ challenges managing pensions through retirement. The Pensions Review, IFS Report, https://ifs.org.uk/publications/individuals-challenges-managing-pensions-through-retirement.
Boileau, B., Cribb, J. and Emmerson, C., April 2025. Policies to help people manage defined contribution pension wealth through retirement. The Pensions Review, IFS Report, https://ifs.org.uk/publications/policies-help-people-manage-defined-contribution-pension-wealth-through-retirement.
Karjalainen, H., April 2025. How aware are people of next year’s state pension age increase? The Pensions Review, IFS Comment, https://ifs.org.uk/articles/how-aware-are-people-next-years-state-pension-age-increase.
Appendix E. Full list of advisory group member organisations
Age UK
Carers UK
Centre for Analysis of Social Exclusion at LSE
Citizens Advice
Confederation of British Industry (CBI)
Department for Work and Pensions (DWP)
Fabian Society
Federation of Small Businesses (FSB)
Financial Conduct Authority (FCA)
Generation Rent
HM Revenue & Customs (HMRC)
HM Treasury (HMT)
Institute and Faculty of Actuaries (IFoA)
Institute for Government (IfG)
Joseph Rowntree Foundation (JRF)
Lane Clark & Peacock LLP (LCP)
Money and Pensions Service (MaPS)
NEST Insight
Pensions and Lifetime Savings Association (PLSA)
Pensions Policy Institute (PPI)
Phoenix Insight
Policy in Practice
Resolution Foundation
The Association of British Insurers (ABI)
The Behavioural Insights Team (BIT)
The International Longevity Centre (ILC-UK)
The Pensions Regulator
The Runnymede Trust
Trades Union Congress (TUC)
Which?
References
Adam, S., Delestre, I., Emmerson, C. and Sturrock, D., 2022. Death and taxes and pensions. IFS Report, https://ifs.org.uk/publications/death-and-taxes-and-pensions.
Adam, S., Delestre, I., Emmerson, C. and Sturrock, D., 2023. A blueprint for a better tax treatment of pensions. IFS Report, https://ifs.org.uk/publications/blueprint-better-tax-treatment-pensions.
Adam, S., Delestre, I., Emmerson, C., Miller, H. and Sturrock, D., 2024. Raising revenue from reforms to pensions taxation. The Pensions Review, IFS Comment, https://ifs.org.uk/articles/raising-revenue-reforms-pensions-taxation.
Age UK and Aviva, 2025. Retirement reality: managing money in mid-retirement. https://static.aviva.io/content/dam/aviva-corporate/documents/newsroom/pdfs/reports/Aviva-Age-UK-Retirement-Report-2025.pdf.
Blundell, R. and Emmerson, C., 2003. Fiscal effects of reforming the UK state pension system. IFS Working Paper WP03/13, https://ifs.org.uk/publications/fiscal-effects-reforming-uk-state-pension-system.
Boileau, B., Cribb, J. and Emmerson, C., 2025a. Individuals’ challenges managing pensions through retirement. The Pensions Review, IFS Report, https://ifs.org.uk/publications/individuals-challenges-managing-pensions-through-retirement.
Boileau, B., Cribb, J. and Emmerson, C., 2025b. Policies to help people manage defined contribution pension wealth through retirement. The Pensions Review, IFS Report, https://ifs.org.uk/publications/policies-help-people-manage-defined-contribution-pension-wealth-through-retirement.
Boileau, B., Emmerson, C., Oulton, M., Stockton, I. and Zaranko, B., 2025. A look ahead to the 2025 Spring Forecast. IFS Comment, https://ifs.org.uk/articles/look-ahead-2025-spring-forecast.
Boyle, P. and Webb, S., 2022. ‘The flex first, fix later’ pension – is this the future of retirement? Lane Clark and Peacock, https://www.lcp.com/en/media-centre/press-releases/the-flex-first-fix-later-pension-is-this-the-future-of-retirement.
Bozio, A., Crawford, R. and Tetlow, G., 2010. The history of state pensions in the UK: 1948 to 2010. IFS Report, https://ifs.org.uk/publications/history-state-pensions-uk-1948-2010.
Commonwealth of Australia, 2009. Secure and sustainable pensions, information letter. https://clik.dva.gov.au/compensation-and-support-reference-library/departmental-instructions/2009/c152009-secure-and-sustainable-pension-reform.
Cribb, J., 2023. Understanding retirement in the UK. The Pensions Review, IFS Report, https://ifs.org.uk/publications/understanding-retirement-uk.
Cribb, J., Emmerson, C., Johnson, P. and Karjalainen, H., 2023. The future of the state pension. The Pensions Review, IFS Report, https://ifs.org.uk/publications/future-state-pension.
Cribb, J., Emmerson, C., Johnson, P., Karjalainen, H. and O’Brien, L., 2023. Challenges for the UK pension system: the case for a pensions review. The Pensions Review, IFS Report, https://ifs.org.uk/publications/challenges-uk-pension-system-case-pensions-review.
Cribb, J., Emmerson, C., Johnson, P., O’Brien, L. and Sturrock, D., 2024. Policies to improve employees’ retirement resources. The Pensions Review, IFS Report, https://ifs.org.uk/publications/policies-improve-employees-retirement-resources.
Cribb, J., Emmerson, C. and Karjalainen, H., 2024. Means-tested support for people approaching and beyond state pension age. The Pensions Review, IFS Report, https://ifs.org.uk/publications/means-tested-support-people-approaching-and-beyond-state-pension-age.
Cribb, J., Emmerson, C. and Karjalainen, H., 2025. The future of public pension provision in the UK: challenges and trade-offs. Oxford Review of Economic Policy, 41, 153–66, https://doi.org/10.1093/oxrep/graf008.
Cribb, J., Emmerson, C., O’Brien, L. and Sturrock, D., 2024. Private pensions for the self-employed: challenges and options for reform. The Pensions Review, IFS Report, https://ifs.org.uk/publications/private-pensions-self-employed-challenges-and-options-reform.
Cribb, J., Emmerson, C., O’Brien, L. and Sturrock, D., 2025. Small pension pots: problems and potential policy responses. The Pensions Review, IFS Report, https://ifs.org.uk/publications/small-pension-pots-problems-and-potential-policy-responses.
Cribb, J., Karjalainen, H. and O’Brien, L., 2024. Pensions: five key decisions for the next government. The Pensions Review, IFS Report, https://ifs.org.uk/publications/pensions-five-key-decisions-next-government.
Cribb, J., O’Brien, L. and Sturrock, D., 2025. Ethnic differences in retirement wealth accumulation in the UK. IFS Working Paper WP25/02, https://ifs.org.uk/publications/ethnic-differences-retirement-wealth-accumulation-uk.
Department for Work and Pensions, 2013. The single-tier pension: a simple foundation for saving. https://assets.publishing.service.gov.uk/media/5a7b622940f0b64646935cb1/single-tier-pension.pdf.
Department for Work and Pensions, 2017. Independent Review of the State Pension Age: smoothing the transition. https://assets.publishing.service.gov.uk/media/5a81eb22ed915d74e3400c27/print-ready-independent-review-of-the-state-pension-age-smoothing-the-transition.pdf.
Department for Work and Pensions, 2023a. Independent Review of the State Pension Age 2022. https://assets.publishing.service.gov.uk/media/6424024460a35e00120cb04d/state-pension-age-independent-review-2022.pdf.
Department for Work and Pensions, 2023b. Analysis of future pension incomes. https://www.gov.uk/government/statistics/analysis-of-future-pension-incomes/analysis-of-future-pension-incomes.
Department for Work and Pensions, 2025a. Small Pots Delivery Group Report. https://www.gov.uk/government/publications/small-pots-delivery-group-report/small-pots-delivery-group-report.
Department for Work and Pensions, 2025b. Pathways to work: reforming benefits and support to get Britain working Green Paper. https://www.gov.uk/government/consultations/pathways-to-work-reforming-benefits-and-support-to-get-britain-working-green-paper/pathways-to-work-reforming-benefits-and-support-to-get-britain-working-green-paper.
Financial Conduct Authority, 2024. CP24/27: Advice Guidance Boundary Review – proposed targeted support reforms for pensions. https://www.fca.org.uk/publications/consultation-papers/cp24-27-advice-guidance-boundary-review-targeted-support-reforms-pensions.
HM Revenue & Customs, 2025. Direct effects of illustrative tax changes. 28 January, https://www.gov.uk/government/statistics/direct-effects-of-illustrative-tax-changes.
HM Treasury, 2024. Advice Guidance Boundary Review: proposed targeted support reforms for pensions. https://www.gov.uk/government/news/advice-guidance-boundary-review-proposed-targeted-support-reforms-for-pensions.
House of Commons Work and Pensions Committee, 2015. Intergenerational fairness. Third Report of Session 2016–17, https://publications.parliament.uk/pa/cm201617/cmselect/cmworpen/59/59.pdf.
Independent Age, 2025. Too little, too late: experiences of income adequacy in later life. https://www.independentage.org/policy-and-research/TooLittleTooLateReport.
International Monetary Fund, 2025. Public sentiment matters: the essence of successful energy subsidies and pension reforms. In Fiscal Monitor: fiscal policy under uncertainty.https://www.imf.org/en/Publications/FM/Issues/2025/04/23/fiscal-monitor-April-2025.
LCP, 2021. Is there a right time to buy an annuity? Lane Clark & Peacock, https://www.lcp.com/media/1150053/is-there-a-right-time-to-buy-an-annuity.pdf.
NEST, 2015. The future of retirement: a retirement income blueprint for NEST’s members. National Employment Savings Trust, https://www.nestpensions.org.uk/schemeweb/dam/nestlibrary/the-future-of-retirement-blueprint.pdf.
Nest Insight, 2023. Workplace sidecar saving in action. https://www.nestinsight.org.uk/wp-content/uploads/2023/04/workplace-sidecar-saving-in-action.pdf.
O’Brien, L., Sturrock, D. and Cribb, J., 2024. Adequacy of future retirement incomes: new evidence for private sector employees. The Pensions Review, IFS Report, https://ifs.org.uk/publications/adequacy-future-retirement-incomes-new-evidence-private-sector-employees.
Office for Budget Responsibility, 2024a. Fiscal risks and sustainability – September 2024. https://obr.uk/frs/fiscal-risks-and-sustainability-september-2024/.
Office for Budget Responsibility, 2024b. Supplementary forecast information release: long-term economic determinants – March 2024. https://obr.uk/supplementary-forecast-information-release-long-term-economic-determinants-march-2024/.
Office for National Statistics, 2020. Household wealth by ethnicity, Great Britain: April 2016 to March 2018. https://www.ons.gov.uk/peoplepopulationandcommunity/personalandhouseholdfinances/incomeandwealth/articles/householdwealthbyethnicitygreatbritain/april2016tomarch2018.
Office for National Statistics, 2023. Ethnicity pay gaps, UK: 2012 to 2022. https://www.ons.gov.uk/employmentandlabourmarket/peopleinwork/earningsandworkinghours/articles/ethnicitypaygapsingreatbritain/2012to2022.
Otto, S., 2025. Mature decisions: the role of social security in alleviating pensioner poverty. Fabian Society, https://fabians.org.uk/publication/mature-decisions/.
Pensions and Lifetime Savings Association, 2022a. PLSA calls for levelling up of workplace pensions. https://www.plsa.co.uk/Press-Centre/Press-Releases/Article/PLSA-calls-for-levelling-up-of-workplace-pensions.
Pensions and Lifetime Savings Association, 2022b. Retirement choices: the evolution of products and support. https://www.plsa.co.uk/portals/0/Documents/Policy-Documents/2022/Retirement-choices-the-evolution-of-products-and-support-June-2022.pdf.
Pensions Commission, 2004. Pensions: challenges and choices. The First Report of the Pensions Commission. http://image.guardian.co.uk/sys-files/Money/documents/2005/05/17/fullreport.pdf.
Pensions Commission, 2005. A new pension settlement for the twenty-first century. The Second Report of the Pensions Commission. https://webarchive.nationalarchives.gov.uk/ukgwa/+/http:/www.dwp.gov.uk/publications/dwp/2005/pensionscommreport/main-report.pdf.
Pike, T., 2022. Projection of future pensioner household income, analysis based upon the Wealth and Assets Survey dataset. Pensions Policy Institute, https://www.pensionspolicyinstitute.org.uk/media/sihnuwdi/20220831-projection-of-pensioner-income-from-was-final.pdf.
Portes, J., 2023. Unlocking the pensions debate: the origins and future of the ‘triple lock’. Political Quarterly, 94, 668–73, https://doi.org/10.1111/1467-923X.13330.
Ray-Chaudhuri, S. and Xu, X., 2025. Combined impact of minimum wage and tax increases may reduce opportunities for young people. IFS Comment, https://ifs.org.uk/articles/combined-impact-minimum-wage-and-tax-increases-may-reduce-opportunities-young-people.
Data
Department for Work and Pensions, NatCen Social Research. (2021). Family Resources Survey. [data series]. 4th Release. UK Data Service. SN: 200017, DOI: http://doi.org/10.5255/UKDA-Series-200017.
Office for National Statistics. (2019). Family Expenditure Survey. [data series]. 3rd Release. UK Data Service. SN: 200016, DOI: http://doi.org/10.5255/UKDA-Series-200016.
Office for National Statistics, Social Survey Division. (2023). Wealth and Assets Survey, Waves 1-5 and Rounds 5-7, 2006-2020. [data collection]. 18th Edition. UK Data Service. SN: 7215, DOI: http://doi.org/10.5255/UKDA-SN-7215-18.
Office for National Statistics. (2025). Annual Survey of Hours and Earnings, 1997-2024: Secure Access. [data collection]. 26th Edition. UK Data Service. SN: 6689, DOI: http://doi.org/10.5255/UKDA-SN-6689-25.
Acknowledgements
The abrdn Financial Fairness Trust has supported this project (grant reference 202206- GR000068) as part of its mission to contribute towards strategic change which improves financial well-being in the UK. Its focus is on tackling financial problems and improving living standards for people on low-to-middle incomes. It is an independent charitable foundation registered in Scotland. Co-funding from the ESRC-funded Centre for the Microeconomic Analysis of Public Policy at IFS (grant number ES/T014334/1) is also gratefully acknowledged.
We make special acknowledgement to Alistair Darling, who we were honoured to have as the chair of the Pensions Review Steering Group until his passing in November 2023. We were extremely fortunate to benefit from his guidance, wisdom and insights in this project. We are grateful for excellent comments and advice from our Steering Group members, David Gauke (Chair), Jeannie Drake, David Norgrove and Joanne Segars; from Mubin Haq, Karen Barker and Andrew Harrop at abrdn Financial Fairness Trust; from Janette Weir from Ignition House; and from our Advisory Groups (see list of member organisations in Appendix E). In addition to the significant contributions from previous Pensions Review reports authored by Bee Boileau and David Sturrock, we also benefited from the thoughts and assistance of many colleagues including Stuart Adam and Anna Henry.
This work was produced using statistical data from the Family Resources Survey (FRS), the Annual Survey of Hours and Earnings (ASHE), the Wealth and Assets Survey (WAS) and the Family Expenditure Survey (FES). Data from the FRS were accessed through an agreement with the Department for Work and Pensions. Data from ASHE were accessed via the Office for National Statistics (ONS)’s Secure Research Service. Data from the WAS are Crown Copyright and are reproduced with the permission of the Controller of HMSO and the King’s Printer for Scotland. The WAS is produced by the ONS. The FES data are available from the UK Data Service.
This work contains statistical data from the ONS which are Crown Copyright. The use of the ONS statistical data in this work does not imply the endorsement of the ONS in relation to the interpretation or analysis of the statistical data. This work uses research data sets which may not exactly reproduce National Statistics aggregates.
Endnotes
Authors

Jonathan Cribb
Jonathan joined IFS in 2011. His research areas includes: pensions, ageing and demographic change, public sector pay, housing, and inequalities.


Heidi Karjalainen
Heidi is a Senior Research Economist in the Retirement, Saving & Ageing sector. Her current research is on pensions and saving for retirement.

Laurence O'Brien
Laurence is in the Retirement, Savings and Ageing sector. His work focuses on people’s savings decisions and on economic activity in later life.
More from IFS
Understand this issue


Policy analysis


Academic research


