
Downloads
Download report PDF
PDF | 787.83 KB
Executive summary
This report makes the case for a new review of the pension system in the UK. There are a number of key challenges facing future generations of pensioners that threaten their living standards in retirement and which, without policy action, mean many are likely to face substantial financial difficulties in older age. This is the first report of a multi-year project that will produce the highest-quality evidence regarding the future of financial security in retirement. The launch of our final report, which will include specific policy recommendations and options, is planned for early Summer 2025.
Key findings
1. Many employees are only saving very little for retirement. Almost a fifth of working-age private sector employees (around 3.5 million people) do not do any pension saving in a given year. This is particularly true of low earners who are below the threshold for automatic enrolment. Perhaps more concerning, most of those participating in a pension save low amounts. 61% of the middle-earning private sector employees who are contributing to a pension are saving less than 8% of their earnings, and 87% are saving less than the 15% which would be more in line with what Lord Turner’s Pensions Commission thought appropriate
2. Fewer than one-in-five self-employed workers are saving in a pension. This compares with around a third when the Pensions Commission reported. This is particularly concerning given the growth in self-employment and that the decline in pension membership among the self-employed is greatest among those who have been self-employed for a long period, and that those who do save in a pension often save relatively low amounts that remain fixed in cash terms over a number of years.
3. Most private sector pension participation is in the form of defined contribution pensions which leave individuals bearing risks that are difficult to manage well. Relative to defined benefit arrangements, they do offer members much more flexibility. But unlike in defined benefit plans, there is no risk-sharing with employers, other members or other generations. The fraction of private sector employees participating in a defined benefit pension halved from 24% in 2005 to 12% in 2020.
4. Increasing numbers approaching retirement live in more expensive, insecure, private rented accommodation. At age 65, only 3–4% of those born in the 1930s and 1940s lived in private rented housing, compared with 6% for those born in the 1950s and with what looks likely to be 10% for those born in the 1960s. This share could be even higher for younger generations, leading to a combination of a low standard of living in retirement and greater reliance on housing benefit.
5. Higher state pension ages are a coherent response to the challenges of increased longevity at older ages, but they pose difficulties for many and longevity improvements have not been as big as predicted a decade ago. The higher state pension ages rise, the harder it will be for some to remain in paid work until that age. Among those in their late 60s, 35% of men and 40% of women are disabled (i.e. have a longstanding health condition that has a substantial negative effect on their daily life). These rates rise to 43% and 46% respectively for those with low levels of formal education. A higher state pension age also pushes up income poverty rates among those in their mid 60s, in part because the working-age benefit system is less generous than the support available for pensioners. For example, the increase in state pension age from 65 to 66 led to a more than doubling of the income poverty rate for 65-year-olds.
6. Demographic and other pressures mean that spending on state pensions and other benefits for pensioners is already projected to rise by £100 billion a year by 2070, with even bigger increases in health and social care spending. If the state pension age is increased as legislated, the share of adults over the state pension age is projected to rise from 24% today to 27% in 2050 and 30% in 2070. The most recent projections from the Office for Budget Responsibility are for state spending on payments to pensioners to rise from 5.6% to 9.6% of national income over the next 50 years; this increase is equivalent to £100 billion a year in today’s terms. The UK is, however, in a better fiscal position on this issue than many western European countries, with less public spending on state pensions and more favourable demographic trends.
7. Those retiring with defined contribution pension pots face considerable difficulty and risk in managing their finances through retirement. The rising prevalence of defined contribution pensions, combined with pension freedoms, means that many will be able to draw their pension flexibly through their retirement. But decisions around how to draw down pension wealth are high-stakes and will need to be made with care. Currently, a man aged 66 is expected to live for a further 19 years, but 13% can expect to survive until age 95; the equivalent figures for 66-year-old women are 21 years with 20% making it to age 95. There are risks of running out of private resources or of being so cautious as to end up suffering a needlessly austere retirement. While pension freedoms do give people the opportunity to take control of their own finances, even for the most numerate the decisions on how to draw on their pension wealth through their retirement are difficult.
8. While current pensioners are still doing well on average, and many of the recommendations of the Pensions Commission have been successfully implemented, the future looks risky at best for many current workers hoping for a comfortable retirement. The last 20 years have seen the continued decline of defined benefit pensions in the private sector, the abolition of state earnings-related pensions, low interest rates, falling homeownership, low average contributions to defined contribution arrangements, the introduction of pension freedoms which offer flexibilities but reduce the extent of risk-sharing in retirement, and a collapse in pension saving among the self-employed. We need a major review of pension provision now in order to give us a chance of avoiding a future that looks worse than the present.
1. Introduction
Planning for retirement is difficult. To get it right, individuals need not only to take stock of their current financial position but also to take an informed view over a number of future factors, around all of which there will be much uncertainty. These include when they expect to retire, the chances that health problems or a lack of appropriate jobs might prevent them from working up to that age, how much they will earn up to retirement, what rates of return they might be able to achieve on any savings, what their spending needs will be up to retirement and how these needs might evolve through retirement, and how long that retirement will be. And getting it right matters: at the current state pension age of 66, on average men are currently expected to live for another 19 years and women for another 21 years, so the consequences of having underprovided for retirement can be substantial and have long-lasting effects.[1]
Appropriately, a number of big public policies are in place to try to help individuals get this right. Over half of spending on welfare payments, the biggest of which is the state pension, goes to pensioners (£151 billion out of £254 billion forecast in 2023–24, with £125 billion being spent on state pensions (Department for Work and Pensions, 2022a)). The size of these payments means that for about half of those who recently reached the state pension age, at least half of their income is from state sources (Department for Work and Pensions, 2022b). State support in retirement is particularly important for women, and for many people from ethnic minorities. The remainder of pensioner income is largely comprised of private pension income. Here government also has an important impact on provision, both in terms of regulations – such as the requirement for employers to enrol most of their employees into a workplace pension automatically – and in terms of the tax treatment of pension saving, which for many individuals is relatively tax-favoured (Adam et al., 2023). But getting these policies right is also difficult and – given their scale, and the challenge they are trying to meet – hugely important.
And it is not just pensions that matter for resources in retirement. Some people will accumulate savings in other forms. Growing numbers are remaining in paid work beyond the state pension age. Some might expect to receive substantial inheritances. Particularly important is the role of housing: almost 80% of current pensioners are owner-occupiers who have paid off their mortgage in full and therefore have few housing costs other than upkeep and repair.
When considering policies around boosting retirement incomes, there are two quite separable issues. The first relates to the situation of current generations of pensioners. To improve their incomes, there may be a relatively limited set of policy options beyond increasing the generosity of state transfers or reducing taxes – most obviously in cases where there is little or no scope for individuals to boost their private incomes through returning to paid work. The second issue relates to the likely situation in retirement of future generations of pensioners. Here there may be a wider scope of potential options: increased state pensions, increased private saving (in pensions or in other forms) while working, and delayed retirements would all be ways of boosting the resources that would be available in retirement.
Circumstances of current retirees
There is much to celebrate when looking at the incomes of current pensioners. For over a decade, the average (median) incomes of those over state pension age have, once costs of children and differences in housing costs are accounted for, been almost identical to the average incomes of those under state pension age, as shown in Figure 1. As a group, pensioners are now less likely than average to be in relative income poverty, with a rate of 18% just before the pandemic, compared with 31% for families with children.
Figure 1. Real median household disposable income (£ per week, 2020–21 prices) and relative income poverty rates, after accounting for housing costs
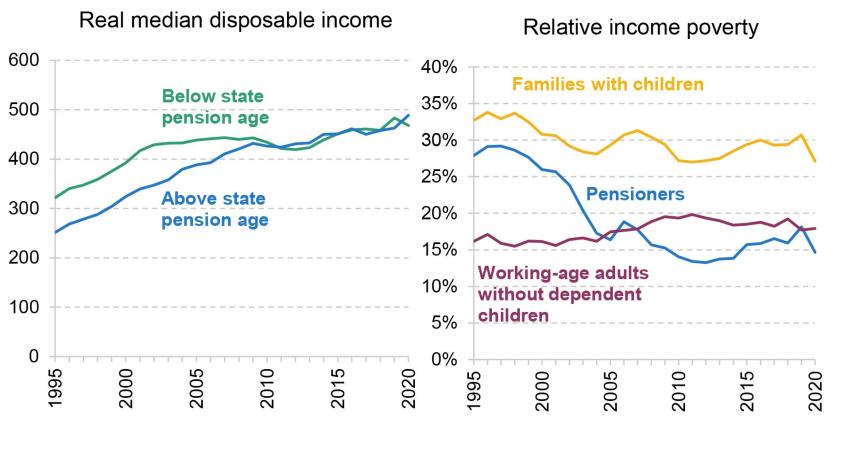
Note: Incomes measured as net household equivalised incomes, deducting housing costs, and expressed in 2020–21 prices. Relative income poverty defined as income less than 60% of contemporary median income.
Source: Authors’ calculations using the Family Resources Survey, 1995–2020.
This is in sharp contrast to earlier years. Throughout the 1960s, 1970s and 1980s, average pensioner incomes were around 70% of the average incomes of those below the state pension age. And pensioner income poverty rates throughout this period were often extremely high, with relative poverty rates of pensioners often running above 35%. This was evidence of a clear failure of state and private pension policies to deliver the retirement incomes that many would expect.
That is not to say that improvements for current pensioners are not possible. To give one obvious example, official estimates suggest that one-in-three pensioners who are entitled to the means-tested pension credit are not taking it up, with this being true of one-in-four of the lowest-income pensioners (Department for Work and Pensions, 2022c). Around one-in-six pensioners are not taking up housing benefit to which they are entitled. Given this, it is disappointing that in the Autumn Statement of November 2022, the government pushed back the planned merger of pension credit with housing benefit for pensioners, a policy that is expected to boost take-up.
The Pensions Commission
The current policy framework facing pensions in the UK is – to a significant extent – the result of the successes of the Pensions Commission. Set up by the government in the early 2000s, the independent Pensions Commission was chaired by Lord Adair Turner with two other commissioners – Sir John Hills and Baroness Jeannie Drake. The Commission carried out a comprehensive, evidence-based, review of the UK pensions system and made a number of proposals designed to improve the adequacy of retirement saving (Pensions Commission, 2004 and 2005).
In particular, it proposed:
- restoration of the earnings link for state pension indexation (the basic pension had risen roughly in line with prices since the early 1980s and had fallen a long way as a proportion of average earnings), and a long-term move towards a flat-rate state pension (away from the earnings-related pension system introduced in 1978 and continually reformed over the succeeding 25 years);
- the first universal increases in the state pension age since the first UK state pension was introduced in 1909 (when it could be received from age 70);
- and, perhaps most radically, the nationwide introduction of a requirement for employers to enrol most employees into a workplace pension, with a requirement for employers to make at least a minimum amount of pension contributions as long as the employee does not choose to opt out of the arrangement.
The Pensions Commission was successful in terms of building a wide consensus for its recommendations, which is particularly valuable in pensions policy due to the long-term nature of the decisions and outcomes to which it relates. Following the Commission’s final report in 2005, the recommendations were legislated by the then Labour government and they have remained intact – and in some cases surpassed – through the following coalition government and subsequent Conservative governments.
So how are we faring now in relation to these recommendations? The state pension has increased at least as fast as both prices and earnings, with this set to continue under the triple lock[2] . The state pension age has been increased to 66 for both men and women, with legislation in place to increase it to 67 between 2026 and 2028 and to 68 between 2044 and 2046. Automatic enrolment was rolled out nationwide between 2012 and 2018. As shown in Figure 2, this has been incredibly successful in boosting workplace pension membership among private sector employees. In 2011 around 42% of private sector employees in the automatic enrolment target group were a member of a workplace pension, and this proportion had been falling over time. But that figure has been at 86% since 2019 (Department for Work and Pensions, 2022d). For the first time, private sector employees have workplace pension participation rates that are not far below those of public sector employees. This is a remarkable turnaround in under a decade. It is clear that the Pensions Commission has been hugely successful in shaping the pensions policy landscape of the UK since it reported in 2005.
Figure 2. Percentage of employees in the automatic enrolment target group participating in workplace pensions, split by sector
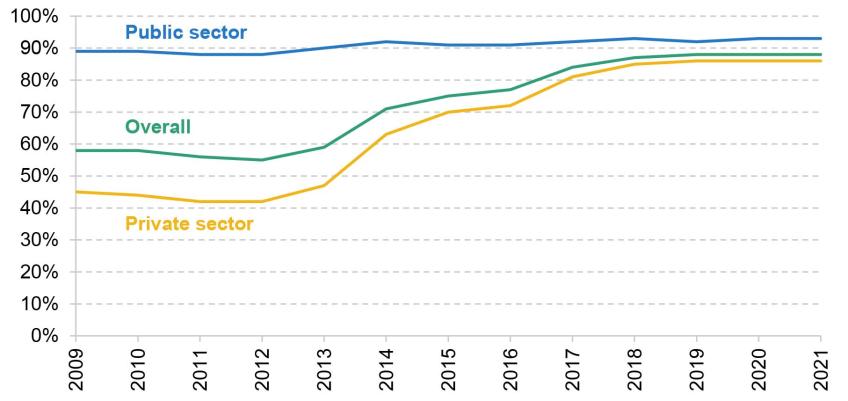
Note: Eligible employees only.
Source: Table 1.1 in Department for Work and Pensions (2022d).
Economic and policy changes since the Pensions Commission
It has now been close to two decades since the final report of the Pensions Commission in 2005. There have been substantial changes over this period that could not have been foreseen by the Commission. Many of these changes give us reasons to worry about future generations of pensioners. The global financial crisis of 2008 hit the UK economy, generating the largest recession since the 1920s. In the decade that followed, interest rates declined to record low levels. From a pre-crash peak of 5.4% in June 2007, the yield on 10-year government bonds fell to 0.6% just before the COVID-19 pandemic. It has since risen to 3.6% by February 2023, but in the face of inflation at around 10% that is a serious negative return in real terms (OECD, 2023a). The recovery from the Great Recession was characterised by anaemic economic growth and stagnating living standards for working-age families. Following the pandemic and subsequent cost-of-living crisis, public debt is now approaching 100% of national income compared with around 35% of national income in the mid 2000s (Office for Budget Responsibility, 2023). And the Bank of England recently revised down its assessment of the UK’s trend growth to a dismal rate of below 1% a year (Bank of England, 2023).
Even putting aside financial crises and pandemics, gradual but persistent changes in society are likely to have their own implications for standards of income in retirement: increasing rates of self-employment (at least up to the pandemic – see Figure 7 later and Office for National Statistics (2022a)); the continued shift away from defined benefit pensions among private sector employees (see Figure 5 later); higher levels of immigration leading to rising fractions of people who do not live their whole adult life in the UK (17% of the population in 2021 were born abroad, up from 13% in 2011, according to Office for National Statistics (2022b)); and house prices that have risen faster than earnings particularly in southern England, with resulting sharp falls in homeownership rates among those aged under 40 (Cribb and Simpson, 2018).
Government policies have also changed in ways that – seen from 2005 – would not have been expected. The introduction of ‘triple lock’ state pension uprating since 2011, combined with the low growth and economic instability of the last decade, has pushed up the value of the state pension relative to both earnings and prices (Emmerson, 2020). Significant reductions in the generosity of working-age social security benefits mean those on the lowest incomes below state pension age receive less state support than they would have done under the system in place prior to 2010 (Bourquin, Norris Keiller and Waters, 2019). New saving products such as the Lifetime ISA, which might be particularly attractive to basic-rate taxpayers whose pension saving would not be matched by an employer – such as many self-employed workers – have been introduced. And most obviously, the introduction of ‘pension freedoms’ from April 2015 has transformed how the millions of people with defined contribution pension pots are able to draw their income in retirement. Further changes are now planned, with the government recently announcing it would support a private members’ bill that would reduce the starting age for automatic enrolment to 18 (from 22) and, likely more significantly, move to a system where automatic enrolment contributions start at the first pound of earnings rather than earnings above the lower earnings limit, currently £6,240 per year (Department for Work and Pensions, 2023b).
On the basis of substantial economic and policy changes since 2005, it is high time for a new strategic review of the UK pensions system. We are not the only people who think so. Indeed, in 2020, right-of-centre think tank Bright Blue alongside left-of-centre think tank the Fabian Society made a ‘cross-party’ call for a new Pensions Commission (Shorthouse, Harrop and Robinson, 2020).
But we think that the case is much stronger than simply the fact that a long time has passed since the Pensions Commission. The relatively strong performance of retirement incomes over the course of the last decade could be breeding complacency among policymakers with our pensions system. Without policy action, the financial security in retirement for future generations of pensioners may not be quite so rosy: recent trends among pensioners may well not continue and indeed could reverse. In the next section, we document some of the key facts and trends that we think together make the case for a new Pensions Review.
2. Challenges facing future generations of pensioners
Compared with many other countries in western Europe and Scandinavia, many pensioners in the UK are reliant on private resources, particularly through private pensions provided or facilitated by their former employers. The near-universal New State Pension, which is payable to those who reached the state pension age from April 2016, provides a flat-rate pension that is almost the same irrespective of how much was earned in working life. Since 6 April this year, it has been set at £203.85 per week. At around 30% of median earnings, it is more generous relative to average earnings than the basic state pension has been at any point in its existence (the basic state pension climbed to almost 30% of median earnings in 1979, just prior to the earnings link being broken in 1980). But even at this level, middle and high earners would see a big drop in their standard of living at retirement if they did not accumulate private wealth during their working life, most obviously through a private pension.
As shown in the last section, automatic enrolment has been very successful in boosting workplace pension participation among target employees to high levels by historical standards. But this still leaves significant numbers of employees who are not enrolled in a workplace pension. Figure 3 shows the share of all private sector employees, by earnings, who are participating in such an arrangement. It shows considerably lower enrolment rates for those under the automatic enrolment threshold of £10,000 per year – only 44% of those earning £5,000–£10,000 per year participated in a pension in 2019. This compares with 87% of those around median earnings (£25,000 to £30,000) and 92% of those earning just over £50,000. Cribb, Karjalainen and O’Brien (2023) show that lower pension coverage among those earning below £10,000, combined with the fact that women are much more likely to be lower earners than men, is one key driver of women’s private pension participation being lower than that of men.
Figure 3. Pension participation of private sector employees, by annual earnings, 2019
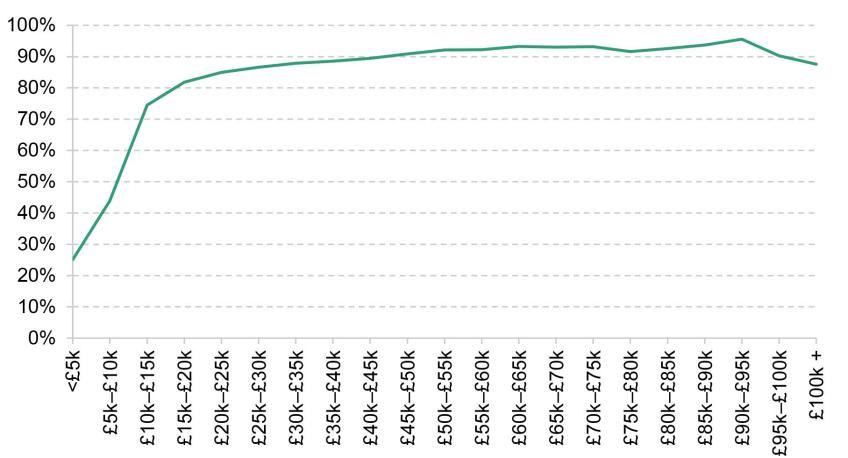
Source: Authors’ calculations using the Annual Survey of Hours and Earnings, 2019.
In addition, among employees who do participate in a private pension plan, the minimum default contributions required for automatically enrolled employees are low and there are resulting concerns that many may not be saving enough for retirement (Department for Work and Pensions, 2023a). Total contributions have to be at least 8% of ‘qualifying’ earnings between £6,240 and their salary level (or £50,270 for those earning more than that). For a median full-time earner in April 2022 (£640 per week), this would mean pension saving of 6.5% of their total earnings. This potentially leaves many with very low levels of contributions. Figure 4 shows the shares of working-age private sector employees who are participating in a workplace pension who have total contributions – i.e. both their own contributions and those made by an employer on their behalf – of less than 15%, less than 8% and less than 5% of total earnings.
Figure 4. Percentage of private sector employees saving in a pension who have total workplace pension contributions less than 15%, 8% and 5% of pre-tax earnings, 2019
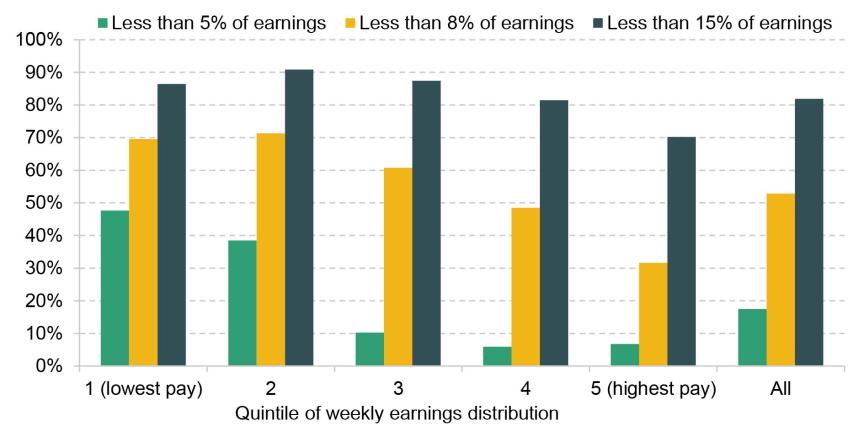
Note: Includes private sector employees aged 22–64 who are an active member of a workplace pension.
Source: Authors’ calculations using the Annual Survey of Hours and Earnings, 2019.
Almost all (82%) private sector pension participants have contributions of less than 15% of earnings (and 87% of middle earners), roughly the level that the Pensions Commission judged many should aim to be saving for retirement[3]. Even amongst the highest-earning fifth, 70% have contributions of less than 15%. Just over half (53%) of private sector employees contributing to a workplace pension have total contributions of less than 8% of total earnings, and around one-in-six (17%) have less than 5%. The fraction with low contribution rates is much higher amongst low earners, likely in part because for them qualifying earnings are a smaller share of their total earnings, but even for middle earners six-in-ten (61%) have contributions of less than 8% of earnings.
A key difference between high earners and those on middle or lower earnings is the role played by employer contributions. Figure A1 in the appendix shows that higher earners make higher individual contributions (as a percentage of their – higher – salaries) but also receive considerably more in employer contributions, averaging over 8% of total earnings for the highest-paid fifth from employer contributions alone, compared with 5% for the middle-earning fifth and less than that for the lowest earners. These employer contributions are particularly tax-favoured as they escape both employer and employee National Insurance contributions entirely.
All in all, saving enough for retirement appears to be an issue for many private sector employees, particularly those on average earnings, who are not so poor that the state pension would provide an adequate replacement rate, but are not high earners who are more likely to receive higher employer contributions and to accumulate substantial levels of pension and other types of wealth. We are not alone in the concern for middle earners (in particular) undersaving for retirement, with this concern underlying various proposals, including the ‘Living Pension’ campaign (see Cominetti and Odamtten (2022) for an assessment of whether workers’ pension saving meets this level) and the PLSA’s work on the Retirement Living Standards (e.g. Pensions and Lifetime Savings Association, 2023).
Of course, this is only a snapshot of pension saving. Seeing many employees making low rates of contributions in a given year might not be concerning if it were the case that they tended to make very large contributions on an infrequent basis. Indeed, such behaviour might be appropriate: we might expect individuals to save large amounts during times when their incomes were particularly high and/or their spending needs particularly low. But evidence from looking at the pension saving behaviour of the same employees over time suggests that the share of earnings saved tends not to vary much at all over time, and is generally unresponsive to changes in pay, up-front tax incentives or changes in individuals’ lives such as having children or paying off a mortgage (Cribb and O’Brien, 2023).
It is not only the cash amount entering pensions for private sector employees that is concerning. All of the rise in pension participation for private sector employees that has occurred since the introduction of automatic enrolment has come in the form of defined contribution pension plans, as shown in Figure 5. Defined contribution (DC) plans, as the name suggests, are plans where the employer and employee agree set contribution rates for pension saving, and the employee will in this way build their pension investment pot and can decide how to access it later in life. There is, therefore, no promise of the pension income these pots will provide. This contrasts with defined benefit (DB) plans, where the employer makes a promise of a stream of income in retirement (until death). Employees have to make a set contribution in order to be a member of the arrangement, and employers will then top this contribution up with what is deemed to be needed to ensure that the plan as a whole is appropriately funded to meet its obligations.
Figure 5. Percentage of private sector employees participating in defined benefit and defined contribution workplace pensions
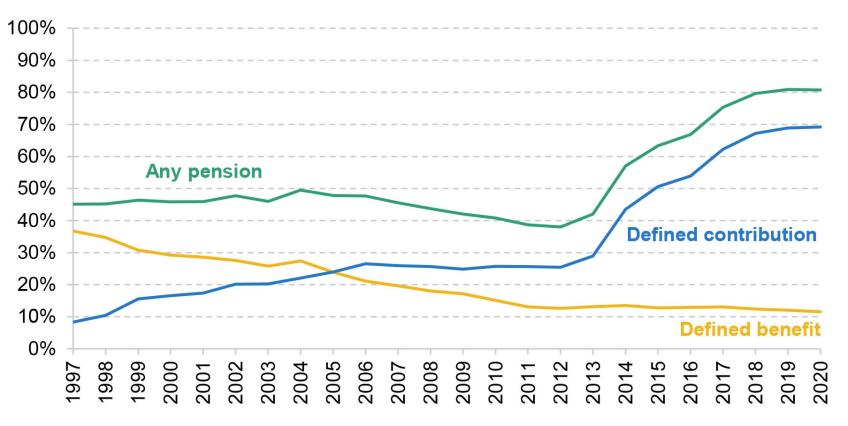
Note: Private sector employees aged 22–59.
Source: Authors’ calculations using the Annual Survey of Hours and Earnings, 1997–2020.
The data from 2020 show that 69% of working-age private sector employees save in a DC pension (66% of women, 72% of men) and just 12% (same for both men and women) in a DB plan. Many of those outside the public sector who are enrolled in a DB arrangement will be members of the large university DB plan (the Universities Superannuation Scheme, USS). Looking at private sector employees – but excluding non-profit institutions such as universities – DB pension participation was just 7% in 2021 (Office for National Statistics, 2022c), compared with around 30% in the early 1990s and 35% in the early 1980s (Pensions Commission, 2004). DC pensions can provide individuals with lots of flexibility over how much to contribute, where those funds are invested, and how they are decumulated through retirement. But – at least formally – they also expose members to much more risk, specifically in terms of investment return and longevity, than DB pensions.
At the same time as the shift from DB to DC arrangements transferred investment risk from employers to employees, asset returns have fallen to historically low levels. The eventual size of an individual’s pension pot will depend solely on the contributions made during working life and the returns on those contributions over time.
In order to understand the scale of the changes in potential rates of return on investments since the Pensions Commission reported, we can look at the maximum rates of return that the Financial Conduct Authority (FCA) allows financial services companies to use in the calculations they present to retail customers (Financial Conduct Authority, 2017). In the context of pension saving, these rates can help consumers get a sense of the retirement income they might expect. The ceiling on projected rates of return aims to prevent consumers being misled by inappropriately high rates.
These prescribed rates of return were reviewed by PwC in 2003, 2007, 2012 and 2017, in order to assess whether they were still appropriate given market conditions at the time. As a result of these reviews, in 2014 the FCA reduced the maximum nominal rate of return that can be used for projecting future benefits from private pensions from 7% to 5%, in line with PwC’s recommendations.
Figure 6 illustrates changes in the underlying rates of return that PwC used in arriving at its recommendations, compared with the rates of return assumed by the Pensions Commission in its modelling of future pension incomes. The rates assumed by PwC give a sense of what the FCA thinks are sensible projections for long-term asset returns under the market conditions at the time. Figure 6 clearly illustrates that the returns assumptions used in the Pensions Commission modelling are no longer applicable – the real rates of return assumed by the Pensions Commission were 2.5 percentage points (ppt) higher for government bonds, 2.4 ppt higher for corporate bonds and 2.0 ppt higher for equity markets than PwC’s latest central projections.
Figure 6. Changes in projected real rates of return over time, compared with Pensions Commission assumptions
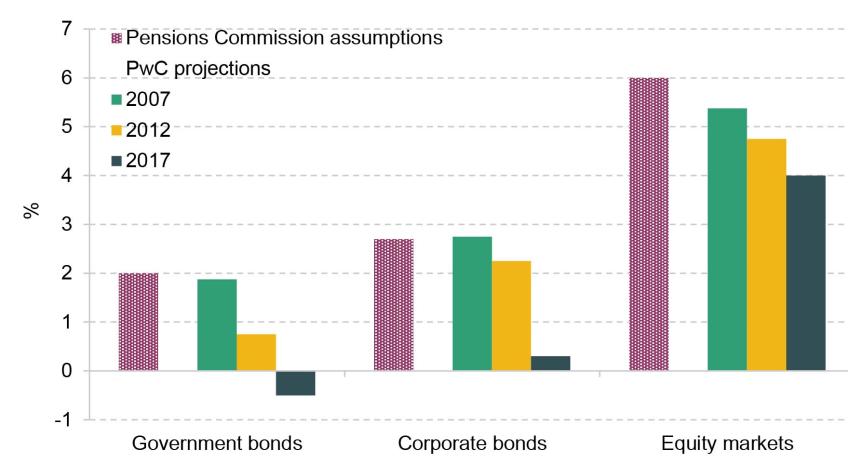
Note: Pensions Commission assumptions are the base-case assumptions for modelling future incomes. PwC projections are from the review of prescribed rates of return assume mid-point of the range provided.
Source: Pensions Commission, 2004; Financial Services Authority, 2012; Financial Conduct Authority, 2017.
Both historically and at the moment, employer contributions into DB plans tend to be significantly higher than those into DC pensions; indeed, one key reason why private sector employers have shifted from providing DB to instead offering DC arrangements is so that they can reduce their expected pension contributions, as well as their exposure to the risk that these contributions may have to vary substantially over time. In addition, looking over a longer period (rather than just a snapshot) may introduce particular worries regarding the decline of DB pensions and the (later) rise in DC arrangements. For example, the Work and Pensions Select Committee (2022) argues that we should be particularly – but not only – concerned about working-age people in their 40s (and older) who had limited opportunities to join DB pension plans, but also have had less time prior to retirement to build up significant DC pension wealth compared with younger generations who will save in DC arrangements over a longer period.
Challenges from the labour market
On top of low contributions being made by many private sector employees under automatic enrolment, there are further key challenges stemming from the labour market. Figure 7 shows there have been substantial increases in self-employment in the UK, at least in the run-up to the pandemic. At the same time, the number of self-employed workers who are saving in a workplace pension halved from 1.6 million (46% of the self-employed) in 1998 to 1.2 million (32%) when the Pensions Commission reported in 2005 to only 0.8 million in 2019 (17%) at a time when the self-employed workforce grew by 1.4 million people. This is a remarkable decline. The number of self-employed people fell back in 2020 as a result of the pandemic, though the fraction saving in a pension remained almost unchanged, at 18%. Overall, we have many more self-employed than in the late 1990s doing, in aggregate, far less pension saving. Moreover, it does not appear that other financial assets are acting as a substitute for pension saving among the self-employed. Crawford and Karjalainen (2020) find that over the last 20 years the proportion of individuals saving in either a pension, savings account, ISA or shares declined, and more rapidly for the self-employed than for employees.
Figure 7. Number of self-employed people participating, and not participating, in a private pension
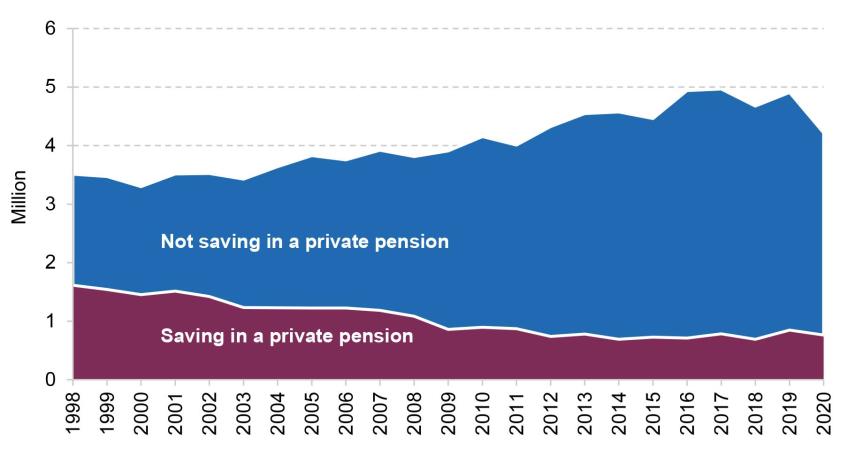
Source: Authors’ calculations using the Family Resources Survey, 1998–2020.
Were these patterns driven by an increase in those who are only self-employed for a short period – who might therefore save relatively bigger amounts in other years when they were conventionally employed – then these trends might not be so concerning. But evidence presented by Crawford and Karjalainen (2020) suggests that the sharp drop in the pension saving rate among the self-employed over the last two decades is particularly large among the long-term self-employed (that is, those who have been self-employed more than seven years, which is about half of the self-employed). Moreover, there is evidence that the self-employed who do contribute to a pension often leave their contributions unchanged for extended periods: one-in-two contribute the same cash amount in one year as the last, and remarkably one-in-four contribute the same cash amount as nine years earlier (Cribb and Karjalainen, 2023). It is also the case that, particularly for middle-earnings self-employed savers, the amounts placed in a pension tend to be low compared with the pension contributions made by employees, or by their employers on their behalf, on similar incomes.
The combination of the growth of the self-employed, the precipitous fall in pension saving rates among the self-employed, and the persistently low contributions among many of the self-employed who do save in a pension, acts to push up the number of working-age people who are likely to rely mainly on state, rather than private, pensions for income in retirement.
Challenges from the housing market
Issues in the housing market also threaten to play an increasingly problematic role in the adequacy of retirement incomes. Much of the debate around changes in housing tenure has focused on declines in homeownership rates among younger adults – which have been particularly sharp among middle earners. But when thinking about future retirement resources, it is more instructive to look at the fraction of people who are living in private rented accommodation. Most owner-occupiers pay off their mortgage by retirement, and therefore face low housing costs thereafter. But in addition, people living in social housing face low rents which are often fully covered by housing benefit (and indeed for those in social housing who are deemed to have more bedrooms than they need, their means-tested housing support can increase when they reach the state pension age as that restriction only applies to working-age individuals). The more pressing concern is the growing number of private renters approaching older ages – private rents are relatively high and often have insecure tenancies which can be particularly unsuitable for older people with multiple health and/or mobility issues.
Figure 8 shows that for those born in the 1930s and 1940s less than 5% of the population were private renters in their late 60s and early 70s, while among those born in the 1950s only 6% were private renters in their mid 60s. These are the rates of private renting seen among retirees at the moment. For those born in the 1960s, the fraction who are private renters has been stuck at 10% for around three decades and, now in their mid 50s, shows no clear signs of falling. So we might expect the share reaching retirement while in private rented accommodation to double over the next decade.
Figure 8. Percentage of people living in private rented accommodation, by age and decade of birth
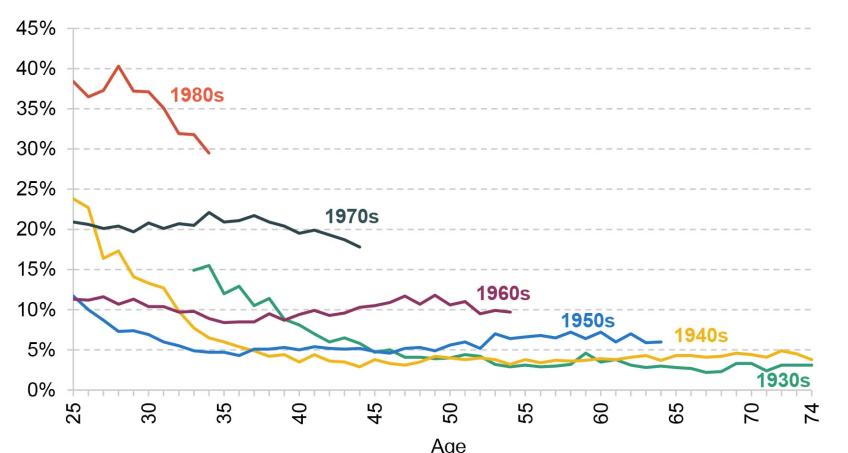
Note: Age is median age of the generation in the year of observation.
Source: Authors’ calculations using the Family Resources Survey and Family Expenditure Survey, 1968–2019.
The potential for higher rates of private renting amongst those approaching retirement is even greater for younger generations, though there is considerably more uncertainty about how these patterns will evolve for them. Among those born in the 1970s, of whom about 18% were in private rented accommodation by the time they reached their mid 40s, it would not be surprising if rates remained around 15%. Overall, these trends mean a growing fraction of the population will have to save for a retirement that includes paying rent each month. This will also have direct implications for state support as part of these rents will likely be covered by housing benefit.
One trend that might counteract or mitigate this is the rising expected importance of inheritance for younger generations. Cribb (2019) shows that of those born in the 1940s, just under a third received an inheritance, whereas over two-thirds of those born in the 1970s have received, or expect to receive, an inheritance. The average age of receiving an inheritance is expected to be 62 for those born in the 1970s (Bourquin, Joyce and Sturrock, 2020), meaning that some private renters may be able to purchase a home outright later in life following the receipt of an inheritance. However, two factors that may limit the ability for this to play a substantial role will be the fact that relatively few will inherit to purchase a home outright and those who are most likely to receive significant inheritances are likely to be richer themselves, and therefore likely to be already homeowners.
Challenges resulting from changes in public policy
There are also new challenges that come from changes to public policy. As noted earlier, there were a number of significant policy changes in the early and mid 2010s that are particularly relevant to retirement saving. Perhaps most obvious is the state pension age, which rose for women from 60 to 65 between 2010 and 2018 and subsequently from 65 to 66 for men and women between 2018 and 2020. Evidence shows that a significant number of women and men responded to the reform by delaying their retirement (and thereby typically boosted their earnings by more than the state pension they will have lost). It also shows that the majority did not adjust their labour market activity in response to the reform and therefore the reform reduced their weekly income – typically by a bigger share among low- and middle-income households who are usually more reliant on the state pension (Cribb, Emmerson and O’Brien, 2022; Cribb and O’Brien, 2022). More generally, the significant increases in the real value of the state pension over time, and reductions to the generosity of the working-age benefit system, have made the state pension age increasingly important as a point when financial circumstances change.
Figure 9 shows the evolution over time of the share of men (solid lines) and women (dashed lines) in paid work at older ages. The increase in the employment rate arising in response to the rise in the state pension age can be seen by the sharp increase in the percentage of women aged 60–64 in paid work between 2010 and 2018 (i.e. the period in which the female state pension age rose from 60 to 65). Notwithstanding the fall in employment – and increase in economic inactivity – seen since the pandemic, it is clear that the employment rate of older women is still close to record levels.
Figure 9. Percentage of people aged 55–59, 60–64 and 65–69 in employment, by sex
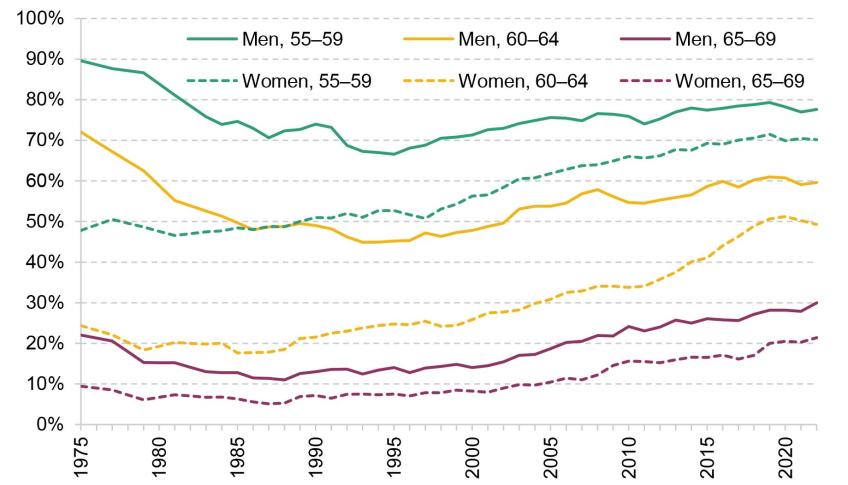
Source: Authors’ calculations using the Labour Force Survey, 1975–2022.
The employment rate for 65- to 69-year-old men, and that for women of the same age, are also historically high. This means that an increasing number receive income from both the state pension and employment. Among older men aged 55–59 and 60–64, employment rates have generally been rising since around the mid 1990s, but the sharp falls seen in the first half of the 1980s mean that their employment rates have only recovered to the levels seen around the start of that decade. This is particularly remarkable considering that, on average, men aged 55–64 in the late 1970s will have been in worse health – and often working in more physically demanding industries – than men at the same ages today (Banks, Emmerson and Tetlow, 2019).
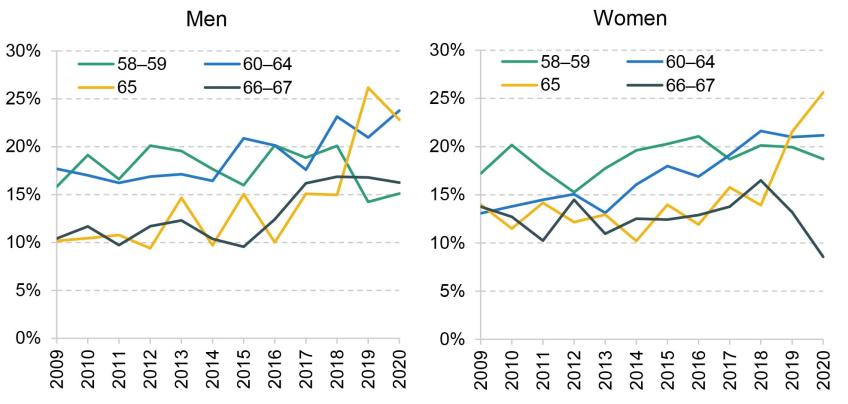
Despite the increase in employment rates occurring in response to increases in the state pension age, the fact that many people do not respond, combined with the fact that since 2010 the working-age benefit system has been made less generous relative to the state pension system, has led to increasing numbers approaching the state pension age being on low household incomes. Figure 10 shows this by displaying relative household income poverty rates for men and women aged in their late 50s and early-to-mid 60s since 2009.
Figure 10. Relative income poverty rates (after deducting housing costs), by age and sex
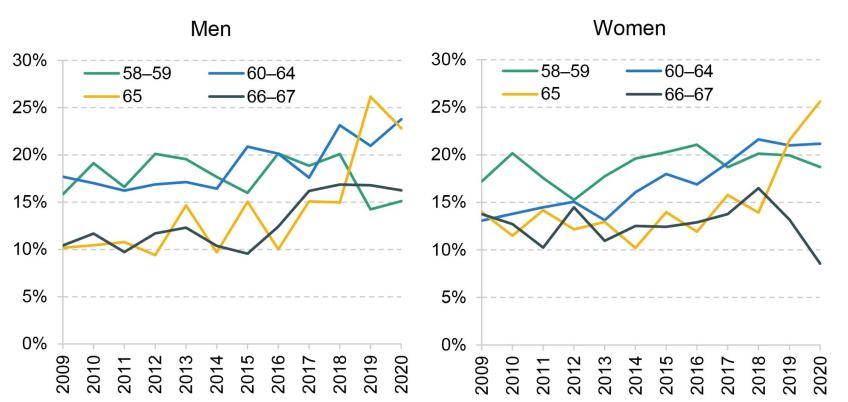
Note: Relative income poverty defined as income less than 60% of contemporary median income, after adjusting for differences in housing costs.
Source: Authors’ calculations using the Family Resources Survey, 2009–20.
Among women, it is clear that the poverty rate of those aged 60–64 increased between 2010 and 2018 – when the female state pension was increased from 60 to 65 – while rates at older and younger ages (and therefore not directly affected by the rising state pension age) were more stable. Then, between 2018 and 2020, there is a sharp rise in the poverty rate among 65-year-old women at the same time as their state pension age rose from 65 to 66. This latter effect can also be seen among men: the poverty rate among 65-year-old men rose sharply between 2018 and 2020 (i.e. when their state pension age also rose from 65 to 66). A more formal statistical test was done by Cribb and O’Brien (2022) and they found the increase in the state pension age from 65 to 66 pushed up the poverty rate among 65-year-olds by 14 percentage points. These trends beg the question: ‘To what extent can, or should, the government act to support those on low incomes in their 60s, who previously would have been eligible for a state pension, particularly those who are unable to work – for example, due to having work-limiting health conditions?’.
The shares classified as disabled (i.e. having a longstanding health condition that has a substantial negative effect on their daily life), by age, sex and education level, are presented in Figure 11. They increase from the late 30s onwards, and are higher for women than for men. Among those in their late 60s, 35% of men and 40% of women are disabled. There is also a very sharp gradient with education levels: at each age, those with lower levels of formal qualifications have higher rates of disability. For example, taking those in their late 60s who have at most a GCSE qualification (or equivalent), 43% of men and 46% of women are disabled. In contrast, disability rates are much lower among those with a degree qualification. As a result, for both men and women, disability rates among those with a degree in their late 60s are similar to those seen among those with at most GCSE qualifications who are 30 years younger.
Figure 11. Percentage of people who are disabled, by age, sex and education, 2022
Note: Disability is measured in line with the definition of the Equality Act 2010 as having a physical or mental impairment that has a substantial and long-term negative effect on one’s ability to do normal daily activities.
Source: Authors’ calculations using the Labour Force Survey, 2022.
Pensions and public finances
The key tension here, of course, is that the rise in the state pension age is designed to reduce household dependence on the state for people in their late 60s, and from a public finance perspective it is a coherent response to rising life expectancy at older ages. Any extra financial support for affected households would reduce the public finance benefits of a higher state pension age. As is shown in Figure 12, the public finance pressures of ageing, including the state pension, are substantial. The graph assumes that the triple lock remains in place and that state pension age rises to 67 by 2028, to 68 by 2039 (under prior plans to bring it forward from 2046 which have now been pushed back – see Cribb et al. (2023)) and further increases beyond that in line with growth in life expectancy.
Figure 12. OBR projections of spending on state pensions and other pensioner benefits, and on health and social care
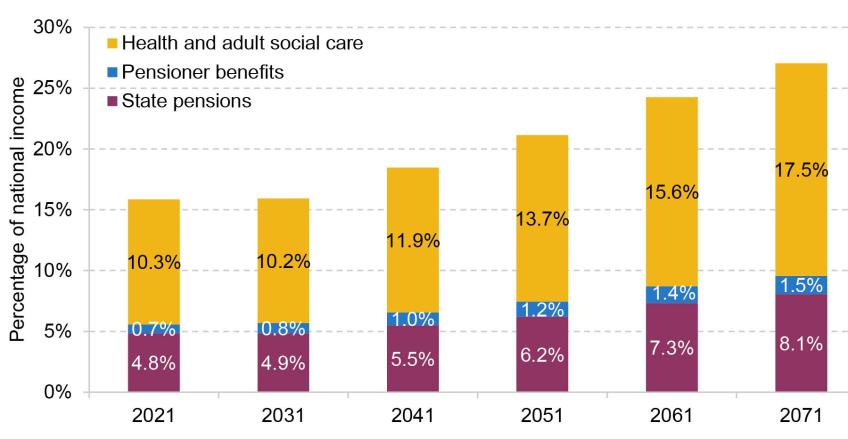
Source: Table 4.9 of Office for Budget Responsibility (2022).
The latest projections from the Office for Budget Responsibility (2022) imply that spending on state pensions and other pensioner benefits will remain relatively flat over this decade, with state pension spending just under 5% of national income and pensioner benefit spending (which includes things such as housing benefit for low-income pensioners living in rented accommodation, and attendance allowance for those deemed to have a severe disability) just below 1% of national income. But, in combination, they will then rise sharply, by 4% of national income, over the following 40 years (together reaching 9.6% of national income in 2071). A 4% of national income rise is equivalent to about £100 billion a year in today’s terms. Recognising this challenge, the recent Independent Review of the State Pension Age (2023) suggested a cap of 6% of national income on spending on state pensions (though – oddly – did not include pensioner benefits). Based on the OBR’s analysis from 2022, without further increases in the state pension age, reductions in generosity of indexation, or other measures, this proposed limit would be breached before 2051.
The public finance challenge of this spending pressure comes alongside the – even larger – pressure placed by greater need for health and social care with an increasingly old population and rising cost pressures over time. The OBR projects state spending on health and social care to rise from 10.3% of national income in 2021 to 13.7% in 2051 and 17.5% in 2071. Overall, this would leave spending on state pensions and pensioner benefits and on health and adult social care at 27.1% of national income in 2071, up 71% from the 15.8% spent in 2021.
The public finance burden of the ageing population should not be surprising given the overall demographic changes in the UK over the last decades. Figure 13 shows the fraction of adults (aged 20+) who are aged 65 or above, and the fraction who are over state pension age. The fraction of the adult population aged 65 or above has risen from 21% to 24% between 2005 and 2020 and it is projected to rise to 31% in 2050 and 34% in 2070. The fraction who are over state pension age has actually remained remarkably constant in recent decades, despite the ageing population, because of rises in the state pension age. In fact, the fraction over state pension age in 2020 – at 23.1% – was actually lower than at any point in the last 50 years. However, this fraction is projected to increase to 27% in 2050 and 30% in 2070. Unless mortality rates are higher than expected, then, absent further increases in the state pension age, the most likely factors that could prevent this are higher fertility and/or higher net inwards migration of working-age adults. As an illustration of the extent to which the population is ageing, in 2050 a state pension age as high as 70 would be required to keep the share of adults aged over the state pension age at its current rate of 24%.
Figure 13. Percentage of the adult (aged 20+) population that is aged 65 or over, or is aged above state pension age, 1971 to 2020 (out-turn) and to 2070 (projected)
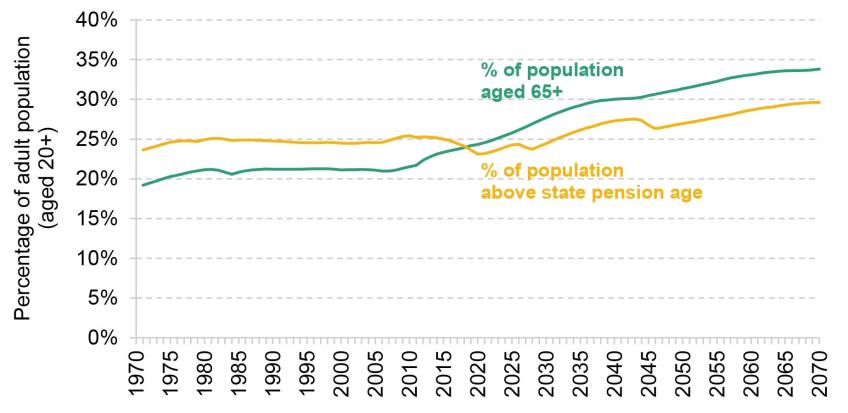
Note: Assumes state pension age rises in line with legislation in the Pensions Act 2014 so that it rises from 66 to 67 between 2026 and 2028 and from 67 to 68 between 2044 and 2046.
Source: Authors’ calculations using ONS’s ‘Population estimates for the UK and constituent countries by sex and age: historical time series’ and ONS’s ‘2020-based interim national population projections’.
Of course, there is much uncertainty around demographic forecasts: until recently, successive forecasts have tended to revise up life expectancy as improvements in longevity at older ages proved to be more persistent than previously assumed. But in the last decade, this pattern has reversed: while longevity is still increasing, it is now not expected to increase by as much as previously assumed.
To put these challenges in context, Figure 14 shows the importance of state and private pension income, as a fraction of national income in 2017, as compared with other developed countries. The figure uses a slightly different definition from Figure 12 (it does not include cash benefits received by pensioners other than the state pension) to aid comparison between countries. Income from state and private pensions varies from 9.0% of national income in Australia to 16.8% of national income in Italy. The UK is in the lower half, just above the Netherlands and just below Germany and Spain. Lots of factors will create this variation, most obviously the age structure of the population.
Figure 14. Public and private spending on pension benefits, in EU15 and other major industrialised economies, as a share of GDP, 2017
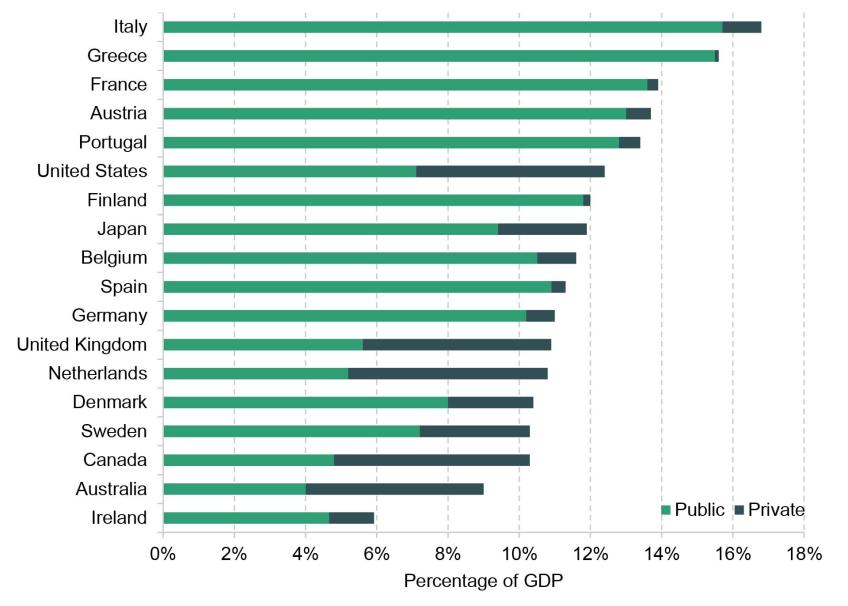
Note: Private pension spending is the flow of payments to pensioners, not the contributions made in working life. Countries are ranked by total spending (public and private) as a percentage of GDP. Numbers for Ireland are expressed as a percentage of GNP as Irish GDP is 26% higher than GNP due to income received by multinationals.
Source: Table 8.4 of OECD (2021). EU15 countries plus Australia, Canada, Japan and the US. Figures for Luxembourg not available.
State pensions in the UK are a relatively low 5.6% of national income, which is similar to – but slightly above – those in Canada and the Netherlands. The UK, Canada and the Netherlands – along with the US – have relatively high private pension incomes. But typically the higher private pension income in these countries is not sufficient to make up for the lower income from public pensions. The US is an outlier in that it does have a relatively high total pension income despite having a relatively low public pension income. The relatively low public pension income in the UK, Canada and the Netherlands, along with that in Australia (where the state pension is means-tested), is associated with lower overall pension income. Indeed, many of the countries where total income from public and private pensions is a relatively high share of national income tend to have a higher proportion of that share from public pensions: in Portugal, Austria, France and Greece, public pension income is 95% or more of total pension income.
The UK system therefore relies much more on employer and individual contributions to private pensions than many countries. But it also places the UK public finances in a better place to weather the difficulties of an ageing population. As measured by old-age dependency ratios, the demographic challenge is also less problematic in the UK than in some other countries (notably Japan, South Korea, Italy and Spain) in terms of both the projected level of the old-age dependency ratio in 2075, and its rise between now and 2075, but more problematic than in younger countries (helped by higher fertility and/or immigration) such as the US and Australia (see OECD (2023b)).
Decumulation in retirement
So far, we have focused on the challenges facing people accumulating enough for retirement given the circumstances facing them, the degree of state support provided to older people and the cost of such support to the public finances. But irrespective of the amount of wealth individuals approach retirement with, and the level of state support provided, they face important financial decisions that their predecessors did not, due to the rise of defined contribution pensions, the decline of defined benefit pensions and the introduction of new pension freedoms.
Until 2014, there was an effective requirement for most people with DC pension pots to annuitise their DC wealth by the age of 75. However, in a surprise announcement in 2014, the government announced the removal of this requirement. Since 2015, anyone aged 55 or over (57 from April 2028) can draw on their DC pension pot in any way they like.
Figure 15 shows the number of annuity and drawdown purchases using data from the Association of British Insurers (ABI) since 2007. The announcement and introduction of pension freedoms precipitated an enormous decline in annuity purchases, and a smaller rise of pensions in drawdown. A large number of people have withdrawn pension pots in full, particularly those with less than £10,000 in a pot (Financial Conduct Authority, 2022). Annuities provide a known income stream and longevity insurance. As a result, they might help individuals manage their resources through retirement: for example, all of the income from an inflation-linked annuity could be spent each year in the knowledge that the same level of real-terms spending could be maintained through to the end of life regardless of how long that might be. Evidence suggests that such a flat real profile through retirement – rather than, say, a declining spending profile – might, on average, be appropriate (Crawford, Karjalainen and Sturrock, 2022).
Figure 15. Number of annuity and drawdown purchases
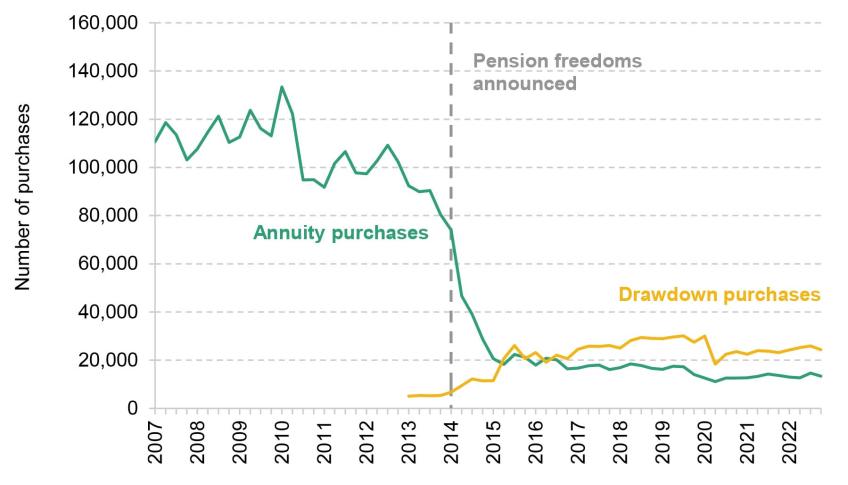
Source: Association of British Insurers - Quarterly Pension Annuities – 2022Q4 and Quarterly New Long-Term Business (Pensions) – 2022Q4. Copyright of the ABI.
A further challenge comes from the fact that decumulation decisions need to be made with respect to what, on average, will be many years of retirement. At the current state pension age of 66, on average men are currently expected to live for another 19 years (until age 85) and women for another 21 years (until age 87). The challenge of making good decumulation decisions is made harder by the fact that some will die much younger, while others will live much longer. This variation is described in Figure 16, which shows the share of people aged 66 in 2023 who are expected to make it to each successive age, split between men and women, according to the latest ONS life tables (2020). The graph shows that 15% of men, and 10% of women, alive at age 66 are expected to die before age 75. On the other hand, 32% of men, and 42% of women, alive at 66 are expected to make it to 90, with 13% of men and 20% of women making it to 95 from 66.
Figure 16. Share of 66-year-olds in 2023 who can expect to still be alive at each age, by sex
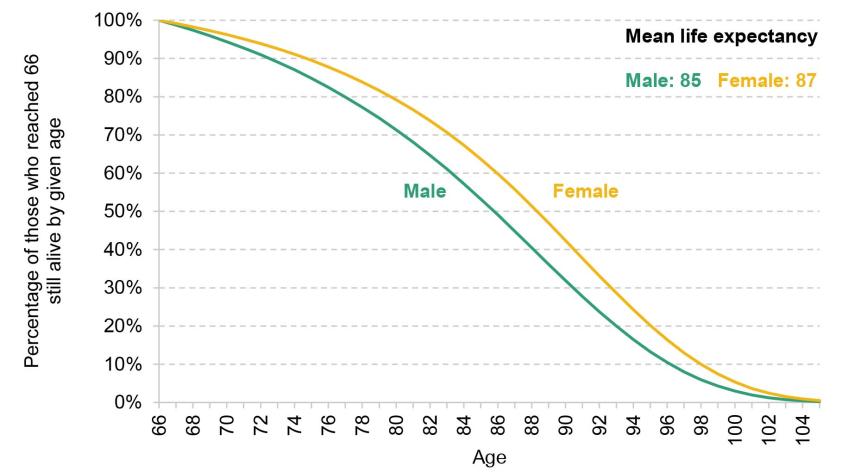
Source: Authors’ calculations using UK cohort life expectancies, taken from 2020-based life tables (https://www.ons.gov.uk/peoplepopulationandcommunity/birthsdeathsandmarriages/lifeexpectancies/datasets/expectationoflifeprincipalprojectionunitedkingdom).
Pension freedoms allow people to take advantage of more control over their finances, income and expenditure in retirement. And many might do so in ways that make them better off. But to do this successfully is likely to require individuals to make significant financial decisions at older ages. And doing it wrong could mean individuals either spending too little each year and therefore inappropriately forgoing valuable consumption opportunities or spending too much and potentially exhausting their resources too soon. Trading off the risk of overspending out of an accumulated pension pot against the risk of underspending is difficult, at least without using the pot to purchase an annuity which provides insurance against living much longer than expected and, potentially, certainty over the income that will be received in each year until death.
Managing decumulation of pension pots well without the security provided by an annuity could well prove challenging for a substantial proportion of the older population. Even for the most numerate people, decisions – taken under a huge amount of uncertainty – about the use of wealth in retirement are immensely difficult. And as in many countries (Lusardi and Mitchell, 2011), financial literacy rates are low in the UK. Furthermore, around 30% of people in their 70s are recognised as having some form of cognitive impairment, compared with less than 10% of those in their 60s (Cadar, Abell and Steptoe, 2020). All in all, this raises questions of whether people need more support navigating the possibilities that pension freedoms provide for the structure of private pension incomes in retirement and whether there would be advantages in encouraging individuals to make decisions at younger ages prior to the onset of cognitive decline.
Summary
This section has argued against complacency regarding the pensions of future generations and their financial security in retirement. In most cases, challenges are larger for younger generations who are currently further from retirement: unless they work in the public sector, they are less likely to ever have saved in a (more generous) defined benefit pension; they are less likely to be able to get onto the housing ladder and more likely to reside in private rented accommodation; they are likely to face a higher state pension age and the extra uncertainty that comes with the ageing population placing greater stress on public finances. The pension wealth that they do accumulate in defined contribution arrangements will need to be managed carefully not just through working life but also throughout old age to ensure they benefit from the flexibilities of pension freedoms and minimise the chances that they make decisions they subsequently regret – or that they shy away from making decisions at all. But the fact that the largest challenges are for those furthest from retirement also means that there is greater time, and scope for public policy, to address these challenges and help secure better outcomes in retirement for these generations.
3. Introducing the Pensions Review
Faced with the challenges for the future generations of pensioners, we are working with the abrdn Financial Fairness Trust which is funding a major project reviewing the UK pension system and the future of financial security in retirement.
The Pensions Review is a multi-year project that will comprehensively assess the consequences of current pension policy, the economic environment and individual behaviour for living standards in retirement. Ultimately, we will provide recommendations for reform to improve outcomes for future generations of pensioners across the UK.
The review is led by three of the authors of this report: Jonathan Cribb, Carl Emmerson and Paul Johnson. With colleagues at IFS, we will systematically review the evidence on the challenges facing future pensioners and undertake careful empirical analysis to understand recent economic trends and how people have responded to previous pension reforms. In addition, we will engage with policymakers, employers, trade unions, those in the pensions industry and other stakeholders representing different groups in society to understand the key challenges and trade-offs.
We will work with abrdn Financial Fairness Trust to commission opinion polling and public engagement activities to understand how people from across the country see the challenges of funding their own retirements, and gather their thoughts on potential routes for reform.
The Review will centre on three key questions which we will explore in depth:
- Are people saving appropriately for retirement, in terms of both the amount and the form of saving, and if not, how can government policies help?
- How should the state support people from late working life into and through retirement?
- Do people require more assistance to use their wealth appropriately through retirement?
A cross-cutting theme will be the extent to which the risks placed on individuals are ones that they are well placed to manage, or whether there is more that others – employers, insurance companies or government – should do to assist. We will also consider how economic trends and the impact of policy changes vary across different people. For example, we will examine how challenges and potential policies would affect people on different levels of incomes, undertaking different types of work, or living in different parts of the UK. We will also examine differences between men and women, and people of different ethnicities, amongst other characteristics.
We are guided by a highly qualified steering group: Alistair Darling (former Chancellor of the Exchequer, and the Chair of the abrdn Financial Fairness Trust), David Gauke (former Secretary of State for Work and Pensions) and Joanne Segars (former CEO of the Pensions and Lifetime Savings Association). This senior steering group will provide high-level strategic advice on the direction of the Review and on the merits and drawbacks of policy options that emerge from our work. In addition, we will engage with stakeholders in a series of advisory groups reflecting a range of opinions and interests from across the public, private and third sectors.
Preliminary findings will be published over the next two years, with the first main report expected in Autumn 2023. We plan to publish our key findings and recommendations for reform at launch events in London and Edinburgh in early Summer 2025. Following this, we will continue to disseminate our findings and recommendations over the subsequent two years.
The world has changed in many – some very unexpected – ways in the nearly two decades since Lord Turner’s Pensions Commission reported. We are incredibly excited as an organisation to begin our project of collecting, consolidating and providing important evidence on the next issues facing pensioners in the UK, and giving our recommendations to policymakers on how to best approach those issues. And we are delighted to be working with the abrdn Financial Fairness Trust, and with Alistair Darling, David Gauke and Joanne Segars – and with a wide set of stakeholders – to come up with firm reform proposals that would build on the successful implementation of the Pensions Commission recommendations.
Appendix
Figure A1. Mean employee and employer contributions to workplace pensions (as a percentage of earnings) among private sector employees, 2019
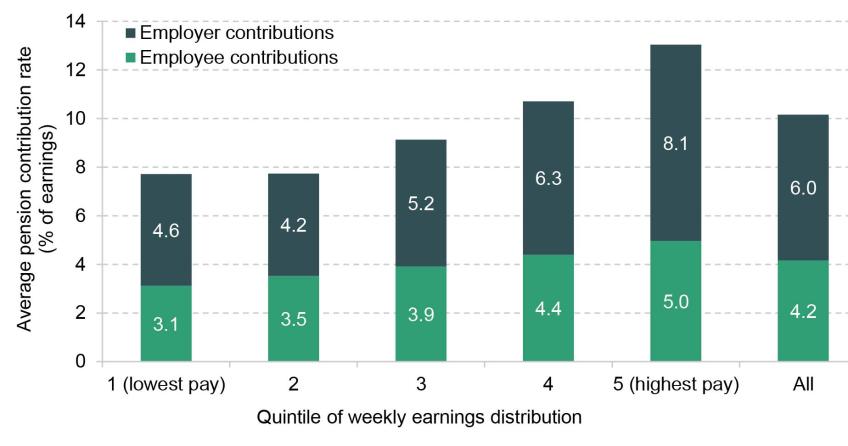
Note: Includes private sector employees aged 22–59 participating in a private pension. Employee contributions include those made through salary sacrifice.
Source: Authors’ calculations using the Annual Survey of Hours and Earnings, 2019.
Footnotes
[1] UK cohort life expectancies for 2023, taken from the latest (2020-based) life tables: https://www.ons.gov.uk/peoplepopulationandcommunity/birthsdeathsandmarriages/lifeexpectancies/datasets/expectationoflifeprincipalprojectionunitedkingdom.
[2] Under the triple lock, state pensions increase each financial year by the greatest of 2½%, consumer price inflation and earnings growth up to September of the previous year.
[3] When automatic enrolment was designed, the Pensions Commission (2005, p. 283) thought that a median earner would need to save roughly the same amount on top of their proposed default minimum rate of 8% of band earnings to get to a reasonable retirement income.
Data
Department for Work and Pensions, NatCen Social Research. (2021). Family Resources Survey, 1994-2020. [data series]. 4th Release. UK Data Service. SN: 200017, DOI: 10.5255/UKDA-Series-200017
Office for National Statistics. (2019). Family Expenditure Survey, 1968-1993. [data series]. 3rd Release. UK Data Service. SN: 200016, DOI: 10.5255/UKDA-Series-200016
Office for National Statistics. (2022). Annual Survey of Hours and Earnings, 1997-2020: Secure Access. [data collection]. 21st Edition. UK Data Service. SN: 6689, DOI: 10.5255/UKDA-SN-6689-20
Office for National Statistics. (2023). Labour Force Survey, 1975-2022. [data series]. 7th Release. UK Data Service. SN: 2000026, DOI: 10.5255/UKDA-Series-2000026
Acknowledgements
The abrdn Financial Fairness Trust has supported this project (grant reference 202206-GR000068) as part of its mission to contribute towards strategic change which improves financial well-being in the UK. Its focus is on tackling financial problems and improving living standards for people on low-to-middle incomes. It is an independent charitable foundation registered in Scotland. Co-funding from the ESRC-funded Centre for the Microeconomic Analysis of Public Policy at IFS (grant number ES/T014334/1) is also gratefully acknowledged. The authors would like to thank Alistair Darling, David Gauke, Mubin Haq and Joanne Segars for useful advice and comments, and David Sturrock for assistance with analysis of life expectancy. This work contains statistical data from the Office for National Statistics (ONS) which are Crown Copyright. The use of the ONS statistical data in this work does not imply the endorsement of the ONS in relation to the interpretation or analysis of the statistical data. This work uses research datasets which may not exactly reproduce National Statistics aggregates.
Authors

Jonathan Cribb
Jonathan joined IFS in 2011. His research areas includes: pensions, ageing and demographic change, public sector pay, housing, and inequalities.


Heidi Karjalainen
Heidi is a Senior Research Economist in the Retirement, Saving & Ageing sector. Her current research is on pensions and saving for retirement.

Laurence O'Brien
Laurence is in the Retirement, Savings and Ageing sector. His work focuses on people’s savings decisions and on economic activity in later life.
More from IFS
Understand this issue


Policy analysis


Academic research


