
Introduction
Media reports this week suggest that the Government is not going to legislate bringing forward the date at which the state pension age is due to rise from age 67 to 68.
Under the Pensions Act 2007, which was passed under the last Labour Government, the state pension age is due to rise from 67 to 68 between 2044 and 2046. But the first
Independent Review of the State Pension Age, led by John Cridland in 2017, recommended that this should be brought forward seven years to 2037-2039. At the time the Government accepted this recommendation but did not legislate for it.
Independent state pension age reviews are legislated to take place every six years, and the Government is currently considering the recommendations of the second review, conducted by Baroness Neville-Rolfe, which is due to be published by the 7th May 2023. The Cridland review sensibly recommended that at least ten years' notice should be given of any increase in the state pension age. Given that the next review is not due until 2029, if a decision is made not to change legislation at this point, then it seems unlikely that the rise in pension age from 67 will happen during the 2030s.
Until the publication of the review due in the next few weeks, the exact rationale behind the Government’s apparent change of view over when the state pension age should rise from 67 to 68 is unclear. In this comment we set out some potential considerations. In particular, we summarise some of the evidence on what the impact of previous increases in the state pension age has been on employment, household incomes, and the public finances. We then relate changes in the state pension age to changes in life expectancy (and its distribution) and provide a concluding discussion.
The state pension system and previous rises in the state pension age
From this April, the state pension is worth £203.85 per week for those eligible for the full new state pension. This is a very important source of income; the majority of pensioner households get over half of their income from the state. The state pension age is the earliest point at which people can claim a state pension. Between 2010 and 2018 the state pension age for women rose from 60 to 65, so that it became the same as that for men. Between 2018 and 2020 it then rose from age 65 to 66 for both men and women. Between 2026 and 2028 it is due to rise to 67.
A variety of other parts of the tax and benefit system also change at the state pension age. For example, those above state pension age become eligible for Winter Fuel Payment and means-tested pensioner benefits as opposed to the less generous working-age benefit system. Those in paid work no longer have to pay employee or self-employed National Insurance contributions.
Previous research into the effect of these state pension age increases found that they led to a significant increase in the employment rates of those directly affected. For example, Cribb, Emmerson and O’Brien (2022) found that the rise in the state pension age from 65 to 66 for men and women led to about an additional 8 out of every 100 65-year-olds being in paid work. That research also found that those delaying their exit from the labour force as a result of the reform were disproportionately living in poorer areas of the country.
Even though more people stayed in work for longer, the result of raising the state pension age from 65 to 66 is to have reduced average incomes of 65 year olds. Cribb and Emmerson (2019) and Cribb and O’Brien (2022) find that the reduction in income from the increased state pension age is similar in cash terms across the income distribution, which is therefore larger in percentage terms for lower income households. Our best estimate is that increasing the state pension age from 65 to 66 increased the absolute poverty rate of 65-year-olds from 10% to 24%. This reflects how much more generously the state treats low income families who are aged just above the state pension age compared to those who are just below it.
On the other side of the coin, the same research estimated the increase in the state pension age from 65 to 66 benefitted the Exchequer by around £5 billion per year between 2018 and 2020. Most of this was simply due to delaying payment of state pensions, although there were also rises in tax revenues coming from people delaying their retirement and an increase in National Insurance contributions being paid by those who would have worked at age 65 regardless of the reform.
The fiscal effects of further increases in the pension age depend on the size of the generations affected, the employment response to the change, and the level of the state pension. For example as triple-lock indexation of the state pension is expected to ratchet up the real level of the state pension over time this will increase the Exchequer gain from any future rise in state pension age. So the Exchequer gain from raising the state pension age, or cost from delaying it, will rise over time. Calculations based on a 2017 Office for Budget Responsibility publication suggest that a one year increase in the SPA in the mid-2040s would save around 0.4% of national income (£10 billion) a year.
Taken together this suggests that a one-year increase in the state pension age in the late 2030s would likely save around £8-9 billion a year in today’s terms, and delaying the planned rise in the state pension age to 68 by seven years would cost at least £50 billion and more likely more than £60 billion over the seven years.
Increases in the state pension age and changes in life expectancy
The Pensions Act 2014 states that the Secretary of State must have regard to life expectancy when reviewing the state pension age, and under the Coalition government (inAutumn Statement 2013) the then Chancellor, George Osborne, said that people should expect to spend up to one third of their adult life receiving state pension. The Cridland Review took a more specific definition of 32% of adult life. There have been reports that falling life expectancy provides one justification for delaying increases in the state pension age.
Changes in male and female life expectancy are shown in Figures 1 and 2 respectively. These show life expectancy at age 50 (so are unaffected by any changes in mortality at younger ages) based on the latest measures of life expectancy (2020 life tables), those made in 2016 (the most recent at the time of the previous review of the state pension age in 2017) and in 2006 (the most recent when the 2007 Pensions Act was legislated).
They show that life expectancy at 50 for people born in a given year has fallen since 2006. For example, a man born in 1971 who made it to age 50 would, under the 2006 projections, be expected to have a life expectancy of 86.3. Under the 2016 projections this had fallen slightly to 85.6. But under the latest 2020 projections it had fallen to 83.9 years. The equivalent figures for a woman born in 1971 who made it to age 50 was from 89.3 under the 2006 projections to 88.1 under the 2016 projections and to 86.7 under the most recent projections.
Despite this reduction in life expectancy for people born in a particular year it is still the case that people born more recently are expected to live longer than their predecessors. This is indicated by the fact that the lines in Figures 1 and 2, despite the downwards revisions over time, are still upwards sloping. A man born in 1971 who made it to age 50 is now expected to live 2.1 years longer than those born 20 years earlier, and 5.8 years longer than those born 40 years earlier. And a woman born in 1971 who made it to age 50 is now expected to live 1.8 years longer than those born 20 years earlier, and 4.4 years longer than those born 40 years earlier.
Figure 1 Male cohort life expectancy at age 50, based on 2006, 2016 and 2020 life tables
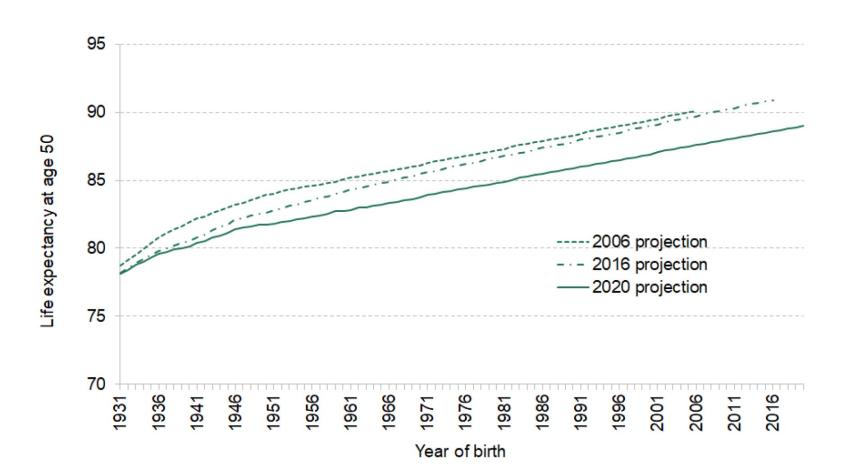
Figure 2 Female cohort life expectancy at age 50, based on 2006, 2016 and 2020 life tables
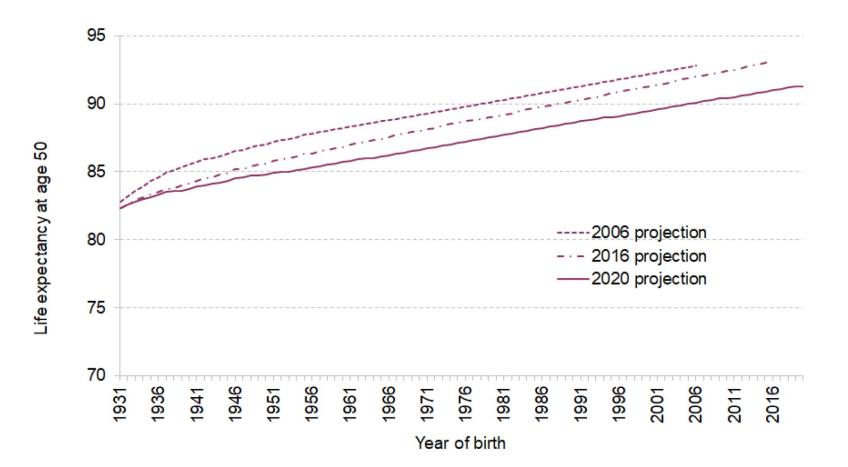
Source: ONS past and projected expectations of life, principal projection, 2006, 2016 and 2020.
Notes: Cohort life expectancy at age 50. Cohort life expectancy projections incorporate future assumed improvements in age-specific mortality.
The figures above show only average life expectancy. Some will die much younger than this, while others will live much longer and, arguably, this inequality in life expectancies should be considered when setting the state pension age. Those who die younger are more likely to be more economically deprived than those who live longer. Figures 3 and 4 compare the distribution of (cohort) life expectancies at age 50 for men and women from different generations, with the state pension ages that they face.
The solid life expectancy line shows the 2020 projections that were presented in Figures 1 and 2. The shaded blue areas show the distribution of life expectancies around this point, specifically each of the eight shades of blue indicating when 10% of individuals are expected to die, with a further 10% not being expected to make it to the lowest lightest shade of blue and 10% being expected to outlive the darkest shade of blue. So taking men born in 1950 the chart is showing that 10% of those alive at age 50 are expected to die before age 65, a further 10% expected to die between 65 and 73, and so on with 10% dying after the age of 95.
The clear message from Figure 3 is that for men born from the late 1940s onwards, among those who make it to age 50, around 10% did not reach the state pension age whereas for earlier birth cohorts a larger proportion of those aged 50 never made it to this point (around 20% of those born in the 1920s, for example).
And regardless of whether the state pension age rises from 67 to 68 in the mid-2040s or sooner it will be the case that on average men who make it to age 50 will be expected to receive the state pension for many more years than was the case in the past. The average number of years of receipt of the state pension will increase from around 9 years for men born in 1910 to 13 years for men born in 1930 to 17 years for those born in 1950 (for all of whom the state pension age remained at age 65) while for those born in 1980 it is still expected to be 17 years even with a rise in the state pension age to 68, though this is less than the 32% of adult life over state pension age considered as a metric by the Cridland Review.
Figure 3 Distribution of male cohort life expectancy, and state pension age, by year of birth
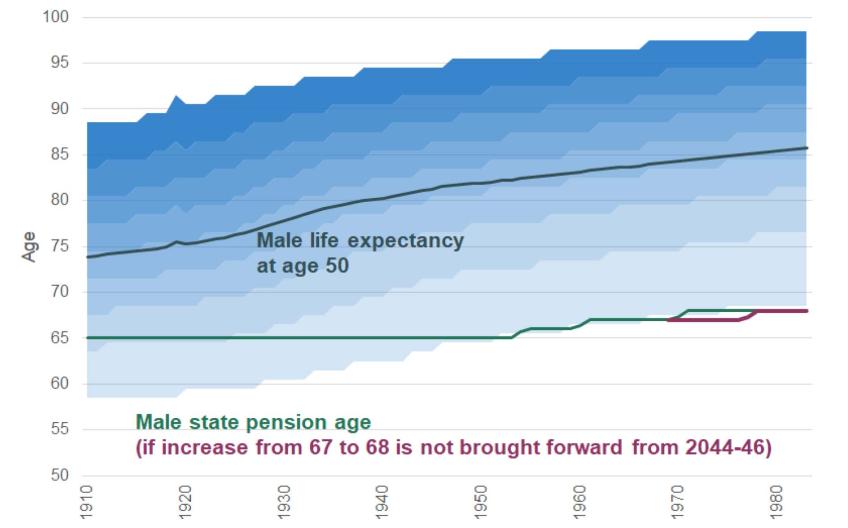
Source: ONS past and projected expectations of life, principal projection 2020.
Notes: Cohort life expectancy at age 50. Cohort life expectancy projections incorporate future assumed improvements in age-specific mortality.
For women the story is slightly different. For those born between 1910 and 1950 the fact that the state pension age for women was lower than that for men, combined with female life expectancies being longer, meant that far fewer women than men aged 50 did not make it to the state pension age and that, on average, women lived for longer above state pension age than men. Equalisation of male and female state pension ages has meant the female state pension age rising by much more than the male one (so far 6 years compared to 1 year).
This has meant that, on average, 50 year old women born in the late 1950s are expected to receive a state pension for less long than 50 year old women born in the late 1940s.
However, taking the full span of generations shown in Figure 4 the rise in female life expectancy at age 50 is of a similar magnitude to the eight year increase in the female state pension age (from 60 to 68): women born in 1910 and women born in 1980, who make it to age 50, are both expected to receive the state pension for about 20 years on average – and a similar (low) proportion are expected not to make it to the state pension age at all.
Figure 4 Distribution of female cohort life expectancy, and state pension age, by year of birth

Source: ONS past and projected expectations of life, principal projection 2020.
Notes: Cohort life expectancy at age 50. Cohort life expectancy projections incorporate future assumed improvements in age-specific mortality.
Concluding discussion
There are many considerations to take into account when setting the state pension age. The fact that life expectancies for each generation are no longer expected to be as high as projected when the first independent review of the state pension age was conducted certainly provides a rationale for not increasing it as swiftly as previously intended. But it is a big call. State pensions – and other benefits that can become payable at the state pension age – are both a major income source for those who receive them and also a big item of government spending. And even with the currently legislated increase in the state pension age to 68 on average men reaching the age of 50 could expect to receive a state pension for 17 years and women for 20 years, though as a fraction of adult life, these are less than the 32% metric considered by the Cridland Review.
A reasonable estimate is that increasing the state pension age by one year in the late 2030s would save the Government £8-£9 billion a year in today’s terms. Demographic pressures are putting strain on the public finances, with increased numbers of people at older ages not only increasing the cost of state pensions but also adding to demands on both health and social care systems. While life expectancies at older ages are now expected to be lower than previously, they are still rising over successive birth cohorts. And increasing the state pension age is certainly a coherent policy response to such increases in longevity.
What is clear is that any decision over the state pension age must be carefully communicated. It may be right that the state pension age should not rise from 67 to 68 as soon as the Government previously indicated. It is certainly right that individuals who are trying to plan for their retirement should be given reasonable notice of any increase. So there is a case for the Government ruling out any increase in the 2030s. But equally the Government should also stress that life expectancy projections will change again. Hopefully subsequent revisions will be on the upside. And the Government should make clear that beyond the 2030s the state pension age remains under review, and that were longevity expectations to be revised upwards then an increase from 67 to 68 could still take place sooner than the mid-2040s.
Authors

Jonathan Cribb
Jonathan joined IFS in 2011. His research areas includes: pensions, ageing and demographic change, public sector pay, housing, and inequalities.


Heidi Karjalainen
Heidi is a Senior Research Economist in the Retirement, Saving & Ageing sector. Her current research is on pensions and saving for retirement.

Laurence O'Brien
Laurence is in the Retirement, Savings and Ageing sector. His work focuses on people’s savings decisions and on economic activity in later life.

More from IFS
Understand this issue


Policy analysis


Academic research


