
Downloads
Download report PDF
PDF | 687.8 KB
In this report, we document differences in pension incomes and pension saving between men and women in the UK, and analyse the drivers behind these differences. In particular, we examine two different ‘gender pension gaps’. First is the gap in average private and state pension incomes between men and women who are already over state pension age. Second is the gap in average pension saving between working-age men and women, with a focus on how this is affected by differences in labour market experiences, and how the gaps differ for private sector employees, public sector employees and the self-employed.
Key findings
Gaps in incomes between men and women over state pension age
1. Men used to receive significantly more state pension income than women, but that gap has almost closed for people reaching state pension age in recent years. While women born in the early 1940s receive around 25% less in state pension income than men on average, this gap is below 5% for those born in the early 1950s.
2. However, the gap in private pension income between men and women over state pension age is wider and has narrowed considerably less. For example, women born in the late 1930s had average gross private pension income almost 60% lower than men during their early 70s; a similar gap existed between men and women born in the late 1940s. There has been a slight narrowing of the gap for those born in the early 1950s to around 45%, however.
Gaps in pension saving between working-age men and women
3. Focusing on 22- to 59-year-olds, we find that 59% of women were saving into a pension in 2019, compared with 66% of men. This gap in pension participation is mainly driven by the fact that women are less likely than men to be in paid work: 77% of both male and female workers are saving in a pension.
4. On average, across all working-age people, women had average total annual pension contributions of £2,600, compared with £3,400 for men. This difference in the amount entering men’s and women’s pension pots will be a direct determinant of differences in private pension incomes among future retirees. The most important driver is differences in average earnings: averaged across all people participating in a pension scheme, women actually contribute a higher proportion of their pay into their pension (15%) than men (13%).
5. The differences in sectoral composition between the male and female workforces work to increase women’s pension contributions compared with men’s. In 2019, 32% of female workers and only 17% of male workers worked in the public sector, where pension participation is high and average contribution rates much larger than in the private sector. In addition, only 10% of female workers are self-employed, compared with 15% of male workers, and less than one in five self-employed workers are saving into a pension.
Gaps in pension saving between male and female employees
6. Looking only at employees, men and women have fairly similar workplace pension participation rates, but this masks important differences between those working in the private sector and those working in the public sector. In the private sector, women have had persistently lower workplace pension participation than men, although automatic enrolment has led to the gap narrowing slightly in recent years from 7 percentage points in 2012 to 5 percentage points in 2020. In the public sector, the gap in workplace pension participation has now disappeared, having been 4 percentage points in 2012.
7. There are also differences in average pension contribution rates between men and women among those saving in a pension in the public and private sectors. In the public sector, there is a gap in average total contribution rates in favour of men which initially widens with age, reaching 2.5% of pay by age 40, but which narrows after age 50. Differences are much smaller in the private sector, with women having a slightly higher average total contribution rate up to their mid 40s, and men having a slightly higher rate thereafter.
8. Differences in pension participation rates and contribution rates (i.e. as a percentage of pay) between male and female employees are predominantly explained by differences in earnings between men and women which also widen with age. The £10,000 annual earnings threshold for automatic enrolment is particularly important in the private sector because more women work part-time and therefore earn less than this amount: there is essentially no gap in pension participation between male and female employees earning over £10,000 per year. In the public sector, differences in contribution rates can be explained by differences in earnings and industry, consistent with fairly rigid contribution structures by earnings in public sector schemes.
Gaps in pension saving between male and female self-employed workers
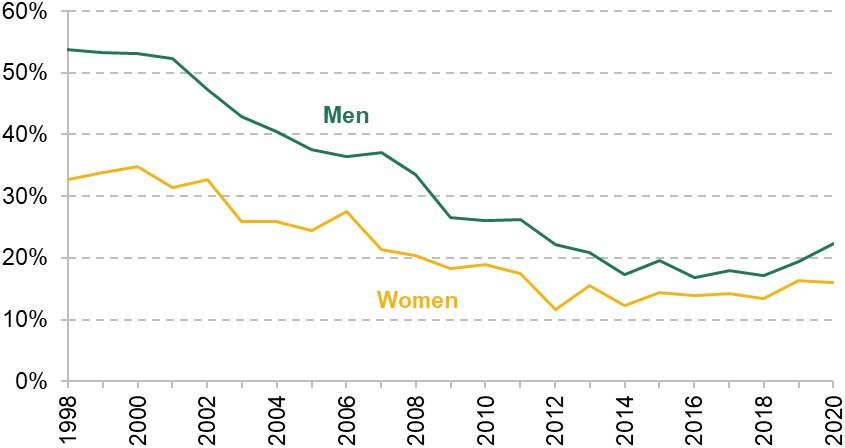
9. The gap in pension participation rates between male and female self-employed workers has fallen considerably over time, from a gap of 21 percentage points in 1998 to only 6 percentage points in 2020. This results from the stark decline in pension participation for self-employed men (especially in the early 2000s), which fell by 31 percentage points from 54% in 1998 to 22% in 2020, compared with a fall of 17 percentage points (33% to 16%) among self-employed women.
10. Gaps in private pension participation and contributions between male and female self-employed workers are smaller once differences in earnings are accounted for. But even after controlling for earnings, self-employed men are more likely to participate in a pension scheme than self-employed women. However, among those participating in a pension, self-employed women contribute as much as, or more than, self-employed men who have similar earnings.
Summary and policy implications
11. These findings show that there is no one single pension saving gender gap, as the size (or existence) of the gap depends on whether we consider all working-age individuals, or focus on different types of workers. Policies aimed at addressing the gender pension gap have to be clear on which gap is going to be targeted. Indeed, differences caused by labour market experiences may well be better addressed by policies designed to affect these labour market differences, rather than using pension saving policy. However, because private retirement incomes are increasingly reliant on defined contribution pensions which are decumulated through retirement, women – who have lower lifetime earnings on average and have longer retirements – are likely to continue to have lower retirement incomes than men.
1. Introduction
One aspect of gender inequality that has received growing interest over the past few years is the ‘gender pension gap’. While there is no single accepted definition of this gap, it is generally used to refer to a gap in retirement incomes between men and women. Low income in later life is a particular concern since individuals at these ages generally have fewer opportunities to boost their incomes by, most obviously, engaging in paid work.
This report, funded by the Nuffield Foundation, draws on new analysis from a range of micro-datasets to understand better the causes of the gender pension gap. We consider first gaps in both state and private pension incomes in retirement. While this analysis identifies clear differences between men and women in retirement, these differences are, of course, the result of very different labour market experiences and wealth accumulation over the course of many decades. The ability of a policymaker who wanted to address such inequalities may be limited to looking at state transfers to older individuals such as the state pension or other benefits. The main focus of this report is to examine disparities in pension saving between men and women of working age. A policymaker concerned with these differences may have a range of policy options, and we provide analysis to show what factors seem to be explaining the differences that we uncover.
To start, we examine differences in average state pension incomes in retirement. The state pension is an important source of income for many older people: state support currently constitutes over half of income for middle-income pensioners (Department for Work and Pensions, 2022a). Figure 1 shows that there have been large falls in the gap in state pension income between men and women over time. Among those born in the early 1940s, women receive around 25% less in state pension income than men on average; however, this gap is below 5% for those born in the early 1950s. Two factors can account for the narrowing of this gap. First, women born more recently have had greater labour market attachment than earlier-born cohorts (Banks, Emmerson and Tetlow, 2018), increasing their state pension entitlement. Second, changes to the state pension system over the past decade have made the state pension comparatively more generous for those with incomplete working histories, who are more likely to be women.1
Figure 1. Average state pension income of men and women over state pension age, by age and birth cohort (2009–10 to 2020–21)
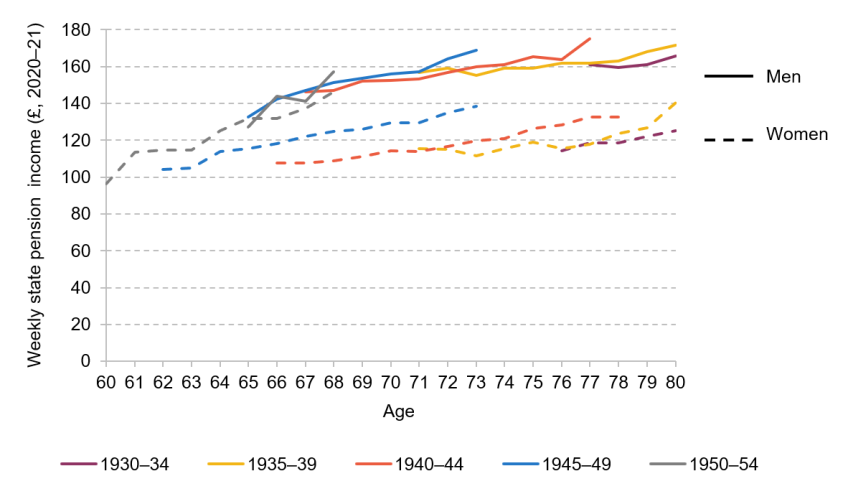
Note: Mean weekly state pension income and median age are calculated for each birth cohort and year of the data, with median age shown on the horizontal axis. Income is deflated to 2020–21 prices using a variant of the CPI that includes mortgage interest rates for owner-occupiers (CPIH), consistent with DWP statistics on the distribution of income, ‘Households Below Average Income’.
Source: Authors’ calculations using the Family Resources Survey.
Under current policy, the gap in state pension income between men and women is likely to continue to diminish for current working-age individuals once they reach state pension age as in future the vast majority will receive the full new state pension (currently £185.15 per week) and no earnings-related enhancement.
While the state pension is an important source of income for many retirees, many also enjoy a significant amount of private pension income. Figure 2 shows that there is a larger and more persistent gap in private pension income between men and women over state pension age (note that this graph is measured across all people, irrespective of whether they have a private pension). Women born in the late 1930s had average gross private pension income of around £75 per week (expressed in 2020–21 prices) during their 70s, compared with around £180 per week for men at the same age, implying that women’s private pension incomes are almost 60% lower than men’s on average. While average private pension income of women has risen to around £100 per week for women born in the early 1950s, men have also seen increases, meaning that the average private pension income of women is still around 45% below that of men for this birth cohort.2
Figure 2. Average gross private pension income of men and women over state pension age, by age and birth cohort (2009–10 to 2020–21)Figure 1. Average gross private pension income of men and women over state pension age, by age and birth cohort (2009–10 to 2020–21)
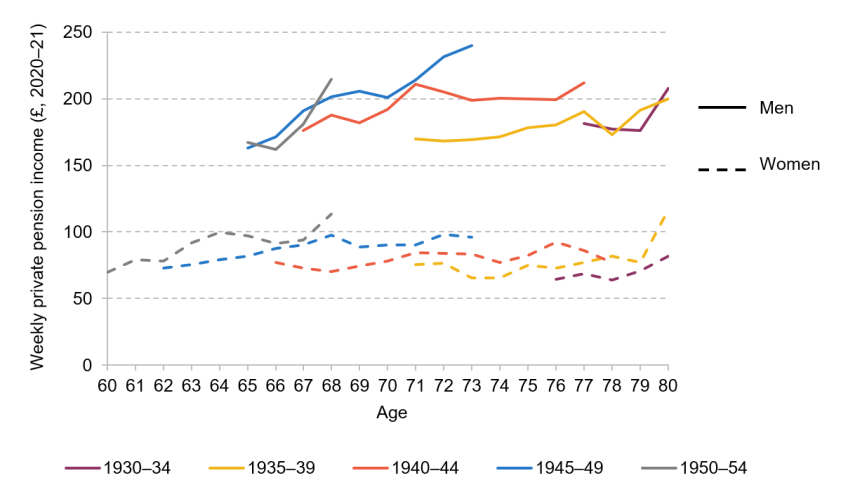
Note: Mean gross private pension income and median age are calculated for each birth cohort and year of the data, with median age shown on the horizontal axis. Gross private pension income is winsorised at the 99th percentile (conditional on a positive value) and includes income from occupational pensions as well as investment income (which includes, for example, dividend income, but also income from annuities). Incomes are expressed in 2020–21 prices using CPIH.
Source: Authors’ calculations using the Family Resources Survey.
Of course, gaps in private pension income between current retirees will be a function of a whole career of pension saving differences between men and women (and of the returns provided by the schemes). There have been large changes to the pension saving landscape in the last few decades, on top of large changes in the labour market outcomes of women, which are likely to lead the gender pension gap to be fundamentally different among current working-age individuals (when they retire) compared with that among current retirees. Any policies intended to address the gender pension gap by changing the pension saving decisions of current workers would therefore take decades to have a full effect on pensioner incomes, and would therefore be better motivated by differences in pension saving decisions between men and women of working age today than by differences in the incomes of today’s pensioners.
In the remainder of this report, we therefore examine differences in private pension saving between men and women who are currently of working age, and attempt to understand the causes underlying these differences. This is of particular importance for determining the appropriate policy response, if any. There are three main drivers of a difference in private pension wealth between men and women.
First, men and women have different labour market experiences – in particular, women have lower labour force participation rates than men and earn less conditional on being in paid work, both because they work fewer hours on average and because they have lower average hourly wages. Second, conditional on being in employment, men and women might save a different proportion of their earnings into their pension. This could be driven by differences in the types of jobs men and women are likely to do – for example, differences in the sectors they work in and the size of the employer, but also the amount they earn. There might also be differences in saving rates between men and women with similar individual and job characteristics – for example, due to different demands on their budgets and/or differences in preferences for pension saving. Third, men and women might receive different rates of return on their pension wealth due to differences in investment strategies. This final element is outside the scope of this report.
To start, in Section 2, we document differences in pension participation and the average amounts that working-age men and women are contributing to their private pensions – this will directly reflect accumulation of different amounts of resources for retirement in the future, and will suggest the extent to which we expect the gender pension gap to exist for future retirees. We then show how this gap is driven by differences in employment rates, earnings, and the sectors that men and women tend to work in. In that section, we also highlight the importance of having children for the opening up of the gap, and how this is associated with gaps in labour force participation and earnings.
In the rest of the report, we focus on gaps in participation and contribution rates within each sector, and determine the extent to which these gaps can be explained by observable differences in individual and job characteristics within the sector. In Section 3 we analyse differences in pension saving rates between employees in the public and private sectors, while in Section 4 we highlight gender differences in pension saving among the self-employed. Section 5 concludes and draws out the policy implications from our analysis.
2. How much are men and women saving in pensions?
We start by documenting what proportion of men and women were saving into a pension in 2019, and how much they (and their employers) were contributing on average. We show the pension saving differences between men and women across everyone, regardless of work status and whether they are contributing to a pension or not, as these differences will be the key input into any gap in average pension income between retired men and women in the future. In addition, we show how the gap changes as we restrict our focus to different groups of men and women, thereby highlighting how differences in employment rates and the sectors that men and women work in contribute to the overall gender gap in pension saving.
In this section, we use data from both the Annual Survey of Hours and Earnings (ASHE) and Understanding Society. ASHE is a survey completed by employers in April each year that provides data on almost 1% of employees in Great Britain. ASHE has a larger sample size than Understanding Society, and is generally thought to contain the highest-quality information on employees’ pension contributions (made by the employees themselves, and their employers) as it is completed by employers. We therefore use this dataset whenever we are examining the pension saving rates of employees. However, ASHE does not contain information on the self-employed or people not in work. Therefore, we also make use of Understanding Society, which is a longitudinal survey collecting data from a representative sample of UK households (i.e. not only employees). We use waves 8 and 10 of Understanding Society (questions on pension saving are not asked in wave 9) and consider contributions to both occupational and personal pensions for the self-employed and non-workers.3
Figure 3 shows pension participation rates for different groups of working-age men and women in 2019. The data labels show the percentage-point differences, with a negative value indicating that women have a lower participation rate than men. We can see that the gap in participation rates varies depending on exactly which group we examine. Specifically:
- Among everyone, 66% of men aged 22–59 are contributing to a pension, compared with only 59% of women, a gap of over 6 percentage points (ppt).
- Much of this gap is driven by differences in employment rates; once we restrict the sample to only those in paid work, around 77% of both men and women are saving in a pension.
- The gender gap in participation rates among all workers (0.8ppt) is lower than the gender gap in participation rates among just employees (1.7ppt), even though there is a gap in participation rates among self-employed workers of 3.6ppt. This is because a very low proportion of self-employed workers are saving in a pension, and the proportion of workers who are self-employed is much higher for men (15%) than for women (10%).
- The gender gap in participation rates among private sector employees (4.9ppt) is larger than the gender gap in participation rates among all employees (1.7ppt). This is because there is essentially no gap in participation rates among public sector employees, together with the fact that the proportion of employees in the public sector is higher for women (32%) than for men (17%).
Figure 3. Pension participation rates for different groups of men and women aged 22–59 in 2019
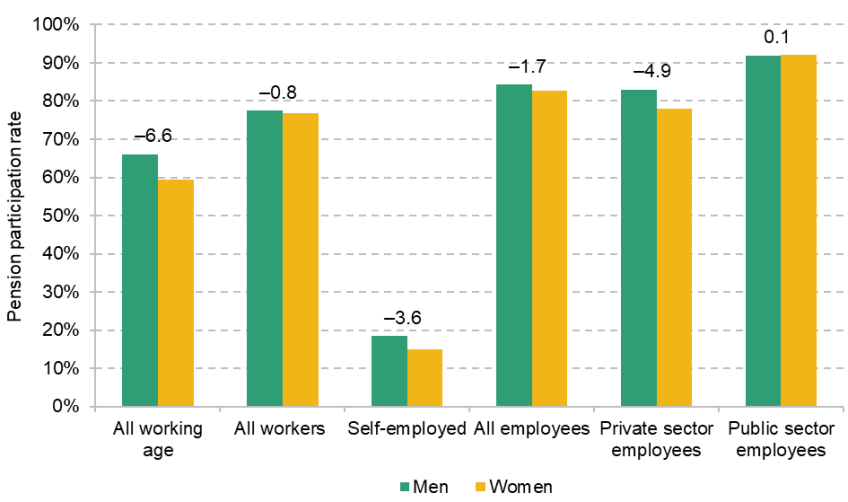
Note: Pension participation rates for all working-age people, all workers and self-employed are calculated in Understanding Society. Pension participation rates for all employees, private sector employees and public sector employees are calculated in the Annual Survey of Hours and Earnings. The pension participation rate for self-employed workers is calculated using data from 2017–20 due to low sample size; all other rates are calculated using 2019 data only. The numbers above the bars indicate the percentage-point difference in participation rates between men and women (calculated as female participation rate minus male participation rate, so that a positive number indicates that women have a higher rate).
While pension participation rates are important, the amount contributed to pensions is also key for determining retirement outcomes. Across everyone aged 22–59, we calculate that women have average total pension contributions (including employer contributions) of around £50 per week (£2,600 per year), compared with £65 per week (£3,400 per year) for men. This difference in the amount entering pension pots will be a key determinant of any gap in average pension income between retired men and women in the future.
Some of this difference in average total pension contributions will be due to the differences in employment and pension participation rates highlighted in Figure 3. Therefore, in Figure 4, we show average total pension contributions for different groups of men and women in paid work, restricting our sample to only those who are actively saving in a workplace or personal pension.
Figure 4. Average total pension contributions for different groups of men and women aged 22–59 in 2019, conditional on pension participation

Note: Average pension contributions for employees are calculated in Annual Survey of Hours and Earnings in 2019 (and include both employee and employer pension contributions). Average pension contributions for self-employed are calculated in Understanding Society; we use data from 2017–20 due to low sample size. Average contributions across all workers and all working-age people are then calculated using information on the share of men and women who are employees, self-employed and not in paid work in 2019, from Understanding Society. The numbers above the bars indicate the cash difference in average contributions between men and women (calculated as average female contributions minus average male contributions, so that a positive number indicates that women have a higher value), while the numbers in parentheses are the percentage by which women’s average amount is lower than men’s average amount. Pension contributions are deflated to 2020 prices using CPIH.
Overall, among workers saving in a pension, men have total average pension contributions of almost £100 per week, compared with £85 per week for women. Focusing on employees increases average weekly contributions only slightly, up to £103 for men and £86 for women. This is because while the self-employed have much lower pension participation rates than employees, when they do contribute they tend to save a fairly similar amount of their income into their pension to that saved by private sector employees. Therefore, average contributions among workers and average contributions among employees, conditional on participation, are fairly similar. The gap in average total weekly pension contributions increases to £25 once we restrict our attention to private sector employees, with men contributing £85 per week on average and women £61. In fact, there is an even greater gap in contributions of £66 in the public sector. However, since the level of average contributions is so much higher in the public sector than in the private sector, the fact that a higher proportion of women than men work in the public sector works to reduce the gap among all employees compared with the gap among just private sector employees.
Figure 5. Average total pension contribution rates for different groups of men and women aged 22–59 in 2019, conditional on pension participation
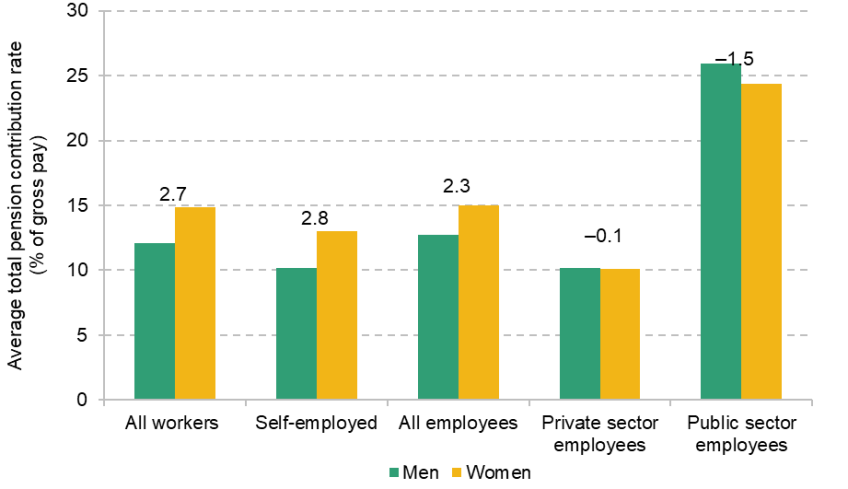
Note: Average pension contribution rates for employees are calculated in Annual Survey of Hours and Earnings in 2019 (and include both employee and employer pension contributions). Average pension contribution rates for self-employed are calculated in Understanding Society; we use data from 2017–20 due to low sample size. Average contribution rates across all workers and all working-age people are then calculated using information on the share of men and women who are employees, self-employed and not in paid work in 2019, from Understanding Society. The numbers above the bars indicate the percentage-point difference in average contribution rates between men and women (calculated as average female contribution rate minus average male contribution rate, so that a positive number indicates that women have a higher rate).
A key question is to what extent these differences in average contributions in cash terms are simply a direct result of different average earnings between men and women. To determine this, Figure 5 shows average total contributions as a percentage of pay for different groups of men and women who are contributing to a pension, rather than in cash terms. The average total pension contribution rate among all workers is actually higher for women, at almost 15% of pay, than for men, whose average contribution rate is less than 13%. This gap falls slightly when restricting the sample to just employees, implying that part of the gap among all workers is driven by lower rates of self-employment among women (and lower pension contribution rates among the self-employed). The higher prevalence of public sector employment among women is even more important for driving the gap among all workers, as public sector employees have average total pension contribution rates of around 25% of pay (conditional on participation).
Figure 6. Own pension contributions for fathers and mothers by years to and from arrival of first child (2010 to 2020)
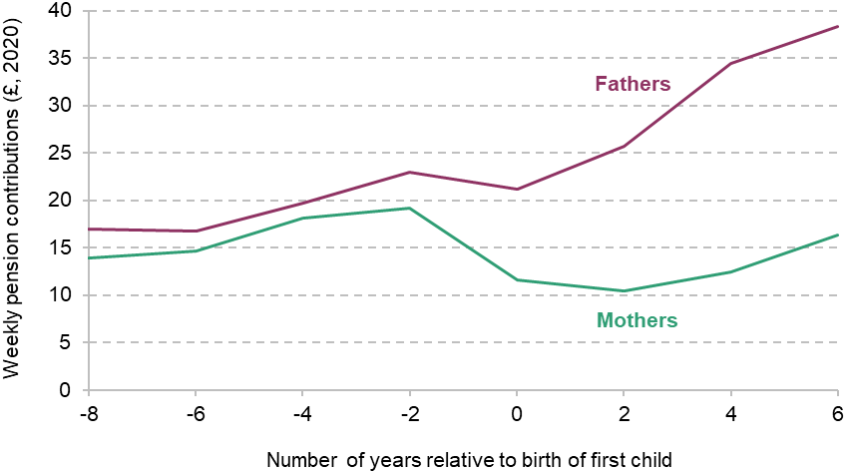
Note: Average weekly pension contributions of 22- to 59-year-olds (whether in paid work or not), calculated using data between 2010 and 2020 (even waves 2 to 10) of Understanding Society. The sample only includes individuals who we observe having a first child in one of the years of the data. Pension contributions are deflated to 2020 prices using CPIH.
Source: Authors’ calculations using Understanding Society.
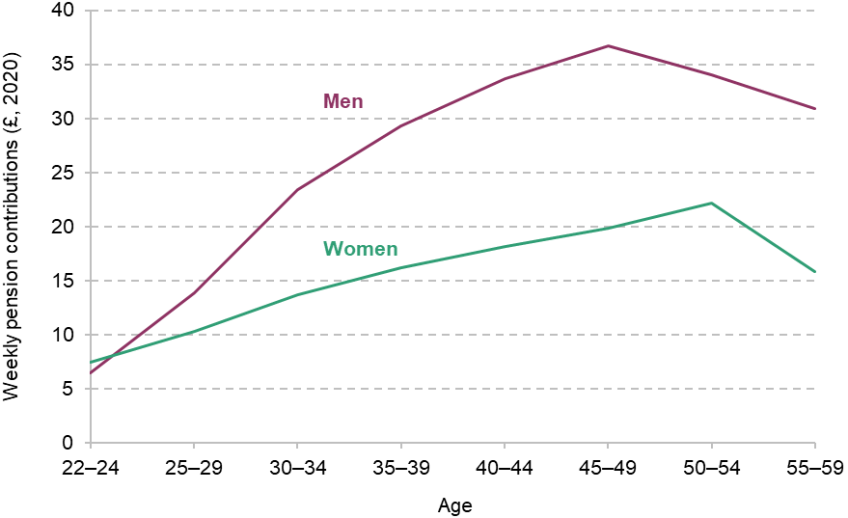
Therefore, the analysis in this section demonstrates that differences in employment rates and earnings between men and women are key drivers of differences in pension saving between men and women. These gaps in employment and earnings begin to open up in the late 20s and then widen gradually for the next twenty years of the life cycle, as shown in Costa Dias, Joyce and Parodi (2020). Figure A1 in the appendix shows a similar evolution of the gap in own weekly pension contributions (among all working-age individuals, regardless of pension participation), consistent with the importance of labour market experiences for the gender gap in pension saving. Figure 6 further shows that the gender gap in own pension contributions widens significantly with the arrival of the first child, which is when differences in employment rates, hours and wages also start to emerge (Costa Dias et al., 2020). While most of this effect is driven by labour market differences opening up at this point, our earlier report on the pension saving of employees does suggest that pension contributions tend to increase over time by less after the arrival of a first child, even controlling for changes in hours and earnings, with the effect slightly larger for women than for men (Cribb and O’Brien, 2023).
Summary
This section has highlighted the importance of sector for gender differences in pension saving. High levels of pension saving in the public sector, where a higher share of women work, and lower levels of pension saving among the self-employed, where a lower share of women work, tend to work against a gender pension saving gap in favour of men. This means that measures to reverse the decline in pension saving among the self-employed, as suggested by Almond, Phillips and Sandbrook (2022) and Cribb and Karjalainen (2023), would lead the gender gap in pension saving to actually widen (as would reducing pension contribution rates in the public sector).4 Nevertheless, this does not necessarily imply that these policies are undesirable; indeed, should policymakers wish to reduce the gender gap in pension saving, it would be preferable to use policies that address the fundamental drivers of the difference. One of these drivers is differences in labour market experiences that particularly open up at childbirth. There are also gender differences in pension saving rates within sector: for example, among private sector employees and the self-employed, men have higher pension participation than women; and among public sector employees, men have higher average contribution rates than women.
Understanding the drivers of these differences is key for assessing the desirability of different policies to address the gender gap in pension saving, should this be a policy aim. In particular, are these differences in pension saving among workers in the same sector driven by differences in observable individual and job characteristics and, if so, which ones? Or are men and women with similar characteristics and working in similar jobs contributing different amounts to their pensions, which might suggest differences in the pressures on men’s and women’s budgets, or different preferences for pension saving. We explore these questions in the next two sections, for employees in Section 3, separating out the public and private sectors, and for the self-employed in Section 4.
3. The gender gap in pension saving for employees
In this section, we explore in more detail how workplace pension participation and average contribution rates vary between male and female employees and how the trends differ in the public and private sectors. In addition, we attempt to explain the drivers behind the differences we find.
Throughout this section, we use data from the Annual Survey of Hours and Earnings. As explained in Section 2, this survey contains high-quality data on workplace pension saving for a large sample of employees. Unfortunately, as it is completed by employers, it does not contain much background information on the employees – for example, we do not know their education level or whether they have children.
Figure 7. Workplace pension participation for male and female employees over time
Note: Sample includes employees aged 22–59.
Source: Authors’ calculations using Annual Survey of Hours and Earnings.
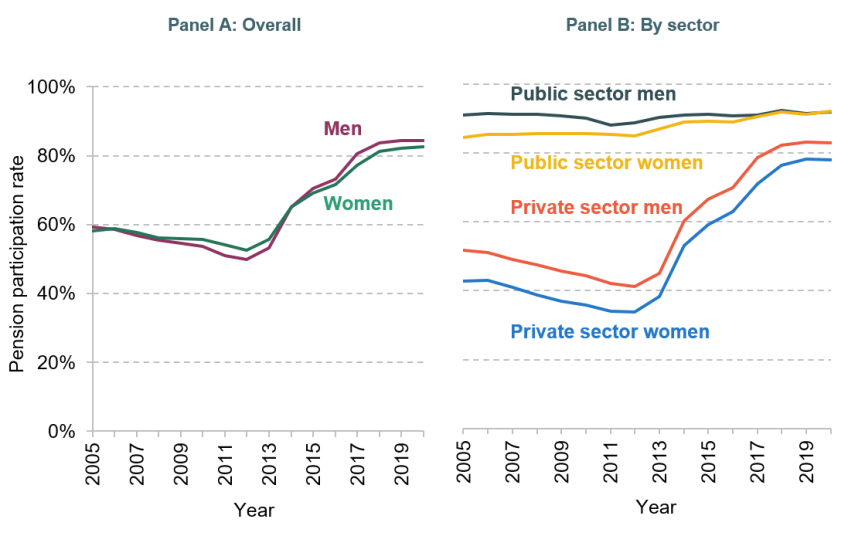
We start in Figure 7 by analysing how gender differences in employees’ workplace pension participation rates have evolved over time. Panel A shows that, taking employees as a whole, men and women have had fairly similar pension participation rates since at least 2005. Men have had a slightly higher rate in more recent years, while women had a slightly higher rate between 2006 and 2014; at all times, the gap in participation rates has been less than 3.5 percentage points.
However, once we split pension participation rates by sector in Panel B, some more significant gender differences start to appear. In the private sector, women have had lower pension participation than men in all years back to 2005. This gap has narrowed slightly since 2010, from 9 percentage points to 5 percentage points in 2020. In the public sector, the gap in pension participation has actually closed completely, having been 7 percentage points back in 2005.
This panel also shows that the increase in pension participation in Panel A was driven principally by an increase in participation within the private sector since 2012 – this was mainly a result of automatic enrolment into workplace pensions, which started to be rolled out in this year (Cribb and Emmerson, 2020). Indeed, the reason male pension participation across all employees has overtaken female pension participation in the last decade is because a higher share of male employees work in the private sector, which has seen a much larger increase in pension participation due to automatic enrolment. This example demonstrates the importance of understanding the drivers behind any gender differences in pension saving before rushing to address them – the increase in private sector pension participation was a key aim of automatic enrolment, and has been a policy success, even if it has brought more men than women into workplace pensions because a greater number of men than women work in the private sector.
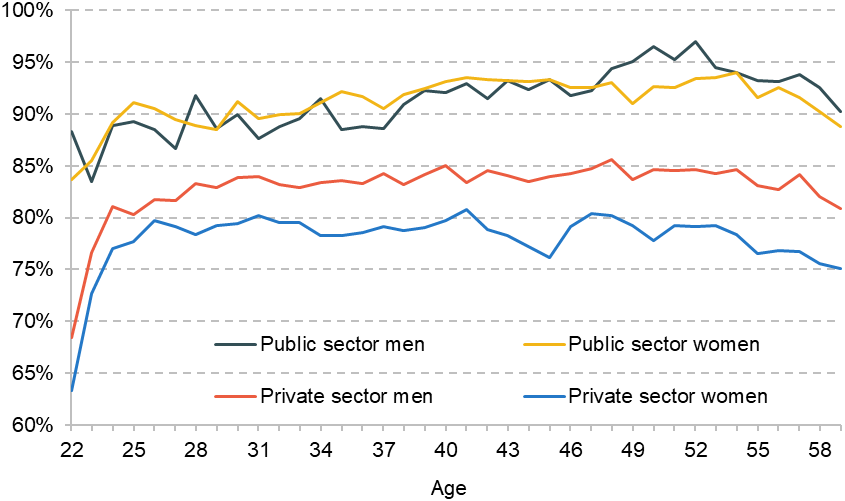
Figure 8 shows how workplace pension participation rates vary by age for men and women in the public and private sectors in the two most recent years of data (2019 and 2020). Men have slightly higher participation rates than women in the private sector at all ages between 22 and 59, although the gap does increase slightly from around 4 percentage points up to age 40 to around 6 percentage points after this age. On the other hand, there are fairly similar participation rates at all ages for men and women in the public sector, although a slight gap does open up in favour of men after their mid 40s.
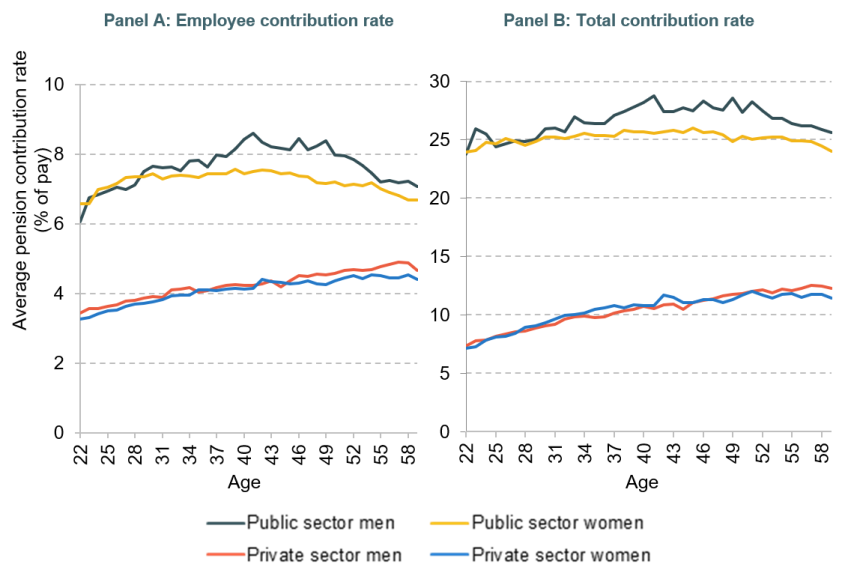
While pension participation is important, it is also important to know how much of employees’ salary is actually going into their workplace pensions. Figure 9 shows average employee contribution rates (in Panel A) and average total (i.e. employee + employer) contribution rates (in Panel B) for men and women in the public and private sectors who are saving in a workplace pension, by age. Pension contribution rates are measured as a percentage of gross earnings.
Figure 8. Workplace pension participation for male and female employees, by age and sector (2019 to 2020)
Note: Sample includes employees aged 22–59.
Source: Authors’ calculations using Annual Survey of Hours and Earnings.
Looking first at the private sector, men have slightly higher employee contribution rates than women at nearly all ages, with the gap widening slightly later in life: by their late 50s, the average contribution rate for men is around 0.4% of salary bigger than the average rate for women. But employee pension contributions are only half the story: employers are also obliged to make at least some contributions to employees who participate in a scheme, and often these employer contributions are actually worth more than the employee contributions. Once we add on employer pension contributions, in Panel B, women tend to have slightly higher average total contribution rates during their 30s and early 40s, while men have slightly higher average total contribution rates during their 50s. The differences are generally quite small, however.
Turning to the public sector, we can see that both employee and total contribution rates are similar until age 30, after which point they start to diverge, with men having a higher average rate from this point. The differences are much larger than in the private sector: during their 40s, men have average total contribution rates over 2% of salary higher than women.
Figure 9 therefore highlights that male employees are, on average, contributing a higher proportion of their salary to their workplace pension than female employees in the public sector, and in the private sector a higher proportion of men are saving in a pension than women, although the differences in contribution rates among participants are fairly small. There are, of course, differences in the types of work that men and women, on average, do that could lead to differences in pension saving decisions, including the type of industry they work in, the average size of their employer, and how much they get paid, to name a few examples. For the rest of this section, we explore which of these different characteristics are most important for explaining the observed gap in pension saving in each sector.
Figure 9. Mean employee and total pension contribution rate for male and female employees for those participating in a scheme, by age and sector (2019 to 2020)
Note: Sample includes all employees aged 22–59 who are participating in a workplace pension. Total contribution rate is the sum of employee and employer contribution rates, measured as a percentage of gross pay.
Source: Authors’ calculations using Annual Survey of Hours and Earnings.
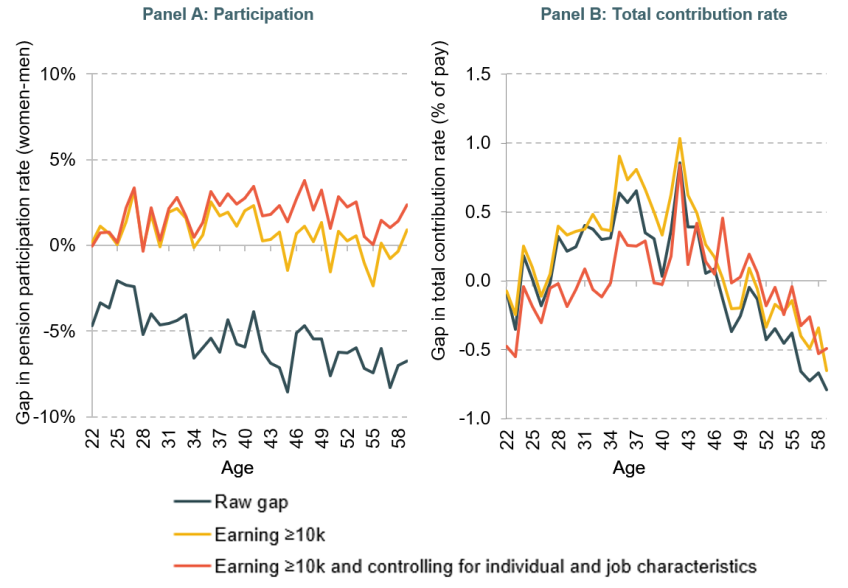
Figure 10 analyses the drivers of the gender gap in pension participation and total contribution rates for private sector employees. The black line shows the gap in participation rates and average total contribution rates by age, without controlling for any other variables. These lines show the pattern from the previous figures: women have lower participation rates than men, and this gap grows with age, while average contribution rates are higher for women from their late 20s until their late 40s, and higher for men later in working life. The yellow line shows that the gap in participation rates more or less disappears once we restrict our attention to those earning at least £10,000 per year (in nominal terms), with if anything women having higher participation rates earlier in their careers (and more similar rates to men later in their careers). This suggests that this gap is driven by automatic enrolment: in particular, employers are obliged to automatically enrol employees earning at least £10,000 into a workplace pension, and workplace pension participation rates are commensurately higher for those who have earnings of at least £10,000 per year. Given that women are less likely to earn above this amount than men, because they are more likely to be working part-time, fewer women will be automatically enrolled into a pension than men, which is driving the gap in pension participation among all private sector employees in the black line. However, restricting the sample to those earning at least £10,000 per year has little effect on the gap in contribution rates, since this graph only includes those who are saving in a workplace pension.
Figure 10. Explaining the gaps in pension participation and in total contribution rates among private sector employees participating in a scheme (2019 to 2020)
Note: Sample includes private sector employees aged 22–59, with the right-hand panel restricted to those participating in a workplace pension. Total contribution rate is the sum of the employee and employer pension contribution rates as a percentage of gross pay. The gaps are the difference between the rates for women and men, with a positive number indicating women have a higher rate than men. The black series shows the average gap including everyone in the sample. The yellow line restricts the sample to those earning at least £10,000 each year. The red line additionally controls for the following characteristics: log hourly basic pay, other pay, normal and overtime hours, industry (one-digit SIC code), job tenure (years with the employer), employer size (measured at the enterprise level), employer legal status, whether the employee’s pay is set under a collective agreement, and whether the employee has a permanent or temporary contract.
Source: Authors’ calculations using the Annual Survey of Hours and Earnings.
Of course, the fact that a higher share of men earn at least £10,000 than women is not the only difference between the types of jobs held by the two sexes in the private sector. For instance, women are more likely to work part-time than men, are more likely to work in the retail and hospitality sectors (Joyce and Xu, 2019) and are more likely to work in a job with a temporary contract.5 The red lines show the gender differences among those earning at least £10,000 after controlling for these types of individual and job characteristics (see the figure note for the full list of controls). In general, adding in these controls only has a small effect on the gender gap in participation in the private sector. In fact, women have a slightly higher pension participation rate than men with similar individual and job characteristics, by around 2 percentage points at most ages. The gap in total contribution rates is also smaller after adding in controls, with a gap of less than 0.5% of salary for almost all ages we consider (the results for the employee contribution rate are similar, as shown in Figure A2 in the appendix).
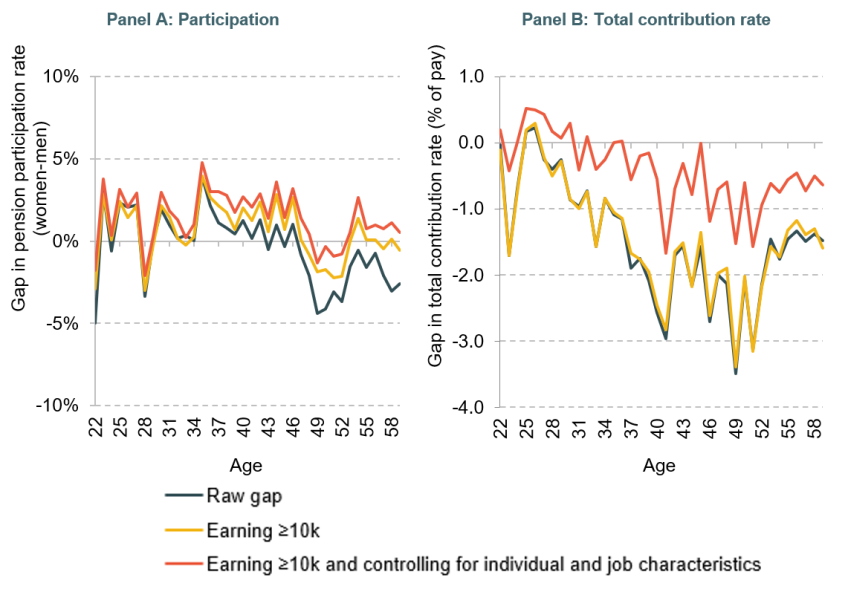
We repeat this analysis for public sector employees in Figure 11. Across everyone, men and women have fairly similar participation rates until their late 40s, after which point men have a slightly higher rate. Restricting to those earning at least £10,000 annually in nominal terms reduces the gap, similar to the private sector. While this could be because of differences in eligibility for automatic enrolment, pension participation was affected much less in the public sector by automatic enrolment as participation levels were high even before 2012. Another potential explanation is that low earners might be less likely to want to enrol in a public sector pension, and women are more likely to be low earners. Controlling more broadly for earnings, as well as other individual and job characteristics, also slightly shifts the gap in participation rates in favour of women. Indeed, women in the public sector in their mid 30s have a pension participation rate around 3 percentage points higher than the rate for men of the same age with similar characteristics.
We analyse differences in total pension contributions rates in the public sector in Panel B.6 The black line shows that a gap exists in favour of men, and it widens up to age 50, before shrinking slightly, as shown in Figure 9. Unsurprisingly, restricting the sample to those earning at least £10,000 annually has essentially no effect on this gap, since we are already focusing on pension participants.
Figure 11. Explaining the gaps in pension participation and in total contribution rates among public sector employees participating in a scheme (2019 to 2020)
Note: Sample includes public sector employees aged 22–59, with the right-hand panel restricted to those participating in a workplace pension. Total contribution rate is the sum of the employee and employer pension contribution rates as a percentage of gross pay. The gaps are the difference between the rates for women and men, with a positive number indicating women have a higher rate than men. The black series shows the average gap including everyone in the sample. The yellow line restricts the sample to those earning at least £10,000 each year. The red line additionally controls for the following characteristics: log hourly basic pay, other pay, normal and overtime hours, industry (one-digit SIC code), job tenure (years with the employer), employer size (measured at the enterprise level), employer legal status, whether the employee’s pay is set under a collective agreement, and whether the employee has a permanent or temporary contract.
Source: Authors’ calculations using the Annual Survey of Hours and Earnings.
Controlling for individual and job characteristics, on the other hand, leads the gap in contribution rates between men and women to fall much more substantially, suggesting that it is other differences in the type of work that men and women do in the public sector causing the vast majority of this gap. This can be explained by the existence of fairly rigid contribution structures throughout much of the public sector, where the vast majority of employees have a defined benefit pension. Many of these schemes have higher (employee) pension contribution rates for higher earners, and the contribution rates can also differ across schemes.7 Since men have higher average earnings than women in the public sector, particularly at older ages, these contribution structures lead men to have higher average contribution rates than women unconditional on their level of earnings (the black and yellow lines). But, when we compare men and women with similar earnings (and working in the same sector), in the red line, men and women have much more similar average contribution rates. Again, the results for just employee contribution rates are similar, as shown in Figure A3 in the appendix.
Summary
This section has demonstrated that there are important differences in gender pension gaps for employees working in the private sector compared with those working in the public sector. In the private sector, men have higher pension participation rates at all ages. This is because employees earning less than £10,000 annually are not obliged to be automatically enrolled into a pension, and a higher share of female employees earn less than that threshold than do male employees. There is less of a consistent gap in terms of total contribution rates (among those participating in a scheme), with women having slightly higher average contribution rates earlier in working life and slightly lower average contribution rates later in working life. Most of these differences in contribution rates can be explained by differences in individual and job characteristics.
The story is different in the public sector. Men and women have similar participation rates, at least until the last few years of working life, and once we control for individual and job characteristics, if anything women have higher participation rates. Turning to contributions, public sector employees generally have much less choice over their pension contribution rates – instead, rates are set by the scheme rules, and typically depend on annual earnings. As a result, we find that while there are differences in pension contribution rates between men and women working in the public sector earning at least £10,000, these differences narrow substantially once we control for characteristics such as industry, hours and hourly pay.
Overall, the results in this section indicate that men and women working as employees in similar jobs and with similar earnings have similar workplace pension participation and contribution rates. If anything, participation rates are slightly higher for women – implying that differences in pension saving among employees are fundamentally driven by the difference in average earnings between men and women, as well as by differences in the industries and occupations that men and women tend to work in, rather than by differences in decisions or in the structure of workplace pension provision by firms.
4. The gender gap in pension saving for the self-employed
The size of the self-employed workforce increased rapidly in the years prior to the COVID-19 pandemic – there were 5 million self-employed people in the UK in 2019 (Blackburn, Machin and Ventura, 2022), compared with 3.6 million in 2004.8 And despite a fall in the number of self-employed people during the pandemic, 13% of the workforce in early 2022 was self-employed according to ONS statistics.9
In this section, we first examine differences between the employee and self-employed workforces that could be important for the gender pension gap, and then examine the gender pension gap for self-employed workers. We use our own analysis of survey data and cite recent analysis from Karjalainen (2023) and Cribb and Karjalainen (2023), who examine the pension saving decisions of the ‘long-term’ self-employed who have been self-employed for at least five years using administrative tax records data from HM Revenue and Customs.
Characteristics of the self-employed
The gender composition of the self-employed workforce is very different from that of employees. Roughly half of employees are women, while around two-thirds of the self-employed are men (64% in 2019–20 according to our analysis of the Family Resources Survey, FRS). The self-employed population also differs from employees in terms of earnings. On average, the self-employed earn less than employees: FRS data show that median earnings among the self-employed in the financial year 2019–20 were £345 per week, compared with £480 per week among employees. But more importantly, a much higher fraction of the self-employed have low earnings: in 2015–16, 34% of the self-employed had income below £10,000 per year, compared with 15% among employees (Cribb, Miller and Pope, 2019).
The self-employed also differ from employees in terms of pension saving. According to recent UK government statistics, 79% of employees are saving into a pension (Office for National Statistics, 2022), compared with 19% among the self-employed (Department for Work and Pensions, 2022b). While some of these differences in pension participation rates can be explained by differences in earnings (as many self-employed people have very low earnings), Cribb and Karjalainen (2023) compare pension participation rates of employees and the self-employed, and show that gaps in pension saving between the self-employed and employees exist even after controlling for differences in earnings, and that these gaps have widened as employees have become subject to automatic enrolment.
Differences in pension saving between male and female self-employed workers
Figure 12 shows that there are differences in the pension participation rates of men and women who are self-employed. In 2020–21, 16% of self-employed women and 22% of self-employed men were saving into a private pension. This (6 percentage point) gap has become considerably smaller over time – the difference between male and female pension participation rates was 21 percentage points in 1998. The reduction in the gender gap in pension participation among the self-employed is a result of men’s pension participation falling much more rapidly than women’s in the early 2000s.
Figure 12. Private pension participation among the self-employed, by sex
Note: The sample is working-age individuals (defined as aged 22–64) whose main economic activity is self-employment.
Source: Authors’ calculations using the Family Resources Survey 1998–99 to 2020–21.
We know that self-employed women have on average lower earnings than self-employed men, and they are also more likely to be very low earners – in 2014–15, 44% of long-term self-employed women were earning less than £10,000, compared with 28% of long-term self-employed men (Karjalainen, 2023). In order to better understand the extent to which higher pension participation rates for self-employed men than for self-employed women can be explained by differences in their earnings, we can look at pension participation rates by sex, conditional on different levels of earnings.
Figure 13 reproduces a chart from Cribb and Karjalainen (2023). It shows that when comparing pension participation rates of men and women of similar income levels, a more complicated picture reveals itself. For people earning under around £12,000 (in 2014–15), pension participation rates are slightly higher for men than for women. Additionally, for higher earnings (most notably earnings over around £60,000 per year, although relatively few self-employed people earn this amount), self-employed women are slightly more likely than self-employed men to be saving into a private pension, a fact that is hidden by the aggregate pension saving rates of the self-employed.
Figure 13. Private pension participation of self-employed workers, by earnings and sex, 2014–15

Note: The self-employed are defined as working-age (aged 22–64) self-employed who have been self-employed for at least five years with no employment income. Self-employment income includes all gross income from self-employment. The data points are not fully aligned because their location is based on the actual mean income among the people in that bin.
Source: Figure A3.2 of Cribb and Karjalainen (2023), which uses HMRC Self Assessment data.
Overall, this means that some of the difference in pension participation rates between self-employed men and women seems to be explained by differences in earnings between the sexes. In particular, Karjalainen (2023) and Cribb and Karjalainen (2023) also examine whether self-employed women are less likely to be saving into a pension after controlling for a number of characteristics, most notably income, measures of volatility of income, and time spent in self-employment (more details in the note to Figure 14). Table A2.1 of Cribb and Karjalainen (2023) shows that the average gender gap in pension participation is 5.5 percentage points after controlling for these factors.
Figure 14. Pension participation rates of men and women by age, relative to participation at age 22, after taking account of income and other observed characteristics

Note: Coefficients (multiplied by 100) from a linear probability model of pension participation on individual characteristics. In addition to single-year age dummies interacted with a female dummy, the characteristics controlled for are average income from self-employment and other sources, coefficient of variation of income, this year’s income less average income, and dummies for being a partner, being an immigrant, having been self-employed for longer than nine years, having property income, having taxable pension or benefit income, region, and industry. Coefficients from age 23 to 26 suppressed due to statistical imprecision as age groups at those ages are small. The female coefficient (at 22) is zero. The age coefficients are statistically significantly different from each other from age 49 onwards. Sample is working-age self-employed workers with no income from employment, who have been self-employed at least five years.
Source: Figure 3.3 of Karjalainen (2023), which uses HMRC Self Assessment data.
In addition, Karjalainen (2023) looks at whether any of these gaps in pension participation between women and men differ by age. Figure 14 presents the age coefficients from this regression (also controlling for income, measures of volatility of income, and time spent in self-employment, among others) for men and women. It shows that the pension participation rates of men and women are very similar up to age 40, with, if anything, women having higher participation than men, conditional on similar characteristics. A gap between male and female pension participation rates starts opening up after age 40, and the difference in participation rates is statistically significant from age 49. The gap continues to grow through the 50s: keeping all else equal, men aged 59 are 13 percentage points more likely to be saving into a pension than women of the same age. Thus, while differences in characteristics such as earnings explain some of the gap in pension participation between self-employed men and women, a gender gap remains even after controlling for those characteristics, especially among the oldest self-employed workers.
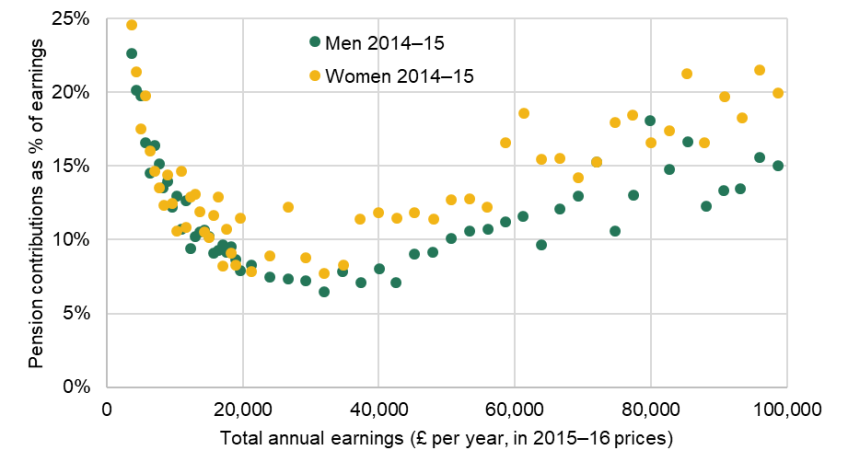
We can also see whether contribution rates of men and women differ among those of the long-term self-employed who are saving into a private pension. Once again, we show this controlling for differences in income. Figure 15 displays a chart from Cribb and Karjalainen (2023) showing that among those saving in a private pension and earning under £20,000 per year, self-employed men and women with the same earnings make similar contributions. Among those earning more than £20,000 per year, it seems that self-employed women tend to save somewhat more than men. However, the overall differences between genders (conditional on income) are small.
Figure 15. Mean contribution rates by income among self-employed workers who are contributing to a private pension, by sex
Note: The self-employed are defined as working-age (aged 22–64) self-employed who have been self-employed for at least five years with no employment income. Self-employment income includes all gross income from self-employment. The data points are not fully aligned because their location is based on the actual mean income among the people in that bin. The contribution rates are winsorised at the 99th percentile.
Source: Figure A3.3 of Cribb and Karjalainen (2023), which uses HMRC Self Assessment data.
Summary
In this section, we have seen that the self-employed are much less likely to be saving into a private pension than employees, and that women are even less likely to save than men among the self-employed workers. Even after controlling for a number of characteristics including income, a gender gap in participation rates remains, especially among older self-employed workers. Amongst those contributing to a pension, self-employed women contribute as much as, or more than, self-employed men earning the same amount.
5. Concluding discussion
The gender pension gap has received a growing level of attention in recent years. Indeed, as highlighted in Section 1, there is currently a significant gap in average income between male and female pensioners, in favour of men. However, this gap has narrowed over time, in particular due to changes to the state pension system that have benefited women more than men on average. Importantly for policy, any gap in pension incomes between current retirees will be driven by differences in pension saving throughout working lives. This means that in order to assess any pension saving policies designed to address the gender pension gap, we need to understand the pension saving gaps and their drivers amongst working-age individuals.
In this report, we have examined the drivers behind differences in pension saving rates between men and women. On average, a woman in paid work is just as likely to be saving in a private pension as a man, partly because women are less likely to work in self-employment, where pension participation is particularly low. However, the enduring differences in employment rates and earnings between men and women mean there is still a gap in pension contributions between working-age men and women. And because private retirement incomes are increasingly reliant on defined contribution pensions which are decumulated through retirement, women – who have lower lifetime earnings on average and have longer retirements – are likely to continue to have lower retirement incomes than men.
How might the gender pension gap evolve in the future?
Much of the gap in pension contributions (in cash terms) between working-age men and women is driven by differences in labour market experiences, i.e. labour market participation and earnings. These differences in labour market participation and earnings have narrowed over time, which will work to reduce the gender pension gap in the future. For example, for those born in the 1960s, the employment rate of men during their early 30s was almost 20 percentage points higher than women’s employment rate at these ages; this gap had reduced to approximately 15 percentage points at these ages for those born in the 1980s (Banks, Emmerson and Tetlow, 2018). Among those in paid work, there have also been gradual increases in the share of women working full-time from one generation to the next, while the share of men working full-time has stayed fairly consistent (Roantree and Vira, 2018). This, together with a reduction in the gender wage gap over time (Andrew et al., 2021), has led to a fall in the gap in weekly earnings between men and women over successive generations.
The narrowing of the gender gaps in employment rates and earnings will act to reduce the gender gap in pension incomes in the future. However, this narrowing has been gradual and gaps are still prevalent even for the youngest generations active in the labour market today, who will not start to retire for several decades.
There have also been several other large changes to the pension saving landscape over the past few decades, such as the continued shift away from defined benefit schemes to defined contribution schemes in the private sector, the increase in private sector pension saving since 2012 due to automatic enrolment, and the decline in pension saving among the self-employed. Since gaps in private pension income are the function of a whole career of pension saving differences, these developments will continue to affect the gender pension gap for decades into the future, as will future changes in labour market outcomes and the pension saving environment.
Policy implications
Previous research has shown how the arrival of children is associated with the opening up of gaps in employment rates and earnings (Costa Dias, Joyce and Parodi, 2020; Andrew et al., 2021), and the same pattern holds for the gender gap in pension saving. This highlights that differences in the caring responsibilities assumed by mothers and fathers have effects on private wealth accumulation that lead to long-lasting differences in incomes, including in retirement.
To the extent that policymakers want to address differences in pension saving between men and women, one potential policy would therefore be to provide a family carer top-up – that is, the government making some private pension contributions for those who are out of work due to formal caring responsibilities, most obviously for children (Pensions Policy Institute, 2019). While this would reduce the gender gap in future pension incomes for current parents, parents often have high spending commitments, and potentially temporarily lower earning power. It is unclear that policy designed to help such a group would be best targeted (or most appreciated) by providing them with pension contributions, rather than (say) increasing the level of child benefit (available to most parents, but not those where one parent has an income above £60,000) and letting parents choose for themselves how to use the money. Indeed, differences in pension saving and incomes that are caused by labour market experiences may well be better addressed by policies designed to affect these labour market differences, rather than pension saving.
More fundamentally, the reason why gaps in pension incomes reflect gaps in labour market behaviour so clearly is that the UK pension system relies heavily on private pension saving for providing living standards in retirement. This tends to increase the gender pension gap, not only because fewer women than men are in paid work (and those who are earn less on average than men), but also because women have longer life expectancies. This means that a given level of state pension income is worth more for women than men as it is typically received over a longer period, whilst a given defined contribution pot would need to stretch across more years for women than for men.
There are also differences in saving rates between working men and women, particularly when looking within sectors for employees. Among private sector employees, we have shown that this can be explained by the configuration of automatic enrolment: in particular, due to part-time work, women are less likely than men to earn at least £10,000, the threshold at which employers become obliged to enrol their employees automatically into a workplace pension. One way to address this gender pension gap could therefore be to lower the earnings trigger for automatic enrolment.
There are, however, some good reasons for those earning less than £10,000 not to be automatically enrolled to save into a pension. The purpose of pension saving is to defer income from working life to retirement to help ensure a smooth standard of living over the life cycle. Given the New State Pension is worth (in 2023–24) more than £10,000 a year (for those with 35 or more qualifying years), it makes less sense to nudge people to shift resources into retirement if they are earning less than this amount during working life. Furthermore, increasing private pension saving for the very poorest could lead to them being worse off if they take a reduction in take-home pay in working life, and in retirement the modest private pension income simply means that they receive less housing benefit (see Johnson, Yeandle and Boulding (2010)).10
Appendix. Additional figures
Figure A1. Own pension contributions for men and women by age (2017 to 2020)
Note: Average weekly pension contributions across 22- to 59-year-olds (whether in paid work or not), calculated using data between 2017 and 2020 (waves 8 and 10) of Understanding Society. Pension contributions deflated to 2020 prices using CPIH.
Source: Authors’ calculations using Understanding Society.
Figure A2. Explaining the gap in employee contribution rates among private sector employees participating in a scheme (2019 to 2020)

Note: Sample includes private sector employees aged 22–59 who are participating in a workplace pension. Employee pension contribution rate is measured as a percentage of gross pay. The gaps are the difference between the rates for women and men, with a positive number indicating women have a higher rate than men. The black series shows the average gap including everyone in the sample. The yellow line restricts the sample to those earning at least £10,000 each year. The red line additionally controls for the following characteristics: log hourly basic pay, other pay, normal and overtime hours, industry (one-digit SIC code), job tenure (years with the employer), employer size (measured at the enterprise level), employer legal status, whether the employee’s pay is set under a collective agreement, and whether the employee has a permanent or temporary contract.
Source: Authors’ calculations using the Annual Survey of Hours and Earnings.
Figure A3. Explaining the gap in employee contribution rates among public sector employees participating in a scheme (2019 to 2020)
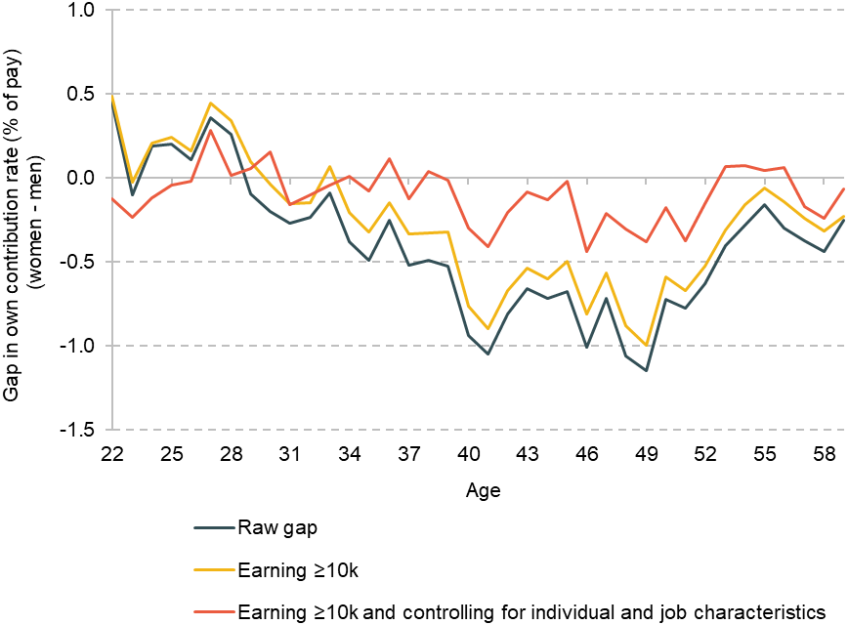
Note: Sample includes public sector employees aged 22–59 who are participating in a workplace pension. Employee pension contribution rate is measured as a percentage of gross pay. The gaps are the difference between the rates for women and men, with a positive number indicating women have a higher rate than men. The black series shows the average gap including everyone in the sample. The yellow line restricts the sample to those earning at least £10,000 each year. The red line additionally controls for the following characteristics: log hourly basic pay, other pay, normal and overtime hours, industry (one-digit SIC code), job tenure (years with the employer), employer size (measured at the enterprise level), employer legal status, whether the employee’s pay is set under a collective agreement, and whether the employee has a permanent or temporary contract.
Source: Authors’ calculations using the Annual Survey of Hours and Earnings.
References
Almond, R., Phillips, J. and Sandbrook, W., 2022. Exploring practical ways to support self-employed people to save for retirement: summary of findings from a multi-year research programme. Nest Insight report, https://www.nestinsight.org.uk/wp-content/uploads/2022/11/Exploring-practical-ways-to-support-self-employed-people-to-save-for-retirement.pdf.
Andrew, A., Bandiera, O., Costa-Dias, M. and Landais, C., 2021. Women and men at work. IFS Deaton Review of Inequalities, https://ifs.org.uk/inequality/women-and-men-at-work.
Banks, J., Emmerson, C. and Tetlow, G., 2018. Long-run trends in the economic activity of older people in the UK. NBER Working Paper 24606, https://www.nber.org/papers/w24606.
Blackburn, R., Machin, S. and Ventura, M., 2022. Covid-19 and the self-employed – a two year update. CEP Covid-19 Analysis Series, 028, https://cep.lse.ac.uk/pubs/download/cepcovid-19-028.pdf.
Boileau, B., O’Brien, L. and Zaranko, B., 2022. Public spending, pay and pensions. In C. Emmerson, P. Johnson and B. Zaranko (eds), The IFS Green Budget: October 2022. https://ifs.org.uk/publications/public-spending-pay-and-pensions.
Costa Dias, M., Joyce, R. and Parodi, F., 2020. The gender pay gap in the UK: children and experience in work. Oxford Review of Economic Policy, 36(4), 855–81, https://doi.org/10.1093/oxrep/graa053.
Crawford, C., Keynes, S. and Tetlow, G., 2013. A single-tier pension: what does it really mean? Institute for Fiscal Studies (IFS), Report R82, https://ifs.org.uk/publications/single-tier-pension-what-does-it-really-mean.
Cribb, J. and Emmerson, C., 2020. What happens to workplace pension saving when employers are obliged to enrol employees automatically? International Tax and Public Finance, 27, 664–93, https://doi.org/10.1007/s10797-019-09565-6.
Cribb, J. and Karjalainen, H., 2023. Understanding pension saving among the self-employed. Institute for Fiscal Studies (IFS), Report R248, https://ifs.org.uk/publications/understanding-pension-saving-among-self-employed.
Cribb, J., Miller, H. and Pope, T., 2019. Who are business owners and what are they doing? Institute for Fiscal Studies (IFS), Report 158, https://ifs.org.uk/publications/who-are-business-owners-and-what-are-they-doing.
Cribb, J. and O’Brien, L., 2023. When and why do employees change their pension saving? Institute for Fiscal Studies (IFS), Report 246, https://ifs.org.uk/publications/when-and-why-do-employees-change-their-pension-saving.
Department for Work and Pensions, 2022a. Households below average income: an analysis of the income distribution FYE 1995 to FYE 2021. Available at https://www.gov.uk/government/statistics/households-below-average-income-for-financial-years-ending-1995-to-2021/households-below-average-income-an-analysis-of-the-income-distribution-fye-1995-to-fye-2021.
Department for Work and Pensions, 2022b. Family Resources Survey: financial year 2020 to 2021. https://www.gov.uk/government/statistics/family-resources-survey-financial-year-2020-to-2021/family-resources-survey-financial-year-2020-to-2021.
Johnson, P., Yeandle, D. and Boulding, A., 2010. Making automatic enrolment work: a review for the Department for Work and Pensions. Cm 7954, https://assets.publishing.service.gov.uk/government/uploads/system/uploads/attachment_data/file/214585/cp-oct10-full-document.pdf.
Joyce, R. and Norris Keiller, A., 2018. The ‘gender commuting gap’ widens considerably in the first decade after childbirth. Institute for Fiscal Studies (IFS), Comment, https://ifs.org.uk/articles/gender-commuting-gap-widens-considerably-first-decade-after-childbirth.
Joyce, R. and Xu, X., 2019. The gender pay gap: women work for lower-paying firms than men. Institute for Fiscal Studies (IFS), Comment, https://ifs.org.uk/articles/gender-pay-gap-women-work-lower-paying-firms-men.
Karjalainen, H., 2023. Trends in pension saving among the long-term self-employed. Institute for Fiscal Studies (IFS), Report R249, https://ifs.org.uk/publications/trends-pension-saving-among-long-term-self-employed.
O’Brien, L., 2023. Data on private pension saving in UK surveys. Institute for Fiscal Studies (IFS), Report 251, https://ifs.org.uk/publications/data-private-pension-saving-uk-surveys.
Office for National Statistics, 2022. Employee workplace pensions in the UK, https://www.ons.gov.uk/employmentandlabourmarket/peopleinwork/workplacepensions/bulletins/annualsurveyofhoursandearningspensiontables/2021provisionaland2020finalresults.
Pensions Policy Institute, 2019. Understanding the gender pensions gap. https://www.pensionspolicyinstitute.org.uk/media/3227/20190711-understanding-the-gender-pensions-gap.pdf.
Roantree, B. and Vira, K., 2018. The rise and rise of women’s employment in the UK. Institute for Fiscal Studies (IFS), Briefing Note BN234, https://ifs.org.uk/publications/rise-and-rise-womens-employment-uk.
Data
Department for Work and Pensions, 2022. Family Resources Survey: financial year 2020 to 2021. https://www.gov.uk/government/statistics/family-resources-survey-financial-year-2020-to-2021/family-resources-survey-financial-year-2020-to-2021.
Office for National Statistics. (2022). Annual Survey of Hours and Earnings, 1997-2022: Secure Access. [data collection]. 21st Edition. UK Data Service. SN: 6689, DOI: 10.5255/UKDA-SN-6689-20
University of Essex, Institute for Social and Economic Research. (2022). Understanding Society: Waves 1-11, 2009-2020 and Harmonised BHPS: Waves 1-18, 1991-2009. [data collection]. 16th Edition. UK Data Service. SN: 6614, http://doi.org/10.5255/UKDA-SN-6614-17.
Acknowledgements
This report is an output from a programme of research on ‘Pension saving over the lifecycle’ (WEL /FR-000000374) that is funded by the Nuffield Foundation. Co-funding from the ESRC-funded Centre for the Microeconomic Analysis of Public Policy (ES/T014334/1) is also gratefully acknowledged. We are grateful to Alex Beer, Carl Emmerson and Paul Johnson for useful comments, and to Rowena Crawford for discussion and advice on this work.
This work was produced using data from the Annual Survey of Hours and Earnings, provided by the Office for National Statistics (ONS) through the Secure Research Service. The use of the ONS statistical data in this work does not imply the endorsement of the ONS in relation to the interpretation or analysis of the statistical data. This work uses research datasets which may not exactly reproduce National Statistics aggregates.
We also use data from Understanding Society (the UK Household Longitudinal Study). Understanding Society is an initiative funded by the Economic and Social Research Council and various government departments, with scientific leadership by the Institute for Social and Economic Research, University of Essex, and survey delivery by NatCen Social Research and Kantar Public. The research data are distributed by the UK Data Service. Data from the Family Resources Survey were made available by the Department for Work and Pensions, which bears no responsibility for the interpretation of the data in this report.
Endnotes
Authors

Jonathan Cribb
Jonathan joined IFS in 2011. His research areas includes: pensions, ageing and demographic change, public sector pay, housing, and inequalities.

Heidi Karjalainen
Heidi is a Senior Research Economist in the Retirement, Saving & Ageing sector. Her current research is on pensions and saving for retirement.

Laurence O'Brien
Laurence is in the Retirement, Savings and Ageing sector. His work focuses on people’s savings decisions and on economic activity in later life.
More from IFS
Understand this issue


Policy analysis


Academic research


