
Downloads
Key findings
- The biggest impact on incomes of the increase in the state pension age from 65 to 66 is simply that 65-year-olds lost – on average – state pension income worth around £142 per week in 2020–21. This reduction in state pension income was much larger than the overall increase in earnings arising from around 9% of 65-year-olds delaying their retirement until they reached the new state pension age.
- Accounting for all forms of income, including state pensions, earnings, other benefits, private pensions and investment incomes, the increase in the state pension age pushed down the net income of 65-year-olds by an average of £108 per week. This is an average, and many will have seen bigger reductions in their incomes, while those who remained in full-time work as a result of the reform actually received a higher total income than if the state pension age had remained at 65.
- The reduced payments of state pensions – and the higher direct tax payments resulting from the increase in the state pension age – boosted the public finances by around £4.9 billion per year. This is the counterpart to the reductions in household incomes caused by the reform. This exchequer gain is equivalent to around ¼% of national income and almost 5% of public spending on state pensions.
- The reductions in household incomes have had a particularly important effect on lower-income households: they have caused significant increases in income poverty rates among 65-year-olds. The reform caused absolute income poverty rates (after accounting for housing costs) among 65-year-olds to climb to 24%, some 14 percentage points higher than – or more than double – the 10% that we estimate it would have been had the state pension age remained at 65.
- For some groups, the increase in the state pension age from 65 to 66 caused absolute income poverty rates among 65-year-olds to rise by much more. These include single people (rising to 38%, 22 percentage points higher than the 16% it would have been without the reform), those with at most GCSE-level education (to 35%, 21 percentage points higher than the 14% it would have been) and renters (to 46%, 24 percentage points higher than the 22% it would have been). This is because many in these groups were close to the poverty line prior to the latest increase in the state pension age.
- This latest increase in the state pension age led to a larger increase in income poverty than that seen following earlier increases in the female state pension age. This is for two reasons. First, the gap between state support for those just above and just below state pension age has increased, as both means-tested support for pensioners and state pensions paid to new pensioners have risen while working-age benefits have not. Second, fewer people are in work at older ages, meaning people were much more reliant on the state pension at age 65 than at age 60.
- Most of the increase in absolute income poverty for 65-year-olds as a result of the reform has been among people not in paid work. The fraction of 65-year-olds who were in poverty and not in employment rose by 10 percentage points from a pre-reform baseline of 9%. However, there was also an increase in in-work poverty, with the share of 65-year-olds in work and in poverty rising by 3½ percentage points from a pre-reform baseline of only 1% of the 65-year-old population being in in-work poverty.
1. Introduction
With rising life expectancy and an ageing population, there are pressures on the financial sustainability of providing state pensions in the UK: the number of people of pensionable age is projected to reach over 15.2 million by 2045, a 28% increase on the level in 2020 (Office for National Statistics, 2022). One response to this challenge by the UK government has been to increase the earliest age at which people can claim a state pension (‘the state pension age’, SPA). The female state pension age began rising from age 60 in April 2010, achieving parity with the male state pension age of 65 in late 2018. The state pension age for both men and women then increased from 65 to 66 between December 2018 and October 2020. It is this latter reform that we examine in this report. Further increases in the state pension age are already legislated, starting with an increase to age 67 between 2026 and 2028.
Although such increases to the state pension age are a coherent government response in the face of rising life expectancy at older ages, they can have a substantial effect on household finances. In the current year (2022–23), a full new state pension is worth £185.15 a week.1 This is a significant amount for many: state support (the most important source of which is the state pension) makes up just over half of income for middle-income pensioners, and more than 80% of income for the poorest fifth of pensioners (Department for Work and Pensions, 2022).
In response to a higher state pension age, some people might change their retirement and financial plans. The full effect of a rise in the state pension age on household incomes will depend on these responses and is therefore unclear a priori. In this report, we quantify the impact of increasing the state pension age from 65 to 66 (which occurred between 2018 and 2020) on household incomes, poverty and public finances, after – in particular – taking into account that some will remain in paid work at age 65 as a result of the reform. Not only is this analysis important for evaluating this previous increase in the state pension age, but it is also useful for assessing the potential effects of future increases.
This is especially important now given the upcoming second independent review of the state pension age, scheduled to be published by May 2023. The first review (known as the ‘Cridland Review’; undertaken in 2017) concluded (among other things) that the increase in the state pension age, legislated to take place between 2044 and 2046, should be brought forwards to between 2037 and 2039, but that the second review should reconsider the timing of the increase in the light of emerging evidence (Independent Review of the State Pension Age, 2017).
Changing employment plans is one key way in which people can respond to a higher state pension age. Previous research at IFS showed that the increase in the state pension age from 65 to 66 led to many people staying in work longer: Cribb, Emmerson and O’Brien (2022) found that the employment rate of 65-year-olds increased by around 8 percentage points in response to the reform, with relatively similar effects for men and women. That research also identified some groups who seemed to be more adversely affected by the increase in the state pension age, such as the 5,000 additional 65-year-olds who were unemployed (rather than retired or remaining in paid work) due to the reform.
However, employment responses are only part of the story when assessing the impact of state pension age increases. In this report, we analyse the extent to which households’ incomes were affected by the increase in the state pension age from 65 to 66, as well as which components of household income changed and by how much. We build on the analysis of Cribb and Emmerson (2019), who examined the effect of the earlier increase in the female state pension age from 60 to 63 on household living standards. They found that that increase in the female state pension age led to a reduction in women’s household incomes by £32 per week (in 2015–16 prices) on average – with the loss of state pension income being partially offset by an increase in earnings – and an increase in the share of women in absolute income poverty by 6 percentage points.
There are several reasons why the increase in the state pension age from 65 to 66 might have different effects from the earlier increase in the female state pension age analysed by Cribb and Emmerson (2019). First, this is the first time that the effect of an increase in the male state pension age on household income and poverty rates has been analysed in the UK. There are also reasons to suspect that changes in the state pension age might have different effects as the state pension age reaches older ages, and as other aspects of the tax and benefit system change over time. For instance, 65-year-olds tend to have more health problems than 60-year-olds and so may be less able to work and may be more reliant on the benefit system if not in paid work. In addition, as we show, the gap between pensioner benefits and working-age benefits has increased over the past decade, which could increase the importance of the state pension age for less well-off households. All these changes mean that the effect of the earlier state pension age increase for women might differ from the effect of the more recent state pension age increase.
The rest of this report proceeds as follows. We begin in Chapter 2 by briefly describing the data set we use for our analysis, the Family Resources Survey, as well as our empirical methodology. Then, in Chapter 3, we estimate the effect of the increase in the state pension age from 65 to 66 on individual incomes, both in terms of the effect on the average level of income of 65-year-olds and in terms of the sources of income that individuals have. In doing so, we shine a light on how higher state pension ages interact with other aspects of the tax and benefit system and we quantify the effect of the reform on the public finances.
In Chapter 4, we turn our focus to the impact of the recent increase in state pension age on household incomes. We do this because household incomes are generally a better measure of living standards than individual incomes, and because official income poverty rates are measured by the fraction of people whose household income falls below a particular level.
Throughout Chapter 4, we consider how the effects of the higher state pension age vary by income, sex and marital status. A delay in the ability to claim a state pension is likely to matter more for poorer households than for richer households, but it is a priori unclear by how much. Whether poorer households offset these losses to a greater extent than richer households is therefore important when it comes to assessing the impact of the policy on income poverty. Cribb, Emmerson and O’Brien (2022) find that individuals in more deprived neighbourhoods are more likely to stay in work in response to this state pension age increase, potentially suggesting that lower-income households might be more likely to offset losses in state pension income with employment income. But it is still a minority of individuals in these areas that are found to respond to the rise in the state pension age by working longer. Indeed, many poorer people will not be able to respond through working longer, perhaps because they were already planning on working past 65, or alternatively because they are unable to work due to health problems or inequalities in labour market access (Trades Union Congress, 2022).
In addition, recent trends in inequality and marital status make analysing the differential effects of the reform along these lines particularly important. Recent research from the Centre for Ageing Better (2022) highlights that there are widening income and wealth inequalities among people in their 50s and 60s, as well as an increase in the number of people of these ages living alone. Estimating the impact of the reform separately by sex is also important as policies to extend working lives can have substantially different effects on men and women (Foster, 2021). Chapter 5 concludes this report.
2. Data and methodology
We use data from the Family Resources Survey (FRS), a cross-sectional household survey which contains around 20,000 households per year that is currently available up to the end of March 2021 (Department for Work and Pensions, 2022). The FRS contains detailed information on people’s incomes from different sources, as well as characteristics usually available in survey data such as sex, age, education, housing tenure and household structure. It also contains month and year of birth, and a flag for whether the individual is over or under state pension age at the point they are interviewed. The FRS is used to create derived income variables that underpin the government’s official income and poverty statistics (known as the ‘Households Below Average Income’ statistics); we use these derived variables in this work.
Consistent with the Department for Work and Pensions (DWP), when looking at the effects of the increase in the state pension age on absolute income poverty, we use the government’s measure: having a household (net equivalised) income that is below 60% of the median in 2010–11, after adjusting for inflation. When we equivalise incomes (to take account of household size and structure), we use the OECD modified equivalence scale and express values as equivalent levels of income for a couple with no dependent children. All cash figures are expressed in 2020–21 prices (adjusting for inflation using variants of the Consumer Prices Index, as DWP does in its official poverty statistics).2 To prevent households with extremely high (or low) incomes driving our results, in each year of the data we exclude individuals who are in households that have the lowest 1% and the highest 1% of household incomes.
We estimate the impact of increasing the state pension age on different measures of household income. The fact that between late 2018 and late 2020, increasingly large numbers of 65-year-olds were under, rather than over, the state pension age, and the fact that 66- and 67-year-olds were always over the state pension age, mean that we can use a ‘difference-in-differences’ methodology to estimate the causal effect of the reform.
In other words, the challenge faced when estimating the causal impact of the reform is that while 65-year olds’ outcomes may change as the state pension age rises, we do not necessarily know what would have happened to these outcomes if the reform had not been introduced. We therefore need a ‘control group’ that did not experience the reform to help us estimate this counterfactual. In our case, this control group is made up of 66- and 67-year-olds – who were always over the state pension age. Therefore, the causal impact of increasing the state pension age is estimated by comparing how outcomes change among 65-year-olds (who were affected by the reform) and how they change among 66- and 67-year-olds (who were not). The key assumption that we must make in this analysis is that, in absence of the reform, the outcomes of 65-, 66- and 67-year-olds would have all evolved over time in the same way.
This is essentially the same way that Cribb, Emmerson and O’Brien (2022) estimated the impact of increasing the state pension age from 65 to 66 on employment and other labour market outcomes using data from the Labour Force Survey and the Annual Population Survey. It is also essentially how Cribb and Emmerson (2019) estimated the impact of the increase in the female state pension age from 60 to 63 on household incomes and poverty rates.
Specifically, in this report, we have estimated the following econometric model:
(1)
where the outcome of interest (, such as household income) for individual i, observed in time period t, is allowed to vary by whether the individual is aged below or above the state pension age (underSPA) plus a set of controls. The coefficient is of key interest: it is the effect of being under, rather than over, the state pension age on the outcome. As the increase in the state pension age means that 65-year-olds are now under the state pension age, this is the same as the effect of increasing the state pension age.
The key controls are time (measured in years and quarters, ) and age (also measured in years and quarters, ). We also control for a set of other characteristics that could affect household incomes (contained in the equation in ): relationship status, education, ethnicity, housing tenure, region, partner’s age, partner’s education and whether the partner is under their own state pension age.
We use FRS data from two years before the 65 to 66 rise in the state pension age (2016 Q4) until 2021Q1 (the latest data, up to five months after the state pension age reached 66). The sample includes 65-, 66- and 67-year-olds over this period. We estimate our econometric model using Ordinary Least Squares and cluster standard errors at the year-and-month-of-birth level, as those born in a particular month have the same state pension date.
In Table A.1 in the appendix, we show the sensitivity of the key results in this report to a variety of different specifications: including a (linear) control for the year of birth; changing the amount of pre-reform data that is included; and changing the calculation of standard errors. None of these changes makes an important difference to our results.
3. Effect of the reform on individual incomes and government finances
In this chapter, we examine how the increase in the state pension age from 65 to 66 affected individuals’ incomes. As well as looking at how average levels of income changed in response to the reform, we also analyse how different components of income were affected – for example, how income from benefits, earnings from employment and occupational pensions have changed. In addition, we calculate the overall impact of the reform on government finances. This calculation takes into account the direct effect of not paying state pension income to 65-year-olds together with the effects of changes in direct tax payments and other state benefits, due to people’s responses to the reform.
To start with, we show graphically the direct impact of the reform on the state pension income of 65-year-olds. Figure 3.1 shows the percentages of people aged 65, 66 and 67 receiving state pension income by age and year. In 2018, when nearly all 65-year-olds and all 66- and 67-year-olds were above the state pension age, 93% of people aged 65 claimed the state pension and therefore reported receiving state pension income. This proportion was fairly stable over time, and slightly lower than the share of 66- and 67-year-olds reporting positive state pension income (93% and 96% respectively), implying that a (very) small proportion of people delay claiming their state pension by a year or two. However, the figure shows a stark drop in the share of 65-year-olds receiving positive state pension income after 2018, with the proportion reaching 18% in 2020. This is a direct result of the increase in the state pension age. Of course, once the state pension age reached 66, on 6 October 2020, all 65-year-olds were too young to claim the state pension, and so the share would be zero for 2021 and beyond.
Figure 3.2 shows average weekly state pension income by age and year for this same set of ages. We can see that average weekly state pension income for individuals of these ages rose slightly until 2018, from £120–130 in 2009 to £140 in 2018. This is a result of: increases in the real value of the state pension due to the ‘triple lock’ introduced in 2010;3 other reforms to the state pension system in 2010 and 2016 that increased the generosity of the system for many reaching the state pension age after these dates; and increasing labour market participation over time, particularly for women, which boosts state pension entitlements. The graph also shows the effect of the increase in the state pension age, with the average state pension income of 65-year-olds falling to just £29 per week in 2020 as fewer and fewer 65-year-olds were eligible to claim the state pension.
Figure 3.1. Percentage of individuals receiving state pension income, by age and year
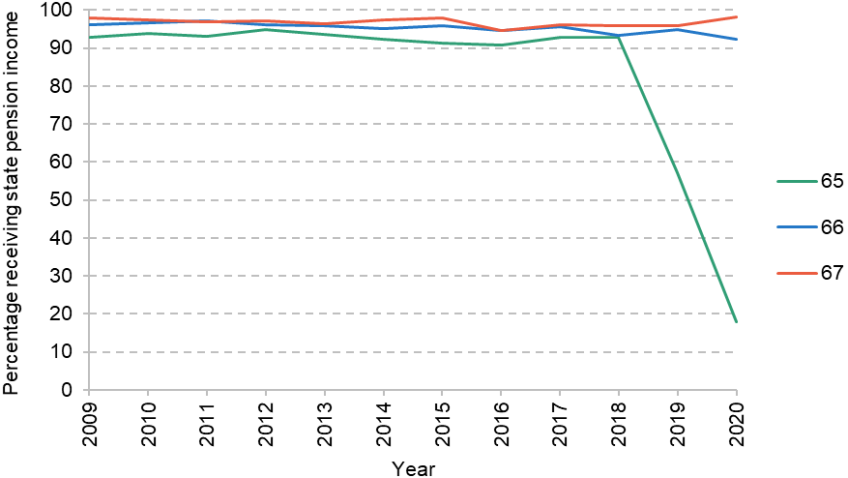
Note: State pension age started to rise above 65 in December 2018 and reached 66 in October 2020. The percentage of 65-year-olds receiving state pension income would be zero from 2021 onwards.
Source: Family Resources Survey.
Figure 3.2. Mean individual state pension income (£ per week), by age and year
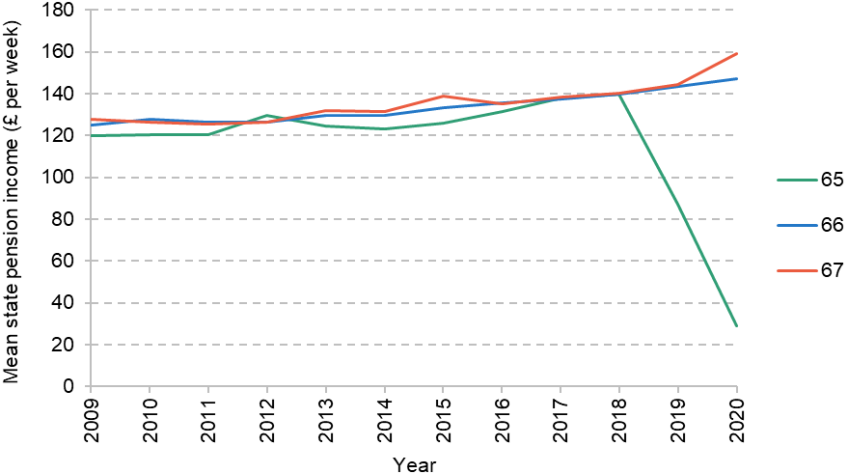
Note: State pension age started to rise above 65 in December 2018 and reached 66 in October 2020. State pension income would be zero for all 65-year-olds from 2021 onwards.
Source: Authors’ calculations using the Family Resources Survey.
Therefore, by making 65-year-olds ineligible to claim the state pension, the direct effect of the reform was to make 65-year-olds worse off by around £140 per week on average. Since over 90% of 65-year-olds claimed the state pension before 2018, this direct cost would be borne by the vast majority. However, many individuals can act to lessen the effect of this income hit by remaining in paid work rather than retiring or by claiming other types of benefits, for example.
Figure 3.3 shows graphically how employment rates responded to the increase in the state pension age to 66. Concentrating on the period before this increase, we can see that the employment rates of 65-, 66- and 67-year-olds evolved fairly similarly, increasing gradually between 2009 and 2018. The employment rate of 65-year-olds increased by 4 percentage points from 19% in 2009 to 23% in 2018, while the employment rate of 66-year-olds increased by 5 percentage points from 16% to 21%.
Figure 3.3. Percentage of individuals receiving positive income from employment, by age and year
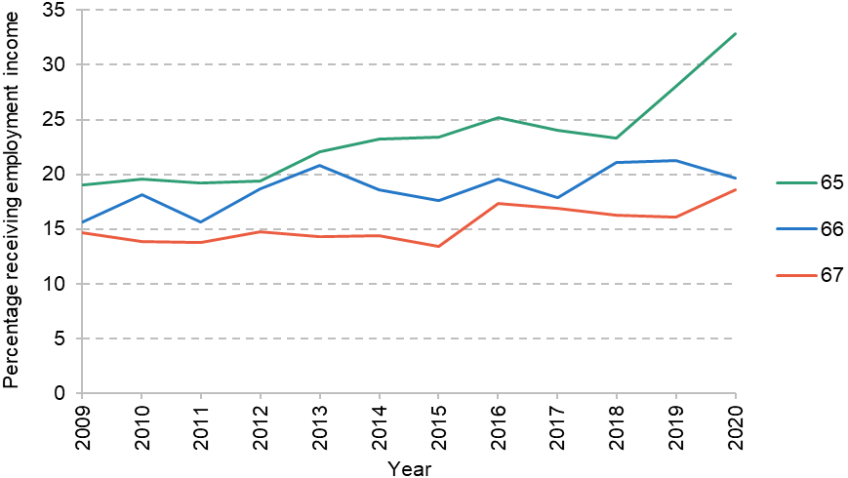
Note: State pension age started to rise above 65 in December 2018 and reached 66 in October 2020.
Source: Authors’ calculations using the Family Resources Survey.
However, between 2018 and 2020, while the state pension age was rising from 65 to 66, the percentage of 65-year-olds receiving positive employment income rose starkly from 23% to 33%, while the percentage of 66- and 67-year-olds receiving positive employment income stayed relatively flat. Assuming that 66- and 67-year-olds are a good comparison group, this suggests that the increase in the state pension age led to more 65-year-olds staying in work – a result that is consistent with other analysis of the effects of the increase in the state pension age from 65 to 66 using data from the Labour Force Survey and the Annual Population Survey (Cribb, Emmerson and O’Brien, 2022).
What about other sources of income? In Table 3.1, we present regression results showing the estimated impact of the increase in the state pension age from 65 to 66 on whether or not individuals report being in receipt of income from different sources, using the methodology set out in Chapter 2.
Table 3.1. Effect of increasing the state pension age from 65 to 66 on probability of receipt of different sources of individual income (percentage points)
Outcome | Effect of being under SPA | Standard error | Mean for |
Receives employment income | +8.8*** | [2.6] | 21% |
Receives any state benefits | –69.3*** | [3.7] | 100% |
Receives any state benefits (excl. state pension income) | +3.9* | [2.0] | 21% |
Receives occupational pension | –6.3** | [2.5] | 64% |
Receives investment income | –5.5** | [2.4] | 50% |
Receives employment or occupational pension income | +1.5 | [2.2] | 65% |
Note: ***, ** and * denote the effect is significantly different from zero at the 1%, 5% and 10% level, respectively. Robust standard errors are clustered at the month-of-birth level. There are 6,654 observations in all models. Pre-reform means are estimated using data from 2014Q4 to 2018Q3.
Source: Authors’ calculations using the Family Resources Survey.
First, confirming the previous graphical evidence, we estimate that being under the state pension age leads to an 8.8 percentage point increase in the probability of receiving employment income. This result is very similar to the estimated impact found by Cribb, Emmerson and O’Brien (2022), who estimated that the reform led to an increase in the employment rate of 65-year-olds by around 8 percentage points.
Unsurprisingly, we estimate that being under the state pension age substantially reduces the probability of receiving state benefits by 69 percentage points, which is driven by the fact that everyone who previously claimed the state pension is no longer able to do so, but some people will be able to claim other benefits. Indeed, there is actually a small increase in the probability (4 percentage points; significant at the 10% significance level) of claiming a benefit other than the state pension.
Finally, the increase in the state pension age from 65 to 66 also led to a decrease in the proportions of 65-year-olds receiving occupational pension income and investment income by 6.3 and 5.5 percentage points, respectively. The comparable figures in Cribb and Emmerson (2019) for the increase in the female state pension age from 60 to 63 are just 3.2 and 1.5 percentage points, indicating that individuals were more likely to delay receipt of occupational pensions in response to the state pension age increasing from 65 to 66 compared with the earlier increase. The final line of the table shows that the share of 65-year-olds receiving either employment or occupational pension income increased by only 1.5 percentage points, which is not statistically significantly different from zero. This implies that the delay of occupational pension receipt was driven by people who worked longer due to the increase in the state pension age choosing also to delay receipt of their occupational pension.
Table 3.2. Effect of increasing the state pension age from 65 to 66 on different sources of individual income (£ per week)
Outcome | Effect of being under SPA | Standard error | Mean for |
Gross earnings (incl. self-emp.) | +46.80*** | [13.60] | 75.70 |
Gross occupational pensions | –15.60* | [8.50] | 104.70 |
Gross investment income | –1.30 | [2.90] | 25.10 |
Total gross private income | +30.00** | [13.60] | 205.50 |
Benefit income (incl. state pension) | –129.80*** | [4.40] | 163.80 |
State pension income | –141.70*** | [2.80] | 134.30 |
Benefit income (excl. state pension) | +14.50*** | [3.70] | 26.30 |
Net income | –107.70*** | [10.50] | 335.30 |
Net transfer from government | –137.70*** | [6.90] | 129.80 |
Note: ***, ** and * denote the effect is significantly different from zero at the 1%, 5% and 10% level, respectively. Robust standard errors are clustered at the month-of-birth level. There are 6,654 observations in all models. Pre-reform means are estimated using data from 2014Q4 to 2018Q3. Effects are rounded to the nearest 10p. ‘Benefit income (excl. state pension)’ also excludes other pensioner benefits such as the warm homes discount and the Christmas bonus paid to certain benefit recipients (including recipients of the state pension).
Source: Authors’ calculations using the Family Resources Survey.
We now turn to how the increase in the state pension age from 65 to 66 affected the average level of individual income from different sources. The results are reported in Table 3.2. Importantly, note that those who are not receiving any income from a particular source are included in the analysis as receiving £0 per week from that source.
On average, being under the state pension age is found to increase individuals’ gross private income by around £30 per week. This is driven by an increase in employment income of around £47 per week, consistent with the increase in employment due to the increase in the state pension age. This is almost exactly the same as the estimated increase in employment income found by Cribb and Emmerson (2019) – an effect of £44 per week (in 2015–16 prices, which is just over £47 per week in 2020–21 prices). Being under the state pension age is also associated with a small decrease in occupational pension income by around £16 per week.
Despite the estimated increase in gross private income, the increase in the state pension age from 65 to 66 caused a decrease in net (i.e. post-tax, post-benefit) income of £108 per week. We do find a statistically significant increase in the amount of other benefits received by individuals of around £15 per week; however, neither this nor the increase in employment income is enough to completely offset the fall in state pension income of £142 per week.
Of course, the £108 per week loss in net income is an average, and will not necessarily reflect the actual loss experienced by the majority of people. Some people may actually be better off financially due to the reform. Indeed, this will be true for most of the individuals who stay in full-time work longer due to the reform, whose extra earnings should outweigh their lost state pension income. However, over 90% of people do not change their employment decisions at age 65 due to the reform. Most of these people will have experienced a loss of net income of greater than £108 per week.
In Tables A.2 and A.3 in the appendix, we examine how the effect of the increase in the state pension age to 66 differs between men and women, and between single people and those in a couple, respectively.4 Women have a slightly larger decrease in net income (£112 per week) than do men (£100 per week). This is driven by a larger increase in gross private income for men than for women, mainly coming from a larger increase in employment income for men (£60 per week) than for women (£33 per week), reflecting higher average earnings for men. Offsetting this, we find that benefits fall by less for women (£123 per week) than for men (£136 per week). This is mainly driven by women experiencing a larger increase in non-state-pension benefits of £19 per week, compared with £11 for men.
When comparing single people with those in a couple, we find a smaller reduction in the net income of single people, at £96 per week, compared to a £113 per week reduction for individuals in a couple. This is caused by the gross employment income of single people increasing by £61 per week, while the gross employment income of those in a couple increases by £39 per week.
We can also calculate the effect of the increase in the state pension age from 65 to 66 on government finances. On the one hand, government finances will benefit from not having to pay state pension income to 65-year-olds, saving around £5.1 billion per year. This is augmented by higher tax revenues arising both from employee National Insurance contributions now being levied on the earnings of 65-year-olds and from the increase in the number of 65-year-olds in work. We estimate that the amount of tax on employment income (i.e. income tax and employee National Insurance) paid by 65-year-olds increased by £0.4 billion per year due to the reform. On the other hand, the reform led to an increase of £0.5 billion per year in other benefit payments. Taking these together, and adding in other small effects on government finances, we estimate that the reform benefited the exchequer by approximately £4.9 billion per year (about ¼% of GDP or 5% of government spending on state pensions).
In summary, this chapter has quantified the changes in individual incomes that have been caused by the increase in the state pension age from 65 to 66. We have shown that in response to falls in state pension income for 65-year-olds, increased employment rates have increased average incomes from employment, and that there have been increases in benefits (other than the state pension) paid to 65-year-olds. Delays in claiming occupational pensions as a result of retiring later push down average incomes slightly. However, the counterpart to falling incomes is the considerable benefit to the exchequer as a result of the reform, by almost £5 billion per year (in 2020–21 prices).
4. Effects on household incomes and poverty
Household incomes are typically better measures of living standards than individual incomes, as many people on low individual incomes live with someone with a higher income. In this chapter, we consider how household incomes have been affected by the increase in the state pension age from 65 to 66. We also show how the estimated impact on household income differs across the income distribution. Households near the bottom of the income distribution are of particular interest because they are more likely to be pushed into income poverty by the loss in state pension income. Our estimates indicate that the reform led to a large increase in the share of households in income poverty, particularly among certain groups. We then conclude this chapter by examining the drivers behind the significant increase in income poverty that we find.
4.1 Effect on household incomes
We start by analysing how the increase in the state pension age affected average household incomes. This may differ from the effect on individual incomes if partners’ employment decisions, benefit eligibility or decisions to draw an occupational pension respond to the increase in the state pension age.
The results are shown in Table 4.1. We estimate that the increase in the state pension age reduced 65-year-olds’ (unequivalised) net household incomes by £83 per week on average. This is lower than the reduction in household benefits of £120 per week due to an increase in private income of £55 per week. If we adjust household incomes (using the OECD modified equivalence scale) for the fact that couples do not need to have twice as much income to have the same living standards as a single person, we estimate that the reform decreased average equivalised household income by £101 per week before housing costs are deducted (BHC) and by £110 per week after housing costs are deducted (AHC).
How was this decrease in average household income spread out across the income distribution? This is an important question because a £100 decrease in income for a household with initial weekly income of £300 will be felt much more keenly than a £100 decrease for a household with initial weekly income of £1,000, for example.
Table 4.1. Effect of increasing the state pension age from 65 to 66 on total household income (£ per week)
Outcome | Effect of being under SPA | Standard error | Mean for |
Gross private income | +55.40** | [26.90] | 431.50 |
Benefit income (incl. state pension) | –120.40*** | [6.80] | 250.50 |
Net income | –83.10*** | [20.70] | 606.90 |
Equivalised net income (BHC) | –101.40*** | [17.40] | 619.00 |
Equivalised net income (AHC) | –109.80*** | [17.30] | 590.40 |
Note: ***, ** and * denote the effect is significantly different from zero at the 1%, 5% and 10% level, respectively. Robust standard errors are clustered at the month-of-birth level. There are 6,654 observations in all models. Pre-reform means are estimated using data from 2014Q4 to 2018Q3. Effects are rounded to the nearest 10p.
Source: Authors’ calculations using the Family Resources Survey.
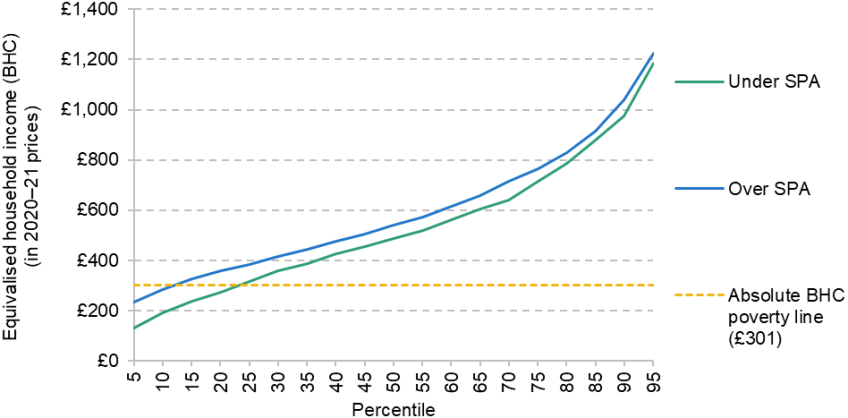
Figure 4.1. Distribution of household income among 65-year-olds, by whether they have reached their state pension age or not
Note: Sample includes 65-year-olds between 2016Q4 and 2021Q1.
Source: Authors’ calculations using the Family Resources Survey.
Figure 4.1 shows the distribution of equivalised household income for 65-year-olds who are over and under the state pension age between late 2016 and early 2021. Although differences between the two groups are not necessarily causal (because they are slightly different ages and are observed, on average, at slightly different times), this provides suggestive evidence of the distributional effect of the increase in the state pension age. We can see that, if anything, the reduction in household income is greater in absolute terms for households at the bottom of the income distribution.
For the bottom fifth of the household income distribution, household incomes are around
£90–100 lower for people under the state pension age than for people above the state pension age, but this gap drops to closer to £50 further up the distribution. This pattern could suggest that those higher up the household income distribution are better able to offset the loss in household income due to the reform. Losses as a proportion of household income would be even more concentrated on lower-income households.
We can also get an idea of how the increase in the state pension age affected the poverty rate of 65-year-olds from Figure 4.1. Among 65-year-olds who are over the state pension age, around 12% had a household income below the absolute poverty line, £301 per week (in 2020–21 prices).5 However, among 65-year-olds who are under the state pension age, we can see that around 25% were in absolute poverty. This suggests an increase in the absolute poverty rate of around 13 percentage points.
4.2 Effect on income poverty
In this section, we formally estimate the impact of the increase in the state pension age on the absolute poverty rate, and how this differs for different groups of the population. We start by examining absolute income poverty rates over time for men and women separately.
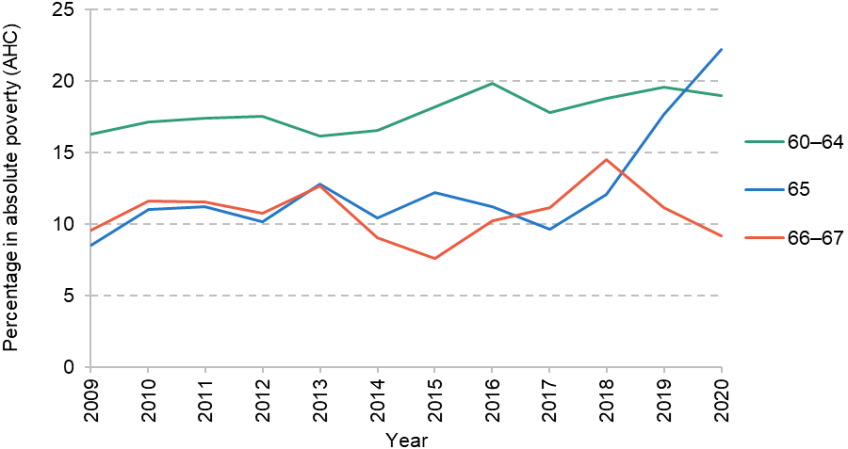
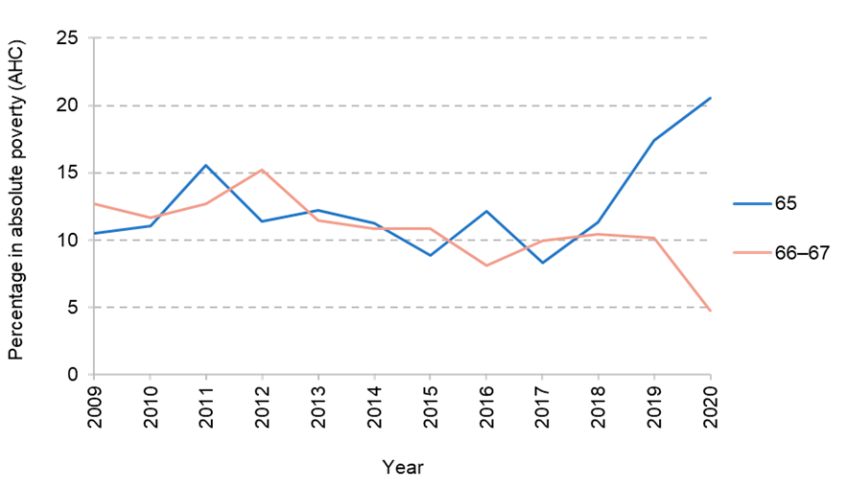
Figure 4.2 shows the share of older men in absolute poverty (measured after housing costs) over time for three separate age groups. Two things are worth noting. First, the graph shows that the poverty rates of 65-year-olds and of 66- and 67-year-olds were fairly steady at around 10% until 2018. However, after the state pension age started to rise above 65, the poverty rate among 65-year-olds increased sharply, reaching 22% in 2020, which is similar to, but slightly higher than, the poverty rate of 60- to 64-year-old men in this year. Second, we can see that the poverty rate of 60- to 64-year-old men increased over the past ten years from 16% in 2009 to 19% in 2020. In Section 4.3, we discuss why the poverty rate of people just under the state pension age might have risen over the past decade. Figure 4.3 shows the percentages of 65-year-old and of 66- and 67-year-old women in poverty over time.6 Between 2013 and 2018, we can see a fairly stable fraction of 65-, 66- and 67-year-old women in poverty, at around 10%. Again, after the state pension age rises above 65, the poverty rate of 65-year-old women increases sharply, reaching 21% in 2020.
Figure 4.2. Share of men in absolute poverty, by age and time
Source: Authors’ calculations using the Family Resources Survey.
Figure 4.3. Share of women in absolute poverty, by age and time
Source: Authors’ calculations using the Family Resources Survey.
Table 4.2. Effect of increasing the state pension age from 65 to 66 on the probability of being in absolute income poverty (percentage points)
Outcome | Effect of being under SPA | Standard error | Mean for |
In absolute poverty (BHC) | +12.9*** | [2.2] | 10.5% |
In absolute poverty (AHC) | +13.7*** | [2.0] | 10.2% |
Note: ***, ** and * denote the effect is significantly different from zero at the 1%, 5% and 10% level, respectively. Robust standard errors are clustered at the month-of-birth level. There are 6,654 observations in all models. Pre-reform means are estimated using data from 2014Q4 to 2018Q3.
Source: Authors’ calculations using the Family Resources Survey.
Undertaking more formal econometric analysis, Table 4.2 shows the impact of being under the state pension age on the probability of being in absolute poverty (measured both before and after housing costs are deducted), estimated using the methodology described in Chapter 2.
The regression results indicate that the reform led to an increase in the absolute poverty rate of 65-year-olds by 12.9 percentage points (measured before housing costs) or 13.7 percentage points (measured after housing costs) – very similar to the implicit effect on poverty shown in Figures 4.2 and 4.3. These are large effects: since the absolute income poverty rate of 65-year-olds under the state pension age between 2019 and 2021 reached 24% (measured after housing costs), our estimate implies that the absolute poverty rate of 65-year-olds would have remained at 10% in absence of the state pension age increase. In other words, increasing the state pension age from 65 to 66 more than doubled the absolute poverty rate of 65-year-olds. In addition, our results are larger than those found for the earlier increase in the female state pension age from 60 to 63: for that reform, Cribb and Emmerson (2019) found that being under the state pension age led to a 6.4 (AHC) or 8.7 (BHC) percentage point increase in the absolute poverty rate.
In Table 4.3, we examine how the estimated increase in income poverty varies across different groups in the population. We find large differences for some groups, although relatively little difference between the effects on men and women. Focusing on the ‘after housing costs’ measures (as they allow for the fact that many people will have near-zero housing costs as a result of being owner-occupiers), 65-year-old men saw an increase of 13 percentage points in poverty, compared with an increase of 14½ percentage points for 65-year-old women.
Table 4.3. Effect of increasing the state pension age from 65 to 66 on the probability of being in absolute poverty, by subgroup (percentage points)
Subgroup | Effect of being under SPA | Standard error | Mean for | Observations |
In absolute poverty (BHC) |
|
|
|
|
Men | +13.3*** | [3.1] | 10.4% | 3,237 |
Women | +12.7*** | [3.0] | 10.6% | 3,417 |
Single | +17.7*** | [5.1] | 16.0% | 1,829 |
Couple | +11.9*** | [2.4] | 8.5% | 4,825 |
Degree | +9.2*** | [3.1] | 6.2% | 1,665 |
A-level | +9.2** | [3.5] | 9.7% | 1,801 |
GCSE or below | +19.1*** | [3.4] | 12.7% | 3,188 |
Own home | +10.8*** | [2.3] | 11.0% | 5,322 |
Rent home | +19.9*** | [5.2] | 8.6% | 1,332 |
In absolute poverty (AHC) |
|
|
|
|
Men | +13.1*** | [3.0] | 10.6% | 3,237 |
Women | +14.5*** | [2.6] | 9.9% | 3,417 |
Single | +21.9*** | [4.8] | 16.3% | 1,829 |
Couple | +11.3*** | [2.2] | 8.0% | 4,825 |
Degree | +7.0** | [2.9] | 6.1% | 1,665 |
A-level | +11.4*** | [3.4] | 9.1% | 1,801 |
GCSE or below | +20.6*** | [3.5] | 12.4% | 3,188 |
Own home | +11.0*** | [2.0] | 6.9% | 5,322 |
Rent home | +24.4*** | [5.4] | 22.6% | 1,332 |
Note: ***, ** and * denote the effect is significantly different from zero at the 1%, 5% and 10% level, respectively. Robust standard errors are clustered at the month-of-birth level. Pre-reform means are estimated using data from 2014Q4 to 2018Q3.
Source: Authors’ calculations using the Family Resources Survey.
For some groups, the higher state pension age increased the income poverty rate by around 20 percentage points. We estimate an increase in absolute poverty (after housing costs) of 11 percentage points for those living in a couple, compared with 22 percentage points for single people. This is despite the fact that we actually found a smaller reduction in individual net income for single people than for people in a couple in Chapter 3. The absolute income poverty rate of single people reached 38% for 65-year-olds under the state pension age between 2019 and 2021, so we estimate it would have stayed at 16% if the state pension age had remained at 65. There are two reasons why we see such a large increase for single people. The first is that they are generally poorer to start with, so any reduction in their income is more likely to push them into poverty. The second is that they generally have higher per-person equivalised housing costs than people in a couple, which explains why the difference in the poverty increase is not quite so large when measuring poverty before housing costs.
The increase in income poverty is also larger among people with less formal education than among people with more formal education and among renters compared with homeowners. The poverty rate (after housing costs) increased by 7 percentage points among 65-year-olds with a degree, compared with almost 21 percentage points among 65-year-olds with GCSE (or equivalent) qualifications or less. The income poverty rate of this latter group reached 35% for 65-year-olds under the state pension age between 2019 and 2021, so our estimate implies it would have been 14% in absence of the reform. In addition, the reform increased the poverty rate by 11 percentage points for homeowners and by 24 percentage points among renters. The income poverty rate of renters reached 46% for 65-year-olds under the state pension age between 2019 and 2021, so our estimate implies it would have been 22% had the state pension age stayed at 65. Much of this latter pattern is driven by the large difference in housing costs between the two groups, making renters more likely to be in poverty (AHC) to start with: the increases in poverty are more similar when measured before housing costs.
4.3 Drivers of the large increase in poverty
In this section, we attempt to examine more deeply the drivers of the substantial increase in poverty we found in Section 4.2, including why the rise that results from the increase in the state pension age from 65 to 66 is greater than that found for the earlier increase in the female state pension age.
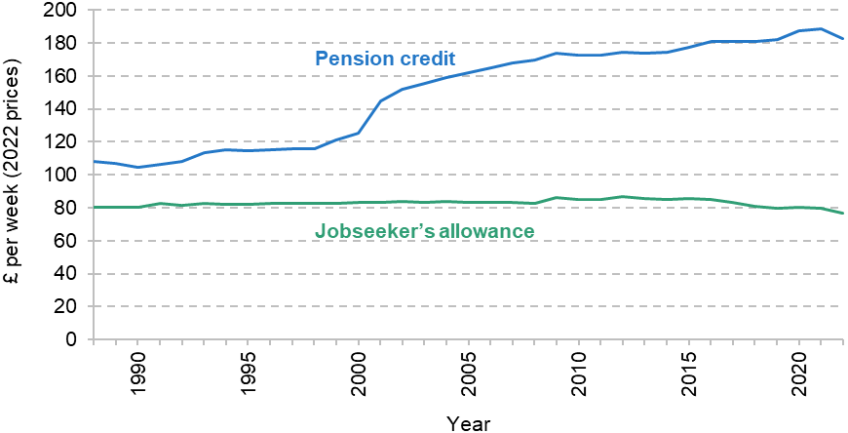
One reason why the impact of the state pension age on poverty might have increased over time is that the gap in the generosity between working-age and pensioner benefits has widened over time. For example, Figure 4.4 shows the maximum weekly amounts of pension credit (only available to low-income households over the state pension age) and jobseeker’s allowance (available to out-of-work individuals under the state pension age) that a single-person household could receive over time.7 There has been a clear divergence in the generosity of these benefits, especially during the early 2000s, but even between 2010 and 2020 pension credit went from being worth 103% more than jobseeker’s allowance to 134% more. As well as being more generous in cash terms, pension credit has less stringent eligibility requirements than jobseeker’s allowance, as you do not need to look actively for work to claim it.
Figure 4.4. Pension credit and jobseeker’s allowance, 2022 prices, 1988–2022
Note: Real levels in April of each year are shown. Entitlements shown for single adults. Note that other forms of support are available to low-income people who are out of work above and below pension age, such as housing benefit.
Source: DWP, Abstract of Statistics.
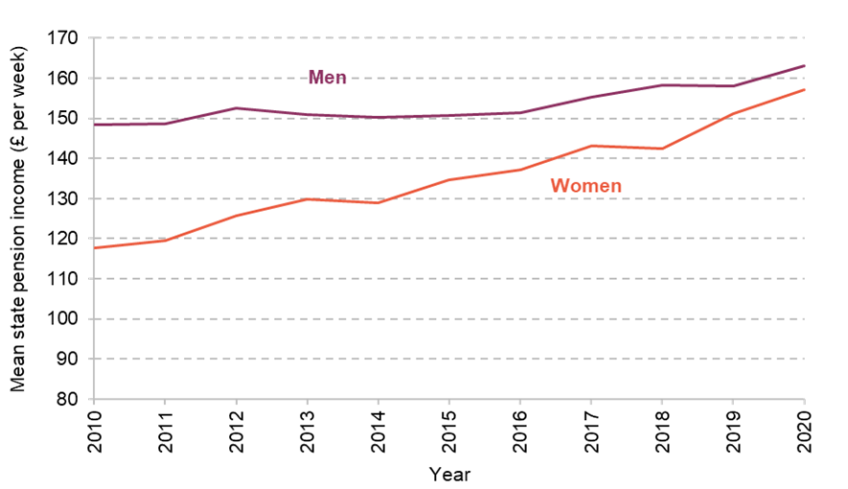
The value of the state pension has also risen over time. Figure 4.5 shows, among claimants who are up to two years over the state pension age, mean state pension income by year, separately for men and women. For men, we can discern a slight increase in average state pension income over time, from £148 per week in 2010 to £163 in 2020 (a 10% increase). There is an even clearer increase for women, whose state pension income was on average much lower than men’s in 2010, at £118 per week, but had almost caught up by 2020, reaching £157 per week (a 34% increase). There are two reasons for these trends: first, women reaching their state pension age more recently on average had more qualifying years than women reaching their state pension age in 2010, due to increases in labour market participation for more recently born cohorts of women; and second, reforms to the state pension system over the past ten years have tended to increase its real value and especially so for those reaching the state pension age with incomplete working histories.8
Figure 4.5. Mean state pension income among individuals who are over the state pension age by less than two years, conditional on claiming, for men and women
Source: Authors’ calculations using the Family Resources Survey.
Figures 4.4 and 4.5 demonstrate that the amount of state support available to people above the state pension age has increased over time, while the value of working-age benefits is at a lower level and has not increased over time. Reaching the state pension age today therefore implies a larger increase in people’s incomes than in the past as they are eligible for greater state benefits, which is one reason why we find a larger impact of the increase in the state pension age on household income and poverty than found for earlier increases in the female state pension age.
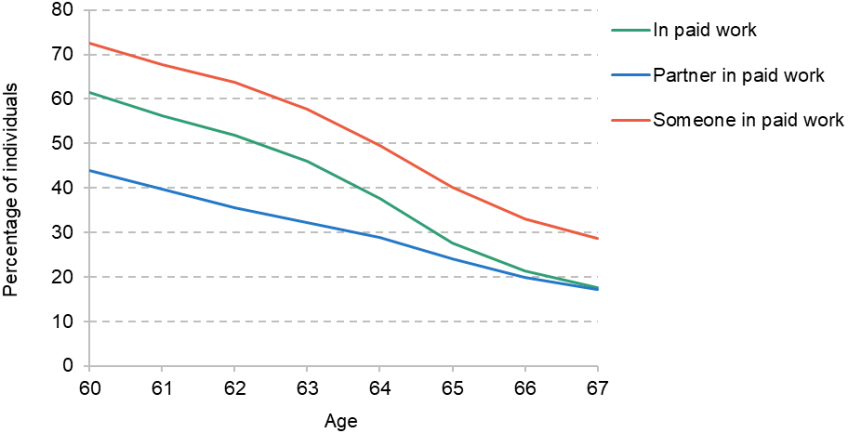
In addition to this, state benefits are more important for people’s household incomes at slightly older ages (i.e. at age 65 compared with at age 60). This is because fewer people are in paid work, or have a partner in paid work, at older ages than at younger ages, as illustrated in Figure 4.6. While at age 60 about 60% of people are in paid work and over 40% have a partner in employment, by age 65 these proportions have both fallen to below 30%. While more 65-year-olds than 60-year-olds will claim a significant occupational pension, this does not make up for the large decrease in employment income received by people between the ages of 60 and 65. This means that 65-year-olds are considerably more reliant on state benefits, including the state pension, than are 60-year-olds, and so increasing the state pension age is likely to increase poverty more for 65-year-olds than for 60-year-olds simply because more people at that age will have been reliant on the state pension for the vast majority of their income.
Figure 4.6. Percentage of individuals in paid work or with a partner in paid work, by age
Note: Sample period is 2015Q1 to 2021Q1.
Source: Authors’ calculations using the Family Resources Survey.
Table 4.4 demonstrates how important work status is for understanding the effect of a higher state pension age on poverty. It shows how being under the state pension age is associated with the probability of being in absolute income poverty (AHC) and being in or out of paid work. The first two rows show that, of the 13.7 percentage point increase in the absolute poverty rate found in Table 4.2, 10.3 percentage points come from an increase in the share of individuals who are in poverty and not in paid work. Therefore, the majority of the increase in the poverty rate that we find is down to people who are not in work, and who may well be reliant on the less-generous state benefits available to working-age people compared with pensioners.
Table 4.4. Effect of increasing the state pension age from 65 to 66 on the probability of being in absolute poverty (AHC) and in work (percentage points)
Outcome/Subgroup | Effect of being under SPA | Standard error | Mean for |
All |
|
|
|
In poverty | +13.7*** | [2.0] | 10.2% |
In poverty and in paid work | +3.5*** | [0.9] | 1.1% |
In poverty and not in paid work | +10.3*** | [2.1] | 9.2% |
Single |
|
|
|
In poverty | +21.9*** | [4.8] | 16.3% |
In poverty and in paid work | +5.5* | [2.3] | 1.3% |
In poverty and not in paid work | +16.4*** | [5.4] | 15.0% |
Couple |
|
|
|
In poverty | +11.3*** | [2.2] | 8.0% |
In poverty and in paid work | +2.9*** | [0.9] | 1.0% |
In poverty and not in paid work | +8.4*** | [2.0] | 7.0% |
Note: ***, ** and * denote the effect is significantly different from zero at the 1%, 5% and 10% level, respectively. Robust standard errors are clustered at the month-of-birth level. There are 6,654, 1,829 and 4,825 observations in models including everyone, single people and people in a couple, respectively. Pre-reform means are estimated using data from 2014Q4 to 2018Q3.
Source: Authors’ calculations using the Family Resources Survey.
Nevertheless, there is also a 3.5 percentage point increase in the share of 65-year-olds who are both in absolute poverty and in paid work. While this makes up only the minority of the poverty increase, this is a relatively large increase given that only 1.1% of 65-year-olds prior to the reforms were both in paid work and in poverty. This highlights how it is very rare for people over the state pension age to be in paid work and in poverty, given that they have multiple sources of income (and are much less likely than working-age households to have many children in the household), but this is not so uncommon for people who can only rely on working-age benefits. The patterns are similar when separating the analysis by single people and people in a couple – the vast majority of the increase in poverty among 65-year-olds comes in out-of-work poverty – though there are much larger magnitudes in these effects for single people.
5. Conclusion
Since 2010 there have been large increases in the state pension age for women, but the increase in the state pension age from 65 to 66 was the first increase for men and women together. They are not the last increases on the horizon, with the state pension age already set to increase to 67 between 2026 and 2028 and the second independent review of the state pension age considering when the increase to 68 should happen (it is currently legislated to start in 2044, with the first independent review of the state pension age proposing that it be brought forwards by seven years). While increases in state pension ages are a coherent government response to increases in life expectancy at older ages, it is also important to understand how an increase in the state pension age impacts the finances of different households.
We find that while around 9% of 65-year-olds have delayed their retirement as a result of the increase in the state pension age to 66, this only boosts average incomes of 65-year-olds (i.e. measured across all 65-year-olds, including those who have not changed their retirement decision) by £47 per week, compared with an average fall in state pension income of £142 per week. The fact that some people who delay their exit from the labour force also delay drawing their occupational pension also pushes down average incomes. Overall, individual net incomes of 65-year-olds fell by £108 per week as a result of the reform. There are similar-sized falls in net household incomes (i.e. once you include everyone in the household).
The fall in benefit payments (principally the state pension) and rise in direct tax revenues driven by the higher state pension age benefited the exchequer to a substantial degree. We estimate the reform benefited the public finances by £4.9 billion per year, equivalent to around 5% of public spending on state pensions or ¼% of national income.
But the reductions in household incomes mean that a considerably higher fraction of 65-year-olds are in absolute income poverty, rising by 14 percentage points. For some groups – people living alone; those with low education; renters – poverty rates rose by more than 20 percentage points. Most of the increase comes for those not in paid work, though there were also small but significant increases in the fraction of 65-year-olds in in-work poverty too.
The rises in poverty are bigger than those estimated to have occurred due to previous reforms. In particular, Cribb and Emmerson (2019) found a 6 percentage point increase in the same measure of income poverty as a result of the increase in the state pension age for women from 60 to 63 that occurred between 2010 and 2016.
The larger rise in poverty is due to the increasing gap in state support between pensioners and working-age people. That arises partly because of considerably higher state pension incomes for new recipients (particularly for women) in recent years, but also because of the increasingly large gap between the generosity of financial state support for those above and below the state pension age. It is also due to the fact that 65-year-olds are less likely to be in employment than 60-year-olds, meaning they are particularly likely to have been dependent on the state pension for income.
These trends seem likely to continue. Although there has been a pause in the ‘triple lock’ for 2022–23, the restoration of that rule in 2023–24 will continue to push up the value of the state pension compared with either prices or earnings. Means-tested pensioner benefits are likely to continue to rise relative to working-age benefits. This implies larger gaps in support at the state pension age and so poverty rates would be even more determined by which side of the state pension age people are. And as the state pension age rises to 67 in the mid-to-late 2020s, it means that 66-year-olds, who have even lower rates of employment than 65-year-olds (and so the state pension is even more important for them) will be under state pension age. If anything, it therefore seems likely the effect of increasing the state pension age on income poverty rates is likely to grow, rather than shrink, over time.
Acknowledgements
The authors are grateful for funding from the Centre for Ageing Better that enabled them to write this report. The Centre for Ageing Better is a charitable foundation, funded by the National Lottery Community Fund. Its vision is a society where everyone enjoys later life. Co-funding from the Centre for the Microeconomic Analysis of Public Policy (ES/T014334/1) at the Institute for Fiscal Studies is gratefully acknowledged.
Data from the Family Resources Survey were accessed through an agreement with the Department for Work and Pensions. The authors would like to thank Emily Andrews, Carl Emmerson and members of the project advisory board for helpful feedback and comments.
Appendix
Table A.1. Robustness checks
Outcome | Main specification | Clustering at household level | Controlling linearly for cohort | 2015Q4–2021Q1 sample | 2017Q4–2021Q1 sample |
| (1) | (2) | (3) | (4) | (5) |
Receives employment income | +8.8*** | +8.8*** | +8.0*** | +8.9*** | +8.7*** |
| [2.6] | [2.6] | [2.6] | [2.5] | [2.8] |
Gross earnings (incl. self-emp.) | +46.80*** | +46.80*** | +41.40*** | +48.00*** | +41.10*** |
| [13.60] | [14.20] | [13.50] | [13.10] | [15.20] |
Benefit income | –129.80*** | –129.80*** | –131.70*** | –131.70*** | –127.10*** |
| [4.40] | [4.40] | [4.40] | [4.20] | [4.90] |
Equivalised net household income (AHC) | –109.80*** | –109.80*** | –114.40*** | –108.70*** | –119.20*** |
| [17.30] | [18.70] | [16.70] | [16.70] | [18.80] |
In absolute poverty (AHC) | +13.7*** | +13.7*** | +14.5*** | +13.1*** | +13.5*** |
| [2.0] | [2.1] | [1.9] | [1.8] | [2.1] |
Observations | 6,654 | 6,654 | 6,654 | 8,302 | 4,989 |
Note: ***, ** and * denote the effect is significantly different from zero at the 1%, 5% and 10% level, respectively. The numbers in square brackets are robust standard errors clustered at the month-of-birth level, except in column (2) where they are clustered at the household level. Column (1) is estimated using the methodology outlined in Chapter 2; the other columns show the estimated results under different changes to this specification. Column (2) clusters standard errors at the household level, rather than the month-of-birth level. Column (3) includes a linear control for financial year of birth. Columns (4) and (5) extend and shorten the sample period, respectively. Effects on cash amounts are rounded to the nearest 10p.
Source: Authors’ calculations using the Family Resources Survey.
Table A.2. Effect of the reform on different sources of individual income, by sex (£ per week)
Outcome | Effect of being under SPA | Standard error | Mean for |
Men |
|
|
|
Gross earnings (incl. self-emp.) | +60.20** | [25.10] | 106.90 |
Gross occupational pensions | –5.60 | [14.10] | 136.70 |
Gross investment income | –5.50 | [4.60] | 31.20 |
Total gross private income | +49.10** | [23.90] | 274.80 |
Benefit income (incl. state pension) | –136.30*** | [5.80] | 169.80 |
State pension income | –144.20*** | [3.70] | 138.90 |
Benefit income (excl. state pension) | +10.80** | [4.70] | 27.60 |
Net income | –100.20*** | [18.10] | 398.10 |
Net transfer from government | –149.30*** | [9.90] | 123.30 |
Women |
|
|
|
Gross earnings (incl. self-emp.) | +33.40*** | [11.60] | 46.30 |
Gross occupational pensions | –20.10* | [10.80] | 74.50 |
Gross investment income | +1.30 | [3.30] | 19.30 |
Total gross private income | +14.60 | [15.90] | 140.20 |
Benefit income (incl. state pension) | –122.80*** | [7.00] | 158.20 |
State pension income | –139.00*** | [3.30] | 130.00 |
Benefit income (excl. state pension) | +18.70*** | [6.40] | 25.20 |
Net income | –112.10*** | [12.70] | 276.20 |
Net transfer from government | –126.70*** | [8.90] | 136.00 |
Note: ***, ** and * denote the effect is significantly different from zero at the 1%, 5% and 10% level, respectively. Robust standard errors are clustered at the month-of-birth level. There are 3,237 observations in all models for men and 3,417 observations in all models for women. Pre-reform means are estimated using data from 2014Q4 to 2018Q3. Effects are rounded to the nearest 10p. ‘Benefit income (excl. state pension)’ also excludes other pensioner benefits such as the warm homes discount and the Christmas bonus paid to certain benefit recipients (including recipients of the state pension).
Source: Authors’ calculations using the Family Resources Survey.
Table A.3. Effect of the reform on different sources of individual income, by partner status (£ per week)
Outcome | Effect of being under SPA | Standard error | Mean for |
Single |
|
|
|
Gross earnings (incl. self-emp.) | +60.60*** | [21.70] | 63.50 |
Gross occupational pensions | –21.00* | [12.10] | 91.50 |
Gross investment income | –4.00 | [3.70] | 20.10 |
Total gross private income | +35.60 | [22.80] | 175.10 |
Benefit income (incl. state pension) | –122.30*** | [10.60] | 196.80 |
State pension income | –146.10*** | [4.80] | 138.80 |
Benefit income (excl. state pension) | +26.80*** | [8.80] | 53.70 |
Net income | –96.30*** | [14.60] | 342.50 |
Net transfer from government | –132.00*** | [15.00] | 167.50 |
In a couple |
|
|
|
Gross earnings (incl. self-emp.) | +38.80** | [16.50] | 80.30 |
Gross occupational pensions | –11.60 | [11.20] | 109.60 |
Gross investment income | –0.50 | [3.80] | 26.90 |
Total gross private income | +26.80 | [16.40] | 216.80 |
Benefit income (incl. state pension) | –132.60*** | [4.30] | 151.50 |
State pension income | –139.90*** | [2.90] | 132.60 |
Benefit income (excl. state pension) | +9.80*** | [3.30] | 16.10 |
Net income | –112.90*** | [13.00] | 332.70 |
Net transfer from government | –139.60*** | [6.50] | 115.80 |
Note: ***, ** and * denote the effect is significantly different from zero at the 1%, 5% and 10% level, respectively. Robust standard errors are clustered at the month-of-birth level. There are 1,829 observations in all models for singles and 4,825 observations in all models for couples. Pre-reform means are estimated using data from 2014Q4 to 2018Q3. Effects are rounded to the nearest 10p. ‘Benefit income (excl. state pension)’ also excludes other pensioner benefits such as the warm homes discount and the Christmas bonus paid to certain benefit recipients (including recipients of the state pension).
Source: Authors’ calculations using the Family Resources Survey.
References
Centre for Ageing Better (2022). ‘The state of ageing 2022: summary’. Available at https://ageing-better.org.uk/sites/default/files/2022-03/The-State-Ageing-2022-report.pdf.
Cribb, J. and Emmerson, C. (2019). ‘Can’t wait to get my pension: the effect of raising the female early retirement age on income, poverty and deprivation’. Journal of Pension Economics and Finance, 18(3), 450–472. Available at https://doi.org/10.1017/S1474747218000057.
Cribb, J., Emmerson, C. and O’Brien, L. (2022). ‘The effect of increasing the state pension age to 66 on labour market activity’. Institute for Fiscal Studies (IFS), Working Paper W22/07. Available at https://ifs.org.uk/publications/15911.
Department for Work and Pensions, National Centre for Social Research, Office for National Statistics. Social and Vital Statistics Division. (2022). Bespoke Version of the Family Resources Survey, 2009-2021.
Department for Work and Pensions (2022). ‘Households below average income: an analysis of the income distribution FYE 1995 to FYE 2021’. Available at https://www.gov.uk/government/statistics/households-below-average-income-for-financial-years-ending-1995-to-2021/households-below-average-income-an-analysis-of-the-income-distribution-fye-1995-to-fye-2021.
Foster, L. (2021). ‘Aging equally? Employing active aging policy in the United Kingdom’. Innovation in Aging, 5(S1), 428. Available at https://doi.org/10.1093/geroni/igab046.1662.
Independent Review of the State Pension Age (2017). ‘Smoothing the transition: final report’. Presented to Parliament pursuant to Section 27 of the Pensions Act 2014. Available at https://assets.publishing.service.gov.uk/government/uploads/system/uploads/attachment_data/file/611460/independent-review-of-the-state-pension-age-smoothing-the-transition.pdf.
Office for National Statistics (2022). ‘National population projections: 2020-based interim’. Available at https://www.ons.gov.uk/peoplepopulationandcommunity/populationandmigration/populationprojections/bulletins/nationalpopulationprojections/2020basedinterim.
Trades Union Congress (2022). ‘Older workers after the pandemic: creating an inclusive labour market’. Available at https://www.tuc.org.uk/research-analysis/reports/older-workers-after-pandemic-creating-inclusive-labour-market.
Endnotes
Authors

Jonathan Cribb
Jonathan joined IFS in 2011. His research areas includes: pensions, ageing and demographic change, public sector pay, housing, and inequalities.

Laurence O'Brien
Laurence is in the Retirement, Savings and Ageing sector. His work focuses on people’s savings decisions and on economic activity in later life.
More from IFS
Understand this issue


Policy analysis


Academic research


