
Downloads
Download report PDF
PDF | 520.73 KB
Executive summary
Five years ago, then Prime Minister Boris Johnson made ‘levelling up’ a central plank of the Conservative Party’s bid for re-election, with a manifesto pledge to ‘level up every part of the UK’. In 2022, the government published a thorough and ambitious White Paper setting out 12 levelling up ‘missions’ to achieve by 2030, as well as specific metrics by which they would be measured.
In this report, we examine early progress towards those 12 missions, where possible using the headline metrics identified in the White Paper.
Key findings
1. The Levelling Up White Paper presents an admirably clear, ambitious and transparent account of the Conservative government’s aims to reduce regional inequalities in the UK. Most of these missions target absolute progress (improving the UK’s overall performance) as well as relative progress towards closing the gaps between areas. There is much careful work here that should usefully inform the thinking of a future government committed to these areas.
2. The last five years have clearly been a challenging time for levelling up. The COVID-19 pandemic caused massive disruption to virtually every area of life, and increased many different dimensions of inequality. While the levelling up missions were published in February 2022, after the worst of the pandemic was past, this was still before Russia’s invasion of Ukraine, and the resulting consequences that has had for inflation and the wider economy.
3. Overall, progress towards levelling up has been glacial – and, on many metrics, the UK as a whole has gone into reverse. The share of pupils in England meeting the expected standards at the end of primary school has fallen from 65% in 2018–19 to 60% in June 2023. The total number of further education and skills courses completed fell by 14%, driven by a more than 20% fall in the lowest-skilled areas. Outside of the pandemic years, average life satisfaction is the lowest it has been since 2012. There is a 21-percentage-point gap in the average employment rate between the best- and worst-performing tenth of local authorities – the widest it has been since at least 2005.
4. There are a small number of bright spots. Digital connectivity has increased quickly: between April 2023 and January 2024, the share of premises outside London covered by 5G rose from 67% to 78%. Pride in one’s local area increased between 2019 and 2021, including a 4-percentage-point rise in the North West (where pride in place was lowest).
5. In many policy areas, there has been – perhaps unsurprisingly – relatively limited progress towards the levelling up missions. It is still early days, some of these changes will take time, and in many cases data are only available with a substantial lag. But the missions relate to 2030, which is not that far off. The slow pace of change speaks to the challenges of shifting deep-seated geographic inequalities, and the importance of a long-term strategy with consistent delivery if progress is to be made.
Introduction
Five years ago, then Prime Minister Boris Johnson made ‘levelling up’ a central plank of the Conservative Party’s bid for re-election, with a manifesto pledge to ‘level up every part of the UK’.
Just over two years later, following the COVID-19 pandemic, the government set out detailed plans and targets in its Levelling Up White Paper. The White Paper identified 12 ‘missions’, along with concrete targets to achieve by 2030. Clearly, these are longer-term goals and 2030 is a while away yet. The economy and government were also hit by higher-than-expected inflation following Russia’s invasion of Ukraine, weeks after the White Paper was released.
Governments – of all political colours – have sought to address regional inequalities and rebalance the UK since at least the 1930s. The UK is one of the most geographically unequal countries in the developed world, ranking near the top of the league table on most measures of regional inequality (Davenport and Zaranko, 2020). There are substantial and deep-seated gaps within the UK in employment, income, poverty, skills, happiness, health and many other outcomes.
These are complex challenges, shaped both by migration within the country and by the causal effects of place – each of which reinforces the other (Overman and Xu, 2022; van Ham, Manley and Tammaru, 2022). But policy to address levelling up has often been patchy, inconsistent and short-lived, with a large number of small pots of money rather than stable, long-term funding.
So while the terminology might change going forward, ‘levelling up’ – reducing geographic inequalities and improving overall performance – remains a core long-term challenge for the UK. There is much careful work in the White Paper that should usefully inform a future government’s thinking. Both the Labour and Conservative manifestos set out ambitions to address some of these challenges – with commitments for place-based development funding in the Conservative manifesto (despite the proposed abolition of the UK Shared Prosperity Fund from 2028), and a range of proposals including local industrial strategies particularly aimed at boosting growth outside of London in the Labour manifesto.
This report looks back to the original 12 levelling up missions and sets out the progress that has been made so far.
Wherever we can, we use the metrics that the government set out in its White Paper and in a February 2024 update.1 There are many differences across missions in where, when and how these headline measures are constructed. Some of them cover the whole UK; others cover only a subset of its constituent parts. Some measures are available right up until the time of writing this report; others are produced with a lag of several years. Some measures are available at very low geographic levels; in other cases, we have only regional or national data. In some cases, the data for these headline metrics do not yet exist; there, we have relied on similar or related metrics, often drawing on those presented in the original White Paper. We set out precise information on our data sources in the appendix.
| Mission: by 2030 … | Measurement | |
| 1 | Pay, employment and productivity will have risen in every area of the UK, with each containing a globally competitive city, with the gap between the top performing and other areas closing. |
|
| 2 | Domestic public investment in R&D outside the Greater South East will increase by at least 40%, and over the Spending Review period by at least one third. This additional government funding will seek to leverage at least twice as much private sector investment over the long term to stimulate innovation and productivity growth. |
|
| 3 | Local public transport connectivity across the country will be significantly closer to the standards of London, with improved services, simpler fares and integrated ticketing. |
|
| 4 | The UK will have nationwide coverage of gigabit-capable broadband and 4G mobile networks, and our ambition is that higher quality, standalone 5G will extend to all populated areas. |
|
| 5 | The number of primary school children achieving the expected standard in reading, writing and maths will have significantly increased. In England, this will mean 90% of children will achieve the expected standard, and the percentage of children meeting the expected standard in the worst performing areas will have increased by over a third. |
|
| 6 | The number of people successfully completing high-quality skills training will have significantly increased in every area of the UK. In England, this will lead to 200,000 more people successfully completing high-quality skills training annually, driven by 80,000 more people completing courses in the lowest skilled areas. |
|
| 7 | The gap in Healthy Life Expectancy (HLE) between local areas where it is highest and lowest will have narrowed, and by 2035 HLE will rise by five years. |
|
| 8 | Well-being will have improved in every area of the UK, with the gap between top performing and other areas closing. |
|
| 9 | Pride in place, such as people’s satisfaction with their town centre and engagement in local culture and community, will have risen in every area of the UK, with the gap between top performing and other areas closing. |
|
| 10 | Renters will have a secure path to ownership with the number of first-time buyers increasing in all areas; and the government’s ambition is for the number of non-decent rented homes to have fallen by 50%, with the biggest improvements in the lowest performing areas. |
|
| 11 | Homicide, serious violence and neighbourhood crime will have fallen, focused on the worst-affected areas. |
|
| 12 | Every part of England that wants one will have a devolution deal with powers at or approaching the highest level of devolution and a simplified, long-term funding settlement. |
|
Source: Department for Levelling Up, Housing and Communities, ‘Levelling Up the United Kingdom – Technical annex: missions and metrics’, 2022; Department for Levelling Up, Housing and Communities, ‘Statement of Levelling Up Missions’, 2024.
Mission 1. Living standards
By 2030, pay, employment and productivity will have risen in every area of the UK, with each containing a globally competitive city, with the gap between the top performing and other areas closing.
Employment rates across the UK have improved since 2021, though substantial issues with the quality of labour market data mean that different sources disagree on whether employment rates are back to pre-pandemic levels. Data from the Annual Population Survey suggest that there are enormous differences across areas. Overall, in 2023–24, the 10% of UK local authorities with the highest employment rates had on average 87% of working-age people in paid work, compared with 66% in the tenth of areas where employment rates were lowest. That gap – 21 percentage points – was the largest since at least 2005.
Most data sources suggest that median earnings are now higher in real terms than in 2019 (Henry and Joyce, 2024). Earnings inequality appears no higher – and possibly a little lower – than it was in 2019.
Mission 2. Research and development
By 2030, domestic public investment in R&D outside the Greater South East will increase by at least 40%, and over the Spending Review period by at least one third. This additional government funding will seek to leverage at least twice as much private sector investment over the long term to stimulate innovation and productivity growth.
Public investment in R&D is split between R&D done by the government and R&D funded by the government but performed by businesses and higher education institutions. Just over half of total public spending on research and development in the UK (and 60% of R&D carried out by government) is performed by organisations based in the greater South East (GSE), an area that includes London, Oxford and Cambridge. The share of government expenditure on R&D performed outside the greater South East fell slightly between 2018 and 2021, from 39% to 37%. For 2022, data are only available for business expenditure on R&D; here, R&D spending fell by £3.1 billion outside the greater South East, despite increasing by £1.8 billion in the greater South East.
Mission 3. Transport
By 2030, local public transport connectivity across the country will be significantly closer to the standards of London, with improved services, simpler fares and integrated ticketing.
Travel and transport patterns are completely different within London and elsewhere in England. In London, more than 40% of journeys in 2018–19 were made by public transport. Outside the capital, only 8% of trips were made on public transport. While public transport use collapsed during the pandemic, levels in London have nearly returned to their pre-pandemic peak. But so too has the gap between the capital and the rest of England, which has nudged down by less than half a percentage point since 2018–19 – leaving the gap at its second-highest level since 2002–03. With the cancellation of the northern leg of HS2 and the reallocation of its budget towards pothole repair, the emphasis of transport policy has shifted back towards drivers and road users.
Mission 4. Digital connectivity
By 2030, the UK will have nationwide coverage of gigabit-capable broadband and 4G mobile networks, and our ambition is that higher quality, standalone 5G will extend to all populated areas.
Digital connectivity has rapidly improved. In May 2022 (the earliest date that data on gigabit broadband are available), 85% of premises in London and 61% of those in the rest of the UK had access to gigabit broadband connections. By June 2024, coverage rates had reached 90% in London and 78% elsewhere. In just two years, the digital gap in very fast broadband access has halved.
When the Levelling Up White Paper was published in February 2022, 4G coverage was already nearly universal in terms of premises covered. The White Paper also set a more ambitious target to substantially expand 5G coverage (which was already essentially universal in London). Between April 2023 and January 2024, 5G coverage outside the capital rose from 67% to 78%. If such rapid progress continues, the UK should be well on track to meet or exceed this mission.
Mission 5. Education
By 2030, the number of primary school children achieving the expected standard in reading, writing and maths will have significantly increased. In England, this will mean 90% of children will achieve the expected standard, and the percentage of children meeting the expected standard in the worst performing areas will have increased by over a third.
In June 2023 (latest data available), only 60% of 11-year-olds in England met the expected standard in reading, writing and maths, up from 59% the year before but down from 65% in the year before the pandemic. While no local authority was close to meeting the levelling up mission, performance is strikingly better in London than elsewhere in England: the 10 best-performing local authorities are all located in the capital.
Mission 6. Skills
By 2030, the number of people successfully completing high-quality skills training will have significantly increased in every area of the UK. In England, this will lead to 200,000 more people successfully completing high-quality skills training annually, driven by 80,000 more people completing courses in the lowest skilled areas.
Between 2018–19 and 2022–23 (the latest year for which data are available), the total number of further education (FE) and skills course completions declined by 14%, which is equivalent to 145,000 fewer learners. The decline was most pronounced in the third of areas with the lowest skills, with 65,000 fewer learners a year (a drop of 19%), compared with an 11% drop in the rest of England. Only 22% of local authorities saw an increase in the number of completions between 2018–19 and 2022–23, with only one in ten local authorities in low-skilled areas seeing an increase.
Mission 7. Health
By 2030, the gap in Healthy Life Expectancy (HLE) between local areas where it is highest and lowest will have narrowed, and by 2035 HLE will rise by five years.
For the three-year period from 2020 to 2022, the healthy life expectancy in England stood at 62.6 years (62.7 for women, 62.4 for men). That is a full year lower than it was before the pandemic, and directly reflects both the increased mortality rate and the rise in ill health brought about by conditions such as long COVID.
Even before the pandemic, there were huge discrepancies between regions in healthy life expectancy. Between 2017 and 2019, healthy life expectancy in the South East was 65.7 years, nearly six-and-a-half years – or 11% – higher than in the North East. In the midst of the pandemic (the latest data available), that gap remained largely unchanged. While up-to-date data at lower levels of geography are not yet available, inequalities in healthy life expectancy are even more striking at local authority level – and huge gaps in life expectancy can be found even across neighbourhoods within a single town or city.
Mission 8. Well-being
By 2030, well-being will have improved in every area of the UK, with the gap between top performing and other areas closing.
Self-reported life satisfaction in the UK steadily increased between 2011–12 and 2018–19, from 7.42 out of 10 to 7.71. Life satisfaction dropped sharply in 2020–21, more than reversing the decade’s progress. In 2022–23 (the latest data available), life satisfaction was barely better than this pandemic-era low point.
Inequality in life satisfaction across local authorities also increased post-pandemic. After falling to 0.72 in 2019–20, the gap between the 10% of local authorities with the most and least satisfied residents rose to 0.82 in 2020–21. By 2022–23, the most satisfied tenth were almost a full point ahead of the least satisfied tenth – by some distance the biggest gap in this measure since records began in 2011–12.
Mission 9. Pride in place
By 2030, pride in place, such as people’s satisfaction with their town centre and engagement in local culture and community, will have risen in every area of the UK, with the gap between top performing and other areas closing.
In 2019–20, 76% of residents said they were ‘very’ or ‘fairly’ satisfied with their local area. Despite the COVID-19 pandemic, that remained level at 76% in 2021–22.
The biggest increase in satisfaction was a 3.8-percentage-point improvement in the North West, which had had the lowest rating in 2019 (though even this increase was not statistically significant). Satisfaction slightly decreased at the other end of the scale, with a 0.2-percentage-point decrease in the South West. Taken together, this means that the gap between the most and least satisfied regions did narrow somewhat in the years preceding the Levelling Up White Paper, by 2.8 percentage points. Unfortunately, a lack of available data means we cannot assess what has happened to satisfaction since.
Figure 9. Share of residents ‘very’ or ‘fairly’ satisfied with their local area
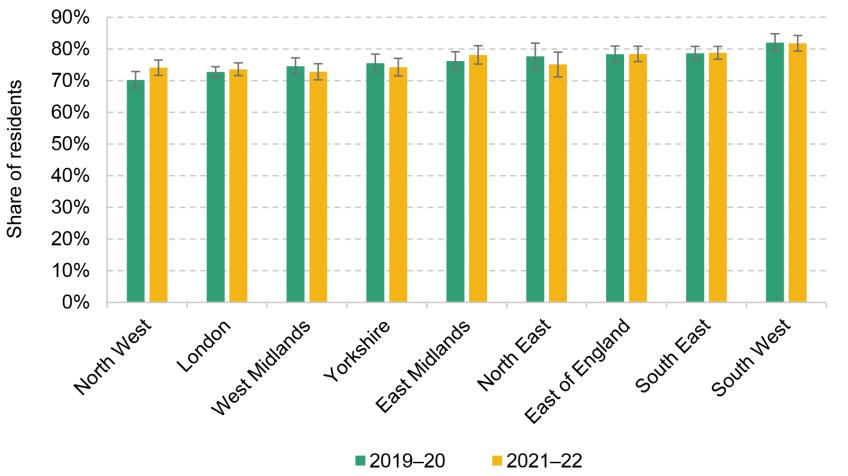
Note: This figure plots the share of residents who answer ‘very’ or ‘fairly’ satisfied, when asked: 'Overall, how satisfied or dissatisfied are you with your local area as a place to live?’. Error bars show the 95% confidence interval for each estimate.
Source: Authors’ calculations using data from the Community Life Survey.
Mission 10. Housing
By 2030, renters will have a secure path to ownership with the number of first-time buyers increasing in all areas; and the government’s ambition is for the number of non-decent rented homes to have fallen by 50%, with the biggest improvements in the lowest performing areas.
Homeownership rates amongst young people fell sharply between 2000 and 2015, but have since started to recover; by 2019–20, 36% of 25- to 34-year-olds owned their own home, rising to 39% in 2022–23 (Cribb, 2024). But this recovery has not been shared across all regions of the UK. Between 2019–20 and 2022–23, homeownership rates increased significantly in London, with substantial (but not statistically significant) growth in the East Midlands and the North East. But they fell slightly in the South East and Yorkshire.
In England, 23% of private rented homes were considered non-decent in 2021 (latest data available), failing to meet basic standards such as a reasonable temperature and being in a reasonable state of repair. The share ranges from 8% of rental homes in the North East classed as non-decent to 25% in Yorkshire and the Humber. The share of non-decent private rentals has been falling steadily since the mid 2000s.
Figure 10. Homeownership rates among 25- to 34-year-olds, by region
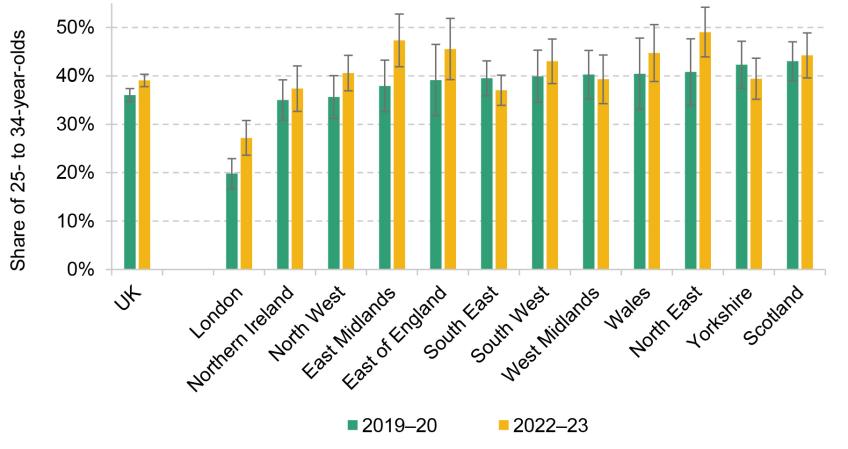
Note: Error bars show the 95% confidence interval for each estimate.
Source: Authors’ calculations using the Family Resources Survey, various years.
Mission 11. Crime
By 2030, homicide, serious violence and neighbourhood crime will have fallen, focused on the worst-affected areas.
Knife crime in England and Wales had been rising prior to the pandemic, from 0.68 incidents per thousand residents in 2016 to 0.90 incidents per thousand in 2019. Crime dropped off during the pandemic, but has since increased to 0.82 incidents per thousand – still higher than the mid 2010s, but below the pre-pandemic high. In the 20% of areas worst affected, knife crime rates are more than double the rate in the rest of England and Wales. Other than a small dip during the pandemic, this gap has been broadly constant over time.
The rate of homicides in England and Wales is much lower and exhibits no clear trend over time.
Mission 12. Local leadership
By 2030, every part of England that wants one will have a devolution deal with powers at or approaching the highest level of devolution and a simplified, long-term funding settlement.
Since February 2022, three new devolution deals including a mayor have come into place in the East Midlands, the North East, and York and North Yorkshire. Together, these new deals cover 26 lower-tier local authorities. As of May 2024, nearly 50% of the English population lived in a local authority with a devolution deal including a mayor.
Endnotes
Authors

Christine Farquharson
Christine's research examines inequalities in children's education and health, especially in the early education and childcare sector.

Luke Heath Milsom
Luke is a Research Associate at the IFS. His work focuses on questions surrounding spatial and labour market inequality.

Imran Tahir
Imran joined the IFS in 2019 and works in the Education and Skills sector.

Bobbie Upton
Bobbie is a Research Economist in the Taxation and Environment sectors, looking at air pollution and taxation of capital income.

Gautam Vyas
Gautam joined the IFS in 2023 and works in the IOD sector. His work focuses on the consumption behaviour of individuals in the UK.
More from IFS
Understand this issue


Policy analysis


Academic research


