
The Conservative Party has announced that if re-elected it would set up a new National Service scheme for 18-year-olds across the UK. A Royal Commission would be appointed to work out the details of the scheme, with piloting beginning in September 2025 and a full roll-out by the end of the next parliament in 2029.
The Conservatives have estimated that once fully operational, the National Service scheme would cost £2.5 billion per year. They have said that £1 billion of this would be paid for from improved tax enforcement, with the remaining £1.5 billion paid for by winding up the UK Shared Prosperity Fund (UKSPF) in 2028.
This comment focuses on the UKSPF and the consequences of abolishing it.
What is the UK Shared Prosperity Fund?
The UKSPF is a £1.5 billion a year programme set up following the UK’s departure from the EU. It replaces the EU’s regional economic development programmes and provides councils and regional mayors with funding aimed at improving local social and economic outcomes as part of the ‘levelling up’ agenda. Funding can be allocated to projects in three broad thematic areas:
- Communities and place. Funding for community projects and infrastructure, including improvements to high streets, cultural and recreational facilities, active travel schemes, and crime prevention.
- Supporting local business. Funding to help small and medium enterprises, especially with innovation, research and development, and training, as well as the promotion of tourism and international trade, and investment in development sites and access.
- People and skills. Funding to help economically inactive people overcome barriers to work, including through basic skill training and volunteering opportunities, as well as more general upskilling of local workforces.
Councils have significant flexibility in deciding how to allocate their funding to these different broad areas, and which specific projects to fund. In addition, each council or mayor receives ring-fenced funding for improving maths skills via the Multiply Programme.
Funding is currently only confirmed until the end of the current financial year. The Conservatives have now said they would continue with current levels of funding until 2028, before shifting funding to the National Service scheme. Labour have not yet confirmed their plans for the UKSPF, but a report the Party commissioned from former Prime Minister Gordon Brown recommended integrating the UKSPF with other related funding streams.
How much do different areas receive from the UKSPF?
The UKSPF is a core part of levelling up funding and is targeted at the most economically disadvantaged parts of the UK. Figure 1 summarises the amount per resident allocated to different parts of the UK in the current financial year (2024–25) – with full figures in Table 2 at the end of this comment. It shows that funding is particularly high for West Wales and the Valleys (and particularly Blaenau Gwent and Merthyr Tydfil) and Cornwall. This reflects the fact that when introducing the UKSPF in 2022–23, the UK government decided to replicate previous EU allocations for each of the nations of the UK and each Local Economic Partnership (LEP) area of England. The EU’s regional development fund provided much higher levels of support to areas with a GDP per resident of less than 75% of the EU average – which includes West Wales and the Valleys and Cornwall.
Funding is also significantly above average (£22 per resident) in East Wales, the Tees Valley, Northern Ireland and the North East mayoral area, and is higher in Scotland, the remainder of the North and the Midlands than in the South of England (excluding Cornwall).
Table 1 shows that in aggregate terms, the funding allocated to the UKSPF in the current financial year amounts to over £340 million for Wales, £106 million for the North East and Teesside, and £83 million for Cornwall. The rest of the North of England receives almost as much (£270 million) as the whole of the South of England excluding Cornwall (£272 million) despite having a population less than half as large.
Figure 1. UKSPF allocations per resident (2024–25), including Multiply funding
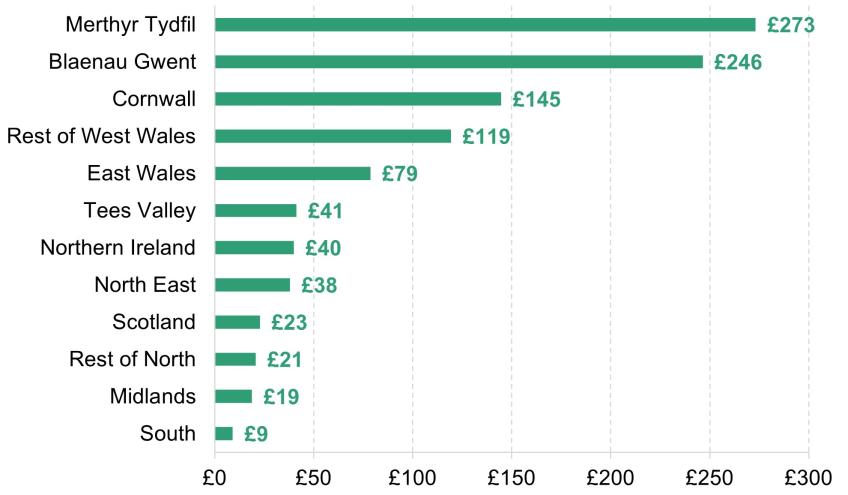
Source: Author’s calculations using UKSPF allocations methodology (https://www.gov.uk/government/publications/uk-shared-prosperity-fund-allocations-methodology) and mid-year population estimates for 2022. Northern Ireland allocation taken from https://www.gov.uk/government/publications/uk-shared-prosperity-fund-northern-ireland-investment-plan/ukspf-investment-plan-northern-ireland and increased to account for Multiply and administrative costs excluded from figures in this document.
Table 1. UKSPF allocations (2024–25), including Multiply funding
| Region | Allocation (£ million) |
|---|---|
| Wales | 343 |
| Cornwall | 83 |
| North East & Tees Valley | 106 |
| Northern Ireland | 77 |
| Scotland | 124 |
| Rest of North | 270 |
| Midlands | 206 |
| South | 272 |
Source: Author’s calculations using UKSPF allocations methodology (https://www.gov.uk/government/publications/uk-shared-prosperity-fund-allocations-methodology). Northern Ireland allocation taken from https://www.gov.uk/government/publications/uk-shared-prosperity-fund-northern-ireland-investment-plan/ukspf-investment-plan-northern-ireland and increased to account for Multiply and administrative costs excluded from figures in this document.
These allocations are far from perfect. As we have previously highlighted, largely replicating EU allocations to the nations and regions of the UK means that allocations are based mostly on data from the early-to-mid 2000s. The cliff edge in the EU’s scheme also means that Cornwall and Welsh council areas get much higher levels of funding than other areas of the country with very similar levels of economic disadvantage, which is hard to justify. And the way population is accounted for in the council-level allocations in Wales is nonsensical and skews funding towards deprived areas with low populations (such as Blaenau Gwent and Merthyr Tydfil) at the expense of deprived areas with large populations (such as Rhondda Cynon Taf). But the UKSPF is the main formula-based and flexible source of levelling up funding available nationwide, albeit strongly targeted at economically disadvantaged areas. Abolishing it and channelling funding instead to a new National Service scheme would therefore represent a significant reduction in funding aimed at tackling geographic inequalities. Alongside repeatedly delaying much-needed reforms and updates to the local government finance system, this means a significant disconnect between rhetoric on the importance of ‘levelling up’ and actual funding policy.
Comparing UKSPF with National Service funding
How National Service funding would be allocated between military and community service and across the country is not yet clear. In order to provide all 18-year-olds with the scheme, funding would presumably be distributed to a large extent based on the number of 18-year-olds living in different areas, rather than based on areas’ level of socio-economic disadvantage.
This means that even after accounting for the spending on local young people via the National Service scheme, economically disadvantaged areas could together lose out on hundreds of millions of pounds. To see this, assume that funding was allocated based purely on the number of 18-year-olds in an area. Based on mid-2022 estimates of the number of 18-year-olds, Wales would benefit from 4.5% of the National Service spending, Cornwall just under 0.8% and the North East and Tees Valley 3.9%. These compare with just under 23%, 5.5% and 7% of UKSPF funding respectively. Therefore, even after accounting for the National Service funding enabled by the abolition of the UKSPF, Wales would be around £275 million per year worse off, Cornwall £72 million a year worse off and the North East and Tees Valley £46 million a year worse off. In contrast, areas across the South of England would receive a substantial increase in net funding.
Table 2. UKSPF funding per person for all council or mayoral areas, 2024–25
| Area | Funding per person |
|---|---|
| Merthyr Tydfil | £273 |
| Blaenau Gwent | £246 |
| Torfaen | £156 |
| Denbighshire | £156 |
| Cornwall and Isles of Scilly | £145 |
| Neath Port Talbot | £142 |
| Isle of Anglesey | £137 |
| Conwy | £126 |
| Ceredigion | £123 |
| Gwynedd | £122 |
| Powys | £120 |
| Carmarthenshire | £120 |
| Newport | £119 |
| Caerphilly | £114 |
| Rhondda Cynon Taf | £111 |
| Pembrokeshire | £109 |
| Swansea | £101 |
| Wrexham | £98 |
| Bridgend | £93 |
| Cardiff | £66 |
| Vale of Glamorgan | £62 |
| Na h-Eileanan Siar | £50 |
| Flintshire | £49 |
| Shetland Islands | £47 |
| Orkney Islands | £47 |
| Monmouthshire | £45 |
| Tees Valley | £41 |
| Northern Ireland | £40 |
| South Tyneside | £40 |
| Gateshead | £39 |
| County Durham | £39 |
| North of Tyne | £37 |
| Sunderland | £36 |
| Argyll and Bute | £30 |
| East Ayrshire | £30 |
| Stirling | £27 |
| Dumfries and Galloway | £27 |
| North Ayrshire | £27 |
| Scottish Borders | £27 |
| Moray | £27 |
| Inverclyde | £27 |
| South Ayrshire | £27 |
| Blackburn with Darwen | £26 |
| West Dunbartonshire | £26 |
| Glasgow City | £26 |
| Stoke-on-Trent | £25 |
| Angus | £25 |
| Blackpool | £25 |
| Cumbria | £24 |
| Herefordshire, County of | £24 |
| Clackmannanshire | £24 |
| North Lanarkshire | £24 |
| Lancashire | £24 |
| Highland | £23 |
| Kingston upon Hull, City of | £23 |
| North East Lincolnshire | £23 |
| Falkirk | £23 |
| Shropshire | £23 |
| North Lincolnshire | £23 |
| Perth and Kinross | £22 |
| Dundee City | £22 |
| South Lanarkshire | £22 |
| West Lothian | £22 |
| Midlothian | £22 |
| Telford and Wrekin | £21 |
| Rutland | £21 |
| East Lothian | £21 |
| Fife | £21 |
| Cheshire West and Chester | £21 |
| Warrington | £21 |
| West Midlands | £21 |
| Staffordshire | £21 |
| East Riding of Yorkshire | £21 |
| Worcestershire | £20 |
| Greater Manchester | £20 |
| West Yorkshire | £20 |
| Renfrewshire | £20 |
| East Renfrewshire | £20 |
| Liverpool City Region | £20 |
| Lincolnshire | £20 |
| Sheffield City Region | £20 |
| Cheshire East | £19 |
| East Dunbartonshire | £19 |
| North Yorkshire | £19 |
| Aberdeen City | £19 |
| Nottingham | £19 |
| Aberdeenshire | £18 |
| Warwickshire | £18 |
| Nottinghamshire | £18 |
| Leicester | £18 |
| York | £17 |
| Derby | £17 |
| Leicestershire | £15 |
| Derbyshire | £15 |
| City of Edinburgh | £14 |
| Greater London Authority | £12 |
| North Northamptonshire | £10 |
| Luton | £10 |
| West Northamptonshire | £10 |
| Torbay | £10 |
| Somerset | £10 |
| Devon | £9 |
| Bedford | £9 |
| Plymouth | £9 |
| Central Bedfordshire | £9 |
| Surrey | £9 |
| Hertfordshire | £9 |
| Dorset | £9 |
| North Somerset | £9 |
| Wiltshire | £8 |
| Cambridgeshire and Peterborough | £8 |
| Suffolk | £8 |
| Gloucestershire | £8 |
| East Sussex | £8 |
| Milton Keynes | £8 |
| Bournemouth, Christchurch and Poole | £8 |
| Bracknell Forest | £8 |
| West of England | £8 |
| Buckinghamshire | £8 |
| Essex | £8 |
| Norfolk | £8 |
| Hampshire | £8 |
| Swindon | £7 |
| West Sussex | £7 |
| Kent | £7 |
| Thurrock | £7 |
| Southend-on-Sea | £7 |
| Isle of Wight | £6 |
| Oxfordshire | £6 |
| Windsor and Maidenhead | £6 |
| Slough | £6 |
| Portsmouth | £6 |
| Medway | £6 |
| West Berkshire | £6 |
| Southampton | £6 |
| Reading | £6 |
| Wokingham | £5 |
| Brighton and Hove | £5 |
Authors

David Phillips
David is Head of Devolved and Local Government Finance. He also works on tax in developing countries as part of our TaxDev centre.
More from IFS
Understand this issue


Policy analysis


Academic research


