
Downloads
Download the report as a PDF here
PDF | 2.14 MB
Download executive summary as a PDF
PDF | 810.09 KB
Executive summary
In this major report of the Pensions Review, led by the Institute for Fiscal Studies in partnership with the abrdn Financial Fairness Trust, we consider the role of the state pension in the UK pension system, analyse the key challenges for future generations of pensioners and set out policies that would improve the current system.
The state pension: where are we?
• The state pension can be claimed from age 66 (rising to 67 by 2028). The Department for Work and Pensions (DWP) estimates that by the mid 2030s, 80% of those reaching the state pension age will receive the full ‘new state pension’, currently worth £203.85 per week. At 30% of median (full-time) earnings, the full new state pension is at a higher level than the basic state pension was at any point since at least 1968.
• The state pension is an important source of income across the income distribution, although more important for poorer households. For example, among households with someone aged 66–70 where no one is in paid work, the state pension makes up 71% of income for the poorest fifth and 23% for the richest fifth. Indeed, if one wanted to buy an index-linked annuity to provide a pension that was equal to the current value of the new state pension (and then price indexed) from the age of 66, then that would require an outlay of over £200,000. This is a significant sum even at the top of the income distribution.
• Although many older pensioners – and a particularly large proportion of women who reached state pension age before 2010 – are receiving much less than the full new state pension, most new retirees receiving this amount (alongside any means-tested housing benefit and support for council tax) are close to or above the relative poverty line, even if they have no other income.
• Government spending on social security payments to pensioners is expected to be £152 billion (5.9% of national income) in 2023–24. Of this total, spending on the state pension, pension credit and winter fuel payment comprises £132 billion, or 5.1% of national income (the vast majority of the rest of the social security spending is on disability benefits and means-tested housing benefit). The 5.1% compares with 4.4% of national income spent on these payments (state pension, pension credit and predecessors, and winter fuel payment) in 1983–84 and 4.2% of national income in 2003–04.
Challenges facing the state pension
We have identified four key challenges facing the state pension system:
1 The ageing population will add considerable pressure on public finances in coming decades. According to the Office for Budget Responsibility (OBR), under current population projections and government policy (maintaining the triple lock and the state pension age rising to 68 by 2046), spending on the state pension, pension credit and winter fuel payment is expected to rise by 1.2% of national income (£32 billion per year in today’s terms) by 2050. One key driver of this is that there are expected to be 25% more pensioners in 2050 than today, with another driver being how the state pension is indexed. The pressures due to health and social care are much bigger, with spending projected to rise by 4.1% of national income (£105 billion per year in today’s terms) over the same period.
2 While there is naturally a debate about the right level of the state pension, the ‘triple lock’ indexation policy (which increases the state pension each year by the highest of inflation, average earnings growth and 2.5%) ratchets up the value of, and spending on, the state pension over time in a way that creates uncertainty around what the level of the state pension will be relative to average earnings, and for the public finances. Compared with increasing the state pension in line with average earnings, we project that – on its own – the triple lock could easily cost anywhere between an additional £5 billion and £40 billion per year in 2050 in today’s terms.
3 If the government wants to rein in state pension spending, then relying only on raising the state pension age to achieve this, rather than moving to less generous indexation, would hit those with lower life expectancy harder. This is because the same increase in the state pension age has a larger proportional impact on the expected state pension wealth of people who die at younger ages than for people who live longer. People who die at younger ages do not benefit as much from the triple lock, which increases the value of the state pension in the future. Groups with lower life expectancy include poorer people (compared with richer people).
4 Despite its new-found simplicity, there is a mixture of confusion and pessimism about the state pension. Although the state pension has increased at least as fast as inflation every year since 1975, 38% of people think that in the next 10 years it will not keep up with inflation. Pessimism is also widespread; a third of people do not think the state pension will exist in 30 years’ time.
It is important to note that the new state pension at its current level is just about enough by itself to keep most people out of income poverty (according to standard government metrics). However, there are some people – in particular, single households living in private rented accommodation – for whom the new state pension and means-tested benefits are not enough to keep them above the income poverty line. Take-up of means-tested benefits among retirees is also far from complete; the design of these benefits will be considered in a later report of the Pensions Review.
Even for households for whom the new state pension is enough to keep them above the income poverty line, it is not enough on its own for a comfortable retirement or to provide most people with a standard of living they have been used to in working life. Instead, for most people, the state pension is a basis for building upon with their own savings, rather than the whole of their pension provision.
The future of the state pension: a new way forward
Despite these challenges, our view is that the state pension is not in need of wholesale change. Indeed, its structure has much to commend it. Given where we are, we think we should retain a flat-rate state pension that is neither earnings-related (which would mean higher state pensions for people with higher earnings over their lifetime) nor means-tested (which would mean lower state pensions for pensioners with higher private incomes). Although the state pension is higher than in the past, given its current level we think it should continue to be accessible from a single universal state pension age, rather than being made available from an earlier age at a permanently reduced amount.
However, improvements are needed to address the key challenges set out above, in order to build on the strengths of the current system and provide a sustainable long-term future for the state pension.
We suggest a new ‘four-point pension guarantee’ to achieve this:
1 There will be a government target level for the new state pension, expressed as a share of median full-time earnings. Increases in the state pension will in the long run keep pace with growth in average earnings, which ensures that pensioners benefit when living standards rise.
2 Both before and after the target level is reached, the state pension will continue to increase at least in line with inflation every year.
3 The state pension will not be means-tested.
4 The state pension age will only rise as longevity at older ages increases, and never by the full amount of that longevity increase. To increase confidence and understanding, the government will write to people around their 50th birthday stating what their state pension age is expected to be. Their state pension age would then be fully guaranteed 10 years before they reach it.
To set the target level, as the government has done with the minimum wage, politicians should state what they believe to be an appropriate level for the new state pension (and the basic state pension) relative to average earnings (as measured by median full-time earnings). They should then legislate a pathway to meeting that target with a specific timetable. This would result in an explicit commitment from the government to target a level of state pension relative to average earnings, which would then be maintained in the long run too.
In choosing the level of the new state pension, the government has to consider the trade-off between a higher income for pensioners and the public finance implications that will have. As an illustration of the cost of increasing the value of the state pension relative to average earnings, Figure ES.1 shows the cost in 2050 of different levels of the state pension (measured in today’s terms) relative to keeping the state pension, as today, at 30% of median full-time earnings (which itself would lead to a saving of £24 billion per year in today’s terms compared with the expected cost of the triple lock).
Figure ES.1. Impact on state pension spending in 2050 relative to earnings indexation from 2023 onwards
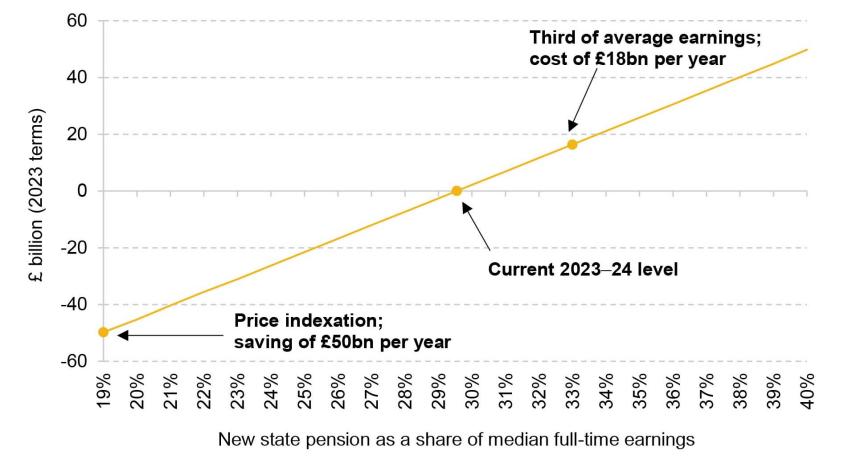
Note: Current level of the new state pension relative to median full-time earnings is 29.6%.
Source: Authors’ calculations using OBR 2023 projections of state pension spending and long-term economic determinants.
For example, increasing the state pension to be a third (33.3%) of average earnings in 2050 would cost an additional £18 billion per year in today’s terms (about 0.7% of national income), compared with keeping the state pension at the current 30% of average earnings. It would also deliver a state pension equivalent (in terms of today’s earnings) to £230 per week, or £26 higher, than today’s full new state pension of £204 per week.
Once the government has chosen and reached a target level for the new state pension relative to average earnings, the state pension should then be indexed in line with our suggested pension guarantee. It is worth noting that this process is how the state pension in Australia is indexed. Figure ES.2 illustrates how this would work in practice by showing the real value of the state pension over time, given an illustrative 20-year period. The figure shows that in periods of relative economic stability, when average earnings growth is above inflation, the value of the state pension rises in real terms, growing in line with average earnings (the blue dashed line follows the yellow line). The rate at which the value of the state pension rises depends on how fast average earnings grow. As the figure shows, when real earnings growth is faster (years 1–5), the real value of the state pension also rises faster than when earnings growth is slower (years 6–9).
Figure ES.2. Illustration of how our suggested new style of indexation would operate
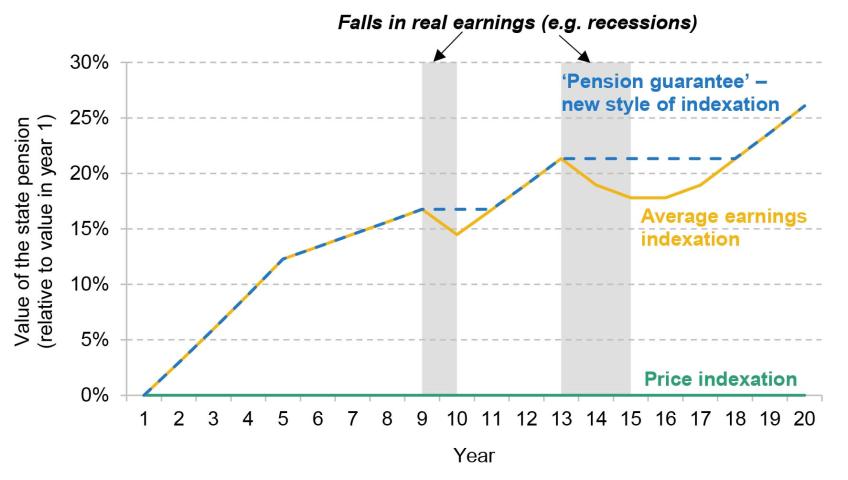
Note: Assumes inflation of 2% and average earnings growth of 5% in years 1–5 and 3% in years 6–9. In the first period of negative real earnings growth, average earnings growth falls to 0% for one year. In the second period of lower average earnings growth, which lasts four years, the rates are 0%, 1%, 2% and 3%. Between the periods of negative real earnings growth, the nominal average earnings growth rate is 4%, as it is in the final three years.
Source: Authors’ calculations.
However, during any period where average earnings growth is below inflation, such as a recession (highlighted in grey in the figure), the value of the state pension rises in line with prices (and is therefore constant in real terms). This protects the purchasing power of the state pension in times of an economic downturn (so the blue dashed line is horizontal and above the yellow line). The state pension then continues to be indexed to prices, rising at the rate of inflation, until it reaches the target level again (so the blue dashed line does not rise until the yellow line reaches it), and then continues to rise again in line with average earnings.
This report sets out our key findings and suggests a way forward for the future of the UK state pension. These policy suggestions are based on new findings in this report, evidence from specially conducted polling and focus groups, and discussions with expert stakeholders. Together with a commitment from the government to target a level of the state pension relative to average earnings, the suggested ‘four-point pension guarantee’ is carefully designed to build on the strengths of the current state pension system and to address some of the key challenges we have identified. In particular, it would help ensure people can have confidence and certainty over the state pension as a future source of income to protect them from poverty and provide a solid bedrock on top of which they can build private pension saving.
Key findings
1. The UK state pension system has a number of attractive features that work well. Much of this follows from the success of the recommendations of the Pensions Commission almost 20 years ago. Following reforms legislated in 2007 and 2014, we are moving towards a flat-rate state pension which most people who spend most of their adult life in the UK will receive in full. The full new state pension is set at a level that means most new pensioners do not need to rely on the means-tested pension credit. Even with no private income, most people receiving the full amount are very close to or above the relative poverty line. The first universal increase in the state pension age was legislated and implemented with relatively little controversy. The state pension age – and the fact it is rising – is relatively well understood.
2. There is widespread pessimism about the future of the state pension, and a mixture of confusion and pessimism about the level of the state pension. Only one in five working-age people (20%) know even approximately how much a full state pension is. Despite it being increased every year by at least inflation since 1975, 38% think that the state pension will rise by less than inflation over the next decade. One-third do not think the state pension will exist in 30 years’ time. This is likely a driver of many (41%) thinking they will not have a good standard of living in retirement.
3. The state pension should remain flat-rate, i.e. neither earnings-related nor means-tested. This maintains the post-Pensions-Commission settlement for a pension system that balances state and private pensions in retirement. Many other European countries provide an earnings-related state pension. However, earnings-related pensions have an unhappy history in the UK, and we sense no political appetite for raising taxes in order to fund bigger state pensions that benefit middle and higher earners in particular. Widespread means-testing of the state pension is not an attractive option when we rely on private saving to supplement the state pension for so many, as it could significantly reduce saving incentives and risk undermining the success of automatic enrolment. The risk of distorted saving incentives applies to most workers, as the state pension is an important source of income for many who are not poor; for example, it makes up nearly half of income for recently retired middle-income pensioners.
4. The UK should maintain a single universal state pension age, rather than introduce an ‘early access’ age in return for a reduced award as is possible in some countries. Allowing early access would mean that people approaching the state pension age would have to make a complex financial decision about the timing of claiming their state pension, which would have long-lasting consequences. It would also complicate the concept of the state pension age, which is perhaps the best-understood part of the system. Allowing early access at a permanently reduced rate would increase individuals’ risk of income poverty at older ages and place greater demands on means-tested support for pensioners. This means the case for allowing early access would be stronger if the state pension were made more generous relative to average earnings. We will consider the case for additional state support for those who find it hard to work prior to state pension age in a later report in this Review.
5. The ageing population will add considerable pressure on public finances in coming decades. Under legislated state pension age increases (eventually to 68) and the triple-lock method of indexation, spending on state pension, pension credit and winter fuel payment is projected to rise from 5.1% of national income in 2023–24 to 6.4% in 2050–51 under the OBR’s central scenario. Pressures on the health and social care budgets are even larger – set to push up spending from 9.5% of national income now to 13.6% in 2050–51. While there is considerable uncertainty around these precise numbers, it is clear the ageing of the population represents a substantial challenge for the public finances.
6. The triple lock increases the value of, and thus public spending on, the state pension relative to both prices and average earnings over time. Compared with increasing the state pension in line with average earnings, we project that the triple lock could reasonably be expected to cost anywhere between an additional £5 billion and £40 billion per year in 2050 in today’s terms, equivalent to between 0.2% and 1.6% of national income. A government that wants to control future spending on the state pension, while maintaining the near-universal and flat-rate nature of the state pension, would need to abandon the triple lock or increase the state pension age even further than currently legislated.
7. The latest government-commissioned Independent Review of the State Pension Age proposed that spending on the state pension should be capped at 6% of national income. The projections from that report suggest that even with a state pension age of 70 in the early 2050s, spending on a triple-locked state pension would exceed this cap at that point, though these projections are very uncertain, in particular because of the uncertainty generated by the triple lock. The cap is badly designed – for example, it would allow a much more generous deal to those from small birth cohorts than to those from large cohorts – and it should not be implemented.
8. Keeping the triple lock while raising the state pension age would hit poorer people more because the loss of a year of income is more important for those with lower life expectancy, as they spend fewer years above the state pension age. On the other hand, those with a higher life expectancy benefit relatively more from the triple lock, as they are more likely to be receiving a generously indexed state pension in their 90s and beyond. If one were to increase the state pension age from 66 to 67 today, that would on average reduce the lifetime value of the state pension by 6%, but it would reduce it by 8% for the poorest fifth of men and by 5% for the richest fifth of men. In contrast, the impact of moving away from the triple lock and to earnings indexation – also a 6% reduction in expected value of the state pension on average – would be a reduction of 4% for the poorest fifth of men and 6% for the richest fifth of men. The patterns for women are similar.
9. The triple lock ratchets up the value of, and spending on the state pension over time in a way that creates uncertainty for individuals around what the level of the state pension will be relative to average earnings, and for the public finances. Because of the ratcheting effect of the triple lock, which locks in any above-earnings-growth increases in the state pension, the range of possible levels of the triple-locked state pension relative to earnings is wide. Based on the past 30 years of inflation and earnings data – and uprating decisions – a reasonable range (occurring 80% of the time) for the state pension in 2050 would be 30% to 37% of median full-time earnings, a range of £10,900 to £13,400 (in terms of today’s earnings). The long-term risks for the sustainability of the public finances also increase the likelihood of other cuts to the state pension system being introduced in future decades, such as an even higher state pension age.
10. The introduction of the new state pension in 2016 and (to a lesser extent) the triple lock since 2010 together have resulted in the full rate of the new state pension approaching 30% of median full-time earnings – higher than the basic pension was at any point since at least 1968. We therefore now have a flat-rate state pension that is more generous, relative to median earnings, than it was when the earnings link was broken by the Conservative government in 1980. Despite this, on average, people in younger generations are likely to receive lower state pension incomes under the flat-rate new state pension than if earnings-related state pensions had not been abolished. Though, due to automatic enrolment, many more people from younger generations are also likely to accumulate at least some private pension wealth.
11. A more generous state pension would of course lead to a higher income for current and future pensioners – and would be particularly valuable to low- and middle-income pensioners – but this would also have implications for public finances. If, for example, the government decided that the new state pension should be worth a third of median full-time earnings, this would mean that the new state pension would be 13% higher than it currently is – £230 per week, or £26 higher, in today’s earnings terms than the current full new state pension of £204 per week – costing an additional £18 billion per year by 2050 (relative to keeping the new state pension at 30% of median earnings).
12. Despite many believing so, it is not true that only people paying National Insurance contributions generate eligibility towards the state pension. Ever since 1948, there have been credits for periods of unemployment and incapacity due to poor health. The state pension is now much more generous in its coverage than in the past, with those reaching state pension age after 2010 able to get recognition for time spent out of the labour market due to childcare and other caring responsibilities. There is no longer a reduced pension available to married women for those who got married after 1977. The new state pension offers a better deal to the self-employed than prior to 2016. There are a large number of complex rules over what counts as a ‘qualifying year’ which generates eligibility to a state pension. This leads to various inequities – for example, someone earning £5,000 per year who also receives universal credit will automatically qualify, whereas someone with the same level of earnings but with a higher-earning spouse, who is therefore not eligible for universal credit, is unlikely to qualify. We are rapidly moving to a state pension system in which most people who live in the UK all their adult life get a full state pension. But we are not quite there yet.
13. There is a good case for simplifying the complicated eligibility rules and moving further towards a universal pension where essentially all people build entitlement to a state pension each year of life they live in the UK (up to a cap). This would be a more transparent and arguably fairer system. To the extent that this move would have a cost to the exchequer, the number of years required for a full state pension could rise slightly from 35 years to make it cost neutral (or, if so desired, could be raised further). A more universal state pension would simplify the system, lead to some efficiency savings and reduce the risk of some people inadvertently falling through the net. But the administrative challenge of accurately measuring who is resident in the country in each year would have to be overcome and the change would not lead to significant differences in state pension incomes for most people. In other words, altering the current system might be a substantial administrative challenge benefiting a relatively small group. That said, the obvious, and often unintended, inequities created by the current system mean that a change towards greater universality is, at the very least, worth exploring.
14. Together, our new findings in this report, evidence from specially conducted polling and our discussions with various stakeholders suggest a ‘four-point pension guarantee’. This guarantee is designed to: give people more confidence and certainty over what they can expect their state pension to provide; help them avoid old-age poverty; and provide a bedrock on top of which private pension saving can be built. In order to achieve these goals, the guarantee has to be communicated coherently and transparently, and its implications have to be clear and understandable for both current and future generations of pensioners.
15. The four points are:
1. There will be a government target level for the new state pension, expressed as a share of median full-time earnings. Increases in the state pension will in the long run keep pace with growth in average earnings, which ensures that pensioners benefit when living standards rise.
2. Both before and after the target level is reached, the state pension will continue to increase at least in line with inflation every year.
3. The state pension will not be means-tested.
4. The state pension age will only rise as longevity at older ages increases, and never by the full amount of that longevity increase. To increase confidence and understanding, the government will write to people around their 50th birthday stating what their state pension age is expected to be. Their state pension age would then be fully guaranteed 10 years before they reach it.
16. To set the target level, as the government has done with the minimum wage, politicians should state what they believe to be an appropriate level for the state pension relative to average earnings. They should then legislate a pathway to meeting that target with a specific timetable. This would result in an explicit commitment from the government to target a level of state pension relative to average earnings – which may be above its current level – and the four-point pension guarantee would then maintain that value in the long run too.
1. Introduction
This report of the Pensions Review, led by the Institute for Fiscal Studies in partnership with the abrdn Financial Fairness Trust, considers the role of the state pension in the UK pension system. The UK state pension is an important feature of the UK’s broader welfare state, providing income to older individuals, most of whom are no longer in paid work. First introduced in 1909, and then overhauled in 1948 following the Beveridge Report, the state pension system has been subject to substantial reform each decade since the mid 1970s in response to demographic shifts, fiscal considerations, and changes in political and economic priorities (see Bozio, Crawford and Tetlow (2010) for a comprehensive review of the history of the UK pension system).
Today, the state pension system differs in important ways depending on the point at which an individual reached state pension age (SPA, the age at which the state pension can first be claimed). Those who reached this age before 6 April 2016 are typically entitled to the flat-rate basic state pension (BSP, full amount currently £156.20 per week). On top of this, many will also have some earnings-related state pension which they built entitlements for during working life. Those reaching the SPA on or after 6 April 2016 are typically entitled to the new state pension (nSP, full amount currently £203.85 per week), which is a flat-rate state pension higher than the BSP. 1
This means that, over time, the system in place since 2016 will become increasingly dominant for pensioners as older people (who reached the SPA prior to 2016) gradually die, and as those in subsequent generations become more likely to be entitled to a full nSP, and no more, when they reach the SPA.
While this report provides some background information on the historical evolution of the UK state pension, in our analysis and recommendations we focus on the nSP. In particular, we do not propose any additional changes to the benefits of those currently receiving the BSP or other state pensions – we simply assume that any changes to the nSP would apply in a similar way.2
State pension expenditure represents a significant portion of the UK government’s total expenditure – it is the second-most expensive item of public spending after the National Health Service (NHS). Figures from the Department for Work and Pensions (2023c), which relate to Great Britain, put total state pension spending at £124 billion per year in 2023–24, or 4.8% of national income. Including some other pensioner benefits (pension credit and winter fuel payment), this rises to £132 billion (5.1% of national income), while adding in all cash payments to pensioners – including disability benefits and means-tested support for housing costs – brings this up to £152 billion (5.9% of national income). On top of this, there is also further means-tested support for council tax bills, and of course those over the SPA also make relatively more use of many public services – not least the NHS and social care systems.
There are a number of challenges facing the UK pension system and public finances in the future, in particular in the context of significant demographic change. Rising longevity at older ages, and falling fertility, mean that the UK has an ageing population. The proportion of the adult population in receipt of the state pension is therefore increasing over time, which puts pressures on the fiscal sustainability of the system in the long run. This has been exacerbated by the poor economic performance of the UK economy since 2008. But it is also the case that most pensioners rely on the state pension to provide the majority of their income in retirement. In the current year, 2023, 12.8 million individuals across Great Britain receive an average of £187 per week from the state pension. While most would need a considerably higher income in order to preserve their working-age living standards through retirement, it is a sum that very few who are retired could do without. It is therefore imperative that we have a secure and sustainable state pension system that continues to serve its purpose of providing an important source of income throughout retirement for future generations of pensioners.
This report offers a broad range of new analysis that we have conducted on the UK state pension system, considering its current state and challenges facing it in the future. Throughout this report, we also present evidence on the public’s perception of the state pension system from polling and public engagement work which was specially commissioned for the Pensions Review by abrdn Financial Fairness Trust and conducted respectively by YouGov and Ignition House in the summer of 2023. Drawing on all this – and from discussions with our expert Steering Group (Alistair Darling, David Gauke and Joanne Segars), with three sets of Advisory Groups and with many others – we put forward reforms that would improve the current system and help ensure it will function well not just today, but also in the coming decades.
The report proceeds as follows. Chapter 2 introduces the UK state pension system in more detail and examines how the level of the state pension, and public spending on it, have evolved over time. Chapter 3 focuses on demographic change and its implications for the future of public finances. Chapter 4 discusses inequalities in state pension incomes and how they relate to eligibility rules. Chapters 5 and 6 analyse the key levers that the government has available within the current system to address public finance concerns: increases in the SPA and changes to state pension indexation, respectively. We also present evidence about how these changes affect different people. Chapter 7 concludes this report. These conclusions will feed into our final recommendations at the end of the Pensions Review.
2. Introduction to the UK state pension system
In this chapter, we first introduce the UK pension system and its key features. We then examine how the level of the state pension and public spending on it have evolved over time, and how its current level relates to the government’s measures of income poverty. We discuss how the UK pension system is structured and how that compares internationally with other high-income economies. We also discuss the public’s views of the state pension.
2.1 Key features of the UK state pension system
The state pension system went through a significant change in 2016. Those who reached the SPA before 6 April 2016 were generally entitled to the flat-rate BSP (full amount currently £156.20 per week). There was also an earnings-related state pension (mainly the State Earnings-Related Pension Scheme, SERPS, and the state second pension, S2P) towards which employees may have built entitlements during working life. However, the majority of employees opted out of building up entitlement to an earnings-related pension in return for a reduction in National Insurance contributions and they built up a private pension instead (known as contracting out). In contrast, those reaching the SPA on or after 6 April 2016 are typically entitled to the nSP (full amount currently £203.85 per week), which is a flat-rate state pension unrelated to earnings over working life and which – like the flat-rate BSP before it – individuals are not able to opt out of.
The introduction of the nSP in 2016 marked a significant shift, as it swiftly transformed the UK’s pension system from an earnings-related to a flat-rate system. This was a much sped-up version of the recommendation by the Pensions Commission of the mid 2000s (Pensions Commission, 2004 and 2005) and had broad consensus behind it across the political spectrum. This was a fundamental change, and one of its key aims was to simplify the pension system in order to make it more predictable and easier to understand for future beneficiaries (Department for Work and Pensions, 2013).
The nSP, like its predecessors, is not means-tested or earnings-tested (i.e. it is not directly reduced for people with earned or other private income), though it is subject to income tax. Eligibility depends on an individual’s National Insurance contribution and ‘crediting’ history, and not their income, wealth or work status. Entitlement to nSP is built through ‘qualifying years’. These qualifying years can be built up through either employment during which National Insurance contributions were made, receipt of National Insurance credits due to circumstances such as unemployment, incapacity, receipt of universal credit or certain formal roles as a parent or carer, or paying voluntary National Insurance contributions. Individuals with fewer than 10 qualifying years receive no state pension. Since 2016, those with 35 qualifying years are eligible for the full nSP; additional years beyond 35 do not add additional entitlement.
The state pension can be claimed once individuals reach their SPA, currently 66 for both men and women. The state pension cannot be claimed prior to age 66. Those not claiming the state pension at the SPA are deemed to have deferred and can receive a higher pension when they do claim it. With the new state pension, a deferral of one year increases the value of the state pension by 5.8%. But very few people do this – 95% of individuals receive the state pension within two months of reaching their SPA (Crawford and Tetlow, 2010), and as of September 2019, 8% of all state pensioners were in receipt of an ‘increment’ on top of their state pension entitlement as a result of having deferred their claim (Thurley, 2020)3. While being in paid work does not affect eligibility to the state pension, Cribb (2023) shows that people still working in their late 60s are less likely to claim their state pension once they have reached the SPA.
Since 1975, governments have legislated for the state pension to increase automatically each year (though the default uprating is sometimes set aside to increase the state pension by more or less than the default). Most recently, since 2011 the BSP – and since 2016 also the nSP – has been indexed in line with the ‘triple lock’ mechanism. This means that each April, by default, the value of the pension increases by the highest of average earnings growth, inflation or 2.5%.4 As a result, the value of the nSP increases faster than earnings whenever earnings growth is lower than inflation or 2.5%. In periods of relatively stable macroeconomic conditions, we would expect average earnings growth to be higher than both inflation and 2.5%, meaning that in those periods the value of the state pension would increase in line with earnings (and faster than prices or 2.5%).
The period since the 2008 financial crisis has been one of dismal economic growth, during which earnings have often grown by less than inflation or 2.5%. Cribb, Emmerson and Karjalainen (2023) show that over the 13 years between 2011 and 2023, the state pension rose by earnings growth just three times, by inflation six times and by 2.5% four times5. This mechanism ratchets up the value of the nSP relative to both earnings and prices over time, as any increase relative to prices or earnings is locked in for all future periods.
The triple lock is often discussed in the media, and indeed indexation of the state pension has been a contentious topic in the UK since at least 1980 when then Prime Minister Margaret Thatcher announced that the state pension would, by default, be price indexed rather than increased each year by the greater of growth in prices or earnings, as had been the case since 1975. Figure 2.1 shows the value of the BSP and nSP over time. The top panel shows the value in real terms from 1950 to 2023, where the BSP has been adjusted for the Consumer Prices Index (CPI, which gives a measure of inflation that the Bank of England started targeting in 2003 and that has become particularly widely used since the early 2010s) and for the Retail Prices Index (RPI, which gives a longer-running measure of inflation, but a flawed one that tends to overstate inflation). The bottom panel shows the value of the BSP and nSP relative to average (mean and median) full-time earnings.
Figure 2.1. Value of the state pension entitlement over time in current prices (real terms) and as a share of average earnings
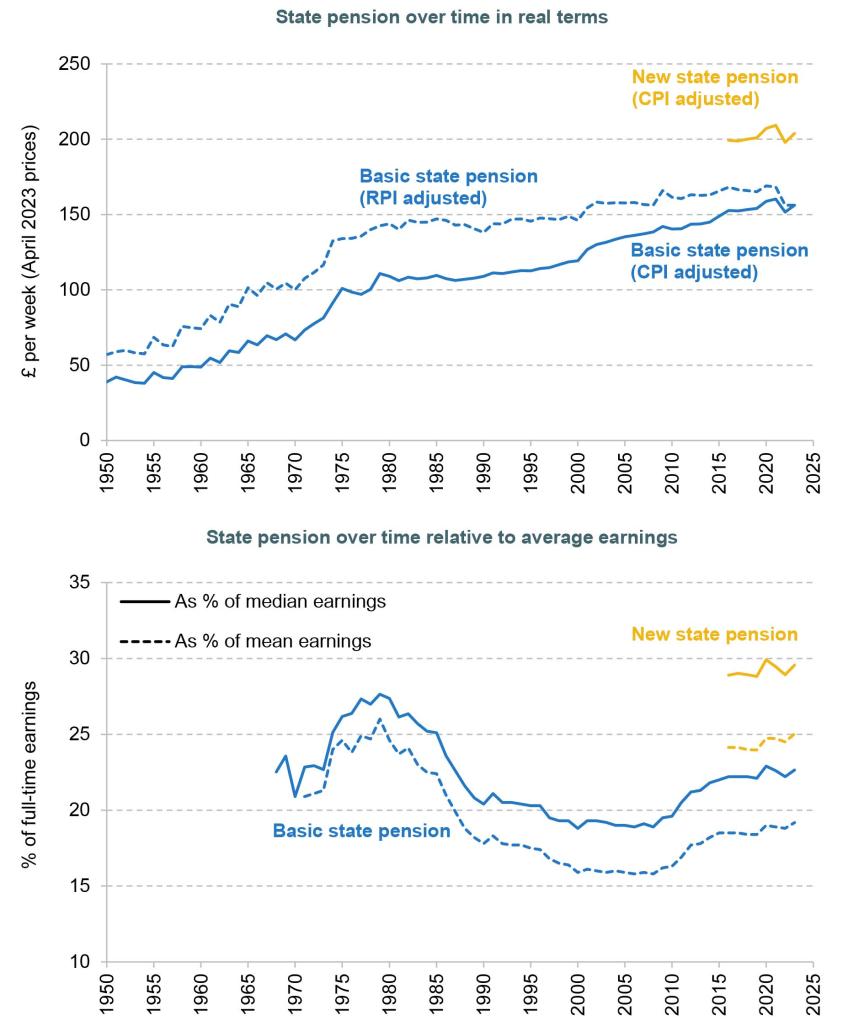
Note: Median full-time earnings since 1984 are from DWP benefit rate statistics; values for earlier years are calculated using the growth rate of nominal full-time median earnings from the Family Expenditure Survey (FES). Mean full-time earnings are from DWP benefit rate statistics. The 2023 values are calculated using the April 2022 to April 2023 growth rate of average weekly earnings (total pay) reported by the Office for National Statistics.
Source: https://www.gov.uk/government/statistics/abstract-of-dwp-benefit-rate-statistics-2022 and authors’ calculations.
First focusing on the top panel, over the period from the 1950s to the mid 1970s – where indexation of the state pension was done on an ad hoc basis – the value of the BSP increased much faster than prices. As stated above, the earnings indexation that had applied to the BSP in the mid 1970s was replaced in 1980 with price indexation (based on RPI). Over the next three decades, the state pension was stable in real terms when adjusted by RPI and rising in real terms when adjusted by CPI (which is typically lower than RPI). Under the triple lock, the value of the BSP – and more recently the nSP – has continued to increase in real terms.6
While the state pension was stable or rising in real terms, its level relative to overall living standards in the economy fell during the period of price indexation, as illustrated in the bottom panel of Figure 2.1. (The solid line shows the value of the state pension relative to median full-time earnings and the dashed line shows its value relative to mean full-time earnings.) In periods of relative economic stability, we generally expect earnings to rise faster than prices, as was the case in most years from 1980 to the late 2000s. As a result, the value of the BSP fell relative to earnings over this period, especially during the 1980s when earnings growth was particularly strong.
This decline in the value of the BSP relative to average earnings was recognised by the Pensions Commission in the mid 2000s, and it recommended a return to earnings indexation (though, unlike in the 1970s, this was not a ‘double lock’ – i.e. if earnings grew less quickly than prices, the proposal was that the value of the BSP would fall in real terms). This was then legislated – with cross-party support – with an intention for it to come into effect from 2012 and a firm commitment for it to happen by 2015. However, before earnings indexation was introduced, the coalition government introduced the current triple lock. With the introduction of the nSP and (to a lesser extent) the triple lock, the value of the flat-rate component of the state pension today – at close to 30% of median full-time earnings – is above the level that the BSP was at relative to earnings in 1980 (when the ‘earnings link’ was broken). It is also the highest level since 1968, the first year of our data.
2.2 Spending on the UK state pension
The UK state pension operates on a pay-as-you-go (PAYG) basis. This means the state pensions of current pensioners are paid out of current general tax revenue (which is disproportionately, but not entirely, paid for by current generations of working-age people). The expectation – of course – is that taxation raised (disproportionately) from the next generation of working-age people will pay for the state pensions of the current generation of workers, and so forth. While qualifying years which determine eligibility for the state pension can be built up based on whether an individual has paid National Insurance contributions (but also in other ways, as discussed in Chapter 4), there is no ‘pot’ into which these National Insurance contributions are paid that is then invested in order to pay for that individual’s pension in the future – contrary to popular belief. Rather, the National Insurance contributions and other taxes levied in any given year help to pay for government spending in that year.
Figure 2.2 shows spending on the state pension, as well as associated pensioner benefits (pension credit and winter fuel payment) over time as a share of national income. First, looking at overall spending on the state pension, we can see that spending has increased from around 2% of national income in 1948–49 to just below 5% currently. Spending on the state pension rose consistently as a share of national income from the 1940s to the early 1980s, then fell in the 1980s and remained broadly flat until the financial crisis, as the value of the BSP fell relative to average earnings (as shown above). After the financial crisis, spending as a share of national income then rose to around its current level.
Figure 2.2. Spending on state pensions and pensioner benefits as a share of national income
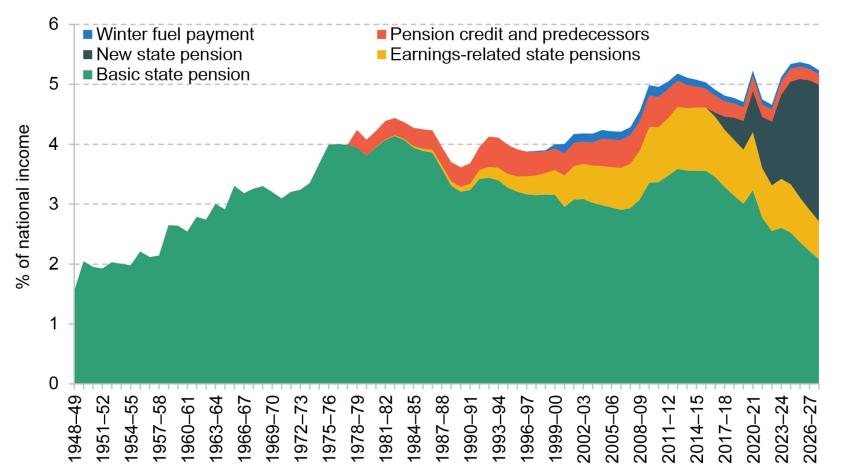
Note: Spending relates to Great Britain.
Source: Department for Work and Pensions, 2023c.
While pensioner benefits are not the focus of this report, we can also look at how spending on those has changed over time. Pension credit is a means-tested benefit that can be claimed by those whose income is below a minimum level (in 2023–24, this is £201.05 per week for a single pensioner and £306.85 per week for a couple where both are over the SPA)7. Winter fuel payment makes payments of £200 per household (£300 for households where the members are aged 80 or over) in the winter to most pensioner households. Spending on these additional benefits has become relatively less important over time with, in particular, those reaching the SPA from April 2010 and (especially) April 2016 having greater entitlements to the flat-rate state pension, which reduces eligibility for means-tested support. Spending on winter fuel payment, while £2.0 billion in 2023–24, has always been small relative to the support provided through the state pension. Overall spending in the coming year, 2024–25, is forecast to be 5.3% of national income, which would be its highest share of national income ever.
There are no predefined rules in the UK to adjust pension system parameters in response to shifts in demographic, economic or financial indicators. In other words, unlike in some other countries, the UK state pension system does not adjust automatically to changing circumstances. For example, the state pension age in Denmark will rise beyond 68 (which it will reach in 2030) one-for-one in line with rising life expectancy (OECD, 2019), while the amount of support provided through Sweden’s state pension is linked directly (and negatively) to the longevity of the previous generation. Instead, in the UK, any changes to indexation, eligibility and the SPA (or other parts of the formula that determines entitlements) have been ‘manually’ enacted through legislation over the years. This requires governments to be proactive and to take a long-term view. For example, reforms legislated under Conservative governments in the 1980s and 1990s and the increases in the SPA legislated under Labour in the 2000s and then the coalition government in the 2010s often delivered – or will deliver – reductions in spending that did not occur until a later (and often much later) parliament.
2.3 Structure of the UK state pension system
It is worth noting that a flat-rate pension is by no means the only possible way to structure a state pension. The key alternatives to the current flat-rate system would be to have a means-tested state pension, like the Australian ‘Age Pension’,8 or an earnings-related scheme, as many European countries and the United States operate.
Means-testing pensions can help target support to the most financially vulnerable pensioners, instead of providing income to those with significant sources of other income. The clear attraction of means-testing is that it can allow more resources to be transferred to lower-income pensioners at a lower overall budgetary cost in a given year. But it has a number of potential drawbacks. One is that take-up of these benefits is not complete, meaning that some fall through the safety net. Another is that means-testing reduces incentives for individuals to save privately for retirement; means-testing of pensioner support essentially reduces the return that some can expect on their private pension saving. The lower the means-testing threshold, the greater the extent to which government spending is targeted at low-income pensioners, but the more widespread this issue of distorted incentives would also be. In Australia, this disincentive is mainly avoided because of the existence of compulsory saving into a private pension ‘Superannuation’ scheme. Means-testing of the state pension could also reduce work incentives, most obviously for those above the SPA who might be considering continuing in some paid work.
With an earnings-related pension, the pension amount an individual receives is linked to their past earnings. In 1975 the UK passed legislation introducing the State Earnings-Related Pension Scheme (SERPS). This was intended to provide a substantial earnings-related pension to most employees who did not have access to an occupational pension from their employer. Entitlements depended on earnings in each financial year, and under the initial SERPS formula were based on the highest 20 years of an individual’s earnings. But the full eventual impact on public spending was not forecast at the time (Hemming and Kay, 1982). Legislation in the mid 1980s halved its future cost and further legislation in the mid 1990s halved it again. The rising cost of SERPS may also have been a factor in why price indexation of the BSP was retained for so long after 1980: as can be seen in Figure 2.2, overall public spending on support for pensioners did not fall between 1980 and 2010 despite the generosity of the BSP falling sharply relative to average earnings (as shown in Figure 2.1). The nSP will deliver the final demise of SERPS relatively rapidly as each successive generation reaching SPA from April 2016 will have reduced entitlement to SERPS.
There are good arguments for the state providing an earnings-related pension. Individuals will typically want to have a secure income through retirement at a level that provides a standard of living comparable to what they had during their working life, and for a number of reasons there can be considerable challenges in a private pension system delivering this. But an earnings-related pension means that a large share of state pension would go to those who had previously been higher earners, implying either a lower state pension for those who have been low earners or higher public spending on state pensions targeted at the better-off (though better-off individuals will, of course, also have paid higher taxes over their working life).
We do not sense a widespread political appetite for either a lower state pension for low earners or higher public spending, and it would be difficult to describe the UK’s previous attempts at earnings-related state pensions as ones that successfully delivered retirement income security. All in all, the UK’s experience with an earnings-related state pension has been an unhappy one. Given where we are, we do not suggest another attempt to introduce one. A flat-rate approach would also be in keeping with the vision of Sir William Beveridge, the architect of the UK’s post-war welfare state, and the recommendations of Lord Turner’s mid-2000s Pensions Commission which were endorsed across the political spectrum.
2.4 Level of the new state pension
An obvious question for a flat-rate state pension is the level at which it is set. With an earnings-related pension, the level may be set as a replacement rate, i.e. a percentage of some measure of pre-retirement earnings that the state pension should cover for someone with a full working life. But with a flat-rate pension, the rate will have to be set differently (as the cash amount is by definition the same for all people who have enough qualifying years). In particular, the new flat-rate pension can be thought of as providing a foundational layer or ‘first pillar’ upon which individuals can build retirement income through private pensions and other saving. There are other initiatives that aim to set out what the minimum income for retirees should be from all their income sources (for example, see Finch and Pacitti (2021) or the Pensions and Lifetime Savings Association’s Retirement Living Standards9). However, we will not compare the state pension directly to those levels, given that the state pension is intended to act as a basis for further private saving, rather than necessarily an adequate level of income on its own.
Ideally, for the nSP to support people’s private pension saving effectively, it is important that people have a reasonable idea about the level of the state pension. This way, people can make an informed decision about private pension saving based on how much income they might be able to expect from public provision.
Despite the relative simplicity of the new state pension system, it seems that working-age people have a low level of understanding of the state pension. Polling commissioned for this Pensions Review in the summer of 2023 and published in Barker, Cribb and Emmerson (2023) showed that only 13% of 25- to 49-year-olds and 31% of 50- to 64-year-olds answered that the current value of the new state pension (£203.85) was between £180 and £220. This shows that more needs to be done to inform the general public about the level of the state pension in order to assist individuals with their retirement planning.
Many also argue that the level of the new flat-rate state pension should be set in a way that protects people from income poverty. Indeed, that was a key intent of the original Beveridge Report – which proposed that the BSP should be set so that those receiving the full amount were free from poverty. While income poverty lines, which determine whether people are categorised as being in (or not in) income poverty are inherently arbitrary, they are useful for assessing living standards of pensioners. To determine whether the nSP achieves Beveridge’s target, we therefore assess its current level against the government’s relative income poverty line (measured as 60% of contemporaneous median disposable income, adjusted for household size and after deducting rent and certain other housing costs).
We want to understand how incomes under the current state pension system compare with poverty thresholds, as this is what most current workers (and future retirees) will, under current policy, be eligible for: DWP modelling shows that more than 80% of those reaching the SPA by the mid 2030s will be eligible for the full nSP (Department for Work and Pensions, 2013). An analysis of current pensioners’ incomes is less informative, because the amounts that current pensioners are entitled to will still reflect entitlement rules of previous state pension systems. In particular (and will be discussed in Section 4.1), those who reached the SPA prior to April 2016 are not eligible for the nSP and those who reached the SPA prior to April 2010 were much less likely to qualify for a full BSP.10
The maps in Figure 2.3 illustrate how income provided by a full nSP, alongside any means-tested housing-related benefits (council tax support and housing benefit), compares with the relative after-housing-cost income poverty threshold. We create a number of ‘example households’ with different housing tenures for different parts of Great Britain11 with one or two 66-year-old residents in the current tax year (2023–24). We assume that each individual receives a full nSP, winter fuel payment, and council tax support and housing benefit where applicable, but no additional benefits such as disability benefits. For social renters, we assume their rent is the local authority average for that region. For private renters, we assume their rent is the 30th percentile for a one-bedroom home for that area. Importantly, we assume these households receive absolutely no private income (such as from earnings, private pensions or investments).
Figure 2.3. Income after housing costs for those with a full nSP and no private income, as a percentage of the relative poverty threshold (% of current 66- to 70-year-olds in each group in parentheses)
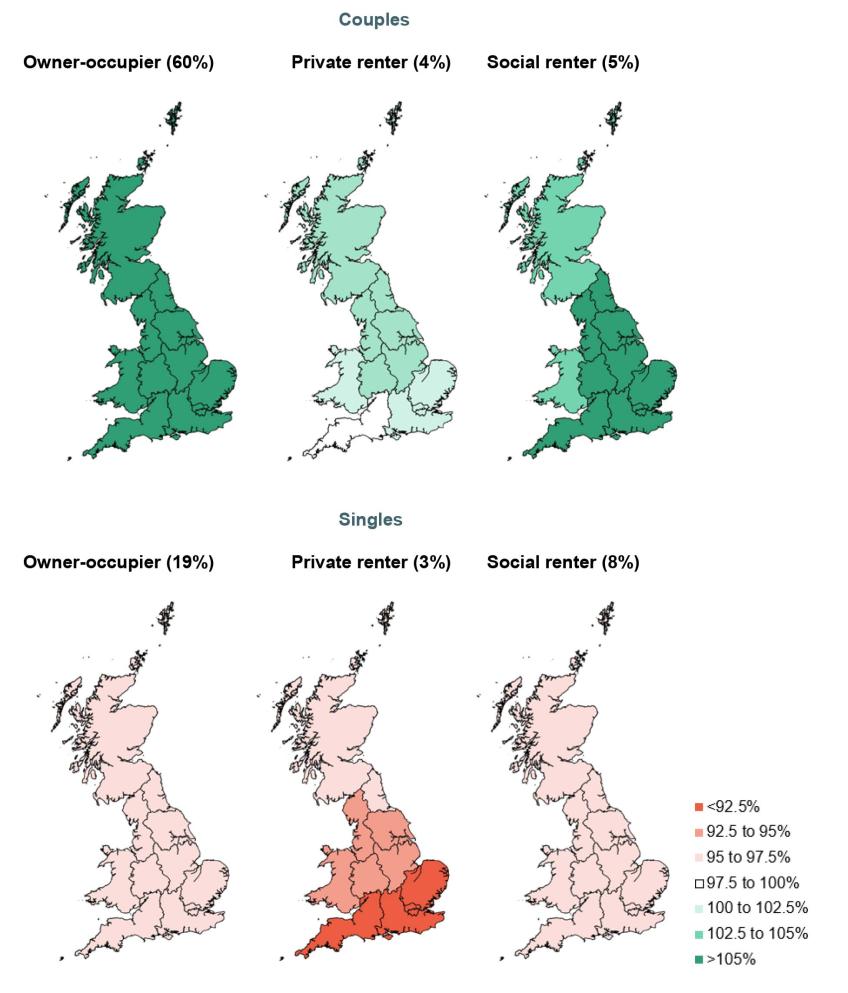
Source: Authors’ calculations using the IFS personal tax and benefit model, TAXBEN, based on example households of 66-year-olds. It is not currently possible to include Northern Ireland in these calculations.
The shading on the maps indicates how the income (after deducting housing costs) of the example families in each area compares with the relative income poverty threshold. The percentage figure in parentheses at the top of each map is the share of current 66- to 70-year-olds who are of that housing tenure and marital status.
Starting with couples, it is clear that with two nSPs and any means-tested benefits they are entitled to, and even without any private income, all of the example households have incomes at or above the relative income poverty threshold.12 For owner-occupiers, which is by far the most common housing tenure among couples in their late 60s, incomes are more than 20% above this threshold. Incomes for social renter couples are 4–5% above the threshold.
For single-person households, the picture is different. Single owner-occupiers and single social renters – who together comprise the vast majority of single individuals in their late 60s – are just below the relative income poverty threshold with incomes of roughly 95% or 97% of the threshold depending on region (in pound terms, this is equivalent to £10 or £7 per week less than the threshold, respectively). However, single private renters are households for whom the nSP and means-tested benefits alone will often leave them further below the relative income poverty threshold. For households in the North East of England, the after-housing-cost income from the nSP and housing-related means-tested benefits is roughly 96% of the poverty threshold. For those in the South West, the after-housing-cost income is below 90% of the poverty threshold.
These regional differences in how far below the poverty line these households fall are due to the fact that housing benefit rates for those in private rented accommodation have been frozen in cash terms since April 2020. This means that when private rents increase, the maximum housing benefit people can claim does not keep pace. While there are differences in the percentage increase in rents between regions over this period, the largest driver for the size of the shortfalls between the poverty line and the after-housing-cost incomes for these example households is the differences in how much private rents have increased in cash terms, which are driven by the initial (April 2020) rent levels. Even if the percentage increase in rents has been the same across areas, the pound difference in housing costs that are not covered by the housing benefits will be larger in areas that had higher rents to begin with. This is what drives the South–North divide for the private rented sector in Figure 2.3.
The Chancellor announced in the Autumn Statement in November 2023 that the cash freeze on the local housing allowance (LHA) rates, which set the maximum amount for housing benefit available, would end from April 2024. From April 2024, the LHA rates will be updated to the level of the 30th percentile local market rents. Our modelling assumes that rent levels in the private rented sector are exactly at the 30th percentile of rents for the local area, which means that the announced increase in the LHA rates fully removes the shortfall between private rents and housing benefit available in this analysis. This change will make the private renter households look like social renters, whose rents are always fully covered by housing benefit. However, this uprating follows four years of cash freezes on LHA rates, and indeed, in any years when the LHA rates are frozen in cash terms, the gap between private rents and housing benefit will open up again even in our simple analysis. Using households with private rents exactly at the 30th percentile for the local area is also a simplifying assumption, and many households will be paying private rents that are above the LHA rates even after the change.
It is worth keeping in mind that out of current 66- to 70-year-olds, only 3% are single private renters. However, trends in the housing market indicate that this proportion will rise significantly over the next decades. While it is difficult to assess exactly the extent to which current younger generations will be able to purchase (or inherit) their homes by the time they retire, it is likely that as the prevalence of private renting among pensioners increases, this will also have implications for housing benefit receipt and spending. The pensioner benefit system outside of the state pension will be discussed in more detail in a separate future report; but a potential implication of Figure 2.3 is that a well-targeted way of reducing pensioner poverty could be to increase the generosity of housing benefit for pensioners living in private rented accommodation.
As people move through retirement, many more become single-person households when their spouse or partner dies before them. We also know from differences in mortality rates that individuals from poorer households, especially men, have on average higher mortality rates, meaning that lifetime-poor women are more likely to spend more of their retirement as a single-person household.
While relative income poverty is a key indicator that is used to measure the extent to which households may struggle to meet basic needs, it is only one potential measure to judge the new state pension and pensioner incomes against. It is likely to be difficult for a household living at, or only a little way above, the relative income poverty line to build up any rainy-day savings, which would make it difficult for those households to deal with any unexpected costs such as replacing durable goods, other repairs or large unexpected rises in living costs. However, this analysis has also assumed that these households have absolutely no other sources of income apart from the state pension. Especially since the introduction of automatic enrolment into private pension saving in 2012, most future pensioner households are likely to have at least some private pension savings in addition to the new state pension.
While this illustration shows that the nSP and means-tested benefits are enough to keep most households above the relative income poverty threshold, we also know that the relative income poverty rate (after housing costs) among pensioners in the most recent year of data (2021–22) was 18% (Ray-Chaudhuri et al., 2023). There are a number of reasons why the current pensioner poverty rate is higher than indicated by our illustrative example. First, those who reached the SPA before 6 April 2016 are not eligible for the nSP. Many older pensioners, especially women, receive much smaller amounts than the current full rate of the nSP. And even those who reached the SPA on or after 6 April 2016 may not receive the full nSP, if they do not have the 35 qualifying years needed for entitlement to the full amount. There are also many pensioners who are in a couple with a person who is still below the SPA, and if that person does not receive earnings or other private income, a single state pension may not be enough to get the household above the poverty threshold. Some people may also not be eligible for means-tested benefits – for example, due to having assets above £16,000. Even among those who are eligible for means-tested benefits, take-up rates are low. It is also possible that the pensioner poverty rates derived from survey data somewhat overestimate the true poverty rate, as it is well known that receipt of means-tested benefits is under-reported in household survey data. Finally, for private renters, we have assumed that people live in a property with a rent that is equal to the 30th percentile of rents in the area, whereas some may live in more expensive private rented accommodation.
2.5 The UK in international context
In order to understand the UK pension system better, it is also useful to examine how it compares with other countries’ systems. We first consider how the balance between public and private provision differs between countries, and then move on to assess how replacement rates and retirement ages differ. We focus on comparison with a set of larger high-income countries, and include Australia, Ireland, the Netherlands and New Zealand as they have more similar pension systems to the UK, with a significant role for private pension provision, as is shown below.
The UK pension system consists of a (now) flat-rate state pension, and semi-voluntary private saving (due to automatic enrolment of most employees earning more than £10,000 a year into a private pension). Figure 2.4 shows state and private pension expenditure, as a share of national income in 2017, for the UK and other developed countries.
Figure 2.4. Public and private pension expenditure as a share of national income, 2017
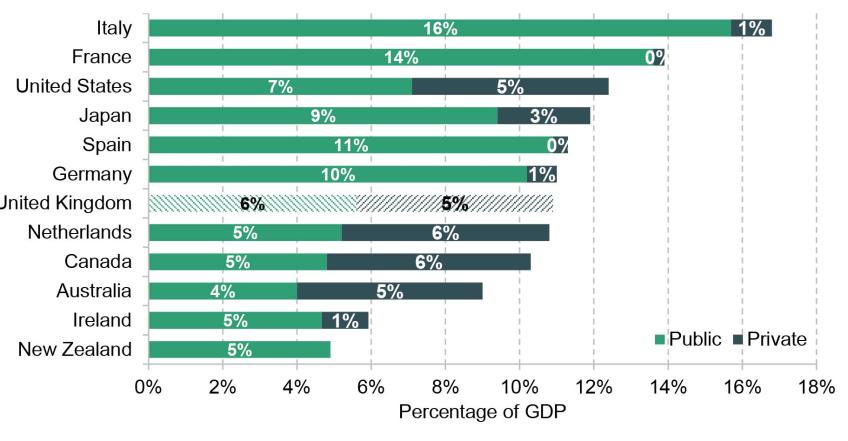
Note: Numbers for Ireland are expressed as a percentage of GNP as Irish GDP is 26% higher than GNP due to income received by multinationals.
Source: Tables 8.3 and 8.4 of OECD (2021).
The first thing to note about this figure is that there is variation in the level of total public and private expenditure on pensions between countries, where public expenditure refers to public spending on pensions and private expenditure refers to payments from private pension schemes. Among these countries, the level of public and private spending on pensions varies from 5.9% of national income in Ireland to 16.8% of national income in Italy. The UK is in the lower half at 10.9%. This variation in spending on pensions may be created by a number of factors, perhaps most obviously differences in the age structure of the population. But it will also be driven by different parameters of the system – namely, the generosity of the state pension and the age at which it can be claimed.
In addition to the level of total expenditure on pensions, we can also focus on the split between public and private pension expenditure. It is clear from the figure that the public pension system in most countries plays a much more important role than in the UK, whereas the UK system relies much more on employer and individual contributions to private pensions, which are tax advantaged. Expenditure on state pensions in the UK was 5.6% of national income, with expenditure on private pensions not far behind at 5.3%.13 In most other large Western European countries (Italy, France, Spain and Germany), pension expenditure and thus income is nearly exclusively the responsibility of the state.
There are countries where the balance between public and private spending in the pension system aligns more closely with the UK. This includes the Netherlands and – with the exception of Ireland – the English-speaking countries shown in Figure 2.4 (the United States, Canada and Australia). However, there are some key differences between the UK and these countries. For example, the US public pension scheme (known as ‘Social Security’) is an earnings-related scheme and provides more income (at 7.1% of national income), whereas income from private pensions is around that in the UK. In Australia, where spending on private pensions exceeds that on public pensions, state pension benefits are means-tested and private saving is compulsory for the vast majority of workers.
We can also use pension ‘replacement rates’ in order to assess the generosity of the different systems. A pension replacement rate is a measure that takes the average pre-tax pension entitlement and divides it by average pre-tax pre-retirement earnings. It measures to what extent a pension system provides a retirement income to replace pre-retirement earnings.
Figure 2.5 reproduces OECD calculations of pension replacement rates for an employee on average male earnings, and illustrates that the UK gross replacement rate provided by the public pension alone is low by international standards. In our selected set of countries, only Australia has a lower rate (due to having a means-tested public pension), though the UK looks similar to Ireland on this dimension. However, as discussed above, this is partly because of a different balance of public and private sector saving. When considering automatic enrolment as a form of quasi-mandatory saving (as the OECD does, and which reflects the fact that around four in five of all employees are saving in a workplace pension (Office for National Statistics, 2022a)), the UK’s overall replacement rate is higher than that in many other major economies, and below only Italy, Spain, France and the Netherlands. The OECD considers as ‘quasi-mandatory’ any schemes where active choice by the employee is not required and employees will by default save into a private pension scheme (even if opt-out is available).
Figure 2.5. Gross replacement rates from mandatory public and private pension schemes for a mean male earner, by country
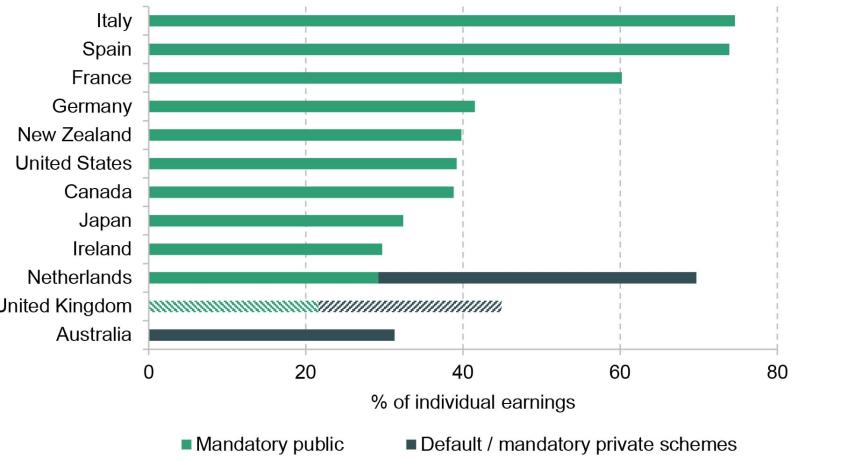
Note: Public pensions in Australia are means-tested, which means that for a middle earner the public replacement rate is zero. The UK’s automatic enrolment system is here considered a mandatory private scheme. In calculating replacement rates from mandatory private schemes, the OECD assumes a real rate of return of 3%, real earnings growth of 1.25%, inflation of 2%, a real discount rate of 2%, defined contribution conversion rate of 90% and labour market entry at age 22 in 2020. The OECD revised the private scheme replacement rate for the UK down by 4.1 percentage points after the publication of the 2021 report, in order to take account of the floor to contributions for the workplace private pension, which were mistakenly excluded when calculating the results in the main publication.
Source: Table 4.2 of OECD (2021).
Another key parameter of the state pension system that will affect spending on state pensions is the age at which individuals can claim a state pension. The UK has one age – the SPA – from which point on the pension can be claimed in full. In many other countries, there are two distinct ages – an ‘early retirement age’, at which point individuals can first draw their state pension, albeit at a lower rate. The ‘normal retirement age’ is then the age at which individuals can first draw a full public pension. Having a single age means that essentially the SPA is both the early and normal retirement age. The left panel of Figure 2.6 shows that, compared with other countries, the early retirement age in the UK is relatively high. On the other hand, the right panel of the figure shows that there is less variation among countries in the normal retirement age; while the UK is still in the upper half in the figure, many other countries also have a similar age for claiming an unreduced public pension. The notable exceptions are France and Italy, which were the two countries in Figure 2.4 with the highest levels of public pension income.
Figure 2.6. Pension claiming ages for individual retiring in 2020
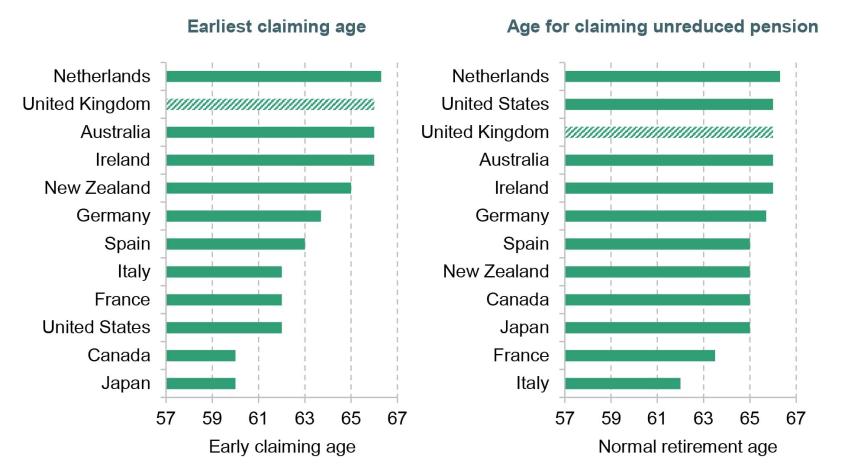
Note: Assumes an uninterrupted career from age 22.
Source: Table 3.5 of OECD (2021).
2.6 Public views
The state pension is, and has been for decades, an integral part of the UK’s welfare state. The quote below from public engagement work commissioned as part of this Pensions Review in the summer of 2023 illustrates this sentiment among the public.
‘[The state pension has] always been there and is part of the country’s DNA; as is the NHS. People need structure in their lives and to feel that the Government has their back when it comes to their working life, if they get ill, and retirement.’
Male, aged 60–78
However, as illustrated in Figure 2.4 above, the UK’s pension system differs from many other European countries’ systems in that individuals and employers carry much more responsibility in saving for retirement. An interesting question therefore is to what extent the public’s views are aligned with this approach.
Polling commissioned for this Pensions Review in the summer of 2023 shows that when working-age people were asked who they think have ‘a lot’ or ‘a fair amount’ of responsibility to ensure people retire with a reasonable standard of living, 85% responded ‘individuals and their families’, 84% responded ‘government’ and 78% responded ‘employers’ (Barker, Cribb and Emmerson, 2023). This suggests that people seem to agree that it is not just the government’s responsibility to ensure an adequate standard of living in retirement, and that individuals, their families and employers share in that responsibility.
On the other hand, in a system where individuals carry more responsibility for ensuring adequate standards of living in retirement, it is important that people feel confident in their knowledge and understanding of the system, in order to allow them to make informed decisions on how much saving they will need to do privately on top of the public pension.
However, there appears to be widespread confusion and indeed mistrust when it comes to the state pension system, and some of this may come from lack of knowledge. The quotes below from public engagement work commissioned as part of this Pensions Review in the summer of 2023 show that there are working-age individuals who do not feel comfortable with their level of knowledge of the pension system. In particular, they feel that their educational background and lack of guidance on pensions is a barrier in even trying to gain understanding. This potentially highlights the value of financial education and giving people, including young individuals, clear information on the features of the UK pension system.
‘I’m only 32 years of age. I don’t remember being taught about how to go about your pension in school. I don’t think in school they actually prepare you for what real life is all about. And going back, my parents never really spoke to me about it.’
Female, aged 30–49
‘Personally I find it quite difficult. I don’t have a lot of certainty of the future. I’m just not educated enough.’
Female, aged 18–29
2.7 Summary
Although by international comparison the UK pension system relies less on state provision and more on income from private pensions, the state pension is a very important part of the UK pension system and welfare state more generally, with around 5% of national income currently being spent on state pensions. The state pension system has been through a number of radical changes over time. In a rather roundabout way, overall these changes have led to simpler and much more uniform outcomes – in future, individuals will receive the full amount of the flat-rate pension from a single same age. Currently, the state pension is set at a level that means most households receiving a full new state pension have an income above the poverty line, even if they have no other income. But single private renters with no private income are at particular risk of having a low standard of living through retirement. Despite the system becoming simpler over time, very few working-age individuals know what the level of the new state pension is, and some feel that they lack the necessary education and advice to enable them to engage with the system.
3. Demographic change and future public finance challenges
In this chapter, we move from describing the current system to discussing future trends affecting the state pension system, in particular changes in demographics – including a comparison with other countries. We discuss what these mean for projected government spending, and the uncertainty associated with these projections. We also look at the public’s views of the future sustainability of the UK’s state pension system.
3.1 Demographic change
The age structure of the UK population is projected to change substantially over the next few decades. Figure 3.1 shows the fraction of adults (aged 20+) who are aged 65 or above, and the fraction over the SPA (which is currently 66 for both men and women, but as recently as 2010 was 60 for women and 65 for men). The share of the adult population aged 65 or above was relatively flat, between 21% and 22%, for the period 1977 to 2012, but rose from 22% to 24% between 2012 and 2020, and is projected to rise to 31% by 2050.
Figure 3.1. Percentage of the adult (aged 20+) population who are aged 65 or over, or aged above SPA, 1971 to 2020 (out-turn) and to 2050 (projected)
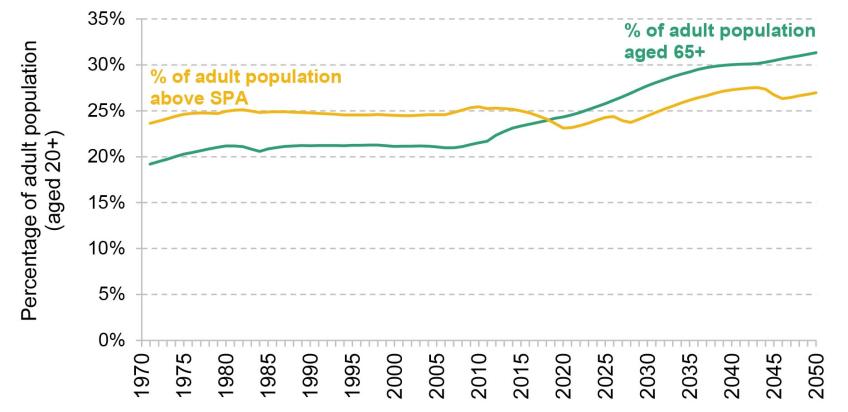
Source: Figure 13 of Cribb, Emmerson, Johnson et al. (2023).
Despite this rising share of the population aged 65 and over, the share of people above the SPA has so far remained remarkably constant because of the large increases in the SPA for women since 2010. However, despite further increases in the SPA – to 67 by 2028 and 68 by 2046 for both men and women – already legislated, the fraction of people above SPA is currently projected to increase from 24% in 2023 to 27% in 2050. Together with population growth, this means that by 2050 the number of individuals above the SPA will be 25% higher than today.
It is also interesting to know how the UK’s ageing population challenge compares with that in other countries. Figure 3.2 compares the old-age dependency ratios (the number of people aged 65 and over per 100 people aged 20–64) in 2023, and projections for 2050, for the same selected countries as considered in Chapter 2. On this measure, the UK’s old-age dependency ratio is currently relatively favourable, at least compared with many of the other countries, and that is projected to remain the case. While it is projected to rise substantially from 34% to 47% over the period, this would still mean that the UK’s old-age dependency ratio in 2050 is lower than for many other countries at that point – for example, Japan is expected to reach an old-age dependency ratio of 81% by 2050, and these figures are 55% for France and 58% for Germany. In fact, Japan already has an old-age dependency ratio above the UK’s 2050 forecast of 47%, at 55%. Countries with higher fertility and/or immigration, such as the United States, Canada and Australia, have lower projected increases in the dependency ratio (and lower projected dependency ratios in 2050). It is worth bearing in mind that these projections are based on current data, and future economic and social trends around fertility and life expectancy, as well as policy changes on immigration, could significantly alter how demographics turn out relative to these projections.
Figure 3.2. Old-age dependency ratios (number of individuals aged 65 and over per 100 people of working age) in selected OECD countries in 2023 and 2050
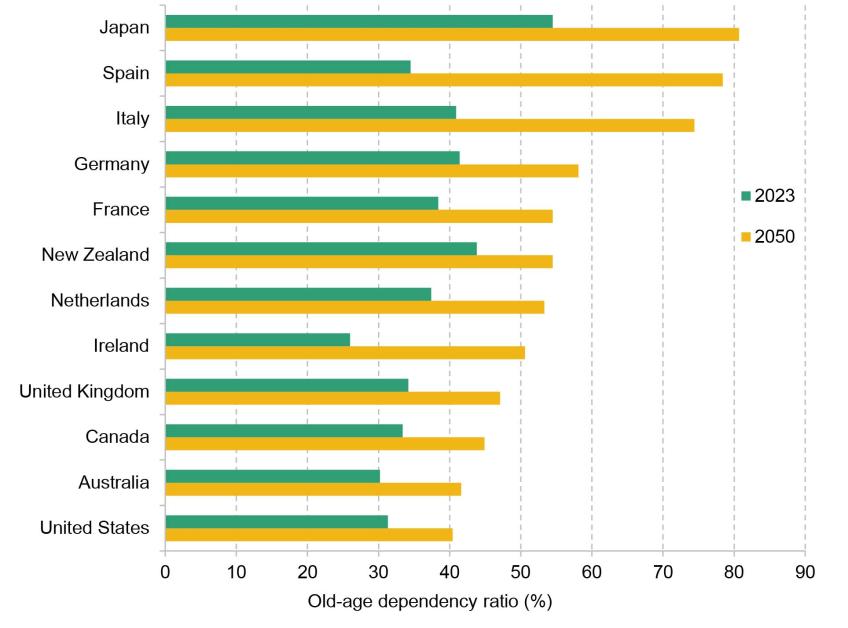
Note: Working age defined as those aged 20–64. Ranked by dependency ratio in 2050.
Source: OECD, 2023.
3.2 Public finance challenges
As shown in Figure 2.2, spending on state pension and other pensioner benefits has risen as a share of national income since the early 1950s. This is despite increases in the SPA and reflects increases in the generosity of the state pension relative to average earnings, the size of different cohorts above SPA, and increasing longevity at older ages for each successive generation.
Demographic change that increases the old-age dependency ratio over time presents a challenge for the public finances. Figure 3.3 shows that public spending on the state pension and other pensioner benefits combined (including winter fuel payment and pension credit, as well as other cash transfers such as attendance allowance, disability living allowance and housing benefit paid to pensioners) is projected to increase from the current 5.9% of national income to 7.6% by 2050–51. This increase of 1.7% of national income is equivalent to £45 billion per year in today’s terms. While demographic change is a key driver of the increase in spending, our calculations show that £24 billion of this increase is due to the triple lock pushing up the value of the state pension over time relative to earnings. On the other hand, the increases of the SPA to 67 and 68 limit the rise in spending in later years of this forecast period.
Figure 3.3. Projected spending on state pension, pensioner benefits, health and social care
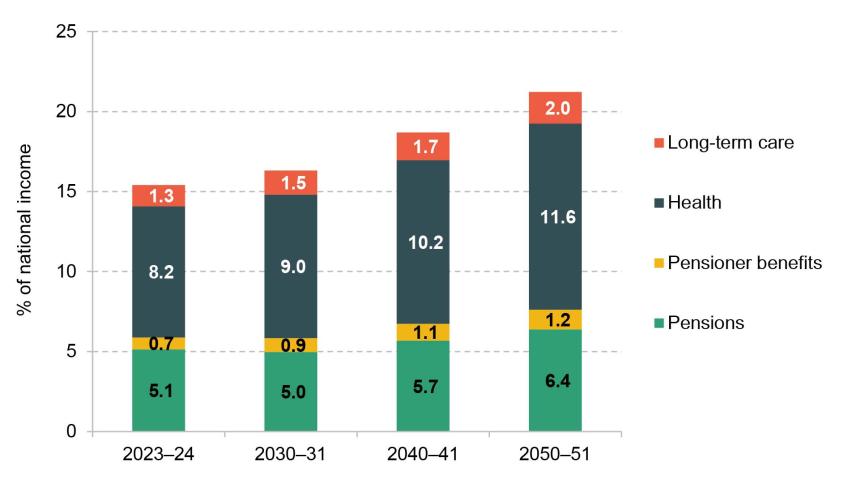
Note: ‘Pensions’ includes winter fuel payment and pension credit. ‘Pensioner benefits’ is all other benefits paid to people above the SPA (such as attendance allowance, disability living allowance and housing benefit).
Source: Office for Budget Responsibility, 2023.
The projected rising number of pensioners – and falling number of working-age individuals – creates a challenge for the state pension system and, given the pay-as-you-go nature of the UK state pension, puts upwards pressure on tax rates. However, it is important to remember that factors such as rising longevity at older ages would put pressure on any type of pension system.
In addition to showing how spending on the state pension and pensioner benefits is projected to rise over time, Figure 3.3 also illustrates that with demographic change the public finance pressures are not just about the state pension. Spending on health and long-term care is forecast to rise even faster than pensioner spending. Spending on health is projected to rise from the current 8.2% of national income to 11.6% by 2050–51, equivalent to £88 billion per year in today’s terms. Spending on social care is projected to rise from the current 1.3% to 2.0% of national income, equivalent to £17 billion per year in today’s terms. This is important context when considering the state pension: one might think that a more generous state pension was more achievable in an environment where other public spending pressures were diminishing. That is not the situation in the UK, as any increases in state pension spending as a share of national income might be expected to be adding to an already growing size of the state.
While these future increases in the UK’s spending on pensions are projected to be large, the fact that the UK pension system relies less on public provision means that the public finance position is projected to be somewhat less challenging than in some other countries. This is on top of the fact, as shown in Figure 3.2, that the demographic challenge is also less severe in the UK than in some other countries when measured by current and projected old-age dependency ratios. (For a more detailed international comparison, see section 4.8 of Emmerson, Mikloš and Stockton (2023).)
Uncertainty around public finance projections
Much of the rise in spending on the state pension is driven by future population projections. While we can be reasonably certain on some aspects of the population projections, such as the fact that the large post-war generations reaching the SPA14 are driving the rise in the share of individuals above the SPA, there is also a great deal of uncertainty around these forecasts.
For example, in 2022, the Office for Budget Responsibility (OBR) revised its 2018 projections for the UK’s future old-age dependency ratio (the population aged 65 and over as a percentage of the population aged 16–64). The ratio was revised down in the short run, and up in the longer run, driven by three changes to the demographic projections: fewer births, slower improvements in life expectancy and lower net inward migration (Office for Budget Responsibility, 2022). Birth rates were revised downward due to a drop in the outturn in number of births, meaning fewer young people in the short and medium run. Recent rises in life expectancy had also slowed down and come in lower than expected, meaning that the ageing of the population is now projected to happen at a slower pace than before. As Cribb, Emmerson, Karjalainen et al. (2023) illustrate, this still means that people born more recently are expected to live longer than their predecessors, but the differences between younger and older generations are now smaller (see Section 5.1 for further detail on recent trends in life expectancy).
In 2022, the OBR also revised down its expectation of future net inward migration from 165,000 to 129,000 a year. In a reflection of the uncertainty around the migration assumptions, in its subsequent report (Office for Budget Responsibility, 2023), the OBR revised the net migration figures up again from 129,000 to 245,000 a year. Swings in migration affect the old-age dependency ratio more in the near term than in the long term, as incoming migrants today will form a part of the old-age population in the future. It is clear that developments such as Brexit and the pandemic have made the task of producing accurate forecasts even harder.
When moving from population forecasts to public spending projections, other factors around pensions policy also matter, especially the extent, and timing, of SPA increases, and the projected cost of the current policy of increasing the value of state pensions by the triple lock each year. The cost of the triple lock relative to indexation in line with average earnings will be higher if economic growth is expected to be lower and the macroeconomic environment more volatile. Judgements around these issues have changed over time and led to big revisions to projected spending even in the absence of large policy reforms.
Figure 3.4 shows selected OBR projections of spending on the state pension as a share of national income. As discussed, these reflect changes to projected mortality, migration and fertility rates, as well as changes to economic forecasts that alter the projected cost – and generosity – of the triple lock. There are also changes in when the OBR assumes the SPA will rise.
Figure 3.4. Selected OBR projections of state pension spending as a share of national income
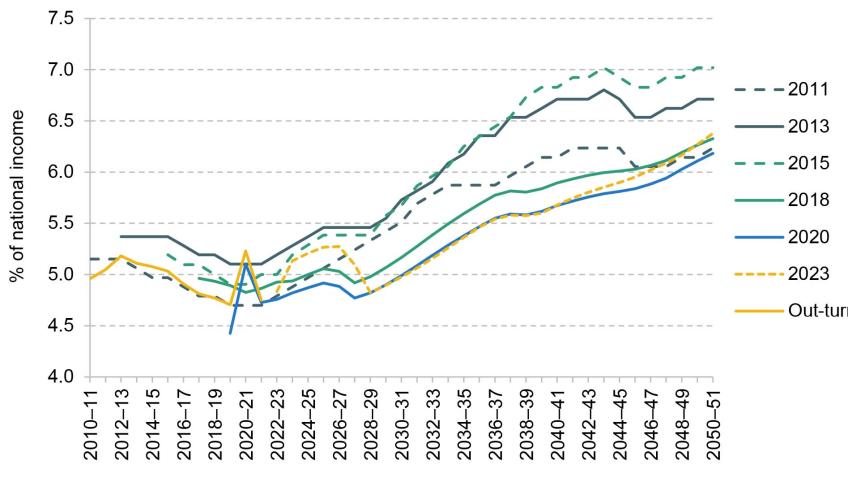
Note: Projections before 2023 have been rescaled based on the ratio of OBR’s GDP estimate for the forecast year in the year of the forecast and in 2023, in order to account for changes in the GDP estimates between years (there was a particularly large revision to GDP figures in 2014 as accounting standards changed as per the European System of Accounts 2010 (ESA10) guidance). The SPA is currently legislated to increase from 66 to 67 between 2026 and 2028, and from 67 to 68 between 2044 and 2046. The 2011 forecast assumes the SPA increase from 66 to 67 takes place between 2034 and 2036, and does not model the new state pension. The 2018, 2020 and 2023 forecasts assume the rise to 68 takes place earlier (2037 to 2039) in line with the Cridland Review (Department for Work and Pensions, 2017a).
Source: OBR’s reports on fiscal risks and long-term projections, various years, https://obr.uk/publications/.
The figure illustrates two key facts. First, projections are often revised significantly, even for short-term projections. For example, spending on the state pension in 2019–20 was forecast in 2013 to be about 0.4% of national income higher than it actually was. The projection for spending in 2040 increased from 6.1% to 6.7% of national income between 2011 and 2013, but by the latest 2023 projection had fallen back to 5.7% of national income. These changes in the short-, medium- and long-term forecasts reflect the complexity in providing accurate spending projections for the future. Nevertheless, it is important that the OBR makes projections with the best evidence available at the time to help guide our understanding of the most likely path for the future. Indeed, despite often sizeable revisions, the fact that spending will be rising significantly over the next five decades or so has not changed. These projections are also useful for assessing the cost of alternative policies – differences in costs tend to be more robust to at least some of the factors that are causing the headline projections to be revised over time.
In summary, while projections of the old-age dependency ratio are often revised, we can be certain of having an increasing number of pensioners relative to the working-age population, and that that will push up spending on state pensions and increase demand for publicly funded health and social care services.
Public views on the sustainability of the state pension system
Results from polling, commissioned for this Pensions Review in the summer of 2023, indicate that working-age people are aware of future public finance challenges, and are pessimistic about the future of the state pension. In particular, one in three working-age people say they do not believe the state pension will exist in 30 years’ time (Barker, Cribb and Emmerson, 2023).
Interestingly, a split by age and sex shows that it is older age groups, and especially older women, who are more pessimistic about the future of the state pension. For example, 30% of the men and 36% of the women say they do not believe the state pension will exist in 30 years, and this difference is statistically significant. 25% out of those aged 25–34 and 39% of those aged 55–64 do not believe in the sustainability of the state pension system (and again this difference is statistically significant). Women aged 45–64 are particularly pessimistic about the future of the state pension, with over 40% thinking it will not exist in 30 years’ time.
Figure 3.5. Share of men and women stating they do not think the state pension will exist in 30 years’ time, by age
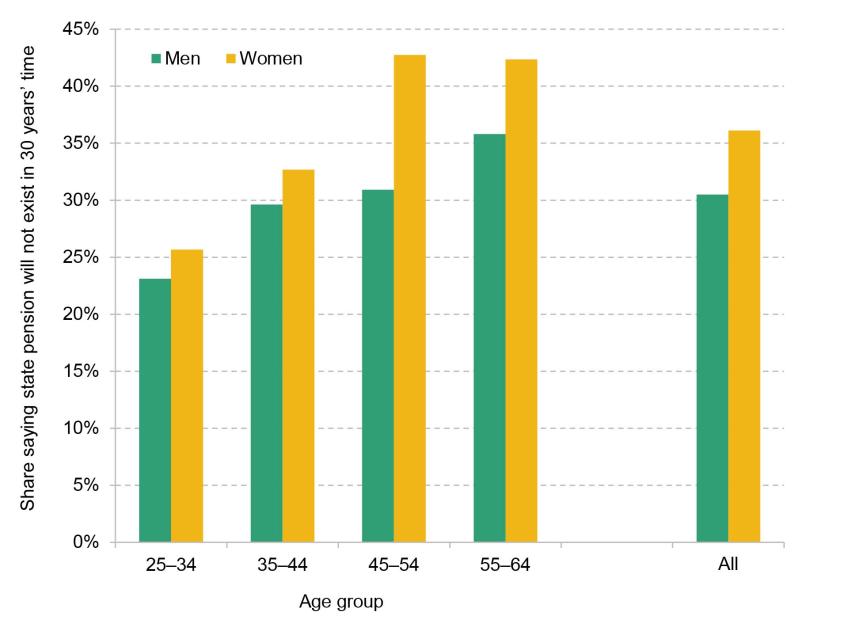
Source: YouGov polling of 3,145 25- to 64-year-olds in June 2023. Analysis undertaken by IFS (authors' calculations).
3.3 Summary
As with most high-income countries, the UK’s demographic change means that the proportion of the population aged over the SPA will rise significantly in coming decades. This is a challenge for the public finances. One way to address this increase in spending would be to increase taxation. Indeed, some move towards higher taxation as a response to the public finance challenge seems likely.
Rather than fully accommodating the public finance challenges, an alternative is for reforms to offset at least part of the rising costs, and thereby limit – at least in part – the need for higher taxes. Indeed, that has been the stated motivation behind the increases in the SPA for men and women from 65 to 66 that occurred between 2018 and 2020, and the legislated future increases to 67 and 68. The following chapters will cover some of the options available to the government and consider what the trade-offs associated with those are.
4. State pension inequalities and eligibility rules
Recent reforms – in particular those legislated in 2007 and 2014, which came into effect from April 2010 and April 2016 respectively – have made the UK state pension simpler and, overall, boosted entitlements. Despite this, some inequalities in state pension income between groups remain. These result from a variety of factors, most notably due to the eligibility rules regarding qualifying years. In this chapter, we discuss current inequalities in the amounts of state pension received by pensioners, and also discuss what may drive inequalities in the future, in particular by assessing which groups may not be eligible for the full amount of the state pension.
4.1 State pension income among current pensioners
Since the state pension is not means tested, it is received by pensioners across the income distribution. Figure 4.1 illustrates this, by showing the composition of disposable income among retired pensioners aged 66–70 by each fifth of the income distribution. Panel A shows mean income from different sources and Panel B shows these as a percentage of total income. As we want to focus on the incomes of those who have already retired, we focus on households where no one is in paid work. Panel A shows that the amount of state pension that households receive is relatively stable across the income distribution. However, there are large differences in total household retirement incomes between income groups: households in the top fifth of households in terms of income have total income that is over three-and-a-half times that of the bottom fifth of households. This means that, as Panel B shows, the state pension is an important source of income especially for those at the bottom of the income distribution: the state pension makes up on average 71% of household incomes for those in the bottom fifth in terms of total income. However, Panel B also shows that the state pension is an important source of income among those with higher levels of income. Even among the highest-income fifth of households, the state pension makes up 23% of total income. This highlights the fact that while the state pension provides a relatively low replacement rate for average or higher earners, it is still an important source of income right across the income distribution. Indeed, if one wanted to buy an index-linked annuity to provide a pension that was equal to the current value of the new state pension (and then price indexed) from the age of 66, then that would require an outlay of over £200,000, or significantly more in the period of low annuity rates between the 2008 financial crisis and 2021. Were a triple-locked annuity available, it would cost substantially more. This is a significant sum even at the top of the income distribution.
Figure 4.1. Sources of disposable income for those aged 66–70 where no one in the household is in paid work, by income, 2021–22
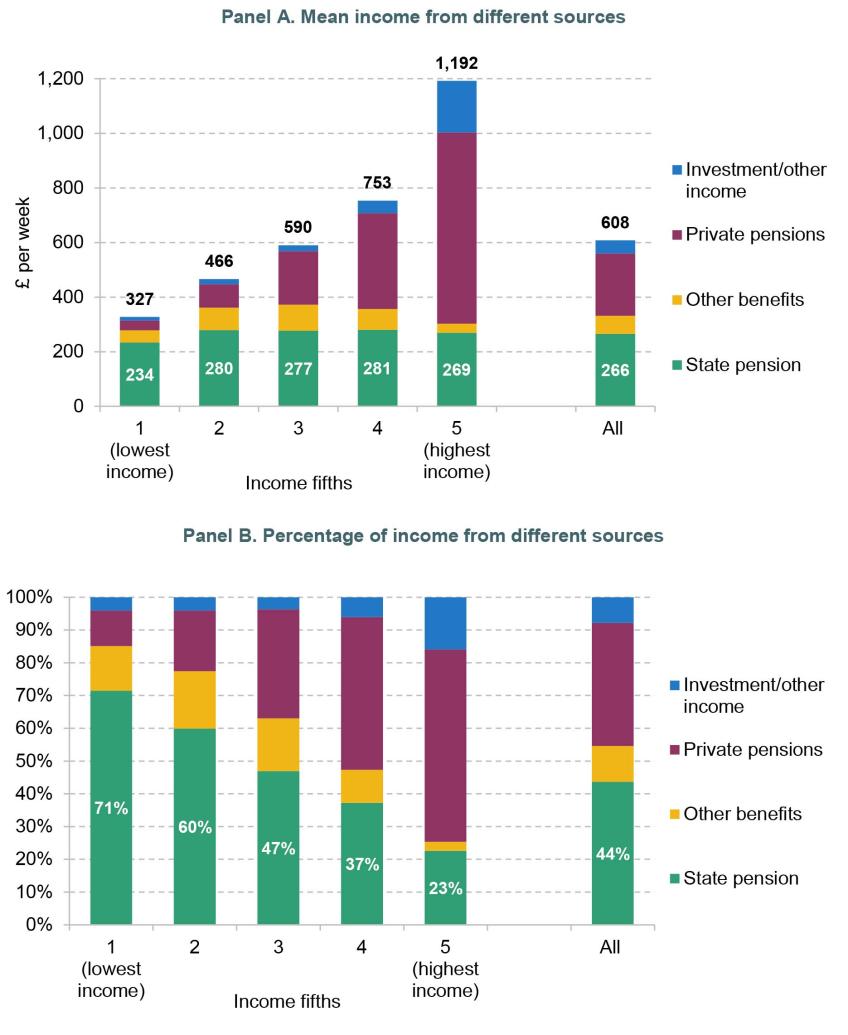
Note: Private pensions and investment income are winsorised at the 99th percentile (conditional on being >0). Mean income within quintile is equivalised to the level for a childless couple. There is no restriction placed on the age of any partner or spouse, only that they are not in paid work. Incomes are net of tax.
Source: Authors’ calculations using the Family Resources Survey, 2021–22.
Based on the quote below from public engagement work commissioned as part of this Pensions Review in the summer of 2023, it is also clear that many pensioners seem to appreciate the state pension as an important part of their overall income in retirement.
‘The State Pension is a large proportion of my income so it is important that it is reliable. Some of my relatives who have recently retired did not realise how much their pension was, and were pleasantly surprised when the information regarding their entitlement came through.’
Male, aged 60–78
We also want to understand to what extent there are differences in the cash amounts of the state pension that people receive. In order to examine inequalities in the state pension system among current pensioners, we can assess the extent to which average incomes differ between different groups in survey data. In order to do this effectively, we want to make sure that we only compare groups of people who faced the same system and rules related to state pension. Two recent key dates for changes in the state pension system were April 2010 and April 2016.
In the 2007 Pensions Act, the then Labour government introduced two important changes to state pension eligibility rules, which came into effect from April 2010. First, there was a reduction to the number of qualifying years that people needed to be able to claim the full amount of the basic state pension, from 44 for men and 39 for women to 30 for all. Second, the way in which years out of the labour market while looking after children were ‘credited’ by the state pension system became simpler and fairer as the credits for years spent caring for children became worth as much as years credited from other activities (see Bozio, Crawford and Tetlow (2010) for more details).
April 2016 saw the introduction of the nSP and a rapid acceleration of the phasing-out of the earnings-related part of the state pension. Because of these changes, in the analysis that follows we split the sample into those who reached the SPA before (April) 2010, those who reached it between April 2010 and March 2016, and those who reached it from April 2016 onwards.15
Figure 4.2 shows differences in average state pension income between men and women, between the white majority and minority ethnic groups, and between those born in the UK and those born abroad. We compare average state pension incomes among individuals over the SPA and aged 65–69. We restrict the sample so that for each interview year and (single year of) age, we have members of both groups we compare. This matters especially for the gender gap, as prior to 2018 the SPA for women was lower than that for men.16
Figure 4.2. The changing gender, ethnicity and immigrant gaps in state pension incomes
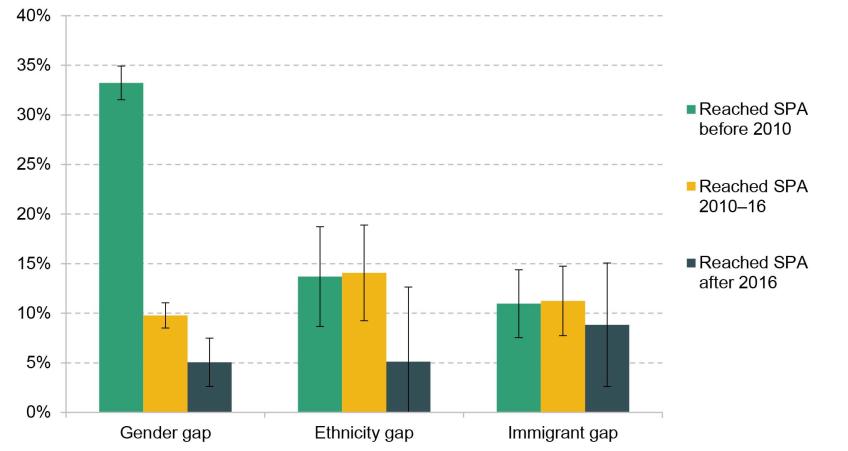
Note: ‘Gender gap’ illustrates how much higher average state pension is among men compared with women. ‘Ethnicity gap’ illustrates how much higher average state pension is among those of white ethnicity compared with those in minority ethnic groups. ‘Immigrant gap’ illustrates how much higher average state pension is among those born in the UK compared with those born elsewhere.
Source: Family Resources Survey, 2009 to 2020.
Figure 4.2 shows that for those who reached the SPA prior to April 2010, men’s state pension income was on average 33% higher than women’s, the white17 majority’s state pension income was on average 14% higher than the average pension income among ethnic minority groups, and state pension income was on average 11% higher among those born in the UK than the average among those born abroad. For those reaching SPA more recently, there have been big reductions in the gender gap in state pension incomes. For those reaching the SPA between 2010 and 2016 the state pension is on average 10% higher for men than for women; and for those reaching SPA after 2016, the difference is 5%, a big reduction on the 33% gap seen prior to 2010 in a very short time. This reflects both more generous treatment of certain formal caring arrangements and the lowering of the required number of years for full BSP entitlement from 2010, the accelerated phasing-out of the earnings-related part of the state pension from 2016, and successive generations of women having higher levels of labour market participation (Cribb and Emmerson, 2022) which boosts their state pension entitlement. Changes in state pension gaps between white people and ethnic minorities and between immigrants and non-immigrants have been smaller; there has been a fall in the ethnicity gap for those reaching SPA before and after 2016, whereas changes to the immigrant gap are not statistically significant.
To examine how these differences in state pension incomes received interact with each other, we regress state pension income on all three characteristics at the same time, also controlling for single year of age and the year of interview. In this analysis, we also split the group of people born abroad into those who say they arrived in the UK before the age of 30 (and who could potentially be eligible for a full state pension) and those who arrived after the age of 30 (for whom a full state pension is not possible as they have not lived in the UK for 35 years prior to SPA).
Table 4.1 shows the results from this analysis. We see a similar pattern again for the gender gap – it gets much smaller over time, falling from £40.30 per week prior to 2010 to £8.90 per week after 2016. On the other hand, the pattern for ethnicity looks different now that we include migration status in the same regression. For those reaching the SPA before 2016, there is an ethnicity gap (of £6.30–£7.30 per week) that cannot be explained by immigration status alone; once we control for migration status, the ethnicity gap for the post-2016 period is no longer statistically significant. In other words, among those born in the UK, there is no longer evidence of a gap in state pension income between those in the white majority and those in other ethnic groups. These changes may well be because the nSP particularly benefited people with long histories of self-employment (who are disproportionately likely to be from ethnic minorities, specifically people from Pakistani and Bangladeshi backgrounds (Office for National Statistics, 2023)) as they do not lose out from the accelerated phasing-out of the earnings-related state pension.
Table 4.1. Results from a regression of state pension income on characteristics, among those aged 65–69

aThis row is the constant from the regression that also includes year and age dummies.
Note: Also controls for single year of age and interview year. Only includes those aged 65–67 for those reaching SPA after 2016, because the oldest women who reached SPA after 2016 turned age 68 and 69 in 2021 and 2022, which is outside our sample period. Pound amounts in 2020–21 prices. * p<0.1, ** p<0.05, *** p<0.01.
Source: Family Resources Survey, 2009 to 2020.
The migration gap rows of the table also show that in the post-2010 systems, the migration gap is driven by those who arrived in the UK after age 30, meaning that they will not have had enough time to build full entitlement to the state pension in the UK (although they may have built entitlements in other countries). Overall, it appears that gender, ethnicity and migration gaps in amounts of state pension received have become smaller over time, but some differences still remain.
4.2 Eligibility to the state pension
As discussed in the previous section, some of the inequalities in the amount of state pension currently received by different groups of people are a result of the pre-2016 state pension systems. In particular, under the earnings-related state pension system, there was a stronger link between labour market differences during working-age life and differences in state pension income.
However, under the flat-rate system, any future differences in the level of the state pension will only be due to differences in the number of qualifying years individuals have built up. This means that in order to understand future inequalities in state pension incomes, we need to understand which groups of people may not get the full number of qualifying years. In fact, inequalities in state pension income between groups is expected to continue to fall further as the earnings-related part of the state pension is rapidly phased out, and DWP modelling suggests that over 80% of those reaching the SPA by the mid 2030s will receive the full nSP amount (Department for Work and Pensions, 2013).
Despite many believing that only people paying National Insurance contributions generate eligibility towards the state pension, this is not true – and has not been since the introduction of the basic state pension in 1946. The state pension is also much more generous in its coverage than in the past, with full recognition for much of the time spent out of the labour market due to childcare and other caring responsibilities, disability and unemployment.
However, despite the apparent simplicity of the flat-rate state pension system, the current set of rules for eligibility remains immensely complicated. Entitlement to the state pension is determined by the number of qualifying years an individual accrues during their working-age life. A qualifying year is a year in which an individual meets certain criteria and so builds entitlement to the state pension.
There are three primary methods through which individuals can acquire qualifying years to build state pension entitlement.18 The first is being in paid work and having earnings above certain thresholds. Currently for employees, this means earning above the lower earnings limit of £6,396 per annum,19 which is not the same point at which any National Insurance contributions are actually paid – that is the primary threshold, which is much higher at £12,570. And for the self-employed, the threshold is at neither of these points – it is those with profits exceeding £6,725 in a year.
The second method is that people can acquire qualifying years through National Insurance credits. These are (or at least are supposed to be20) applied automatically in some cases, in particular for those receiving universal credit, new-style jobseeker’s allowance (JSA) or new-style employment and support allowance (ESA), maternity allowance, carer’s allowance, and child benefit (for children under 12).21 In other cases, people have to apply for National Insurance credits manually to receive them. There is a diverse set of activities that come under this category. It can be the case for those who are unemployed and seeking work but not receiving JSA; those receiving statutory sick pay (SSP) or statutory maternity pay (SMP); carers working more than 20 hours per week (including unpaid work); people on jury duty; those wrongfully imprisoned; partners of HM Forces members; and those attending certain government-approved training courses. In practice, we suspect very few of those who have to claim credits do so, though it is hard to know for certain. A Freedom of Information response from DWP to Royal London22 revealed that while in 2010 the DWP had estimated that 160,000 people would benefit from extending National Insurance credit eligibility to some carers of disabled people,23 just 3,524 people claimed those credits in 2016–17. This suggests that 97% of eligible carers were not claiming the credits. Depending on the type of credit, there are also time limits for how far back the claims can be backdated – for example, in the case of carers, the claims can only be backdated to the previous tax year.
The third and final way in which people can build qualifying years is through making voluntary (Class 3) National Insurance contributions to fill gaps in their record.
These rules together mean that there are certain groups within the population who are more likely to have fewer than the maximum number of qualifying years. These include very low-earning people (who are often self-employed (Codreanu et al., 2020)) who earn below the relevant National Insurance thresholds but do not receive a qualifying benefit such as universal credit or child benefit. They also include people not in paid work without dependent children under the age of 12 who are either not eligible for, or do not claim, one of the state benefits that confer entitlement to National Insurance credits. Another group who are more likely to have incomplete qualifying years are people who live overseas for significant parts of their adult life. Most full-time students will not receive qualifying years, unless they have earnings above the thresholds or they receive National Insurance credits through one of the ways described above. Prisoners also do not build up qualifying years.
While it can be reasonably argued that not all activities should contribute towards state pension eligibility, there are certain peculiarities in the eligibility rules that can lead to disparities between similar groups of people. In particular, many of the National Insurance credits are based on receiving means-tested benefits, so two people with the same (low) level of earnings may differ in whether they receive a qualifying year based on the income or assets of a spouse, or on whether they take up that benefit (irrespective of eligibility).
Some of the activities that qualify for credits also require individuals to apply for them manually, leading to incomplete take-up and discrepancies in state pension eligibility between more and less knowledgeable individuals. The same also applies to voluntary contributions – they can make a huge difference to people’s financial situation in retirement for those with incomplete National Insurance records, but only those with sufficient awareness and knowledge of the system – and, of course, access to the funds to make such contributions – will make these additional contributions. In fact, making these voluntary contributions is a very attractive ‘investment’ – for example, the cost of getting a qualifying year for the current tax year of 2023–24 is £907.40, and this increases the value of the state pension by £302.64 per year in this year’s terms for someone who would not otherwise have 35 qualifying years (and by more in cash terms in the future, given that the state pension increases in line with the triple lock).24 Thus the cash cost of the additional contributions would be made up for in higher pension payments within four years after reaching the SPA. Of course, there are instances when making these voluntary contributions to get towards the full 35 qualifying years may not be the right financial decision – for example, for individuals who will claim pension credit or those with a very short life expectancy. But this system also, rather oddly, allows wealthy UK citizens living abroad to generate a National Insurance record at a relatively low cost, which then entitles them to the UK state pension after they reach the SPA.
In order to assess how common it is not to get a qualifying year in any given year among people aged 16 to SPA, we use household survey data to examine how many people get a qualifying year due to having sufficient earnings, how many may qualify through crediting, and how many do not get a qualifying year. Table 4.2 presents the results from that analysis. It shows that in 2019–20, about 15% of people aged 16 to SPA did not acquire a qualifying year, and this is higher for women (17%) than for men (13%).
Table 4.2. Percentage of working-age people acquiring a qualifying year, 2019–20
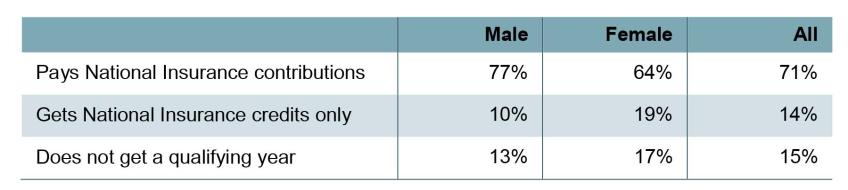
Source: Authors’ calculations using the Family Resources Survey 2019–20. Includes people aged 16 to SPA.
While 15% of the sample are not receiving a qualifying year, this does not mean that 15% of people would not eventually qualify for full new state pension. The number of qualifying years required for a full new state pension is 35, which means that between age 21 (by which point most people will have started their career) and the current SPA of 66, people can spend up to 10 years not receiving qualifying years and still accrue the maximum state pension entitlement.
It is worth noting that results from survey data will not perfectly capture National Insurance contributions and crediting. In particular, it is well known that survey data tend to under-report the receipt of means-tested benefits, which would underestimate the number of people receiving credits (Corlett, 2020). On the other hand, in this analysis, we allocate credits to groups who in reality would have to apply for them manually, such as those who are unemployed but not receiving means-tested benefits, whereas not all of that group will successfully apply for credits. Overall, our figures are generally consistent with what has been reported by the DWP.25
In order to gain a better understanding of which groups of people may be at higher risk of reaching SPA without entitlement to a full new state pension, we can also see how the prevalence of not acquiring qualifying years differs between different groups. We find that 25% of all working-age people not receiving a qualifying year in 2019–20 were full-time students (compared with 1% of those receiving a qualifying year, as shown in Table A.1 in the appendix).
Figure 4.3 shows the percentage of different groups not receiving a qualifying year in 2019–20, excluding full-time students from the analysis. It shows some interesting patterns. Not receiving a qualifying year was more common among women, and especially women of ethnic minority groups, which reflects differences in employment rates of ethnic minority women, especially after having children. For example, our calculations based on the Labour Force Survey show that only 20–30% of women from Pakistani or Bangladeshi backgrounds are in paid work in their early 50s (aged 50–54), compared with 75–80% of white women of that age group.
Figure 4.3. Percentage of different groups not acquiring a qualifying year (excluding people in full-time education), 2019–20
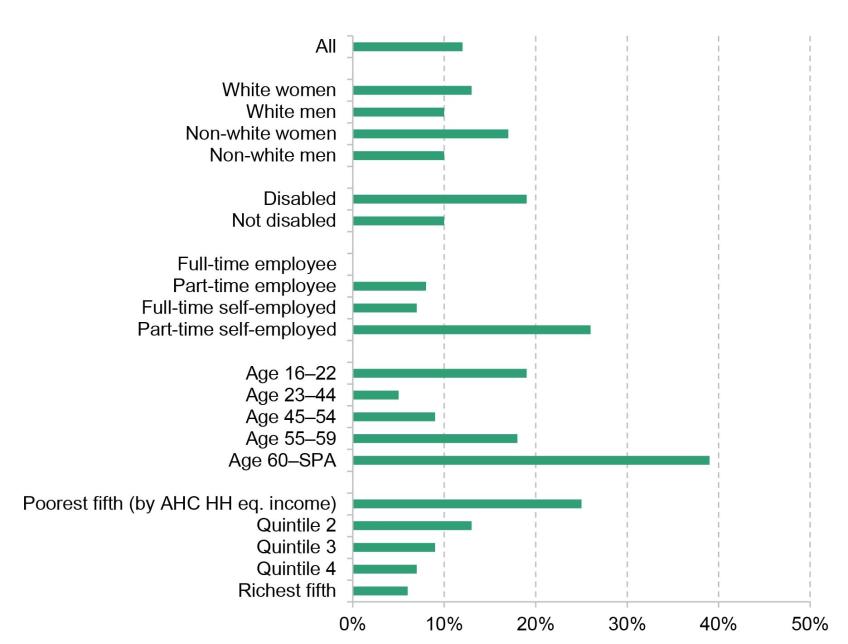
Note: ‘AHC HH eq. income’ is after-housing-costs household income equivalised using the OECD modified equivalence scale.
Source: Authors’ calculations using the Family Resources Survey 2019–20. Includes people aged 16 to SPA.
Similarly, those who are disabled were more likely not to receive a qualifying year, as were those aged 60–SPA. In many cases, this will reflect not being in paid work due to either early retirement or ill health. Being in employment did not lead to a qualifying year for everyone. Around 8% of part-time employees in our sample did not get a qualifying year, and these figures are even higher for the self-employed – 7% of full-time self-employed and 26% of part-time self-employed (making 11% of the self-employed overall) did not acquire a qualifying year.
4.3 Towards a more universal state pension
The extended crediting of activities, along with women’s increased labour market activity and the fact that fewer qualifying years are required to receive the full nSP than for those who reached the SPA before April 2010, means that the UK state pension system is moving towards a more universal pension. Most working-age people build up entitlements towards the state pension each year, even if they are not in work. The fact that 35 years is well below a full working life even for someone not entering the labour force until their early 20s means that a few years missing out on a qualifying year need not make a difference to the eventual state pension entitlement. As noted earlier, DWP expects 80% of people reaching SPA in the mid 2030s to have a full new state pension, and the majority of those without a full state pension would be missing only a few years. However, this is achieved through a complicated set of rules which rely in some cases on people applying for National Insurance credits and which can treat similar people in quite different ways.
There is a case for simplifying the eligibility rules and moving further towards a universal pension where essentially all people build entitlement to a state pension each year of working life they live in the UK (up to a cap). This would be a more transparent and simpler – and arguably fairer – system. It would be similar to how Denmark operates its basic public pension schemes (OECD, 2019). To the extent that such a reform would have a cost to the exchequer, the number of years required for a full state pension could rise slightly from 35 to make the reform cost neutral. Or indeed, going further, one could take the view that a person should receive a proportion of the state pension equal to the proportion of their adult life that they have lived in the UK. All this would simplify the system, could lead to some efficiency savings and would certainly reduce the risk of some people inadvertently falling through the net.
However, we understand that measuring who is resident in the country in each year would likely be a significant administrative challenge. This would have to be overcome or, similar to the settled status process for European Union citizens, such a system would have to rely on a mixture of government administrative records on UK residents and the ability to show DWP that you were in the country for periods when the government has no record.
4.4 Summary
While inequalities in state pension incomes have decreased over time, some differences remain. In the future, differences in amounts received will only reflect differences in number of qualifying years that people have acquired during working life, meaning that these differences will narrow even further. For today’s working-age population in practice, the UK state pension system is not far from a universal state pension (in which people essentially generate eligibility towards the state pension by being in the UK). There are good arguments for simplifying the current crediting rules and moving wholesale to a system where every year of adult life in the UK builds entitlements. However, moving to such a system may be administratively too big a burden at the moment with relatively small gains for most.
5. Increasing the state pension age
The state pension age, which determines when individuals can start claiming the state pension, has large implications for individuals’ outcomes as well as the public finances. Most notably, there have been significant increases in the SPA in recent decades, with reforms legislated and/or implemented by Conservative, Labour, coalition and again Conservative governments.
We start this chapter by discussing the institutional setting and history of increases to the SPA. We then discuss the effect that previous increases have had on individuals and their families, including on employment rates and incomes. A more detailed discussion of employment around the SPA can be found in Cribb (2023).
5.1 Previous SPA increases
Institutional background
When the state pension was first introduced in 1909, the SPA was set at 70, and was then reduced to 65 in 1928. From 1940, the SPA was set at 65 for men and 60 for women. This was left unreformed – despite big increases in longevity at older ages – until legislation passed in 1995 which was to increase the female SPA from 60 to 65 over the decade from 2010 to 2020. The Pensions Act of 2007 announced further increases to the SPA for both men and women (to 66, 67 and 68). Subsequently, the coalition government sped up the increase in the female SPA to 65 and brought forward the increases to 66 and 67. Altogether, this means that the SPA is now 66 for both men and women and it is set to rise to 67 between 2026 and 2028, and to 68 between 2044 and 2046.26
The equalisation of women’s SPA with men’s followed from pressure that was building up through the 1970s and 1980s especially due to European law moving towards sex equality. For example, a number of directives were introduced to enforce the principle of equal treatment for men and women (although initially with exemptions for certain areas such as state pension ages), and the European Court of Justice ruled in 1986 and 1990 that men and women must have the same retirement age within occupational pension schemes (Cracknell and Strickland, 1995). These changes in European law, alongside demographic pressures and international comparisons, led to the decision in 1993 for the government to equalise women’s SPA with men’s (Thurley, Mackley and McInnes, 2021). Universal increases in the SPA (i.e. covering both men and women) were recommended by the Pensions Commission in order to improve the financial sustainability of the state pension system in response to rising longevity since the then state pension ages were first set in 1940.
Figure 5.1 shows how the relationship between life expectancy (at age 50) and the SPA has changed over time. In particular, it shows the difference between the SPA and life expectancy at age 50, based on the latest projections of life expectancy from the Office for National Statistics (ONS).27 The graph shows that men born in 1910, who reached the SPA at 65 in 1975, were expected at age 50 to live to 74, meaning that they would on average spend 9 years receiving the state pension. This changed dramatically over the following decades: men born in 1950, who reached their SPA at 65 in 2015, could on average expect to spend 17 years in receipt of a state pension, i.e. 91% longer than a man born 40 years earlier. With longevity still rising for later cohorts and even with the legislated SPA increases, men born in the 1980s are expected to spend on average 18 years in receipt of a state pension.
Figure 5.1. Difference between life expectancy and SPA over time
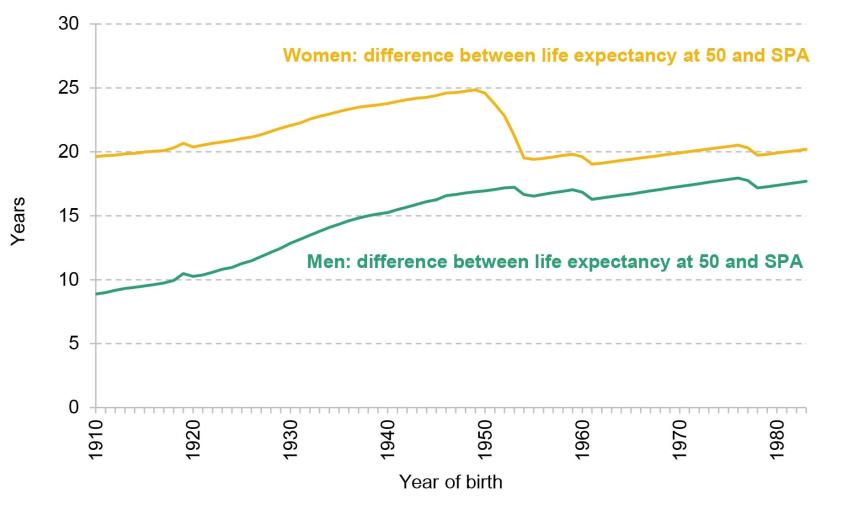
Note: Cohort life expectancy at age 50. Cohort life expectancy projections incorporate future assumed improvements in age-specific mortality. SPA assumed to rise as set in legislation, to 67 by 2028 and to 68 by 2046.
Source: ONS past and projected expectations of life, principal projection 2020.
The picture looks different for women as a result of the equalisation of men’s and women’s SPAs during the 2010s. However, even with this dramatic change, women born in the 1980s are expected to spend on average over 20 years above the SPA.
The rapid increases in the SPA in the 2010s especially for women led to campaigns against such increases, as many women born in the 1950s argued they had not been notified about the dramatic changes to the SPA in a timely way, and that equalisation of the SPA with men was unfair in the context of the particularly gendered nature of the labour market that existed for much of their working life (e.g. Thurley, Mackley and McInnes, 2021). Perhaps to help ensure these concerns would not re-emerge with future increases in the SPA, the coalition government also legislated for periodic reviews of the SPA to take place within six years from the previous report. The first one was the Cridland Review in 2017 (Department for Work and Pensions, 2017a), which recommended that the increase in the SPA that was legislated to occur between 2044 and 2046 should be brought forwards so that it was implemented between 2037 and 2039. At the time, this was accepted by the government (Department for Work and Pensions, 2017b), but there have been no changes to legislation.
The Cridland Report confirmed the government’s 2013 White Paper commitment (Department for Work and Pensions, 2013) to give at least 10 years’ notice of any increases to the SPA. Another key recommendation from the Cridland Report was that the SPA should not increase more than one year in any 10-year period, assuming that there are no exceptional changes to the data. This was deemed to be in line with the rate of longevity increase and with the principle that the coalition government had announced, that people should spend on average up to a third of their adult life above the SPA (Department for Work and Pensions, 2017a).
In general, the Cridland recommendations, as well as legislated increases to the SPA by both Labour and coalition governments, illustrate broad consensus about raising the SPA being a coherent response to increases in longevity at older ages – although the exact link between longevity and the SPA has not been agreed or automated. This broad consensus exists with the acknowledgement that improving financial sustainability may adversely impact pension adequacy for some (Pensions Policy Institute, 2022).
The second review of the SPA, with the independent reviewer Baroness Neville-Rolfe (Department for Work and Pensions, 2023a), concluded that the proportion of adult life spent above the SPA as a metric to inform further increases to the SPA was still fit for purpose, and that the proportion should be set at 31% of adult life. This was shown to be consistent with the proportion of time those reaching SPA between 1996 and 2020 were on average expected to spend above age 65 (which was the male SPA at the time). Following the publication of this review, the government declined to bring forward the SPA rise to 68 from its current legislated timetable of 2044 to 2046. It said that due to uncertainty about future projections especially related to life expectancy, it would wait for the next review – expected by early 2027 at the latest28 – before changing SPA legislation (Department for Work and Pensions, 2023b). But if the commitment to giving at least 10 years’ notice of any increase is to be kept to, such legislation would need to be passed before 2027 if the SPA is to be increased in line with the recommendation in the Cridland Review.
Recent trends in life expectancy
The legislated universal increases (i.e. those affecting both men and women) to the SPA were to a large extent introduced in response to decades of steady improvement in average life expectancy. However, from 2011, increases in UK life expectancy started slowing (Marmot et al., 2020). While it is still true that younger generations can expect to live longer than the generations before them, the increase in life expectancy between generations is now projected to be smaller than was previously thought.
Figure 5.2 (which uses ONS life tables) illustrates this for male and female life expectancy. It shows cohort life expectancy at age 50 (meaning that the projections are unaffected by any changes in mortality at younger ages), based on projections for 2020 (the latest projections), 2016 and 2006. The first thing to note is that the lines on these graphs are upward sloping – meaning that people born more recently are expected to live longer than those born before them. Based on the latest projections, a man born in 1940 who made it to age 50 had a life expectancy of 80, whereas a man born in 1970 (who recently made it to 50) has a life expectancy of 84. A woman born in 1940 had a life expectancy at 50 of 84, compared with 87 for a woman born in 1970. Rising life expectancy from one generation to the next is one driver of the ageing population.
Figure 5.2. Cohort life expectancy at age 50, based on 2006, 2016 and 2020 life tables
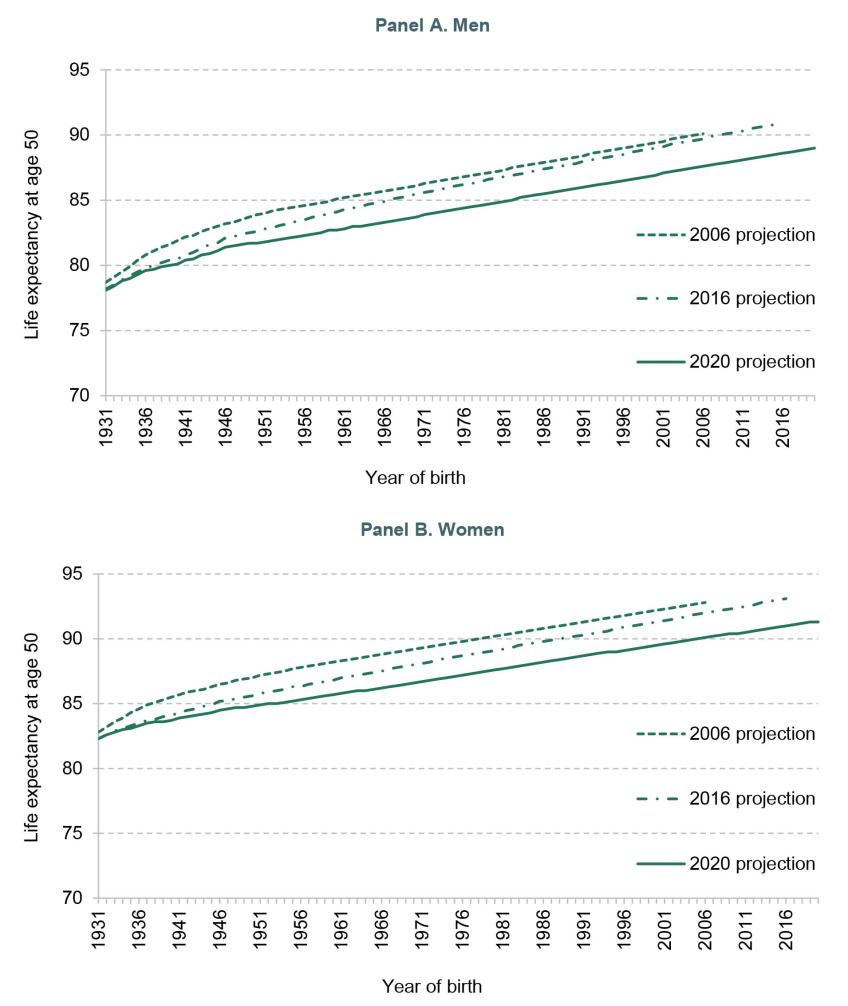
Note: Cohort life expectancy at age 50. Cohort life expectancy projections incorporate future assumed improvements in age-specific mortality.
Source: Figures 1 and 2 of Cribb, Emmerson, Karjalainen et al. (2023b).
However, life expectancy improvements have not turned out to be as big as was expected. This can be seen by the fact that life expectancy for a person born in a particular year has fallen when comparing one set of life expectancy projections and the next. For example, a man born in 1970 who made it to 50 would, under the 2006 projections, have a life expectancy of 86.1. Under the 2016 projections, this had fallen slightly to 85.5. But under the latest (2020) projections, it had fallen to 83.7 years. The 2020 projections cover the period up to 30 June 2020 so they include some of the impacts of the COVID-19 pandemic on mortality, although the long-term impacts of the pandemic on life expectancy are still somewhat unclear as the higher-than-usual mortality rates in 2020 and 2021 have been followed by lower rates since then.
Life expectancy is a measure of mortality, but it is also interesting to consider changes to healthy life expectancy, which is a measure of the number of years people live in good general health. Indeed, while healthy life expectancy has also been increasing over time, it has not risen by as much as life expectancy, meaning that on average people now spend more years in poor health (Marmot et al., 2020). In other words, while some of the increase in longevity represents additional years of healthy life, part of it reflects additional years in poor health. For example, based on estimates from 2018–20, the difference between life expectancy and healthy life expectancy at ages 50–54 for men in England was 11 years, meaning that they could expect to spend 36% of their remaining 31 years of life expectancy in ‘not good’ health (Office for National Statistics, 2022c).
Figure 5.2 only shows average life expectancy. Some people will die much younger than this, while others will live much longer, due to many factors such as early childhood health, luck, health behaviours, and access to and use of healthcare. People living in more affluent areas tend to live significantly longer than people living in deprived areas; for example, in 2018–20, men in the least deprived tenth of local areas in England could expect to live almost a decade longer than men in the most deprived tenth of local areas in England (Office for National Statistics, 2022b). There are also clear differences in average life expectancy at birth between the constituent countries of the United Kingdom; according to the latest estimates, life expectancy at birth for males is 79.4 years in England, 78.7 years in Northern Ireland, 78.3 years in Wales and 76.8 years in Scotland (Office for National Statistics, 2022c). The analysis in Section 6.2 will further illustrate differences in life expectancy by wealth group.
It is also notable that while the COVID-19 pandemic led to a fall in life expectancy among all groups, the falls in life expectancy were even larger among some of the groups that already had a lower life expectancy. This means that the pandemic further exacerbated existing inequalities in life expectancy between groups. For example, between 2019 and 2021, life expectancy fell by 1.8 years for men in the most deprived areas, compared with 0.7 years for men in the least deprived areas (Raleigh, 2022). This has led to a further widening of gaps in life expectancy between areas.
Public opinion on the SPA
The SPA is a salient feature of the state pension system. Polling conducted as part of this Pensions Review in the summer of 2023 showed that 78% of working-age people correctly answered that the SPA will be higher than the current 6629 (Barker, Cribb and Emmerson, 2023). Previous research has also shown that knowledge of the SPA among working-age individuals has improved over time (Crawford and Karjalainen, 2020).
From this evidence, it seems that there is widespread knowledge of the past and future increases to the SPA. Some of this may be due to the long-running campaigns against increases in women’s SPA (WASPI women; for more information, see Thurley, Mackley and McInnes (2021) for example), or simply the fact that many people will know people – such as a parent, partner, older sibling or friend – who have reached their SPA which was not 60 or 65 (for women or men respectively). While increased awareness of the state pension system is welcome, it is also clear that the way in which some of these reforms took place is likely to have resulted in negative perceptions of the government, and potentially the future of the state pension, by the public. From public engagement work conducted in the summer of 2023 as part of this Pensions Review, it appears from the quote below, and other similar ones, that the reforms have increased distrust towards the government and any promises it may make regarding the SPA. This illustrates the importance of communicating changes transparently, clearly, and early enough.
‘[The government] put [the state pension age] up anyway, didn’t they? I don’t remember them discussing it. They put it up anyway, so they’ll put it up again when it suits them. They’ll just explain that they can’t afford it anymore. And they’ll use some sort of figure that they’ve dreamt up to justify it.’
Male, age 60–78
5.2 The impact of increases in the SPA on individuals
Given the prominent increases in the SPA in recent years and the legislated plans for further increases, it is important to understand how increasing the SPA affects individuals’ circumstances such as their employment and incomes, alongside considering the public finance impacts from such a policy. Our understanding of these effects is aided by a broad set of research which relies on the fact that increases to the SPA have been gradually applied since 2010 for women and since 2018 for men, allowing researchers to estimate the causal impacts of the increase to the SPA on various outcomes.
Table 5.1 summarises the results from seven studies on the increase of the UK SPA, showing impacts on employment, income, income poverty, and a range of measures of health and life satisfaction. First, increasing the SPA has been found to boost employment, pushing up the employment rate of affected people in their early to mid 60s by between 7 and 9 percentage points. This finding is consistent with a wide range of evidence from other countries, including Austria, Australia, France, Germany and the Netherlands.30
Table 5.1. Effect of increasing the SPA on employment, income, health and life satisfaction in the UK
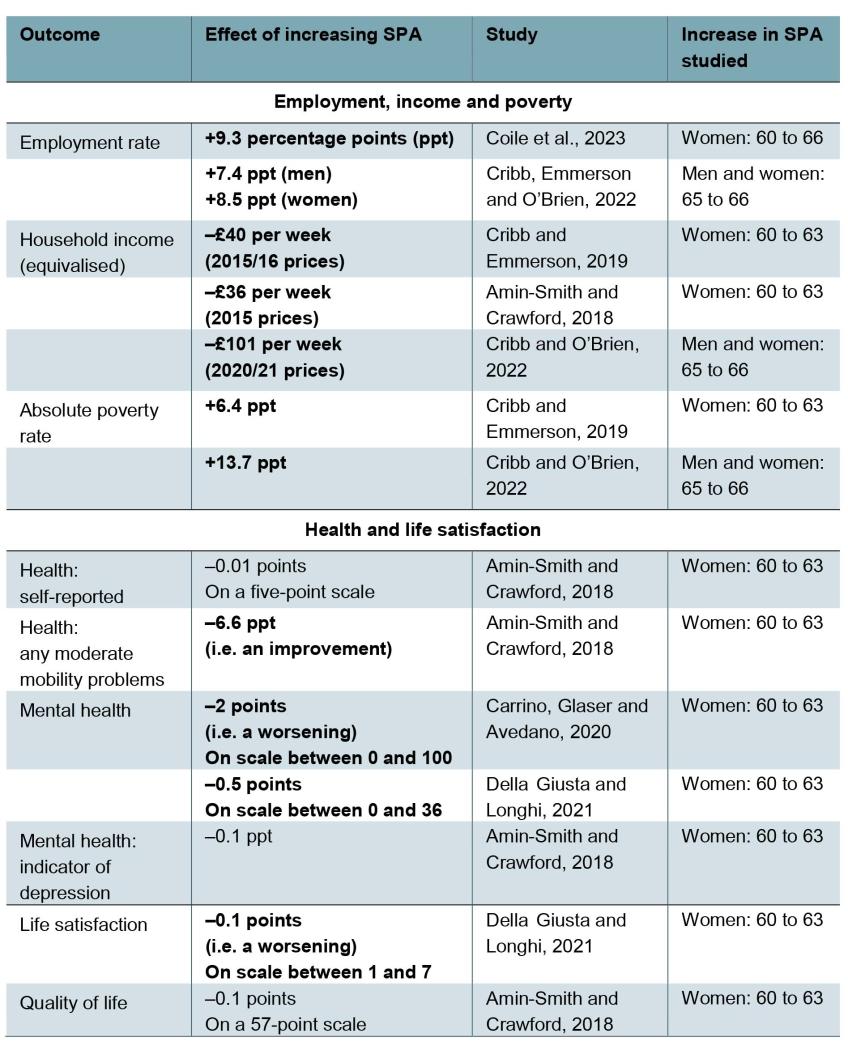
Note: Emboldened results in the second column represent effects that are statistically significantly different from zero. All results are for the full sample. The effects are average effects for people between what the SPA was (generally 60, but 65 for results in Cribb, Emmerson and O’Brien (2022) and Cribb and O’Brien (2022)) and the increased SPA. Household incomes are equivalised using the OECD modified equivalence scale and presented as the equivalent for a couple without dependent children.
It is also important to understand the distributional impacts of SPA increases – for example, whether rich or poor people are more likely to delay retirement as a result of a higher SPA. A key determinant of whether people are more likely to be in work as a result of a higher SPA is whether they were employed prior to the reform. Amin-Smith and Crawford (2018) find all of the increase in employment rates comes from people staying in their jobs for longer; that is to say, none of the effect comes from people who were out of work returning to the labour market when their SPA is increased. This is consistent with findings for similar reforms in other countries – for example, Austria (Staubli and Zweimüller, 2013).
Coile et al. (2023) find that in the UK people with the lowest levels of wealth (who were in paid work before reaching the age when they were affected by the reform, in this case age 60) were the most likely to stay longer in paid work as a result of a higher SPA, because they needed the income from employment to finance their spending. But the authors also conclude that behavioural factors, such as social norms and the SPA providing a signal about the right point to retire, are important in encouraging some (albeit a smaller share of) wealthier people to retire later when the SPA rises. These social norms have been found to be important in similar contexts, including in Finland (Gruber, Kanninen and Ravaska, 2022) and in the United States, where people are disproportionately likely to retire at the statutory pension claiming ages (Lumsdaine, Stock and Wise, 1996; Behaghel and Blau, 2012).
Although the increases to employment rates as a result of a higher SPA boost incomes from work on average, overall the reductions in state pension income lead to lower incomes among those affected. The precise effects depend on the period studied. As shown in Table 5.1, two separate studies found the increase in the SPA for women from 60 to 63 reduced household income on average by around £40 per week (in 2015 prices), which had the commensurate effect of pushing up rates of income poverty (+6.4 percentage points). The increase in the SPA for men and women from 65 to 66 led to a bigger reduction in household incomes, of around £100 per week on average (in 2020 prices), pushing up income poverty rates by around 14 percentage points.
Cribb and O’Brien (2022) identify two key factors for these larger impacts on income from the later reforms. First was the increased divergence between the generosity of the working-age and pensioner benefit systems. This arose due to the nSP and the triple lock pushing up average receipt of state pension while most working-age benefits were frozen in cash terms. The second factor was that people in their mid 60s have less employment income on average than those in their early 60s, so they are more reliant on state benefits including the state pension. Of course, the fact that incomes are falling due to lower public spending on the state pension (and tax revenues are boosted by higher employment income) means that the corollary of these changes is a gain to the exchequer. Cribb and O’Brien (2022) estimate the one-year increase in the SPA for men and women from 65 to 66 boosted the exchequer by around £5 billion per year by the end of 2020.
The potential effects of increasing the SPA are not limited to effects on employment and incomes. Table 5.1 also considers evidence on the effects on measures of health and life satisfaction. The picture here is mixed, with no effects, positive effects and negative effects estimated on different measures in different studies. Amin-Smith and Crawford (2018) examine a range of health measures, most of which show no impacts, including self-reported health. They observe improvements in mobility (corroborated by improved measures of walking speed documented in Banks et al. (2019) who attribute these effects as coming from people who stay in physically demanding employment; they also find evidence of improved cognitive functioning arising from single individuals who stay in work, perhaps suggesting that the social interactions provided by work are important for some individuals who live alone). In contrast, two studies (Carrino, Glaser and Avedano, 2020; Della Giusta and Longhi, 2021) find deterioration in mental health, though that is not found by Amin-Smith and Crawford (2018). There is mixed evidence regarding the impact of the increase in the SPA on quality of life and life satisfaction.
Overall, it seems there may be some health benefits from staying in work as a result of the higher SPA, but there could be reductions in mental health. The mental health effects may have been in part driven by the limited amount of notice that was given to women whose SPA was increased from 2010 onwards, and who might therefore have been particularly aggrieved when they discovered that their SPA was not 60; this makes it harder to know whether similar effects would be found in the future.
In addition to the impact that raising the SPA will have on individuals, it will also affect the public finances. Cribb and O’Brien (2022) calculate these effects for the increase in the SPA from 65 to 66. First, the most obvious direct effect of increasing the SPA on public finances is the fact that the government no longer has to pay the state pension to those aged 65, saving around £5.1 billion per year (in 2020–21 prices). Additional direct impacts on the public finances come from an increase in employee National Insurance contributions – as these are levied on employees and the self-employed – and also an increase in spending on working-age benefits as some 65-year-olds will become eligible for these. In addition, as set out above, increasing the SPA increases employment rates which will also boost tax revenues. Altogether, Cribb and O’Brien (2022) estimate that the increase in the SPA from 65 to 66 benefited the exchequer by approximately £4.9 billion per year (equivalent to about ¼% of GDP or 5% of government spending on state pensions).
Allowing early access to the state pension?
While increasing the SPA encourages significant numbers of people to work for longer and delay retirement, at a significant gain to the public finances, there are understandable concerns about the negative effects these reforms have on household incomes, particularly poorer people’s incomes and standard of living more generally. In addition, as shown in Figure 2.6, the UK only has one focal claiming age (the SPA) whereas some other countries also have an earlier claiming age at which people can claim actuarially reduced pension benefits. These facts combined have led to a discussion of the potential for early access to the state pension at an age below the SPA (e.g. the Cridland Review – Department for Work and Pensions, 2017a).
A key rationale here is that significant numbers of people face health problems or work-limiting disability in the years running up to the SPA and are unable to work. As the SPA has risen (and will continue to rise), more people who are unable to work face the (less generous) working-age benefit system, and may face it for longer periods. This is particularly important as the gulf between the generosity of the means-tested welfare system before and after the SPA has been widening over time. Figure 5.3 shows the difference between the basic amount of means-tested state support for a single person out of work with no other income or assets (and with no disability benefits) before and after the SPA. Before the SPA, an individual would be eligible for jobseeker’s allowance (JSA); after the SPA, they would be eligible for pension credit.31 The gap between the level of state support before and after the SPA has grown from pension credit being 40% higher than JSA in 1997, to 103% higher in 2010 and 137% higher by 2022, making it increasingly important to poorer people’s incomes whether they are over or under the SPA.
Figure 5.3. Pension credit and jobseeker’s allowance (2022 prices)
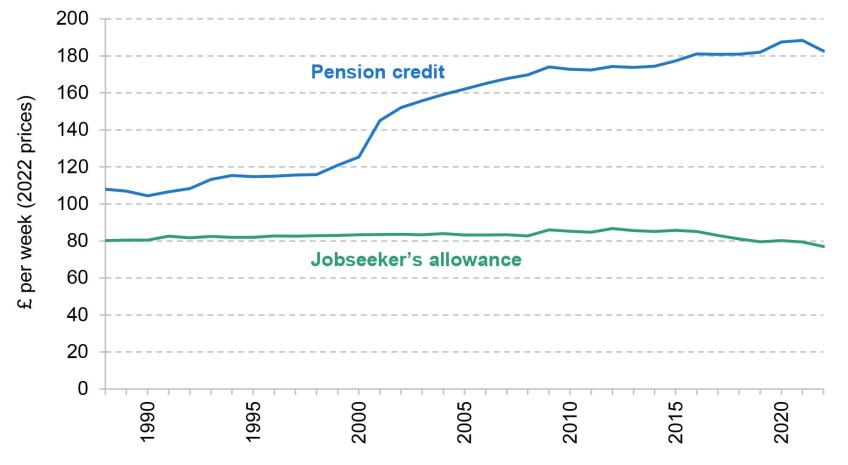
Note: Real levels in April of each year are shown. Entitlements shown are for single adults. Note that other forms of support are available to low-income people who are out of work above and below the SPA, such as housing benefit.
Source: DWP’s Abstract of Statistics.
Allowing some people to claim an actuarily reduced state pension from an earlier age, as is done in some countries, is one option that can blunt the sharp distinction between the level of state support before and after the SPA and lessen the financial consequences of poor health in the run-up to the SPA.
However, there are a number of issues with this potential approach. Allowing early access would mean that people approaching the SPA would have to make a complex financial decision with long-lasting consequences. In particular, while early claiming may provide support to people in the years leading up to the SPA, locking in a lower rate of income may lead to financial issues later on, potentially leading people to fall back onto eligibility for means-tested benefits (which generally have take-up rates that are far from complete) at older ages. The new flat-rate state pension has reduced inequalities in state pension incomes between groups, and allowing early claims could lead to these inequalities increasing again. It may also not be credible for a government not to pay a full new state pension to someone on a low income in their 80s and 90s, 15 or more years after they decided to draw their state pension before reaching the SPA.
Therefore, on balance, we do not recommend government adopting a policy to allow early access to the state pension for an actuarially reduced rate. The case for doing so would, however, be greater the higher the value of the nSP relative to average earnings. Early access is more common in countries where public pensions form the vast majority of pension wealth, meaning that people have access to very limited amounts of private pension wealth. This often results in higher state pensions, which means that people can take an actuarial reduction with less risk of experiencing a very low income much later in life. Were the UK to move to a much more generous nSP then allowing early access to the state pension at a reduced rate would be less likely to risk individuals subsequently being in income poverty, or having increased reliance on means-tested benefits, at older ages. But, absent a big increase in the value of the nSP relative to average earnings, we do not recommend allowing early access. This is a similar conclusion to that reached by the Cridland Report (Department for Work and Pensions, 2017a). Instead, we think that, if the government feels it is appropriate to provide additional support for people who struggle to work before the SPA, this should be done via the working-age benefit system rather than by allowing early claiming of the state pension. We will consider these issues, and the case for additional support to be provided through the working-age benefit system in the run-up to the SPA, in a future report.
5.3 Summary
The state pension age has risen from 60 (in 2010) to 66 for women and from 65 (in 2018) to 66 for men, reaching 66 years in late 2020. Under current legislation, the SPA will rise to 67 by 2028 and 68 by 2046. Increasing the SPA reduces the expected state pension wealth for affected individuals, but despite these increases, the expected number of years in receipt of a state pension for someone born in the mid 1980s (who faces a SPA of 68) and who is still alive at age 50 is 18 years for men and 20 years for women. Twenty years receiving £203.85 per week equates to a total amount of just over £212,000, a considerable sum.
An important feature of the UK state pension system is that there is no opportunity for people to claim the state pension early at a reduced rate, as can be done in some other countries, although receipt can be deferred beyond SPA (up to a limit) in return for an increased weekly award. A higher SPA would inevitably mean that more people will struggle to stay in paid work up to that age, but our view is that to the extent that the government thinks these people should receive additional support, this should be provided by the working-age benefit system rather than the state pension. Claiming the state pension early could provide support to people in the years leading up to the SPA, but would also lock them into a lower rate of income for the rest of their life which could lead to issues later on. However, were the decision made to increase the value of the nSP substantially relative to earnings, the case for allowing early access would be stronger.
Further increases to the SPA are one sensible approach to the public finance challenges brought by rising longevity at older ages. However, past experience has demonstrated that increases in the SPA need to be clearly communicated, and people need to have certainty over their SPA sufficiently early to allow them to plan accordingly. The government faces a trade-off between wanting to give people certainty about their future SPA as early as possible, and wanting to maintain flexibility to be able to respond to changes in population and public finance projections. Clear, transparent and early communication would give people confidence for planning their retirement finances, and building this kind of trust between politicians and the public could also help facilitate future increases to the SPA. The clear risk is that SPA increases that are done badly could prevent subsequent increases from occurring and thereby ultimately weaken rather than strengthen the public finances as intended.
In response to this, we suggest that communication of people’s SPA, and changes to it, is more formal and prescribed. We think that it would be helpful for the government to write to people around their 50th birthday stating:
• what their SPA is expected to be;
• how this compares with the latest estimate of the life expectancy of someone of their age and sex (and perhaps how this compares with that of someone born 30 years earlier);
• the fact that their actual SPA may be higher (or lower) than this if life expectancy rises or falls.
We then think that the government should write to people again, confirming their SPA 10 years before they reach it. This is in line with the Cridland recommendations from 2017, and would give people a decade of notice for when they will reach their SPA. Relatively few people retire from the labour market more than 10 years before the SPA, and this amount of notice would allow those still in paid work to think about the implications for their planned retirement age and rate of retirement saving.
The 10-year length of this ‘notice’ is, of course, somewhat arbitrary. Some could make a reasonable case that only 8 or 5 years’ notice is enough to plan for a higher SPA than expected. Indeed, we expect that relatively few individuals in their late 50s would make different saving or employment decisions in the face of a SPA of 69 rather than one of 68. Others may worry more about the amount of notice given, and suggest 12 years or more. But the Cridland Report suggested a 10-year notice period, and it seems to us to provide a reasonable balance between the security desired by people and the flexibility desired by government to respond to changing longevity and public finances. Perhaps more important than the precise amount of time given is the quality of the communications made from government to individuals and specifically the extent to which effective efforts are made to ensure that they are both seen and understood.
Traditionally, much of the communication from DWP about the SPA has been in the form of letters, but other methods of personalised communication, such as text messages, could be explored, especially if they were found to be more effective in reaching people. In addition to personalised and targeted communications, information about the SPA could also be provided in conjunction with other forms of engagement between the DWP and individuals, in particular through the Midlife MOT and the Pensions Dashboards.32
6. Indexation of the state pension
Since 1975, legislation has set out a default indexation for increases in the state pension. The indexation rules determine the level of a full state pension over time and are therefore extremely important for determining the projected cost of providing the state pension in future years. As shown in Chapter 2, by linking the growth in the BSP to inflation in 1980 ultimately led to a large fall in the value of the state pension relative to average earnings, as earnings grew rapidly in the 1980s, 1990s and early 2000s. In contrast, under the triple lock, the nSP and BSP increase, by default, every year by the highest of average earnings growth, inflation or 2.5%, boosting the value of these pensions relative to both earnings and prices. The triple lock is also more generous than the uprating of most working-age benefits (which are typically inflation-linked).33
In this chapter, we initially discuss the history of indexation of the state pension, and consider different options for indexing the state pension going forwards. We then show how potential changes in indexation would affect different groups of individuals, as well as the public finances. Finally, we suggest a better way to index the state pension.
6.1 Indexation over time and the triple lock
Starting in 1975, increases in the basic state pension were formally linked to the maximum of inflation and average earnings growth (a ‘double lock’, although it was not known as that at the time). However, Margaret Thatcher’s government changed this policy in 1980, and moved to increasing the state pension each year by inflation – then measured by the RPI – rather than average earnings growth. This shift, combined with substantial growth in real earnings over the following three decades (and in particular the 1980s), meant that the value of the state pension fell as a share of average earnings, as was shown in Figure 2.1.
Following a recommendation of the Pensions Commission, the then Labour government pledged to reinstate earnings indexation for the BSP from 2012 – subject to the state of the public finances – and by 2015 at the latest. The subsequent coalition government went even further and from 2011 introduced what has come to be known as the ‘triple lock’ mechanism for indexing the state pension, at first for the BSP and then additionally for the nSP.
There are lots of different ways in which a government can index the state pension over time. Ideally, governments should be clear on what they want to achieve when choosing a particular form of indexation. In particular, if the goal of indexation is to ensure that the absolute purchasing power of a full state pension is maintained, price indexation would be the right method. However if the objective of indexation is for the state pension to ‘keep up’ with the average incomes of those in paid work – for example, to prevent the living standards of pensioners from deteriorating relative to the working population – this would not be achieved with price indexation but it could be achieved with earnings indexation. Given that price indexation leads to a deterioration of pensioners’ living standards relative to the rest of the population, we do not see this as an appropriate long-run option for state pension indexation.
The triple lock goes further than achieving these objectives. Over time, it boosts the value of the state pension in relation to both earnings and prices. While the triple lock is often portrayed as a popular policy, polling conducted as part of this Pensions Review in Summer 2023 – and slightly earlier research by Phoenix Insights (2023) – suggests that people’s understanding of it is limited. Even though since 197534 increases in the state pension have always been formally linked each year to at least the growth in prices, and under the triple lock its value will increase at least as fast as prices every year, only 11% of working-age people state that they think the state pension will increase faster than inflation over the next 10 years, compared with 38% who say they think it will increase by less than inflation (Barker, Cribb and Emmerson, 2023). This could of course reflect a belief that the triple lock will not be in place much longer, but it is also likely that this indicates a lack of understanding of the triple lock – not least given that no major political party has made any suggestion that the state pension should not be increased at least as fast as the growth in prices.
There are also clear differences in knowledge by age. Polling undertaken by Opinium in October 2023 shows that, perhaps unsurprisingly, older people demonstrate a much clearer understanding of the triple lock policy.35 In particular, 71% of people aged 55 and over (many of whom will be receiving the state pension already) correctly identified the definition of the triple lock, answering ‘True’ to the statement ‘The Triple Lock means that the state pension must rise each year in line with the highest of three possible figures: inflation, average earnings growth, or 2.5%’. However, only 39% of those aged 35–44 gave the correct response to this question, and 55% of this younger age group answered ‘don’t know’.
This polling evidence shows a lack of understanding of what the triple lock means. At the same time, Figure 3.5 showed widespread pessimism about the future of the state pension. It seems that, for many, the triple lock does not provide the sense of certainty and security that they would like to see in relation to the state pension. The quote below, from public engagement work conducted as part of this Pensions Review in the summer of 2023, demonstrates that certainty and security are particularly important aspects of the state pension for individuals – people want the state pension to be sustainable and to remain in place for the foreseeable future.
‘I would like to see continuity around the State Pension, preventing the goalposts from moving constantly. I feel like it is starting to become a failing system that needs resolving, otherwise, I fear I may not receive anything at all. This is not fair in my eyes, considering I will have been paying into it for many years.’
Male, aged 18–29
Future impact of the triple lock
The triple lock increases the value of the state pension over time relative to average earnings. But it also does this in a way that introduces additional uncertainty for individuals in terms of how generous the state pension will be relative to average earnings, and for the public finances in terms of public spending on the state pension relative to national income, depending on the average rate of growth, how volatile earnings and inflation are, and the correlation between growth in earnings and growth in prices. This uncertainty around the sustainability of the triple lock also creates policy risk, as the government may need to consider other reforms to the state pension system, such as substantial increases in the SPA, to limit the growing expenditure on the state pension due to the triple lock.
Between 1992 (when the UK’s monetary policy regime first moved to inflation targeting after the UK left the European Exchange Rate Mechanism) and the financial crisis of 2008, the triple lock would have only resulted in indexation above average earnings growth in one year, 1996, when average earnings growth was just below inflation (2.9% versus 3.0%). However, since the introduction of the triple lock, we have been through a period of slow growth and macroeconomic volatility which has resulted in the state pension being indexed at a faster rate than growth in both prices and earnings. Under the triple lock, the nominal level of the state pension has increased by 60%, whereas average earnings increased by 40% and prices by 42%, between 2010 and 2023 (Cribb, Emmerson and Karjalainen, 2023).
The difference between the effect that the triple lock would have had from 1992 to 2008, and the effect it has had since then, illustrates one of the core issues with the triple lock: under triple lock indexation, the future level of the state pension relative to earnings, as well as government spending on it, is uncertain. Figure 6.1 shows estimates of the modelled volatility of the new state pension, relative to average (median full-time) earnings, updated from Cribb, Emmerson and Karjalainen (2023).
Figure 6.1. Value of the new state pension relative to median full-time earnings: 10th, 50th and 90th percentiles of simulated outcomes from 2024 to 2050
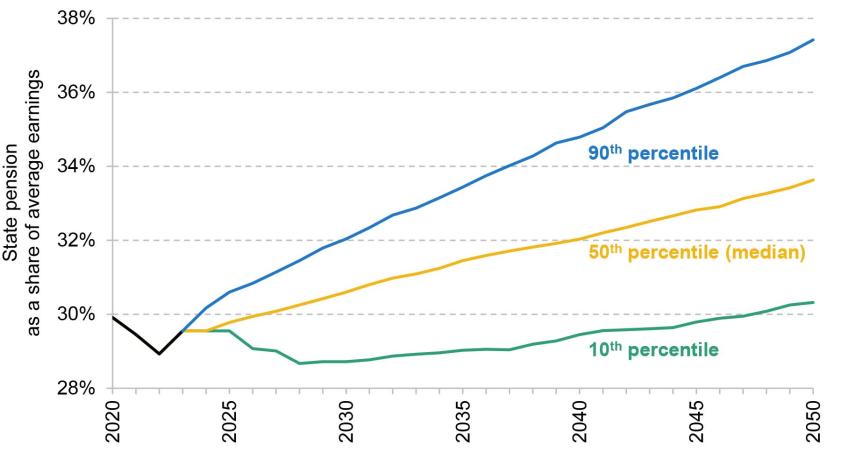
Note: The black line from 2020 to 2023 represents out-turn data. While the triple lock means that the value of the state pension cannot drop below the previous year’s level relative to earnings, the simulation includes 2022 when the triple lock was suspended.
Source: Updated from figure 2 of Cribb, Emmerson and Karjalainen (2023).
The figure is based on simulations of potential outcomes of the triple lock using data on inflation and earnings from 1993 to 2023. It shows the projected 10th, 50th (median) and 90th percentiles of the ratio of the state pension to average earnings if the triple lock is kept in place in the future. We can anticipate with 10% probability that the state pension will be worth less than the 10th percentile, and with 10% probability that it will be worth more than the 90th percentile. Interpreted another way, the 90th percentile would be close to the outcome in a case where macroeconomic instability of the last decade-and-a-half continues in the future, whereas the 10th percentile would be close to what would happen if we returned to a long period of macroeconomic stability with earnings growth outpacing inflation in most years.
Figure 6.1 illustrates that the value of the state pension continues to rise relative to earnings over time. This is because, unless the triple lock is temporarily suspended as it was in 2022, the value of the state pension is always at least stable relative to earnings. And in any year when earnings growth is less than inflation or 2.5%, that leads to a rise in the state pension relative to earnings that is locked in for all future years. This is sometimes known as the ‘ratchet effect’ of the triple lock.
Focusing on the year 2050, the figure shows that a reasonable range (i.e. between the 10th and 90th percentiles, occurring 80% of the time) for the value of the nSP in 2050 is between 30% and 37% of median full-time earnings. Based on today’s average earnings, this would mean a range of £10,900 to £13,400 per year (compared with a current full nSP of £10,600). This creates uncertainty when it comes to future spending on the state pension. Based on our calculations, a reasonable estimate (taking place 80% of the time) for additional spending on the state pension in 2050 due to the triple lock, above and beyond earnings indexation, would be between £5 billion and £40 billion a year in today’s terms.36
6.2 Understanding the impacts of potential changes to indexation
Given that any changes in indexation will ultimately determine the level of a full nSP in the future, it will have important impacts on the incomes of future pensioners. In order to understand these effects, we can calculate the impact that any changes would have on the total amount of the state pension income that individuals can expect to receive over the course of their life, from SPA to death. 37
People who live longer will receive more from the state pension than will people who die shortly after reaching SPA (or indeed those who do not make it to the SPA). To a great extent, this is a positive feature of the state pension system: it provides some ‘longevity insurance’, i.e. it helps guarantee people that they will not ‘run out of money’ as they get older – for example, as they draw down their other savings.
However, with people eligible to receive the state pension from SPA until death, inequalities in life expectancy mean that different groups receive systematically different amounts of state pension income over their lifetimes. Figure 6.2 shows how differences in mortality rates between different wealth groups lead to differences in the net present value of the future state pension income streams that these groups can expect to receive. Inequalities in mortality rates can be found in many dimensions including by sex, education, income and region (e.g. Pensions Policy Institute, 2020; Case and Kraftman, 2022),38 but Figure 6.2 uses differences by wealth and sex for one generation (those born in 1955). This figure assumes that all 66-year-olds receive a full (triple-locked) nSP until death. Thus any differences in expected state pension wealth only reflect differences in mortality, rather than any differences in entitlement.
Figure 6.2. Net present value of triple-locked state pension received from age 66 at age 50, weighted according to survival probabilities from age 50 for those born in 1955, by sex and wealth quintile
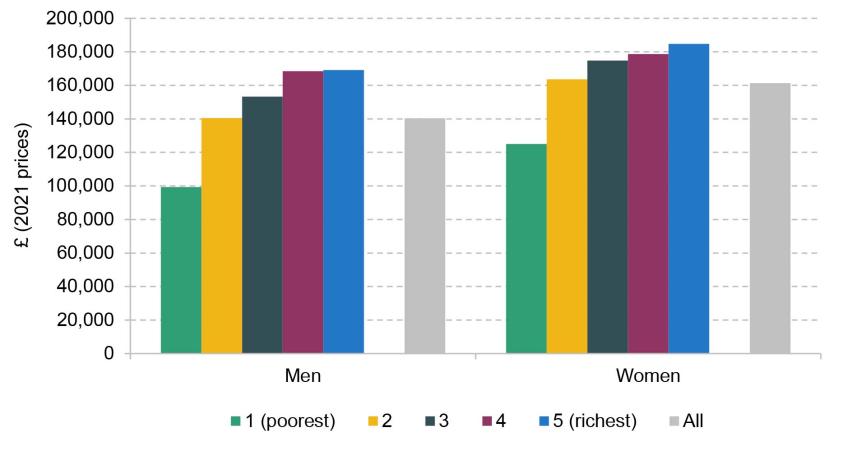
Note: Assumes CPI inflation of 2%, average nominal earnings growth of 3.8%, and triple-lock ratchet of 0.58% above earnings growth from Office for Budget Responsibility (2023). Future cash flows discounted using SCAPE rate (1.7% + CPI). Wealth quintiles measured based on individual wealth (where a couple’s wealth is split into two). England only. Calculating net present values at age 50 means that we also take into account differential mortality between ages 50 and 66.
Source: Authors’ calculations using ONS and ELSA data.
Comparing men and women, the figure shows that expected total income from the state pension is higher among women than among men, driven by women having a higher average life expectancy. In addition to this gender difference, the figure also shows that expected total income from the state pension is higher for richer people than for poorer ones. For example, compared with an average expected total income from the state pension of £140,000 for men overall, men in the bottom wealth fifth have expected total income from the state pension of just under £100,000, compared with nearly £170,000 for men in the wealthiest fifth. Differences in mortality rates (and hence net present value of expected state pension income) are much more dramatic between people with low levels of wealth and people close to the average, than between people on average levels of wealth and the most affluent, where the differences are smaller.
Figure 6.2 shows that those with lower life expectancy, such as men and poorer people, can be expected to receive less in state pension income over the course of their lifetime than women and richer people. As noted previously, providing higher benefits to people who live longer is a feature of the system – it helps provide ‘longevity insurance’, i.e. insurance against living too long and finding oneself with unexpectedly limited financial resources in old age. But it also means that different indexation regimes will have differential impacts by expected longevity.
Impact of changes to indexation on individuals
Given the differences in lifetime state pension income for men and women across the wealth distribution, we now discuss how changes to the indexation of the state pension would affect the amount of state pension income different groups could expect to receive over their life. Specifically, we examine how moving from a triple-locked state pension to earnings indexation compares with increasing the SPA, which has been a key lever used by recent governments seeking to control the cost of the state pension system.
Figure 6.3 shows the percentage falls in expected income from the state pension – among men and women in different parts of the wealth distribution – resulting from an increase in the SPA from 66 to 67, and from a change from triple lock to earnings indexation. Focusing first on the ‘average’ bars, both potential changes have a similar average impact on expected income from the state pension, namely reducing it by roughly 6% for men (we refer to the figures for men below, but we see similar patterns among women).
Figure 6.3. Percentage change in the net present value of income from the state pension resulting from increasing the SPA from 66 to 67, and from moving from triple lock to earnings indexation, by sex and wealth quintile
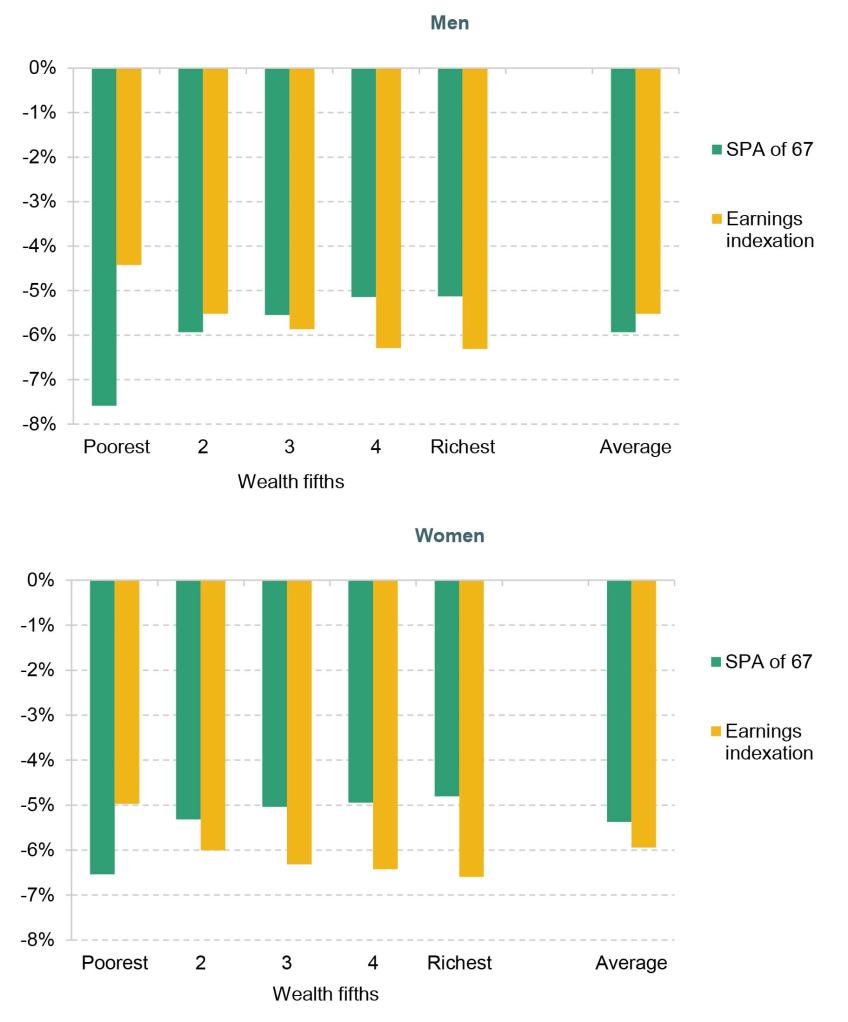
Note: Present discounted value of state pension income calculated at age 50 for those born in 1955, as in Figure 6.2.
Source: Authors’ calculations using ONS and ELSA data.
But due to differential mortality between wealthier and poorer people, the distributional impacts of those two changes differ. Moving from triple lock to average earnings indexation reduces expected income from the state pension for the bottom fifth of the wealth distribution by 4% for men, compared with 6% for the top fifth – so this is a change that would disproportionately affect wealthier people. This is because the impact of the triple lock – in terms of raising the value of the state pension – is larger the longer the individual is alive. Those who are more likely to be alive in their 80s and 90s (and beyond) will benefit more from the triple lock than those who are less likely to survive to those ages.
In contrast, increasing the SPA affects people in a very different way. The figure shows that increasing the SPA (from 66 to 67 in this case) reduces expected income from the state pension among the bottom fifth of the wealth distribution (by 8%) more than it reduces it among the wealthiest fifth (reducing it by 5%). This is because, in pound terms, the loss in expected state pension income as a result of the higher SPA is the same across all groups, which means that the cash-amount reduction represents a larger proportion of the poorest fifth’s state pension income than for wealthier people.
Impact of changes to indexation on the public finances
In addition to the effects on individuals, the choice of how to index the state pension makes a big difference to how public spending on the state pension is expected to evolve over time. Figure 6.4 shows projected spending on the state pension as a share of national income, over the next five decades. The yellow top line shows the latest OBR projections of state pension spending given current legislated increases in the SPA and maintaining the triple lock. The flat green line at 6% shows the level that the latest independent review of the SPA suggested as a cap for state pension spending.
Figure 6.4. Projected expenditure on state pension as a share of national income, under different indexation and SPA assumptions
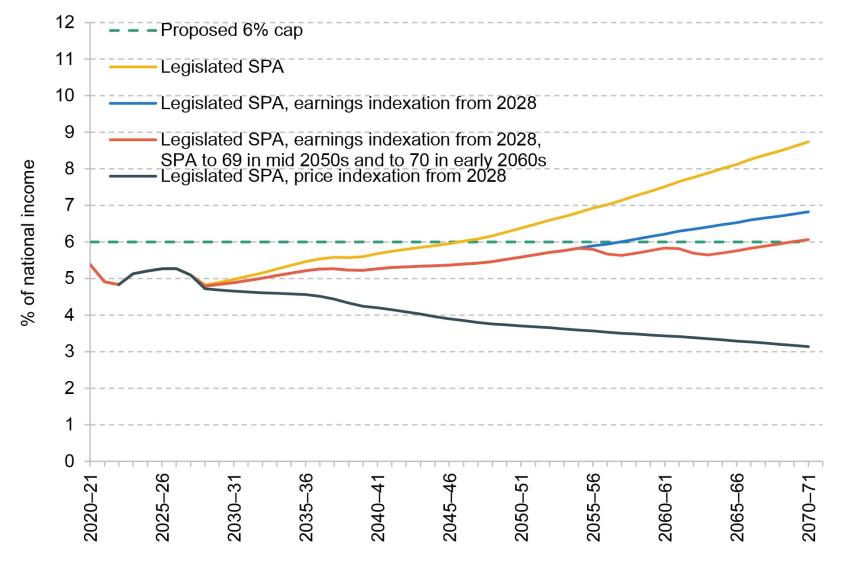
Source: Authors’ calculations from the Independent Review of the State Pension Age 2022 (Department for Work and Pensions, 2023a) and OBR projections in Summer 2023 (Office for Budget Responsibility, 2023).
The figure shows that under current government policy, this 6% cap would be breached by the late 2040s39. If earnings indexation of the state pension were introduced from 2028 onwards, this would push back the timing of the breach by about a decade – state pension spending would reach 6% of national income around the late 2050s. Assuming triple lock throughout, the Independent Review of the State Pension Age showed that in order to maintain spending on the state pension below 6% by the late 2050s, the SPA would have to rise to 72 by the end of that decade.
These projections clearly illustrate that changing state pension indexation from triple lock to earnings indexation would slow down the expected increase in spending on the state pension, but to maintain spending under the independent review’s proposed 6% cap, a combination of earnings indexation and SPA increases would be required. In particular, our modelling shows that if we had earnings indexation from 2028 (the end of the current public finance forecast horizon, as assumed in the latest independent review), combined with the SPA increasing to 69 in the mid 2050s and to 70 in the early 2060s, spending on the state pension would only reach 6% of national income by the early 2070s.
Figure 6.4 has compared spending scenarios against the proposed 6% cap on state pension spending as a percentage of national income. However, there is a good case to be made that such a cap is badly designed and should not be implemented. One problem with the cap is that it is inflexible; it would allow a much more generous deal to those from small birth cohorts than to those from large cohorts. Figure 3.4 illustrated the volatility of the OBR’s projections of state pension spending, not just for the long run but also in the nearer future. This would make it extremely difficult for governments to make policy so that pension spending stays below the proposed 6% cap, while also trying to ensure that people are given sufficient notice of increases in the SPA (in particular).
Furthermore, the modelling in Figure 6.4 is an illustration with major embedded assumptions. In particular, it assumes earnings growth that is higher than inflation over the forecast horizon. However, we saw very little real earnings growth in the UK over the last 15 years. If this trend were to continue, then the difference between the top line (triple lock) and bottom line (price indexation from 2028) would be much smaller. This also highlights the difficulty with being able to commit credibly to spending being below a certain share of national income several decades ahead.
Figure 6.4 also shows how spending on the state pension would evolve as a fraction of GDP if the state pension were indexed in line with (CPI) inflation from 2028 onwards. This is how working-age benefits are indexed currently, and is close to how the state pension was indexed from the 1980s to 2010 (though that was in line with the RPI measure of inflation, which tends to overstate inflation systematically and is therefore typically higher than the CPI measure). If the state pension were indexed in line with CPI inflation, spending on the state pension is projected to fall gradually from 5.1% of national income today to only 3.7% by 2050.
Although price indexation would imply that the level of the state pension would remain fixed in real terms, it would mean that in the long run it would fall relative to average earnings, which would lead to a growing gap between the incomes of pensioners and the rest of the population (unless other sources of pensioner incomes grew faster than earnings growth to make up for the gap). Our modelling shows that under this scenario, the level of the state pension would also fall from the current 30% of median full-time earnings to below 20% (see Figure 6.5 later). It is worth noting that this assumes that average earnings growth exceeds inflation in the future, whereas over the last 15 years of economic data and poor real earnings growth, price indexation would have matched earnings indexation. However, taking the modelling assumptions as given, a state pension of below 20% of average earnings would be £131 per week compared with the current £204. By historical comparison, this is the level that the basic state pension was at relative to median earnings in 2010. The Pensions Commission of the mid 2000s recommended moving away from price indexation, in part as it would have led to much increased reliance on means-tested benefits in retirement. Indeed, a big increase in the scope of the means-tested pension credit would likely be required unless many more pensioners were to be left in relative income poverty.
6.3 A better way to index the state pension
As we have shown, the triple lock increases the generosity of the state pension relative to average earnings over time, but does so in a way that creates uncertainty for the public finances and for individuals in terms of what the level of the state pension will be relative to average earnings in the future. The triple lock means that the value of the state pension will increase relative to average earnings over time, but only in periods of poor economic conditions – so it is uncertain how often this will happen. Over time, this ratchets up the level of, and spending on, the state pension in a way that (unpredictably) increases pressure on the public finances. Even a government that is comfortable with significant additional spending on the state pension should be concerned by the unpredictable nature of the triple lock commitment.
There are better indexation options. We suggest that the government should move to a new way of indexing the state pension, instead of the triple lock.
There are two parts to our suggested new way forward for indexation of the state pension. The first part is to recognise that from one year to the next, there is a good case to be made for the state pension rising by at least inflation, so that pensioners (who are unable, or not expected, to work) are protected from falling living standards, at least in terms of their state pension income.40 The second part is that, in the long run, there is a good case to be made for the state pension rising by growth in average earnings, to prevent the incomes of pensioners falling behind those of people in paid work.
The way we suggest state pension indexation operationalises this is that in ‘normal’ years, in which average earnings growth outpaces inflation, the nSP (and BSP) would rise by average earnings growth. In years that inflation outpaced earnings growth, the state pension would rise by the rate of inflation.41 However, the state pension would then continue to rise by inflation even as real earnings growth returned, in order to ensure the long-run relationship between the state pension and average earnings is maintained. This is a direct replica of what is done with the Australian state pension;42 we are suggesting the UK adopts an Australian-style state pension indexation system.
In the long run, this policy means that the state pension would grow in line with average earnings. The ‘starting point’ for earnings indexation is therefore crucial. To be clear, if you move towards long-run earnings indexation (with the added protection of at least rising by inflation each year, as we propose), it matters whether you start that from now (where the nSP is around 30% of median full-time earnings) or from a higher (or lower) level.
The clearest and simplest way to move towards long-run earnings indexation would be for the government to decide a target level for the nSP relative to median earnings and legislate a pathway consistent with meeting that level by a specific date. This would be analogous to what recent governments have done with the minimum wage. Upon reaching that target level, the government would then move to our suggested indexation rule of long-run earnings indexation (with inflation protection in each year).
Regardless of what the target level of the state pension is set to be, in the long run that level could also be reached under the triple lock, and indeed some have argued that triple lock is a sensible method for achieving a higher state pension from a political economy perspective (e.g. Portes, 2023). However, the unpredictability, lack of clear policy goal, and high cost of the triple lock policy mean it is not an optimal way of reaching a higher state pension. The pace at which the value of the state pension increases relative to earnings depends on the relationship between inflation, earnings growth and 2.5%, meaning that there is no guarantee about how fast the state pension will reach a specific level. What is needed instead is a clear political commitment to a target level of the state pension, as well as a commitment to when that level will be reached.
It is worth being clear here that we think the appropriate measure of earnings to use for a target is median full-time earnings. Using full-time earnings avoids a situation where the state pension would be ‘pulled down’ by an increase in part-time work. There are a number of possible reasons for such an increase, including more parents with young children entering the labour market, or a combination of the working-age population ageing and increases in the SPA leading to a greater number of individuals close to retirement remaining in part-time work. We do not think any of these trends should impact the level of the state pension. Equally, we think that median earnings is a more appropriate metric than mean earnings as it is more likely to represent the experience of a typical worker, rather than being unduly affected by the top of the earnings distribution. For example, if pay in the (more volatile) financial sector were to grow – or to decline – sharply, that could greatly affect mean earnings but would not substantially affect median earnings.43
Were the government to move towards our suggested model for indexation of the state pension, the key decision would then be what share of median full-time earnings is appropriate as a target for the state pension. Of course, this decision has implications for both the level of the state pension – and therefore the incomes of pensioners – and the cost to the public finances – and therefore the amount that needs to be raised in taxes or is available to spend elsewhere. Figure 6.5 and Table 6.1 together illustrate this trade-off. As a baseline, we use the cost of the state pension (specifically both the nSP and the BSP) being increased in line with median earnings from 2023 onwards (i.e. keeping the current relativity where the nSP is 30% of median full-time earnings). Under this baseline, state pension spending is projected to rise by 0.3% of national income between now and 2050, equivalent to £8 billion per year in today’s terms. This increase occurs due to the number of pensioners rising over time.
Figure 6.5. Impact on state pension spending in 2050, relative to earnings indexation from 2023 onwards, for different levels of nSP
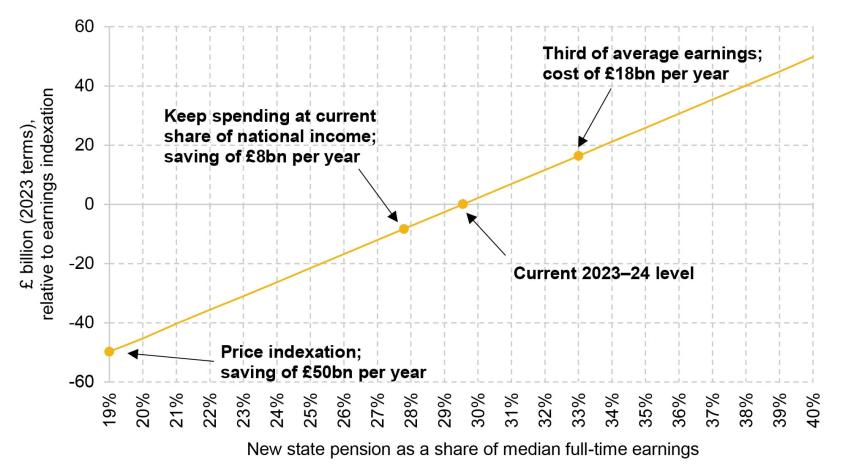
Source: Authors’ calculations using OBR projections in Summer 2023 of state pension spending and long-term economic determinants (Office for Budget Responsibility, 2023).
Table 6.1. Implications of the different levels of the new state pension (nSP)
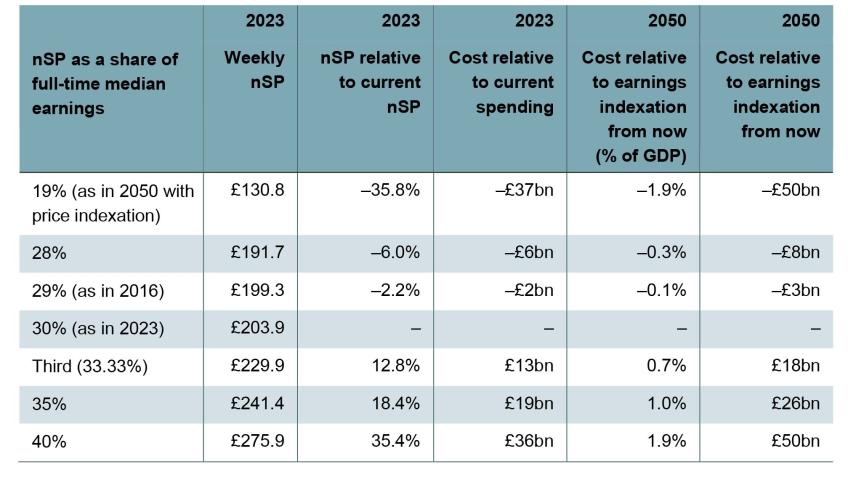
Note: £ and £bn amounts are in today’s terms.
Source: Authors’ calculations using OBR projections in Summer 2023 of state pension spending and long-term economic determinants (Office for Budget Responsibility, 2023).
The figure and table present a number of options. For example, if a government desired to increase the level of the state pension so that the nSP was worth a third (33.33%) of median earnings in 2023, this would mean increasing the level of the nSP by about 13% to around £230 per week. The immediate cost of this would be £13 billion per year, with the long-run cost (i.e. in 2050) rising to £18 billion per year in today’s terms. This would come on top of the additional spending of £8 billion a year in 2050 compared with 2023 in today’s terms (as a result of the rising number of pensioners) if the state pension stayed at 30% of median earnings. 44
Increasing the value further to 35% of median earnings would mean a state pension 18% higher if implemented this year (around £240 per week in 2023) at a long-term cost of (an additional) £26 billion per year. In contrast, if a government wanted to hold down the level of the state pension, moving back to 29% of median earnings (as it was in 2016), that would imply an nSP just over 2% lower than today’s, reducing spending by £3 billion a year in the long run. Fully offsetting the increase in spending projected from earnings indexation (our baseline) would require the nSP to be reduced to 28% of median full-time earnings, or £12 per week lower than its current level. Price indexation would be expected, over a long period, to reduce spending on the state pension as a share of national income, as shown in Figure 6.4 earlier. It should be noted that long-run price indexation would be far less generous than our suggested new way forward of earnings indexation (with inflation protection).
Once again, it is important to note that the future cost and level of the state pension in Figure 6.5 and Table 6.1 are calculated based on a number of assumptions – for example, about how average earnings growth will evolve in the future. Even though the exact magnitude of the spending figures could well be different from those shown, the stark trade-off between public finance spending on the state pension and its level would still hold of course.
Once the government has chosen and reached a target level of the nSP relative to average earnings, how should the state pension be indexed from that point on? The way in which our proposed indexation works over the medium term for a chosen level of the state pension is shown in Figure 6.6 for an illustrative 20-year period. This shows the value of the state pension in real terms (in other words, a price-indexed state pension would be flat). First, the figure shows that in periods of relative economic stability, when average earnings growth is above inflation, the value of the state pension rises in real terms, growing in line with average earnings (the blue dashed line follows the yellow line). The rate at which the value of the state pension rises depends on how fast average earnings grow. As the figure shows, when real earnings growth is faster (years 1–5), the real value of the state pension also rises faster than when earnings growth is slower (years 6–9).
Figure 6.6. Illustration of how our suggested new style of indexation would operate
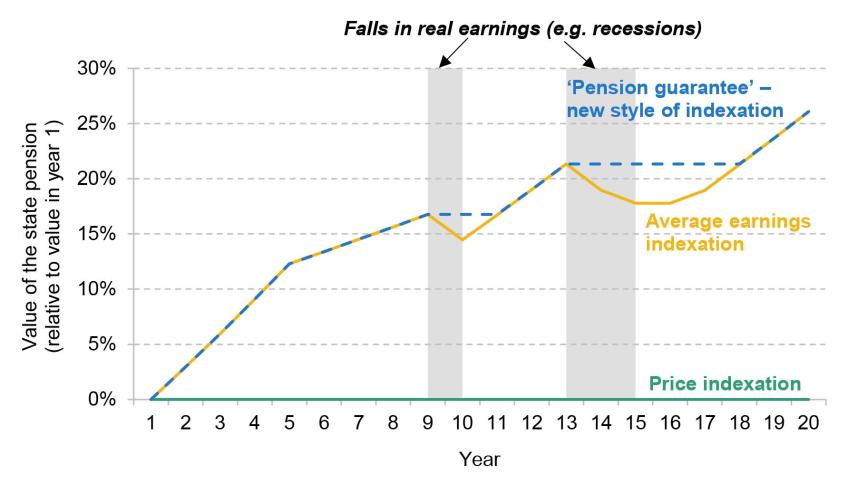
Note: Assumes inflation of 2% and average earnings growth of 5% in years 1–5 and 3% in years 6–9. In the first period of negative real earnings growth, average earnings growth falls to 0% for one year. In the second period of lower average earnings growth, which lasts four years, the rates are 0%, 1%, 2% and 3%. Between the periods of negative real earnings growth, the nominal average earnings growth rate is 4%, as it is in the final three years.
Source: Authors’ calculations.
However, during any period where average earnings growth is below inflation, such as a recession (highlighted in grey in the figure), the value of the state pension rises in line with prices (and is therefore constant in real terms). This protects the purchasing power of the state pension in times of an economic downturn (so the blue dashed line is horizontal and above the yellow line). The state pension then continues to be indexed to prices, rising at the rate of inflation, until it reaches the target level again (so the blue dashed line does not rise until the yellow line reaches it), and then continues to rise again in line with average earnings.
Figure 6.7 shows how the suggested new style of indexation would operate compared with the double or triple lock. This figure illustrates that in periods of more ‘normal’ economic conditions, when average earnings growth is above inflation as in the first nine years in the figure, the indexation under triple and double lock is exactly the same as it is under the suggested guarantee or average earnings indexation. However, this figure illustrates how in periods where average earnings growth is below inflation and/or 2.5%, indexation under triple and double lock is higher than under the other alternatives, ratcheting up the value of the state pension. Furthermore, these higher values are then ‘locked in’ for all future periods.
Figure 6.7. Illustration of how our suggested new style of indexation would operate compared with double and triple lock
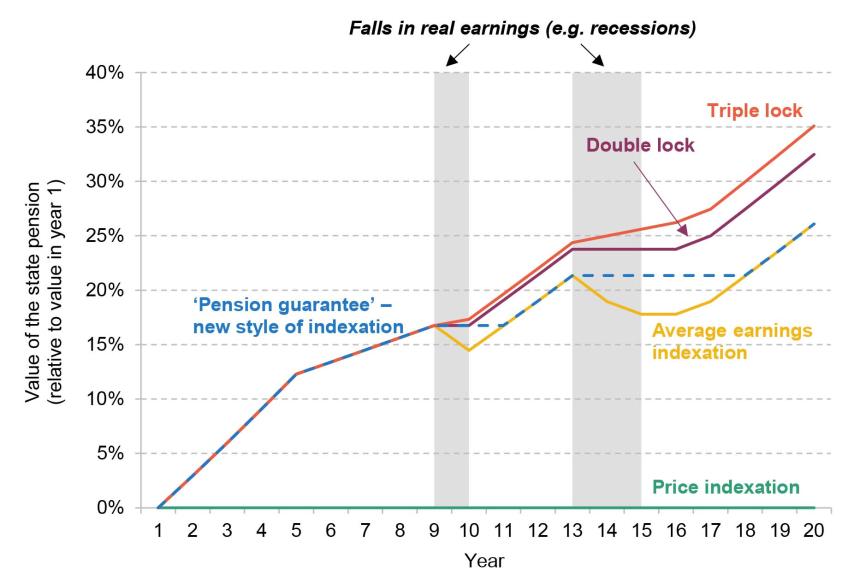
Note: Assumes inflation of 2% and average earnings growth of 5% in years 1–5 and 3% in years 6–9.. In the first period of negative real earnings growth, average earnings growth falls to 0% for one year. In the second period of lower average earnings growth, which lasts four years, the rates are 0%, 1%, 2% and 3%. Between the periods of negative real earnings growth, the nominal average earnings growth rate is 4%, as it is in the final three years. Under the ‘double lock’, pensions are increased every year by the highest of average earnings growth or inflation. Under the ‘triple lock’, pensions are increased every year by the highest of average earnings growth, inflation or 2.5%.
Source: Authors’ calculations.
6.4 Summary
This chapter has examined the impact of potential changes to indexation on the level of the state pension and the amounts that would be received by different groups of individuals. In particular, we showed that keeping the triple lock while increasing the SPA to limit the cost of the state pension system would hit poorer people more because the loss of a year of income is more important for those with lower life expectancy, as they spend less time above the SPA. On the other hand, those with higher life expectancy benefit more from the triple lock as they are more likely to be receiving a higher state pension into their 80s and beyond.
One benefit of the triple lock is that in any one year it prevents the value of the state pension falling in real terms. Another is that when earnings growth is higher than inflation, it prevents the state pension falling relative to average earnings. But increasing the state pension by the highest of inflation, earnings growth and 2.5% each year means that the level (and cost) of the state pension is ratcheted up over time in a way that is uncertain. In particular, under the triple lock, the value of the state pension ratchets up relative to average earnings at a much faster rate in periods of macroeconomic volatility, when average earnings growth is weak. In periods where average earnings growth is higher than inflation (and 2.5%), the value of the state pension relative to earnings remains stable.
This chapter has made it clear that there is an alternative system available that would offer individuals more certainty. Introducing an Australian-style system of long-run earnings indexation, with the commitment that each year the state pension will rise by at least inflation (and never fall in cash terms), would help to protect the spending power of pensioners in bad years, and prevent their state pension incomes from falling behind the income of the typical worker over the longer run. The key for the government under our suggested new way forward is to choose a target level for the new state pension as a share of median full-time earnings and to commit to a pathway to reaching that target.
There are a number of considerations that a government would have to take into account when choosing the level of the state pension. There is a clear trade-off between higher standards of living for pensioners and higher state spending, which would ultimately be financed by higher taxes and therefore lower incomes for non-pensioners, or through lower spending on other items of public expenditure. The government should consider together what it thinks is an appropriate level of the state pension, and how fast the SPA should rise compared with longevity, rather than considering these policies separately. Finally, the level of the state pension that is needed to reach a certain standard of living in retirement will depend on the kind of incomes people can typically expect to achieve from private pension savings.
As well as giving individuals a better sense of the future level of the state pension relative to average earnings, the intentional decisions around state pension spending increases (instead of the unpredictable nature of the triple lock) could help increase individuals’ confidence in the future and sustainability of the state pension system. Despite the state pension having never been cut in real terms since 1975, more working-age individuals expect it to increase by less than inflation over the next decade than expect it to increase by more than inflation. The triple lock could be phased out over time if that were deemed more politically palatable, but it is clear that communicating the proposed new system effectively to help the public understand the benefits of such a system would be highly important.
7. Conclusion
This report has provided a thorough examination of the key features and parameters of the UK state pension system. We have identified a number of key challenges. First, the ageing of the population will exert upwards pressure on public spending in coming decades, from state pensions and to an even greater extent due to demands for publicly funded health and social care services. Second, while the triple lock increases the value of the state pension relative to average earnings over time (especially when earnings growth is weak), it does so at an arbitrary rate without any policy goal for what the state pension should be in the future. Thus, maintaining the triple lock leads to uncertainty over the future value of the state pension relative to average earnings and over public spending on the state pension relative to national income. Third, relying on increases in the state pension age to manage those public finance pressures – rather than adopting a less generous form of indexation – would disproportionately hit groups with lower life expectancy, such as poorer households. Fourth, despite the now much simplified state pension system, there is a great deal of confusion and pessimism about the system among working-age individuals – perhaps fuelled by a widespread lack of understanding. Given the importance of confidence in the state pension system for individuals who are trying to save appropriately for retirement, this really should be a concern for policymakers.
Despite this, we do not envisage wholesale changes to the state pension system. Since the early 2000s, we have seen consistent moves towards a simplified, flat-rate state pension scheme, where the state pension provides an important ‘base layer’ of pension income that is supplemented by private provision. We think there is value in retaining this flat-rate state pension system, with the same full amount paid almost universally to those who have spent most of their adult lives in the UK. We see no appetite in the UK for turning towards earnings-related state pensions, as provided in some other European countries, which would require increases in taxation to finance higher state pensions for middle and high earners. Widespread means-testing of the state pension is not an attractive option when we rely on private saving to supplement the state pensions for so many, as it would significantly reduce saving incentives and risk undermining the considerable success of automatic enrolment.
While a single state pension age does introduce some rigidity into the system, on balance we do not think it would be a good idea to allow early access to the state pension at an actuarially reduced rate. Allowing early access would mean that people approaching the SPA would have to make a complex financial decision with long-lasting consequences. It would also complicate the concept of the SPA, which is perhaps the best-understood part of the system. Given that – particularly for single pensioners – the current level of the state pension is not far above the relative poverty line, allowing early access at a permanently reduced rate would increase individuals’ risk of income poverty at older ages and place greater demands on means-tested support for pensioners. That said, were the state pension to be increased significantly, the case for allowing individuals earlier access at an actuarially reduced rate would be stronger.
Therefore we think that much of the ‘basics’ of the state pension system should stay the same: there should be a flat-rate state pension, available in full to most people and claimable starting from a single SPA.
However, we do think that some other elements of the system are ripe for reform. The triple lock ratchets up the level (and the cost) of the state pension, relative to average earnings (and national income), in a way that is unpredictable for pensioners and the public finances. And increasing the value of the state pension while using a higher SPA to control spending disproportionately affects poorer people, and those with lower life expectancy more generally.
We suggest a new way forward, in order to provide certainty and confidence over what people can expect in old age from the state. We suggest a ‘four-point pension guarantee’, as follows:
5 There will be a government target level for the new state pension, expressed as a share of median full-time earnings. Increases in the state pension will in the long run keep pace with growth in average earnings, which ensures that pensioners benefit when living standards rise.
6 Both before and after the target level is reached, the state pension will continue to increase at least in line with inflation every year.
7 The state pension will not be means-tested.
8 The state pension age will only rise as longevity at older ages increases, and never by the full amount of that longevity increase. To increase confidence and understanding, the government will write to people around their 50th birthday stating what their state pension age is expected to be. Their state pension age would then be fully guaranteed 10 years before they reach it.
To set the target level, as the government has done with the minimum wage, politicians should state what they believe to be an appropriate level for the new state pension (and the basic state pension) relative to average earnings (as measured by median full-time earnings). They should then legislate a pathway to meeting that target with a specific timetable. This would result in an explicit commitment from the government to target a level of state pension relative to average earnings, which would then be maintained in the long run too.
A case can be made for a state pension higher (both in real terms and relative to average earnings) than it is today. There are many people who will retire with modest private pension provision. And many of those with no other income may fall back on means-tested benefits. In particular, as we have shown, those living in the private rented sector without any private income in retirement will be likely to be eligible for housing benefit. On the other hand, if the main concern for policymakers is about poverty and low living standards of pensioners, raising the state pension for everyone is a fairly blunt, and expensive, tool. Governments will need to balance the cost and sustainability of the pension system against other costs associated with demographic change. Even without any increase in the new state pension as a share of average earnings, taxes are already on course to have to rise significantly over the coming decades.
Together with a commitment from the government to target a level of the state pension relative to average earnings, the ‘four-point pension guarantee’ addresses some of the key challenges in the current state pension system, and ensures people can have confidence and certainty over the state pension as a future source of income to protect them from income poverty and provide a solid bedrock on top of which they can build private pension saving. These suggestions on the state pension system will feed into the final recommendations of the Pensions Review. Those recommendations, due to be published in Summer 2025, will bring together policy suggestions from all parts of the Pensions Review, considering the role of both the state pension and the benefits system, as well as issues regarding the accumulation and decumulation of private pension savings.
Appendix
Figure A.1. State pension income for women and men aged SPA + 1
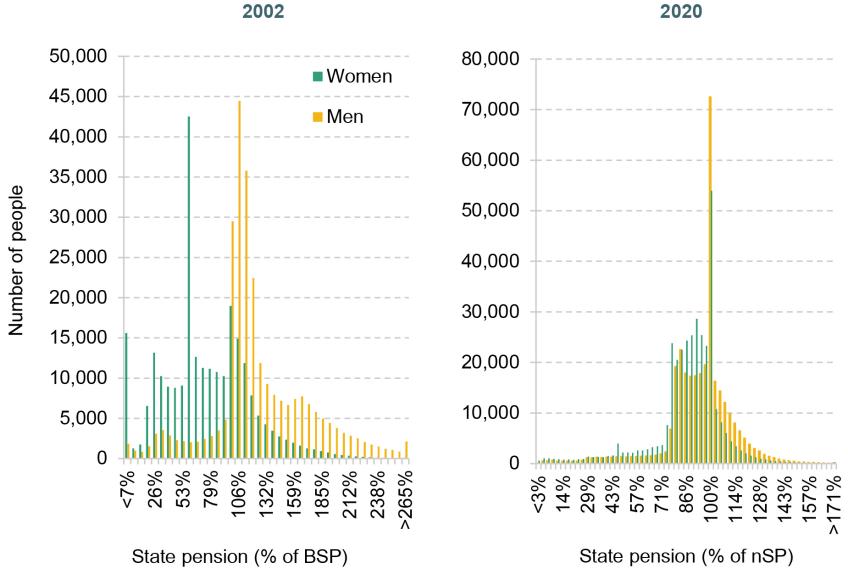
Source: Stat Xplore. For 2002, men aged 66 and women aged 61. For 2020, men and women aged 67.
Table A.1. Characteristics of those acquiring a qualifying year and those not acquiring one, 2019–20 (excluding students)
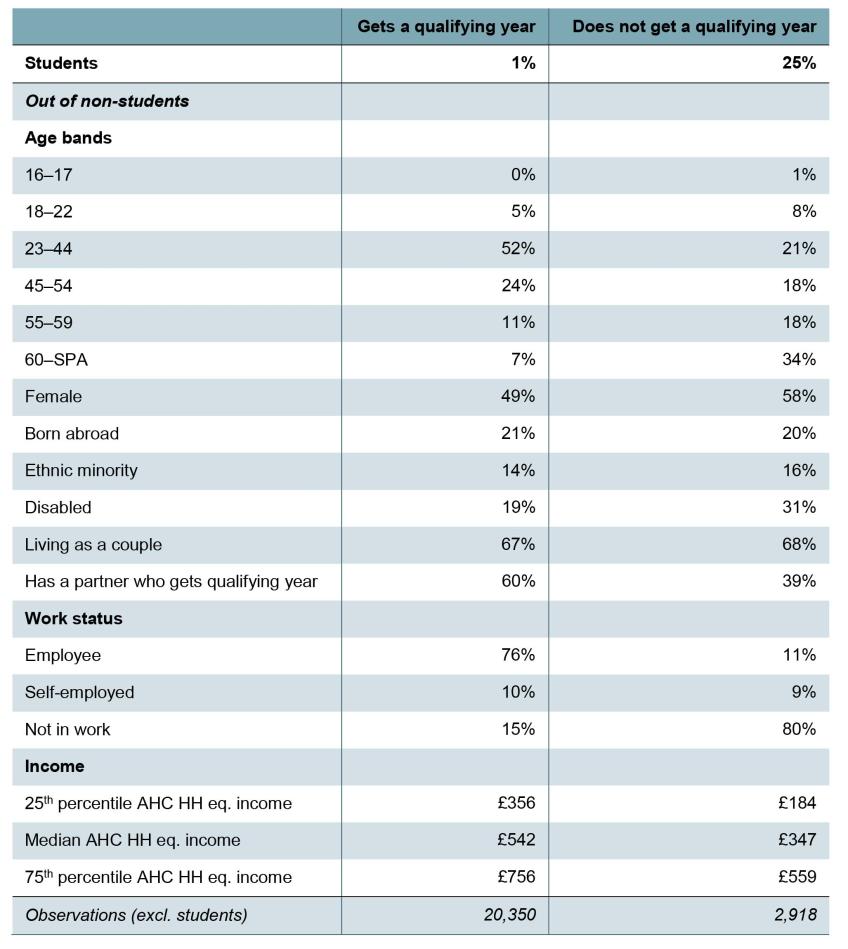
Note: ‘AHC HH eq. income’ is after-housing-costs household income equivalised using the OECD modified equivalence scale.
Source: Family Resources Survey 2019–20. Includes people aged 16–SPA.
Advisory group member organisations
- Age UK
- Citizens Advice
- Confederation of British Industry (CBI)
- Department for Work and Pensions (DWP)
- Federation of Small Businesses (FSB)
- Financial Conduct Authority (FCA)
- Generation Rent
- HM Revenue & Customs (HMRC)
- HM Treasury (HMT)
- Institute and Faculty of Actuaries (IFoA)
- Institute for Government (IfG)
- Joseph Rowntree Foundation (JRF)
- Lane Clark & Peacock LLP (LCP)
- Money and Pensions Service (MaPS)
- NEST Insight
- Pensions and Lifetime Savings Association (PLSA)
- Pensions Policy Institute (PPI)
- Resolution Foundation
- The Association of British Insurers (ABI)
- The Behavioural Insights Team (BIT)
- The International Longevity Centre (ILC-UK)
- The Pensions Regulator
- The Runnymede Trust
- Trades Union Congress (TUC)
- Which?
References
Amin-Smith, N. and Crawford, R., 2018. State pension age increases and the circumstances of older women. In J. Banks, G. D. Batty, J. Nazroo, A. Oskala and A. Steptoe (eds), The Dynamics of Ageing: Evidence from the English Longitudinal Study of Ageing 2002–16 (wave 8), https://ifs.org.uk/sites/default/files/output_url_files/ELSA_Wave_8_report.pdf.
Atalay, K. and Barrett, G. F., 2015. The impact of age pension eligibility age on retirement and program dependence: evidence from an Australian experiment. Review of Economics and Statistics, 97(1), 71–87, https://www.jstor.org/stable/43554980.
Banks, J., Cribb, J., Emmerson, C. and Sturrock, D., 2019. The impact of work on cognition and physical disability: evidence from English women. IFS Working Paper W19/13, https://ifs.org.uk/publications/impact-work-cognition-and-physical-disability-evidence-english-women.
Barker, K., Cribb, J. and Emmerson, C., 2023. Amidst confusion, there’s widespread pessimism about future standards of living in retirement. IFS Comment, https://ifs.org.uk/articles/amidst-confusion-theres-widespread-pessimism-about-future-standards-living-retirement.
Behaghel, L. and Blau, D. M., 2012. Framing Social Security reform: behavioral responses to changes in the full retirement age. American Economic Journal: Economic Policy, 4(4), 41–67, https://doi.org/10.1257/pol.4.4.41.
Bozio, A., Crawford, R. and Tetlow, G., 2010. The history of state pensions in the UK: 1948 to 2010. IFS Report BN105, https://ifs.org.uk/publications/history-state-pensions-uk-1948-2010.
Carrino, L., Glaser, K. and Avedano, M., 2020. Later retirement, job strain, and health: evidence from the new state pension age in the United Kingdom, Health Economics, 29(8), 891–912, https://doi.org/10.1002/hec.4025.
Case, A. and Kraftman, L., 2022. Health inequalities. IFS Deaton Review of Inequalities, https://ifs.org.uk/inequality/health-inequalities.
Codreanu, M., Crawford, R., Cribb, J. and Emmerson, C., 2020. The changing generosity of the UK state pension system to the self-employed. IFS Report R182, https://ifs.org.uk/publications/changing-generosity-uk-state-pension-system-self-employed.
Coile, C., Cribb, J., Emmerson, C. and O’Brien, L., 2023. Why does increasing the early retirement age affect employment? IFS working paper, forthcoming.
Corlett, A., 2020. Improving our understanding of UK poverty will require better data. Resolution Foundation, Spotlight, https://www.resolutionfoundation.org/app/uploads/2021/01/Improving-our-understanding-of-UK-poverty-will-require-better-data.pdf.
Cracknell, R. and Strickland, P., 1995. The Pensions Bill: social security aspects. House of Commons Library, Research Paper 95/47, https://researchbriefings.files.parliament.uk/documents/RP95-47/RP95-47.pdf.
Crawford, R. and Karjalainen, H., 2020. Awareness of state pension entitlements. In J. Banks, J. Nazroo, A. Steptoe and P. Zaninotto (eds), The Dynamics of Ageing: Evidence from the English Longitudinal Study of Ageing 2002–2019 (Wave 9), https://www.elsa-project.ac.uk/wave-reports.
Crawford, R., Keynes, S. and Tetlow, G., 2013. A single-tier pension: what does it really mean? IFS Report 82, https://ifs.org.uk/publications/single-tier-pension-what-does-it-really-mean.
Crawford, R. and Tetlow, G., 2010. Employment, retirement and pensions. In J. Banks, C. Lessof, J. Nazroo, N. Rogers, M. Stafford and A. Steptoe (eds), Financial Circumstances, Health and Well-Being of the Older Population in England: The 2008 English Longitudinal Study of Ageing (Wave 4), https://www.elsa-project.ac.uk/wave-reports.
Cribb, J., 2023. Understanding retirement in the UK. IFS Report R284, https://ifs.org.uk/publications/understanding-retirement-uk.
Cribb, J. and Emmerson, C., 2019. Can’t wait to get my pension: the effect of raising the female early retirement age on income, poverty and deprivation. Journal of Pension Economics and Finance, 18(3), 450–72, https://doi.org/10.1017/S1474747218000057.
Cribb, J. and Emmerson, C., 2022. Recent and future patterns of work around state pension age. IFS Report R212, https://ifs.org.uk/publications/recent-and-future-patterns-work-around-state-pension-age-0.
Cribb, J., Emmerson, C., Johnson, P., Karjalainen, H. and O’Brien, L., 2023. Challenges for the UK pension system: the case for a pensions review. IFS Report 255, https://ifs.org.uk/publications/challenges-uk-pension-system-case-pensions-review.
Cribb, J., Emmerson, C. and Karjalainen, H., 2023. The triple lock: uncertainty for pension incomes and the public finances. IFS Report R272, https://ifs.org.uk/publications/triple-lock-uncertainty-pension-incomes-and-public-finances.
Cribb, J., Emmerson, C., Karjalainen, H., O’Brien, L. and Sturrock, D., 2023. The planned increase in the state pension age from 67 to 68. IFS Comment, https://ifs.org.uk/articles/planned-increase-state-pension-age-67-68.
Cribb, J., Emmerson, C. and O’Brien, L., 2022. The effect of increasing the state pension age to 66 on labour market activity. IFS Working Paper 22/07, https://ifs.org.uk/publications/effect-increasing-state-pension-age-66-labour-market-activity.
Cribb, J., Emmerson, C. and Tetlow, G., 2016. Signals matter? Large retirement responses to limited financial incentives. Labour Economics, 42, 203–12, https://doi.org/10.1016/j.labeco.2016.09.005.
Cribb, J. and O’Brien, L., 2022. How did increasing the state pension age from 65 to 66 affect household incomes? IFS Report R211, https://ifs.org.uk/publications/how-did-increasing-state-pension-age-65-66-affect-household-incomes.
Della Giusta, M. and Longhi, S., 2021. Stung by pension reforms: the unequal impact of changes in state pension age on UK women and their partners. Labour Economics, 72, 102049, https://doi.org/10.1016/j.labeco.2021.102049.
Department for Work and Pensions, 2013. The single-tier pension: a simple foundation for saving. https://assets.publishing.service.gov.uk/media/5a7b622940f0b64646935cb1/single-tier-pension.pdf.
Department for Work and Pensions, 2017a. Independent Review of the State Pension Age: smoothing the transition. https://assets.publishing.service.gov.uk/media/5a81eb22ed915d74e3400c27/print-ready-independent-review-of-the-state-pension-age-smoothing-the-transition.pdf.
Department for Work and Pensions, 2017b. State pension age review. https://assets.publishing.service.gov.uk/media/5a829fe6e5274a2e8ab587f6/state-pension-age-review-final-report.pdf.
Department for Work and Pensions, 2023a. Independent Review of the State Pension Age 2022. https://assets.publishing.service.gov.uk/government/uploads/system/uploads/attachment_data/file/1146907/print-ready-state-pension-age-independent-review-2022.pdf.
Department for Work and Pensions, 2023b. State Pension Age Review 2023. https://assets.publishing.service.gov.uk/government/uploads/system/uploads/attachment_data/file/1147390/state-pension-age-review-2023-print-ready.pdf.
Department for Work and Pensions, 2023c. Benefit expenditure and caseload tables 2023. https://www.gov.uk/government/publications/benefit-expenditure-and-caseload-tables-2023.
Emmerson, C., Mikloš, M. and Stockton, I., 2023. Policy risks to the fiscal outlook. IFS Report 280, https://ifs.org.uk/publications/policy-risks-fiscal-outlook.
Finch, D. and Pacitti, C., 2021. Building a living pension: closing the pension savings gap for low to-middle income families. Resolution Foundation report, https://www.resolutionfoundation.org/publications/building-a-living-pension/.
Geyer, J., Haan, P., Hammerschmid, A. and Peters, M., 2020. Labor market and distributional effects of an increase in the retirement age. Labour Economics, 65, 101817, https://doi.org/10.1016/j.labeco.2020.101817.
Gruber, J., Kanninen, O. and Ravaska, T., 2022. Relabeling, retirement and regret. Journal of Public Economics, 211, 104677, https://doi.org/10.1016/j.jpubeco.2022.104677.
Hemming, R. and Kay, J. A., 1982. The costs of the State Earnings Related Pension Scheme. Economic Journal, 92(366), 300–19, https://doi.org/10.2307/2232442.
Lumsdaine, R. L., Stock, J. H. and Wise, D. A., 1996. Why are retirement rates so high at age 65? In D. Wise (ed.), Advances in the Economics of Aging, University of Chicago Press.
Marmot, M., Allen, J., Boyce, T., Goldblatt, P. and Morrison, J., 2020. Health equity in England: the Marmot Review 10 years on. Institute of Health Equity, https://health.org.uk/publications/reports/the-marmot-review-10-years-on.
Nazroo, J., 2022. Race/ethnic inequalities in health: moving beyond confusion to focus on fundamental causes. IFS Deaton Review of Inequalities, https://ifs.org.uk/inequality/wp-content/uploads/2022/11/Race-health-inequalities-final-IFS-Deaton-Review-Inequality.pdf.
OECD, 2019. Pensions at a glance 2019: country profiles – Denmark. https://www.oecd.org/els/public-pensions/PAG2019-country-profile-Denmark.pdf.
OECD, 2021. Pensions at a glance 2021: OECD and G20 indicators. https://www.oecd-ilibrary.org/finance-and-investment/oecd-pensions-at-a-glance_19991363.
OECD, 2023. Old-age dependency ratio (indicator). https://doi.org/10.1787/e0255c98-en.
Office for Budget Responsibility, 2022. Fiscal risks and sustainability – July 2022. https://obr.uk/frs/fiscal-risks-and-sustainability-july-2022/.
Office for Budget Responsibility, 2023. Fiscal risks and sustainability – July 2023. https://obr.uk/frs/fiscal-risks-and-sustainability-july-2023/.
Office for National Statistics, 2022a. Employee workplace pensions in the UK: 2021 provisional and 2020 final results. https://www.ons.gov.uk/employmentandlabourmarket/peopleinwork/workplacepensions/bulletins/annualsurveyofhoursandearningspensiontables/2021provisionaland2020finalresults.
Office for National Statistics, 2022b. Health state life expectancies by national deprivation deciles, England: 2018 to 2020. https://www.ons.gov.uk/peoplepopulationandcommunity/healthandsocialcare/healthinequalities/bulletins/healthstatelifeexpectanciesbyindexofmultipledeprivationimd/2018to2020.
Office for National Statistics, 2022c. Health state life expectancy, all ages, UK. https://www.ons.gov.uk/peoplepopulationandcommunity/healthandsocialcare/healthandlifeexpectancies/datasets/healthstatelifeexpectancyallagesuk.
Office for National Statistics, 2023. Ethnicity facts and figures: self-employment. https://www.ethnicity-facts-figures.service.gov.uk/work-pay-and-benefits/employment/self-employment/latest.
Pensions Commission, 2004. Pensions: challenges and choices: the first report of the Pensions Commission. The Stationery Office.
Pensions Commission, 2005. A new pension settlement for the twenty-first century: the second report of the Pensions Commission. The Stationery Office.
Pensions Policy Institute, 2020. Longevity inequality. PPI Briefing Note 125, https://www.pensionspolicyinstitute.org.uk/media/15onl20s/202012-bn125-longevity-inequality.pdf.
Pensions Policy Institute, 2022. UK pensions framework: trends, transitions and trade-offs in the UK pension system. PPI report, https://www.pensionspolicyinstitute.org.uk/media/ozepa5nq/20221129-trends-transitions-and-trade-offs-in-the-uk-pension-system-final.pdf.
Phoenix Insights, 2023. An intergenerational contract: policy recommendations for the future of the state pension. https://www.thephoenixgroup.com/media/0oxdzhdc/an-intergenerational-contract-report.pdf.
Portes, J., 2023. Unlocking the pensions debate: the origins and future of the ‘triple lock’. Political Quarterly, https://doi.org/10.1111/1467-923X.13330.
Rabaté, S., Jongen, E. and Atav, T., 2023. Increasing the retirement age: policy effects and underlying mechanisms. American Economic Journal: Economic Policy, forthcoming, https://www.aeaweb.org/articles?id=10.1257/pol.20210101&from=f.
Rabaté, S. and Rochut, J., 2020. Employment and substitution effects of raising the statutory retirement age in France. Journal of Pension Economics and Finance, 19(3), 293–308, https://doi.org/10.1017/S1474747218000392.
Raleigh, V., 2022. What is happening to life expectancy in England? The King’s Fund, https://www.kingsfund.org.uk/publications/whats-happening-life-expectancy-england.
Ray-Chaudhuri, S., Waters, T., Wernham, T. and Xu, X., 2023. Living standards, poverty and inequality in the UK: 2023. IFS Report R265, https://ifs.org.uk/publications/living-standards-poverty-and-inequality-uk-2023.
Staubli, S. and Zweimüller, J., 2013. Does raising the early retirement age increase employment of older workers? Journal of Public Economics, 108, 17–32, https://doi.org/10.1016/j.jpubeco.2013.09.003.
Thurley, D., 2020. State pension deferral. House of Commons Library, Briefing Paper CBP-2868, https://researchbriefings.files.parliament.uk/documents/SN02868/SN02868.pdf.
Thurley, D., 2021. State pension uprating. House of Commons Library, Briefing Paper CBP-5649, https://researchbriefings.files.parliament.uk/documents/SN05649/SN05649.pdf.
Thurley, D., Mackley, A. and McInnes, R., 2021. Increases in the state pension age for women born in the 1950s. House of Commons Library, Research Briefing 7405, https://researchbriefings.files.parliament.uk/documents/CBP-7405/CBP-7405.pdf.
Data
Banks, J., Batty, G. D., Breedvelt, J., Coughlin, K., Crawford, R., Marmot, M., Nazroo, J., Oldfield, Z., Steel, N., Steptoe, A., Wood, M. and Zaninotto, P., 2023. English Longitudinal Study of Ageing: Waves 0-9, 1998-2019. [data collection]. 39th Edition. UK Data Service. SN: 5050, DOI: http://doi.org/10.5255/UKDA-SN-5050-26.
Department for Work and Pensions, NatCen Social Research, 2021. Family Resources Survey. [data series]. 4th Release. UK Data Service. SN: 200017, DOI: http://doi.org/10.5255/UKDA-Series-200017.
Office for National Statistics, 2002. Family Expenditure Survey, 2000-2001. [data collection]. UK Data Service. SN: 4490, DOI: http://doi.org/10.5255/UKDA-SN-4490-1.
Office for National Statistics, 2023. Labour Force Survey. [data series]. 7th Release. UK Data Service. SN:
Endnotes
Authors

Jonathan Cribb
Jonathan joined IFS in 2011. His research areas includes: pensions, ageing and demographic change, public sector pay, housing, and inequalities.


Heidi Karjalainen
Heidi is a Senior Research Economist in the Retirement, Saving & Ageing sector. Her current research is on pensions and saving for retirement.
More from IFS
Understand this issue


Policy analysis


Academic research


