
Downloads
Download report PDF
PDF | 857.8 KB
Executive summary
Background
1. The working-age benefit system provides means-tested financial support to people with low incomes and assets, with additional support for those deemed to have certain disabilities, caring responsibilities or high housing costs. Means-tested support is also available for those above the state pension age (SPA) with low incomes and assets. Notably, the potential entitlements above SPA are much higher than those available below SPA, and this gap has grown substantially since the late 1990s. The standard full amount of means-tested support available through pension credit for a single person above SPA is 2.5 times the amount available for a single person out of work below the SPA through universal credit or jobseeker’s allowance.
2. Much of the state support for people above the SPA comes through the non-means-tested state pension, and receipt of means-tested support is more prevalent among working-age people than pensioners. Around 19% of the working-age population (aged 18–59) are in receipt of universal credit or legacy means-tested benefits at any point in time, compared with 15% of people above SPA in receipt of means-tested support (pension credit and/or pensioner housing benefit). The prevalence of means-tested support is also lower in the year before state pension age (at 14%) than earlier in working age.
3. Disability benefit receipt (which is not means-tested, but eligibility to which is determined based on an assessment of functional limitations and care needs) is much more prevalent among those above the SPA, as rates of disability – in particular due to poor physical health – increase with age. Around 14% of those above SPA are in receipt of disability benefits (without means-tested support), compared with 3% of those aged 18–59 and 9% of those one year below SPA (aged 65).
4. Increasing the SPA is a sensible approach to managing the public finance pressures arising from increased longevity at older ages, as noted in a previous report of the Pensions Review in December 2023. But increasing the SPA reduces average incomes of those affected, and this reduction is concentrated among those who were already out of paid work before state pension age. Increases in the SPA therefore increase income poverty rates. And income poverty rates among those just below SPA (aged 63–65) are higher than those among any other age group of adults (at 26% compared with 21% among those in their early 40s).That said, this does not necessarily give a full picture of their standards of living. The rate of material deprivation – a measure of whether the household reports it can afford some basic goods and services – is lower among the 63–65 age group (at 16%) than among the rest of the working-age population (at 19%).
5. While poverty rates among pensioners are lower than for the working-age population, there are some groups of pensioners where poverty rates are relatively high. The relative income poverty rate for pensioners who were privately renting in 2022–23 was 38%, compared with 34% among social renters and 12% among owner-occupiers. Private renters also have less security of tenure as landlords can increase rents, deny adaptations to the home or (at least at present) choose not to renew leases. Currently, only about 4% of pensioners are private renters, with 14% in social housing and the vast majority (82%) in owner-occupied housing. This means that, at the moment, the number of pensioners in relative income poverty who are owner-occupiers is higher (1.2 million) than the number of pensioners in relative income poverty who are social renters (0.6 million) or private renters (0.2 million). But issues around private renter pensioners are set to be more prominent in the future as current trends indicate that private renting in retirement will increase in prevalence – about 4% of those born in the 1940s were private renters in their mid 50s, compared with 10% of those born in the 1960s.
6. A key challenge facing the means-tested pensioner benefit system is low take-up of pension credit, with less than two-thirds of those eligible actually receiving this benefit.Pension credit tops up the incomes of low-income single pensioner households to £218.15 per week and couples to £332.95 per week. Around 1.3 million people were in receipt of pension credit in 2023–24, with older pensioners slightly more likely to be claiming it. In addition to the pension credit payments themselves, eligibility also ‘passports’ recipients to many other benefits such as (usually full) council tax support and, from Winter 2024–25, winter fuel payment. As the cliff edge in support for those who receive pension credit and those who do not grows, it becomes increasingly important that those who are eligible for pension credit receive it.
7. As the pension credit amount is now below the value of a full new state pension, future generations of pensioners will be less and less likely to be eligible for any pension credit, which also means over time fewer people will be passported to the additional benefits. These will increasingly only be available for those who have only spent a relatively small fraction of their working life in the UK, or those receiving additional amounts due to entitlement to disability benefits or carer’s allowance. At the moment, the new state pension is £3.05 per week above the pension credit, whereas someone entitled to the severe disability premium due to receiving certain disability benefits could have other income of £78.45 per week (or over £4,000 per year) above the new state pension, while still being entitled to pension credit. The gap between the new state pension and pension credit is also expected to increase over time as the new state pension rises each year in line with the triple lock, whereas pension credit increases are linked to average earnings growth.
Options for enhancing the working-age benefit system in response to a rising state pension age
8. Given that we know that increases in the SPA result in higher poverty rates among those affected, there is a case for spending some of the money saved on additional government support to offset some of these effects.This could also help maintain public and political support for the principle of increasing the SPA as longevity rises.
9. There are different ways in which additional support to those with low incomes before SPA could be targeted. One option is to introduce a higher universal credit (UC) standard allowance for those just below the SPA, which would target support to those in that age group with low incomes and assets. We model the effects of a policy where the universal credit standard allowance is increased by 70% for those one year below the SPA (reaching a level that is halfway between the current UC allowance and pension credit). This policy could benefit over 160,000 low-income households who would be entitled to a higher UC amount, reducing the relative income poverty rate for those within a year of the SPA by 5 percentage points and lifting 31,000 households above the poverty line. We model the cost of this policy to be around £600 million, which is a tenth of the exchequer gain coming from a one-year rise in the SPA (both costings assuming no behavioural change).
10. In addition to the direct cost to the public finances, this potential policy would reduce the financial incentive for those below the SPA to be in paid work – and those approaching retirement are known to be relatively responsive to such changes. This potential policy would give an out-of-work income of £670 per month for a single person, whereas under the current system people below the state pension age would have to work around 12 hours a week on the National Living Wage to achieve that income.
11. An alternative policy to targeting additional financial support to those affected by an increase in the SPA would be to increase the amounts that are paid to those on universal credit and receiving health-related benefits.Those in poor health face more difficulty in remaining in paid work, and those with disabilities experience higher levels of income poverty and material deprivation throughout working life compared with non-disabled people.
12. There are large differences in expected longevity between groups with different levels of wealth, and this can be seen as justification for providing additional support to all low-income and low-wealth households affected by state pension age increases. But beyond the differences in mortality by income and wealth levels, certain disabilities, such as having difficulties with activities of daily living (ADLs) or experiencing depressive symptoms before the age of 65, are associated with lower life expectancy. This is particularly true for those with lower educational qualifications – those with depressive symptoms before age 65 with no educational qualifications are 8% more likely to have died within the following 17 years than those without depressive symptoms, whereas there is no statistically significant association between depressive symptoms and mortality for those with a degree. This means that a one-year increase in the SPA will cut lifetime state pension entitlement for those in poor health (whose incomes are more likely to be reduced by increases in the SPA) by a bigger proportion, as they can expect to receive the state pension for fewer years than those in better health.
13. We model the effect of a policy that boosts universal credit payments by £80 per week for those within one year of reaching SPA and who are in receipt of disability benefits (personal independence payment (PIP) or disability living allowance (DLA)). This amount is close to the additional support paid for those on pension credit who are in receipt of these disability benefits. Because this policy is more narrowly targeted, it would be smaller in scale (at a cost of about £200 million per year) than providing extra support to all those receiving universal credit just below the SPA. It would also be slightly less directly targeted to those on the very lowest incomes, as disability benefit prevalence tends to be lower among those in the bottom tenth of households in terms of income (especially as incomes of those living with disability tend to be boosted by receipt of health-related benefits). This would mean that the reduction in the poverty rate among this age group would be smaller (1 percentage point for those within a year of the SPA, lifting 3,000 households above the poverty line).
14. An increase in universal credit allowances for people on disability benefits would weaken work incentives, though people receiving disability benefits are likely to be less responsive to these incentives in part because they are likely to already be out of work before being affected by the policy. However, this kind of policy would increase the financial incentive for people to apply for health-related benefits, also because many of those who start receiving working-age disability benefits will continue receiving them throughout retirement. Increased prevalence of health-related benefits since 2019 is already a concern, not least because of the enormous strain this is placing on the public finances.
15. In this report, we have chosen to model effects of increasing financial support for people up to one year below the SPA, and a government may want to introduce these types of policies at the same time as the SPA increases by a year. The state could of course also choose to provide more financial support to those further below the SPA. Or it could choose to target a narrower group, such as those within six months of the SPA. As illustrated above, there are trade-offs when it comes to implementing these policies, especially in terms of cost to the exchequer and work incentives. The younger the people affected by the policies, the more severe those trade-offs become. The government could also choose to go further (or less far) in terms of the generosity of these potential policies in ways other than the age groups affected. Making the system more or less redistributive is a political decision, and parameters that we have discussed here (as well as other aspects of the system) could be extended to do either.
16. A key feature of the means-tested benefit system below SPA is the ‘asset test’: people with assets of over £16,000 (including assets of any partner, and excluding primary residence and pensions) cannot receive any universal credit. This £16,000 limit has not been increased since 2006, which is a 40% real-terms cut. There is a strong case for at least uprating the asset test over time, as prices, earnings and average wealth have increased significantly over this period. This is particularly important in today’s pensions landscape where people are more likely to have sizeable defined contribution pension pots which they may access before reaching the SPA, currently from age 55. This may lead to some people inadvertently making themselves ineligible for means-tested benefits before SPA, as any assets withdrawn from a pension pot will be subject to the asset test. Lifetime ISAs, which can provide people – in particular the self-employed – a tax-efficient way of saving for retirement, should also be exempt from the asset test to align their treatment with other pension saving products.
The benefit system above the state pension age
17. We highlighted above the elevated poverty rates among pensioners living in private rented accommodation. While social renters are also a group that experiences relatively high poverty rates, private renters face a much lower level of state support than social renters. The maximum support for low-income single or couple private renters is (at the moment) equivalent to the 30th percentile of rents for one-bedroom properties in their area, regardless of whether such properties are readily available. At the same time, social renters face rents substantially below market rates and, above the SPA, are (unlike those below the SPA) not subject to what is known as the so-called bedroom tax, i.e. a reduction in their benefits for bedrooms that are deemed to be ‘spare’. Private renters also face additional risks, with less secure housing tenure and higher exposure to rent rises.
18. A government concerned about the situation facing pensioners in private rented accommodation could increase the generosity of housing benefit above state pension age. One way to do this could be by using an additional bedroom to calculate the housing benefit rate. This would mean that the maximum support available would be equivalent to the 30th percentile of rents for two-bedroom properties in the area for singles and couples (rather than one-bedroom). We have modelled the effect of this policy and found that it would immediately provide additional support to the approximately 130,000 pensioner households whose rents are not currently covered by LHA (local housing allowance) rates, at a cost of £150 million per year. The number of people affected, and the cost to the exchequer, would likely rise over time as the prevalence of private renting in retirement increases. Providing support for an additional bedroom could particularly help those in areas where there are relatively few one-bedroom properties available, those who want a bedroom to be available for children or grandchildren to come and stay in their own bedroom, and for couples who want the option of having a bedroom each. Those who only want a one-bedroom property could also gain, as more such properties would have rents that could be covered by LHA.
19. In order to address low take-up of pension credit, the government (as well as the previous one) has stated its commitment to integrating pensioner housing benefit and pension credit. Integration of the benefit system could go even further to integrate the working-age and pensioner benefit systems. This could have benefits such as improving claimant experience for those reaching SPA who are already receiving universal credit, making it easier for them to flow onto pension credit, and providing policymakers more flexibility in the treatment of couples with one below the SPA and one above it.
1. Introduction
The structure and generosity of means-tested benefit support available in the UK differ significantly for those below and above the state pension age (SPA) – the age at which people can first claim a state pension. Below the SPA, families with low incomes and assets can receive means-tested financial support, where the level of support, and the conditions attached to receipt of that support, vary according to factors such as household composition, assessed capacity to work, housing costs and certain formal caring responsibilities. In addition to the means-tested system, there are specific non-means-tested disability benefits and some, relatively limited, contributory benefits for unemployment or sickness following a period in paid work.
Above the SPA, by far the most important financial support from the state is largely universal, with the state pension providing a foundation for income in retirement for most UK pensioners. However, additional benefits are also available for pensioners with low incomes and wealth, disabilities or some formal caring responsibilities. These state benefits are important especially for lower-income pensioners – with benefits (excluding the state pension) making up 14% of the income for the lowest-income third of pensioners (Cribb, Henry and Karjalainen, 2024). With significant government spending and millions of benefit recipients, the means-tested benefit system plays an important role in supporting the incomes of poorer families in the run-up to, and beyond, SPA. The challenges facing it, and options for reforming it, are therefore key considerations for a review into the future of financial security in retirement, as undertaken in IFS’s Pensions Review.
The pensioner benefit system is much more generous than the working-age benefit system. As is shown in Figure 1.1, the gap in financial support has also widened over time, as the level of basic support available through pensioner benefits has increased significantly over time, particularly with the introduction of pension credit in 2003, while basic support from working-age benefits (through jobseeker’s allowance and subsequently through universal credit, UC) has remained relatively flat in real terms since the late 1980s. In addition, no conditions – such as work-search requirements – are attached to receipt of pensioner benefits. For working-age benefits, these often apply, and the stringency of conditions has increased considerably over this period.
Figure 1.1. Real levels of basic financial support through pension credit and jobseeker’s allowance / universal credit over time (April 2023 prices)
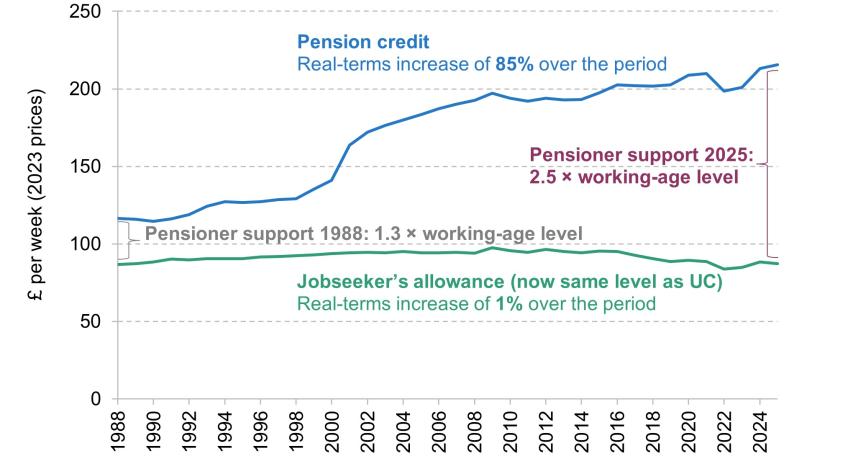
Note: Real levels in April of each year are shown. Cash values converted to real values (using the CPI index). Entitlements shown are for single adults with no other income. Working-age support is based on jobseeker’s allowance (JSA), although since universal credit roll-out this is no longer available for new claimants. However, universal credit with no enhancements is currently set at the same level as JSA. Note that other forms of support are available to low-income people who are out of work above and below the SPA, such as housing benefit.
Source: Department for Work and Pensions abstract of statistics 2023 (https://www.gov.uk/government/statistics/abstract-of-dwp-benefit-rate-statistics-2023) and authors’ calculations (for 2024 and 2025 rates).
In addition to the large and growing gap in state support available through the working-age and the pensioner benefit systems, the age from which the higher level of means-tested support is available has been increasing significantly. From 1988 to 2010, access to pensioner means-tested benefits started at the female state pension age of 60. This was true for both men and women – i.e. men aged between 60 and (their then SPA of) 65 could qualify for pensioner benefits despite being below the SPA. For couples this was true when the oldest member reached that age, meaning that some individuals could receive pensioner benefits well before age 60 if their partner had reached that age.
Since 2010, the age at which people can access the pensioner benefit system has risen. First, the female SPA has increased from 60 to 66, and the age that men and women can become eligible for pensioner benefits has risen along with it. In addition, many couples have seen particularly large increases in the age at which they can access the means-tested pensioner benefit system. This is because since 2019, couples can now only be eligible for pensioner benefits once both members of the couple have reached this age. This policy is known as the mixed-age couple rules (where ‘mixed age’ means a couple where one is aged below the SPA and one is aged above it), and it is now the case that someone can be aged significantly above the SPA but not be eligible for the pensioner benefit system because their partner is aged below the SPA.
The SPA, and therefore the age at which the means-tested pensioner benefit system starts, is legislated to rise further in coming years, to 67 by the end of 2028 and 68 by the end of 2046. Increasing the SPA is a coherent policy to help manage the public finance pressures arising due to rising longevity at older ages. Considerations around future increases in the SPA were examined extensively in a previous report of the Pensions Review in December 2023 (Cribb, Emmerson, Johnson and Karjalainen, 2023). In that report, we suggested a new four-point pension guarantee under which the SPA ‘will only rise as longevity at older ages increases, and never by the full amount of that longevity increase’ and that the state pension ‘should continue to be accessible from a single universal state pension age, rather than being made available from an earlier age at a permanently reduced amount’. However, a system that only allows people to claim a state pension or pensioner benefits from state pension age needs to make sure that there is appropriate other support available for low-income individuals approaching state pension age. In this report, we therefore explore options for adapting the working-age benefit system in response to a rising state pension age.
Another current issue facing the means-tested benefit system that we examine in this report relates to people above the state pension age. In particular, different groups of pensioners, even amongst those on similarly low incomes, often receive significantly different levels of means-tested support from the state as a result of either their housing tenure or their take-up of benefits. As we show, this translates into some groups of pensioners, such as single private renters, being more likely to experience income poverty than others. It is also striking that pension credit – the key form of means-tested support for pensioners – has very low rates of take-up compared with many other benefits. And unlike the benefit system below state pension age, where most means-tested support has been integrated into a single benefit (universal credit), there is no integrated benefit system for pensioners. As a consequence, a low-income working-age person receiving UC will find that their claim will end when they (or, if applicable, their younger partner) reach the SPA, and will need to apply for pension credit and for pensioner housing benefit if they are to receive those as a pensioner. We therefore examine the case for reform to pensioner housing benefit and the case for (and the considerations involved in) more integration of the working-age and pensioner benefit systems.
It is worth highlighting a related policy area that we do not consider in detail in this report. There has been rising concern about the numbers of people successfully applying for disability benefits, especially personal independence payment (PIP) which is the main disability benefit available for working-age people to claim (but which can continue to be received by pensioners who started receiving it during working age).1 Receipt of disability benefits for working-age people has risen significantly (Ray-Chaudhuri and Waters, 2024) and latest government forecasts project an enormous rise in spending in this area, from £36.3 billion in 2023–24 to £59.4 billion in 2029–30 (Office for Budget Responsibility, 2024a). While disability benefits are an important part of the welfare state, because they are not means tested and do not require individuals not to be in paid work, they do not have the same interaction with the state and private pension systems as other parts of the benefit system, and therefore are far less central to the concerns of the Pensions Review. We do provide some descriptive statistics on the caseload and spending on disability benefits and consider the issue of people being deemed unable to be in paid work before SPA because of poor health or disability, but in order to focus on the level of means-tested support, we do not address any issues around the design of disability benefits.
Another benefit that we will not cover in detail in this report is carer’s allowance.2 Carer’s allowance has been under media scrutiny recently, with some of the concerns arising from the cliff-edge nature of the earnings test for carer’s allowance (and how penalties for overpayments have been handled by the Department for Work and Pensions, DWP). The government has acknowledged these issues by increasing the weekly earnings limits in the Autumn Budget and launching an independent review into carer’s allowance overpayments. While carer’s allowance is an important benefit for carers, it is not a means-tested benefit (as there is no asset or income test apart from the earnings limit), and thus it will not be covered in this report.
The remainder of this report proceeds as follows. Chapter 2 provides background on government spending on benefits, the numbers of people receiving them and how the prevalence of receipt differs by age. Chapter 3 considers the means-tested support received by people in the run-up to SPA, the case for reform in this area, and how additional support to those below SPA could be targeted. Chapter 4 considers the means-tested support received by people above the SPA, especially housing benefit and pension credit. Chapter 5 concludes.
As part of this Pensions Review, we have also undertaken public engagement via online bulletin boards and focus groups. Throughout this report, we present the views and experiences of people on low incomes, both above and below the SPA, and also from people on low incomes with a disability or health issue. This engagement work was undertaken in July 2024.
2. Benefit receipt and spending above and below state pension age
To provide key context for the analysis in this report, this chapter contains key facts about benefit receipt and spending. We consider total amounts spent on different types of benefits, as well as how receipt of benefits changes by age, for those approaching and those above the SPA.
In order to understand better how benefit spending is split between working-age and pensioner households as well as between different benefits, Table 2.1 shows spending and caseloads (number of recipients) on working-age and pensioner benefits in 2023–24 (the latest out-turn data) and the forecast for 2029–30, including both means-tested and non-means-tested benefits.
Table 2.1. Key benefits for pensioners and working-age people in terms of caseload and spending in Great Britain
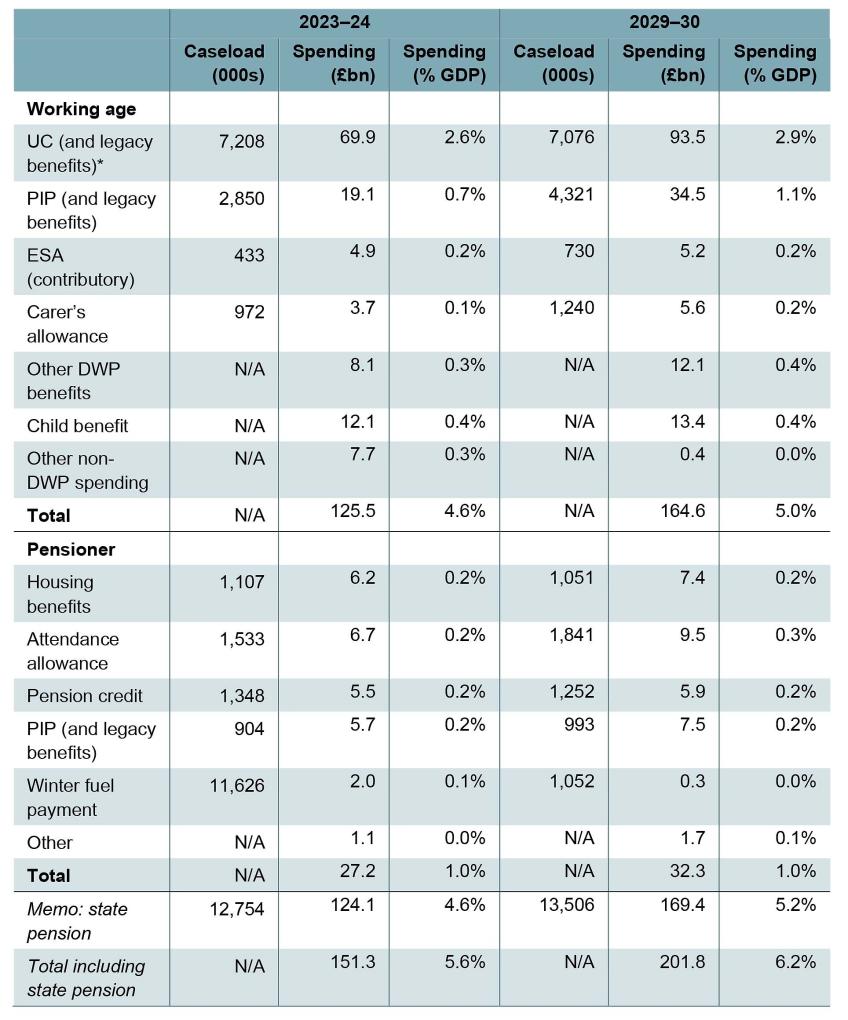
* Excludes the legacy benefits working tax credit and child tax credit (rolled into UC) as their costs are reported separately below (under ‘Other non-DWP spending’).
Note: Excludes cost of living payments in 2023–24. Excludes council tax support. UC – universal credit; PIP – personal independence payment; ESA – employment and support allowance.
Source: DWP benefit expenditure and caseload tables Autumn Statement 2024 (https://www.gov.uk/government/publications/benefit-expenditure-and-caseload-tables-2024).
Working-age benefit spending in 2023–24 was £126 billion which is equivalent to 4.6% of national income, with the largest components being UC and other means-tested legacy benefits (£70 billion or 2.6% of national income) and disability benefits (£19 billion or 0.7% of national income). These are also the largest DWP benefits in terms of caseloads – 7.2 million working-age people were receiving UC (or means-tested legacy benefits) and 2.9 million were receiving disability benefits in 2023–24.3 Child benefit (which 6.9 million families were receiving in August 20234) and council tax support (which 2.8 million working-age people were claiming in March 2024 in Great Britain5) are other important benefits for working-age people, with these being administered by HMRC and local authorities6 respectively (rather than the Department for Work and Pensions).
Spending on pensioner benefits, excluding the state pension, was significantly lower than working-age spending, at £27 billion (or 1.0% of GDP) in 2023–24. The largest components of pensioner benefit spending are the key means-tested benefits for pensioners – pensions housing benefit and pension credit (with spending of £6.2 billion and £5.5 billion respectively) which, being means tested, are therefore directed at poorer pensioners – as well as the (non-means-tested) disability benefits – attendance allowance (£6.7 billion) and PIP and its predecessor disability living allowance (DLA) (£5.7 billion).7 Around 1.1 million receive pensioner housing benefit, 1.3 million receive pension credit, 1.5 million receive attendance allowance and 0.9 million receive PIP or DLA. Around 1.6 million pensioners were also claiming council tax support in March 2024 in Great Britain.8 The vast majority of pensioners (12.8 million) are also in receipt of the state pension; spending on the state pension in 2023–24 was £124 billion or 4.6% of national income.
Looking at the projections for 2029–30, spending on both working-age and pensioner benefits is forecast to rise relative to GDP – working-age benefit spending from 4.6% to 5.0% of national income and pensioner benefit spending (including the state pension) from 5.6% to 6.2% of national income. It is worth noting that growth in pensioner spending over this period is depressed due to the SPA increasing from 66 to 67 between 2026 and 2028. Another change in spending is the fact that winter fuel payment will only be paid to those in receipt of pension credit, which is estimated to save the government £1.7 billion by 2029–30 (Office for Budget Responsibility, 2024a). Indeed, these forecasts show that while winter fuel payment was paid to 11.6 million households in 2023–24 at a cost of £2.0 billion, by 2029–30 only 1.1 million households will receive these payments, costing the government £0.3 billion. However, as described in Section 4.3, there is significant uncertainty in the exact costing of this policy due to the uncertain effect on pension credit take-up.
Support for low-income households with council tax in England, Wales and Scotland is administered by local authorities rather than the central government, which is why data on the council tax support schemes are not included in Table 2.1. Before 2013 the level of funding through council tax support was centrally set (and this remains the case in Wales and Scotland), but since 2013 local authorities in England have been required to design their own council tax support schemes. As a result, there is a great deal of variation in schemes across England for working-age people, whereas support for pensioners is still determined centrally and is generally more generous (Adam, Joyce and Pope, 2019). Pensioners on pension credit9 will also automatically be entitled to maximum council tax reduction, meaning most of those pensioners will not pay any council tax.
In addition to looking at total caseloads and spending on disability benefits, we can use administrative data on benefit combinations to understand better the prevalence of these benefits in the population. It is more informative to consider these benefit combinations rather than individual benefit caseloads, as many individuals will receive more than one benefit at any given time.
The charts below illustrate the prevalence of benefit receipt by age, differentiating between those below (Figure 2.1) and above (Figure 2.2) the SPA, and disaggregating the types of benefits received. We show the prevalence of means-tested benefits (in combination with any other benefits), the prevalence of receiving non-means-tested disability-related benefits only, and the prevalence of carer’s allowance (with or without disability benefits). The ‘Other’ category captures some relatively rare benefit combinations – though of course these still represent large numbers of households.
We use this split of benefits to understand how the prevalence of means-tested support, which is targeted to those with low assets and low incomes, varies with age, and how that compares with especially the prevalence of disability benefits. We may expect the prevalence of means-tested support to rise in the run-up to the SPA as employment rates decline. But working in the opposite direction, older age groups are also more likely to have built up more significant savings and may not qualify for means-tested benefits because of this. Means-tested benefits are also more generous for households with children, and those closer to SPA are less likely to have dependent children (under the age of 18).
Figure 2.1 shows the prevalence of benefit receipt among people aged 60–65 in England and Wales, just below the SPA of 66, comparing it also with the prevalence for younger working-age people (those aged 18–59) at one point in time, February 2024. We can see that the prevalence of means-tested benefits (shown in green) remains relatively stable across ages 60 to 65 at around 14%. This is lower than the prevalence of means-tested benefits among those aged 18–59 (19%). As described above, some of this is due to older households being less likely to have dependent children, but it also suggests that many of those out of work and/or on low incomes close to SPA may not qualify for means-tested benefits due to having assets above the asset test limit. There may also be differences in take-up rates, meaning that older working-age households could be less likely to claim benefits to which they may be entitled, although there is not enough evidence on take-up rates to assess whether this is a driver of these differences.
Figure 2.1. Prevalence of benefit receipt by age below state pension age in England and Wales, February 2024
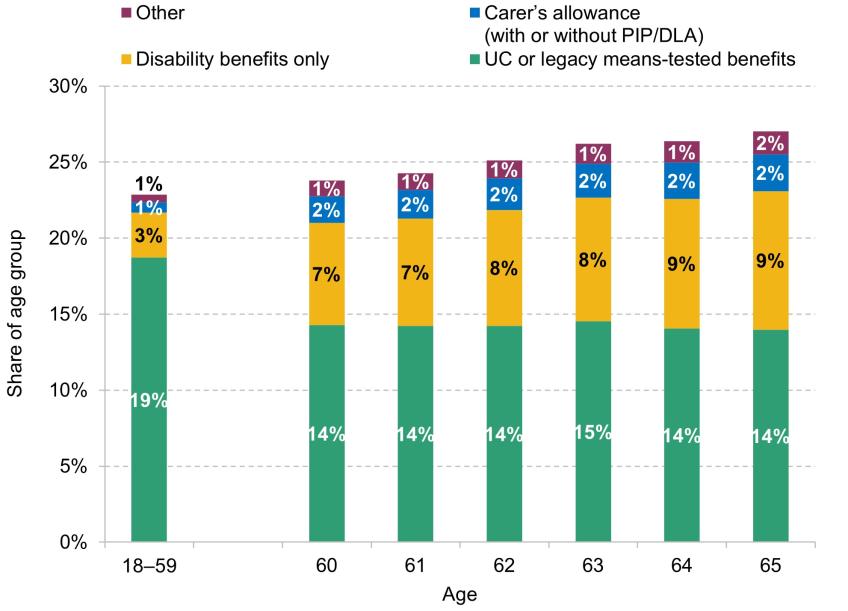
Note: Individual-level data. Disability benefits are defined as PIP, DLA, incapacity benefit and industrial injuries disablement benefit. Council tax support is not included as it is administered by local authorities rather than DWP.
Source: Authors’ calculations using Stat-Xplore benefit combination tables (February 2024) and ONS national mid-year population estimates (mid 2022).
We see a different pattern with disability benefit receipt (shown in yellow on Figure 2.1 for those only receiving disability benefits). Disability benefits are not means-tested but rather eligibility is based on being assessed as having a higher cost of living due to health-related needs. As health deteriorates with age, we also see the prevalence of disability benefits (without any means-tested benefits) rising with age, from 3% among those aged 18–59 to 7% among those aged 60 and 9% among those aged 65. Smaller numbers of people receive carer’s allowance with or without disability benefits10 (1–2% of the age groups) and other rarer benefit combinations, and there are no clear age trends in the prevalence of these benefits.
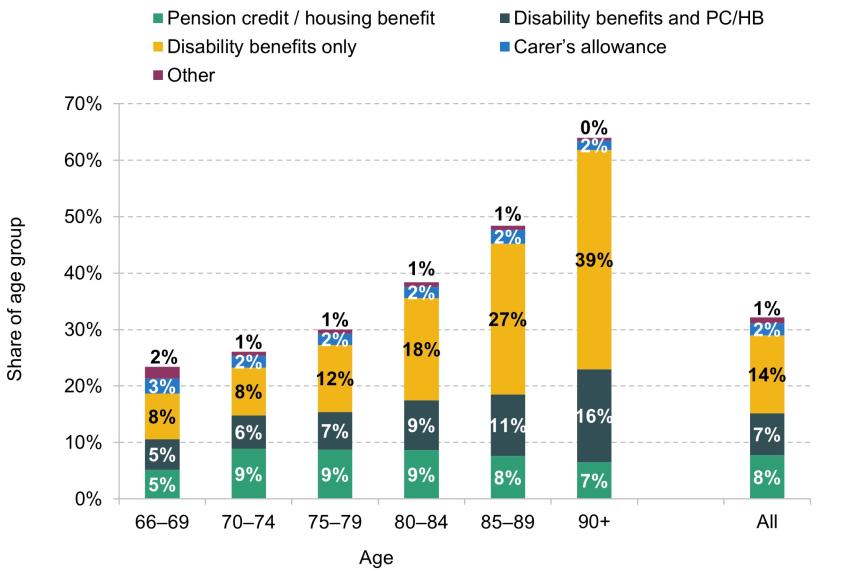
Figure 2.2 illustrates the prevalence of benefit receipt above the SPA at one point in time (May 2023). This chart excludes receipt of the state pension and the winter fuel payment. The prevalence of means-tested support is much lower among those above the SPA than among those below. Much of this difference is due to the fact that most pensioners receive non-means-tested support from the state pension, which in many cases, especially for those who have reached the SPA since April 2016 and are eligible for the new state pension, makes them ineligible for any additional means-tested support. This is also true for many of those receiving private pension income in addition to their state pension entitlement.
Figure 2.2. Prevalence of benefit receipt by age above state pension age (excluding state pension) in England and Wales, May 2023
Note: Individual-level data. Disability benefits are defined as PIP, DLA, incapacity benefit and industrial injuries disablement benefit. Council tax support is not included as it is administered by local authorities rather than DWP.
Source: Authors’ calculations using Stat-Xplore benefit combination tables (May 2023) and ONS national mid-year population estimates (mid 2022).
We also see that the prevalence of means-tested benefits above the SPA (pension credit and pensioner housing benefit) increases with age – the prevalence of these benefits with or without disability benefits increased from 11% among the 66–69 age group to 19% among those aged 85–89.11 This pattern is due to younger generations of pensioners having higher financial resources on average than older generations and, in particular, the fact that pension credit is set at a level just below the level of a full new state pension (to which people who have reached SPA since April 2016 are potentially entitled), meaning that those with a full new state pension are not entitled to pension credit (without the disability or caring components).
Disability benefit receipt in retirement rises sharply with age especially for those in their 80s and 90s. The main disability benefit for older people is attendance allowance. It differs from working-age disability benefits (PIP and DLA) in that it is intended to support older individuals with personal care needs as they age, whereas PIP is designed to help working-age individuals more generally manage their care and mobility needs. Receipt of attendance allowance is more closely linked to need for care, which explains why its prevalence only starts rising at older ages even when prevalence of poor health increases more gradually. The proportion of individuals receiving disability benefits (with or without additional means-tested support) was 13% for those in their late 60s (ages 66–69), compared with 38% for those in their late 80s (ages 85–89).
Summary
In this chapter, we have outlined key facts regarding benefit spending and receipt for pensioners and working-age people. In 2023–24, working-age benefit spending totalled £126 billion, equivalent to 4.6% of national income. The largest component in terms of spending was universal credit (and its predecessors) at £70 billion, followed by disability benefits at £19 billion. Spending on pensioner benefits, excluding the state pension, accounted for £27 billion, or 1.0% of national income, with spending on means-tested support and disability benefits both at around £12 billion each.
We have also shown how the prevalence of means-tested support and other benefit receipt changes with age. The prevalence of means-tested benefits is slightly lower for those in their early 60s than for those in earlier working age, and is relatively stable from age 60 to 65. On the other hand, the prevalence of disability benefits increases with age due to rising health-related needs. Among those above SPA, prevalence of the means-tested pension credit and housing benefit is higher for older pensioners, and the prevalence of disability-related support also rises significantly especially for those in their 80s and 90s.
3. Benefits for those out of paid work or on low incomes before the SPA
3.1 Means-tested benefits below the SPA
As noted in the introduction, there is a substantial difference in the generosity of means-tested benefits above and below SPA. This implies that the effects of increasing the SPA will be particularly felt by low-income families as they will be most likely to continue to receive less generous working-age benefits for longer. Consistent with this, previous research has shown that SPA increases push up measured poverty rates; the increase in SPA from 65 to 66 increased the absolute income poverty rate amongst 65-year-olds by around 15 percentage points from a baseline of close to 10% (Cribb and O’Brien, 2022). Indeed, Figure 3.1 finds that the income poverty rate for people in their mid 60s (26%) is higher than that for any other age group of working-age adults. This is also significantly higher than the relative poverty rate (AHC) among pensioners, which was 16% in 2022–23 (Cribb, Henry and Karjalainen, 2024).
Figure 3.1. Poverty and material deprivation rates by age, 2019–20 to 2022–23
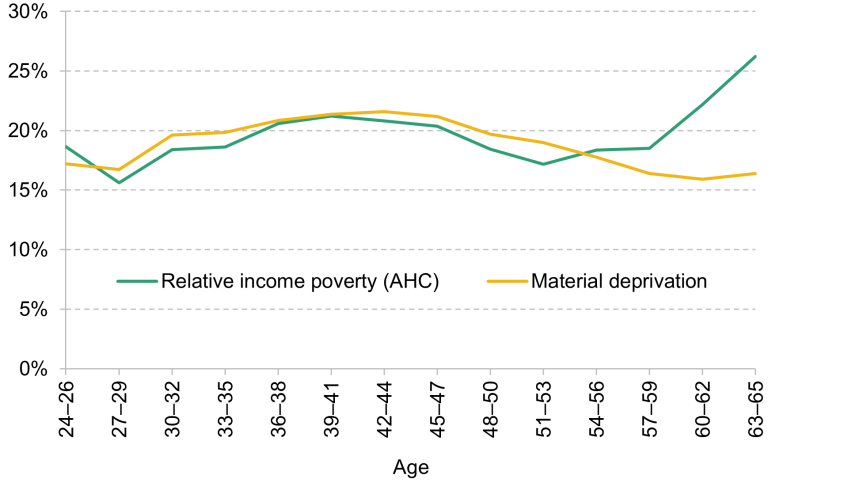
Note: Material deprivation is defined as not being able to afford some essential goods and services.
Source: Authors’ calculations using the Family Resources Survey 2019–20 to 2022–23.
However, income may not paint the full picture of people’s material living standards in the run-up to the SPA. Many older people have more savings to draw on and lower living costs (such as work-related expenses and/or childcare) than younger families, which can translate into higher living standards than are implied by household income. Consistent with that, Figure 3.1 illustrates that material deprivation – a measure of whether families can afford basic goods and services – is lower among the 63–65 age group (at 16%) than among younger working-age groups (at 19%).
However, it is clear that the reductions in household incomes that occur as the SPA rises are likely to be harder for lower-income people to adjust to, in particular those who are unable to respond by finding suitable paid work. The increases in income poverty for 65-year-olds that resulted from the increase in the SPA from 65 to 66 were concentrated on people who were not in paid work (Cribb and O’Brien, 2022), often for reasons such as health issues, unemployment or caring responsibilities. Increases in the SPA effectively extend the time these individuals navigate the less generous working-age benefit system rather than the higher level of support provided above SPA. Indeed, this reduction in the level of state support for the affected age group is the prime reason that increasing the SPA strengthens the public finances.
Concerns about the impact of increasing the SPA on poorer individuals have been significant, even among those who support raising it. For example, the Pensions Commission (2004) noted concerns over older people who are on low incomes before reaching the SPA, especially if life expectancy inequality would not significantly improve by the 2020s (which we now know to be the case). The first Independent Review of the State Pension Age (the ‘Cridland Review’) in 2017 (Department for Work and Pensions, 2017) also highlighted this issue, recommending that long-term carers and individuals with ill health or disabilities (for at least two years) should have access to means-tested pensioner benefits a year before the SPA rises to 68. More recently, Phoenix Insight (2023) made the case that a portion of the resulting saving to the exchequer from future increases in the SPA should be earmarked to lessen the impact of these rises on people with lower incomes and assets. The way in which differences in life expectancy across socio-economic groups make pension systems less progressive is considered as an important factor in pension policy reform in recent academic contributions (Giupponi and Seibold, 2024). Providing extra financial support could also help maintain political and public support for (or at least minimise resistance to) the principle of increasing the SPA as life expectancy rises.
Therefore, in this chapter, we consider two options for additional means-tested support that could be implemented to mitigate some of the effects of increases in the SPA on low-income individuals. We model these changes as applying to people one year below the SPA. Such support could therefore be introduced at the same time as the SPA is increased (i.e. it would apply to 66-year-olds as the SPA rises from 66 to 67 from 2026 to 2028). We model two options for how to target this additional support: (1) increasing the UC standard allowance for all of those on low incomes and (2) only doing so for those receiving health-related benefits.
While extending additional support below SPA could help alleviate financial pressures on poorer people, careful consideration must be given to the trade-offs involved, particularly around work incentives and public finance costs. We will also discuss those trade-offs, and how they differ between the two options we analyse, in this chapter. The extent to which these trade-offs are weighed against each other is largely a political decision. And the exact value of additional support, or the size of the group eligible for it, could be either increased or decreased depending on policymakers’ judgements on these trade-offs. It is worth noting that with the increases in the SPA that we have seen so far (from 60 to 66 for women and from 65 to 66 for men), successive policymakers have chosen not to put any mitigations in place. But, for example, if so desired, it would be possible to implement a combination of both of the options we describe.
If some form of enhanced support were deemed appropriate, there would be a separate decision over the ages at which it should be available. We model reforms that would apply for the year before an individual reaches the SPA, but this is purely illustrative; one could choose a longer or shorter period for an enhancement to apply.
3.2 Policy option: increase UC standard allowances below state pension age
The first policy option we consider is increasing the UC standard allowance for people a year below the SPA. Standard allowances are the basic amounts that singles or couples receive through UC if they have income and assets below certain thresholds, before taking into account any additional entitlements for other support (e.g. due to incapacity to work or for having children in the household). A higher standard allowance would immediately benefit households currently receiving UC, and would also bring some people who currently have incomes that are slightly too high for entitlement onto UC (at lower levels of entitlement, as the standard allowance is tapered away at a rate of 55%).
To understand the impact of this potential policy change, we use the IFS tax and benefit microsimulation model, TAXBEN. This model allows us to estimate the potential effects of the proposed changes on household incomes and poverty rates. The results assume that there will be no behavioural changes among the affected population, meaning that people will not alter their work or saving behaviour in response to the changes. In reality, changes in incentives will affect behaviour for at least some people, and we will also discuss the way in which this policy affects such incentives.
We model an increase in the UC standard allowance for single individuals who are within one year below the SPA to a new level set approximately halfway between the current UC standard allowance and the value of pension credit (to which people above SPA with low incomes are entitled). This would be an increase of 70%. We also increase the UC standard allowance for those in couples by 70% to maintain the relativity between the two. As set out in Table 3.1, this would imply an increase in the monthly UC standard allowance from £393.45 to £668.85 for singles and from £617.60 to £1,049.90 for those in couples. In other words, single recipients of UC aged 65 would see their monthly income increase by £275.40 while all couple UC recipients of this age would see their monthly income increase by £432.30.12 This higher rate would partially bridge the gap between the working-age and pensioner benefit systems for those with low incomes before reaching the SPA.
Table 3.1. UC standard allowances (per month) for singles and couples within one year below the SPA: current and under a potential policy reform
| Current rate | Potential rate for those aged 65 (per month) | Increase | Increase (%) |
Single | £393.45 | £668.85 | £275.40 | 70.0% |
Couple | £617.60 | £1,049.90 | £432.30 | 70.0% |
Note: Amounts refer to financial year 2024–25. Couples where one person is 65 and the other person is either below or above 65 would get the higher amount under the reform.
Source: DWP benefit and pension rates 2024 to 2025 (https://www.gov.uk/government/publications/benefit-and-pension-rates-2024-to-2025/benefit-and-pension-rates-2024-to-2025) and authors’ calculations.
This policy option would increase entitlements for the approximately 135,000 individuals in households with a 65-year-old currently entitled to UC, while also bringing an additional 31,000 households into eligibility for UC. Those in the latter group would gain smaller amounts, as they have higher incomes from other sources, meaning that more of their entitlement would be tapered away.
As is shown in Figure 3.2, this option is well targeted at the poorest households as those towards the very bottom of the income distribution are most likely to be in receipt of UC. On average, this change would increase the income of the poorest 10% of people within a year of reaching SPA by around £2,500 per year (48%). There would also be significant effects on the incomes of others in the bottom half of the income distribution, with little effect on those on above-average incomes. As a result, we estimate that this policy would reduce the relative poverty rate among people within one year of reaching the SPA by around 5 percentage points, lifting approximately 31,000 households above the relative income poverty line (after deducting housing costs). The estimated cost of this option is around £0.6 billion per year.
Figure 3.2. Changes in household income from a 70% boost to the UC standard allowance among those within a year of reaching SPA, by household income decile
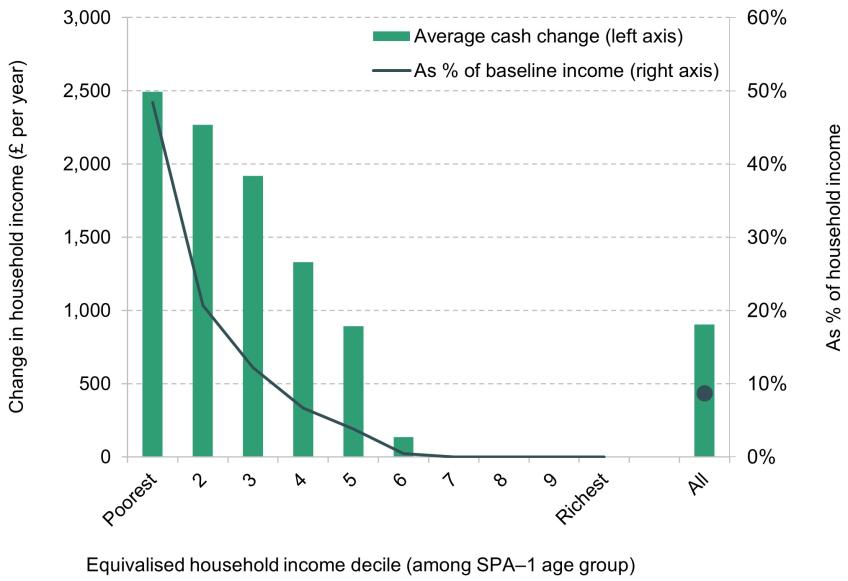
Note: Income deciles are calculated based on equivalised incomes before deducting housing costs among benefit units with at least one 65-year-old in them.
Source: Authors’ calculations using TAXBEN, the IFS tax and benefit microsimulation model.
As described above, this policy can be seen as a way to mitigate some of the effects of a higher SPA on low-income and low-asset households. The cost of this policy is modest compared with the exchequer savings that can be achieved through a higher SPA – the overall modelled cost of the policy would be about a tenth of the £6 billion gain for the exchequer coming from increasing the SPA by an additional year.13
Figure 3.3 illustrates how the distributional impact of increasing the SPA would change as a result of this additional support. The graph shows the reduction in income resulting from a higher SPA in pound terms and relative to the baseline income (including the new state pension), as well as the net effect on incomes after taking into consideration the higher UC standard allowance suggested in this section. It shows that a higher SPA has a similar effect across the income distribution in terms of the pound amount change in incomes, but the change in incomes relative to baseline income is much larger for poorer households. This means that the policy of increasing the SPA is regressive. The higher UC standard allowance makes the policy slightly less regressive, helping mitigate the effects of the higher SPA on some of the poorest households.
Figure 3.3. Decrease in income resulting from a higher SPA, and change in income taking into account a 70% boost to the UC standard allowance, by household income decile
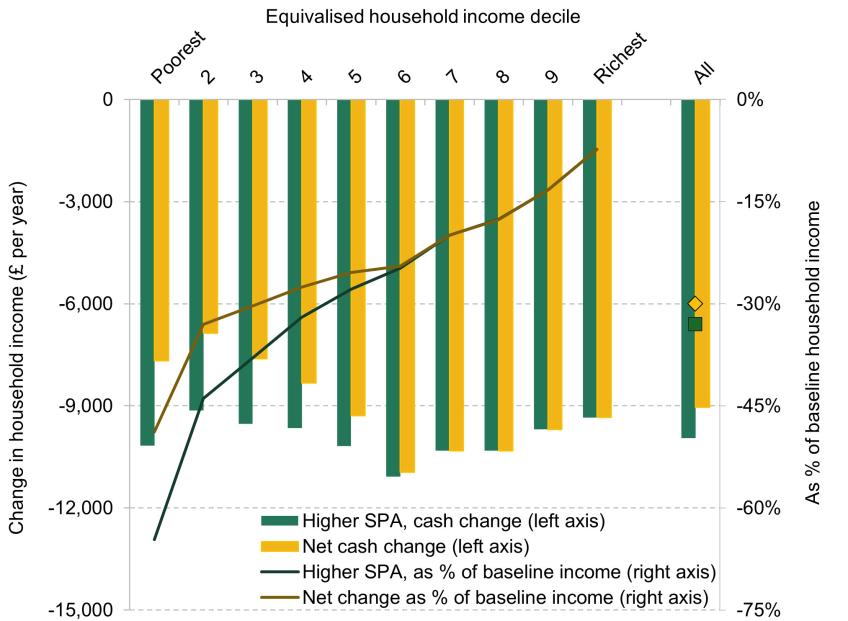
Note: Income deciles are calculated based on equivalised incomes before deducting housing costs among benefit units with at least one 65-year-old in them. The difference between the pound amounts corresponds to the bars in Figure 3.2. The relative changes are calculated based on a baseline with the new state pension.
Source: Authors’ calculations using TAXBEN, the IFS tax and benefit microsimulation model.
Work incentives
Any proposal for changes to means-tested support needs to consider carefully the impact it would have on incentives, and how people might respond to those incentives – for example, to be in paid work or to save. Raising the value of out-of-work benefits will reduce the incentive to work for those eligible (or potentially eligible) for them, which could reduce the number of hours people spend in paid work.
International evidence suggests that the employment decisions among individuals approaching retirement can be particularly sensitive to financial incentives to work. For example, results from a recent project looking across a range of high-income countries suggest that employment rates among people in their 60s are responsive to the implicit tax they face on work (Börsch-Supan and Coile, 2023).
Figure 3.4 shows the effect that a higher UC standard allowance would have on work incentives, by showing the net (post-tax-and-benefit) income of a single person depending on the number of hours worked at the National Living Wage. For simplicity, we assume the person has no housing costs, disability or dependent children. The yellow line represents total income under the current system, while the green line shows total income with the increased UC standard allowance considered here.
Figure 3.4. Net income based on number of hours worked on National Living Wage (2024–25): current system and under the considered policy option
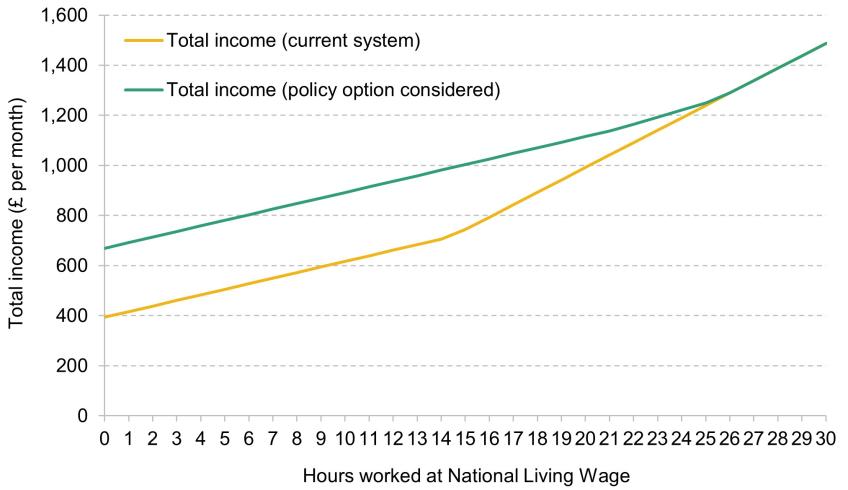
Note: No partner, no dependent children, no housing costs and no disability. National Living Wage at £11.44 (2024–25 rate). Current UC amount £393.45 per month; higher UC amount under considered policy £668.85. Assumes no pension contributions.
This example shows that for those already receiving UC – for example, someone working 14 hours a week or less – the boost to the UC standard allowance means they could cut their hours of work and have the same, or higher, net income. In other words, this policy reduces the incentive to work as many hours for those already receiving UC. This policy would also bring more people onto universal credit, in particular those working between 15 and 25 hours per week in our example. For these people, the reform would boost their incomes and would mean that they now face the UC taper of 55%. Both these effects reduce the incentive to work as many hours for the people brought onto UC.
In addition to the cliff edge in the level of means-tested support available for those out of work below and above the SPA, the current system has a significant change at state pension age in terms of ‘conditionality’ requirements. UC is designed to encourage employment among working-age people, meaning that people out of work or working few hours (for reasons other than disability or caring) are required to look for work (or additional work). In order to be eligible to receive UC, those with no health-related reason or caring responsibilities have to agree to spend 35 hours per week searching for work and to accept work if it is offered. Those who fail to comply with these rules can face benefit ‘sanctions’ (periods of time in which benefits are reduced or not paid).
Under the policy suggestion in this section, those receiving an enhanced UC in the year before SPA would still be subject to the same conditionality (with threat of sanctions) as younger people. In principle, the conditionality requirements could be eased. Policymakers may be less worried about reducing the financial incentive to work for people in these age groups as some of them might find it hard to get work, for reasons such as lack of job opportunities, mismatch of skills or age discrimination. For example, the Cridland Review (Department for Work and Pensions, 2017) suggested that those close to the SPA could have their conditionality requirements adjusted so that they can only be required to find part-time work, without being penalised for doing so. However, in our analysis, we have not proposed or modelled effects of any changes to this work conditionality.
Summary
There is a large and growing gap in the level of means-tested support available to those above and below the SPA. In this section, we have modelled the effect of a policy that would boost the UC standard allowance for those one year before SPA, in order to partially bridge this gap in the level of means-tested support available. This policy option could be viewed as a way to mitigate the effects of increasing the SPA – higher UC standard allowance provides support to the poorest households, reduces poverty rates, and lessens the regressivity of increasing the SPA at a cost that is a tenth of the savings generated by raising the SPA.
However, raising the value of out-of-work benefits can reduce the incentive to work, and international evidence suggests that employment decisions among individuals approaching retirement can be highly sensitive to financial incentives. These trade-offs will have to be carefully considered when designing this kind of policy, balancing the benefits of reducing poverty and increasing incomes for the poorest households against the potential disincentives for this age group to remain in the workforce.
3.3 Health-related benefits below the state pension age
In this section, we discuss recent health trends in the UK, as well as the level of support available to working-age people who are deemed to have limited capacity for work-related activities. We also discuss analysis looking at the associations between health conditions at older working ages and mortality. This section sets the scene for why there may be a case for providing additional means-tested support to those approaching SPA who are unable to remain in paid work due to poor health, especially as the SPA continues to increase.
Recent health trends
Longevity at older ages has risen significantly in recent decades (Office for National Statistics, 2024a), providing a key justification for a higher state pension age. However, increasing the state pension age also leads to more working-age people with disability or work-limiting health conditions, as health on average tends to decline as people age (Banks, Karjalainen and Waters, 2024). While it is also true that life expectancy has risen faster than the SPA since its introduction (Cribb, Emmerson, Karjalainen et al., 2023), there is increasing evidence that improvements in health have stalled in recent years.
After steady gains in life expectancy throughout the 19th and 20th centuries, progress has slowed since 2010. Increases in life expectancy at birth and at older ages have stagnated, with figures for 2021–23 in England and Wales showing lower life expectancy compared with pre-pandemic levels (Office for National Statistics, 2024a). The reasons for this slowdown are debated, but likely factors include the growing complexity of medical conditions, widening health inequalities, slowing improvements in cardiovascular mortality, severe flu seasons in the 2010s and the impact of the COVID-19 pandemic (Raleigh, 2024). At the same time as life expectancy growth has slowed, healthy life expectancy has declined since 2010. Healthy life expectancy, defined as years spent in ‘very good’ or ‘good’ health (based on how individuals perceive their general health), was lower for both boys and girls born in 2020–22 than in 2011–13 (Office for National Statistics, 2024b).
The Office for Budget Responsibility (2024b) attributes these recent health trends to three key underlying factors. First, pre-pandemic physical health outcomes showed a mixed picture: for example, while improvements in cardiovascular mortality continued, prevalence of lung and obesity-related conditions rose. Second, both survey and administrative data indicate rising rates of mental ill health in recent decades. Finally, the pandemic affected population health in multiple ways. About 2 million adults in the UK reported having ‘long COVID’ in March 2023, and the pandemic also exacerbated pre-pandemic mental health trends, particularly in terms of the number of adults reporting anxiety and depression. The pandemic also resulted in delays and increased waiting lists for accessing health services, and this lack of sufficient provision of healthcare is likely to exacerbate poor health and disability among the population. For example, recent evidence from a survey of 50- to 65-year-olds showed that 26% of those without work and struggling financially say they are on an NHS waiting list which is affecting their ability to work (Otto, 2024).
Health-related benefits
There are different state benefits available to working-age people with limiting health conditions. UC provides income support for households with low incomes and limited assets, and individuals who are determined to have limited capability for work or work-related activity may receive an additional amount of support within UC. Contributory employment and support allowance (ESA) is available for a maximum of one year to those who are unable to work due to a health condition or disability and have paid or been credited with enough National Insurance contributions in the two full tax years before their claim. The non-means-tested health benefit PIP (and previously DLA) is available to individuals who are deemed to need help with the higher cost of living they face due to their disability. Despite this additional state support available to those who face higher costs of living or are unable to work due to their disability before reaching the state pension age, disabled working-age individuals are more likely to experience high rates of income poverty and material deprivation than non-disabled people (Cribb, Karjalainen and Waters, 2022).
In this report, we will not focus on working-age health benefits in general, but rather discuss policy options for those in poor health close to SPA with low incomes and assets. The health element of UC is paid to those who, due to their illness or disability, are deemed to have limited capability for work- and work-related activity (LCWRA). The claimant’s capacity to work is assessed at a Work Capability Assessment, through questions on how well the individual can carry out a range of activities. This is separate from the assessment for entitlement to PIP (which assesses the extent to which the individual cannot complete daily activities such as bathing and feeding themselves unaided and requires help with extra costs as a result).
The level of means-tested state support available to people with work-limiting health conditions has changed over time. Figure 3.5 illustrates the level of means-tested state support (which therefore does not include the non-means-tested disability benefits) for those below and above SPA who are deemed to have limited capability for work-related activity, distinguishing between individuals receiving and not receiving PIP or DLA. In the charts, the dashed vertical grey lines in 2019 show when we assume a shift from the legacy systems to universal credit (in practice, it occurred more gradually).14
Figure 3.5. Level of state support (excluding disability benefits) below and above SPA for a person in receipt of ESA (support group) or UC with LCWRA element

Note: For a single person with no housing costs and no other income. In April 2024 prices (CPI indexed). Pensioner support is equivalent to pensioner credit and disability premium. Working-age support after 2019 is equivalent to UC standard allowance and UC LCWRA element. Panel A: working-age support before 2019 is equivalent to ESA basic rate, support group component, enhanced disability premium and severe disability premium. These are available to those receiving the PIP or DLA care / daily living component at the highest rate. Panel B: working-age support before 2019 is equivalent to ESA basic rate, support group component and enhanced disability premium.
Source: Authors’ calculations using TAXBEN, the IFS tax and benefit microsimulation model.
Panel A shows that working-age individuals with limited capability for work-related activity who are receiving disability benefits (PIP or DLA) experienced a significant drop in the level of support following the switch to UC, whereas pensioners have seen relatively stable support levels. In other words, working-age individuals with limited capability for work-related activity receiving PIP or DLA generally received more generous support under the old benefit system than under UC.
Panel B shows a similar trend for those with limited capability for work-related activity who are not receiving PIP or DLA. Again, support for pensioners is relatively stable over time, whereas for working-age individuals the level of means-tested benefit support has risen compared with the legacy systems. Overall, while UC is slightly more generous for working-age individuals who are deemed to have limited capability for work-related activity but who are not receiving PIP or DLA, it tends to be less generous for disabled individuals who have higher needs (and are receiving PIP or DLA).
As illustrated in earlier IFS analysis (Cribb, Emmerson, Johnson and Karjalainen, 2023), there are large differences in expected longevity between groups with different levels of wealth which lead to large differences in expected lifetime state pension entitlement between these groups. As the state pension age rises, one concern is that the increase will have a larger proportional effect on lifetime state pension entitlement for those with lower levels of wealth, as they have lower life expectancy and can expect to receive the state pension for less time. But if there are differences in mortality by health conditions beyond those explained by income and wealth, this could justify targeting state support particularly to the groups in poor health. Table 3.2 shows analysis from the English Longitudinal Study of Ageing (ELSA) that explores the link between two health factors – having difficulties with at least one of the activities of daily living (ADLs)15 and experiencing depressive symptoms between the ages of 50 and 64 – and mortality over a 17-year period. The analysis is segmented by levels of educational attainment: no educational qualifications, some educational qualifications, and having a degree (or equivalent). The coefficients reported can be interpreted as percentage point effects, and standard errors are presented in parentheses.
Table 3.2. Percentage point association between difficulties with ADLs or having depressive symptoms for people aged 50–64 in 2002–03 and mortality over the following 17 years
Association between health issues and mortality for those with: | Having difficulty with any ADLs before age 65 | Having depressive symptoms before age 65 |
No educational qualifications | 9.3ppt*** | 8.2pppt*** |
Some educational qualifications | 10.8ppt*** | 3.5ppt** |
Degree (or equivalent) | 7.4ppt** | 3.3ppt |
Share of age group deceased over 17-year period | 14.7% | |
Observations | 5,264 | |
Note: *** denotes a p-value less than 0.01, ** denotes a p-value less than 0.05 and * denotes a p-value less than 0.1. Robust standard errors are in parentheses. Reported coefficients are from running a linear probability model, with the outcome ‘having died by April 2018’. In addition to variables shown in the table, the other independent variables are: sex, quintiles of wealth and income distribution, five-year birth cohort and single year of age dummies. Estimated coefficients (and standard errors) are multiplied by 100 to be interpretable as percentage point effects. Sample is people observed at ages 50–64 in wave 1 of ELSA (2002–03).
Source: Authors’ calculations using English Longitudinal Study of Ageing.
The table shows that both having limitations in ADLs and experiencing depressive symptoms before age 65 are associated with significantly higher mortality rates, and this association tends to be stronger for individuals with lower educational qualifications. For example, those with limitations in at least one ADL before age 65 with a degree (or equivalent) are 7.4 percentage points more likely to have passed away over the following 17 years than those with no such limitations. The association for those with no qualifications is slightly larger at 9.3 percentage points. These effects are large compared with the baseline probability of this group dying over the 17 years, which is around 15%. In this analysis, we also control for income and wealth quintiles, meaning that the associations between health conditions and mortality remain even after taking into account differences in mortality by income and wealth.
The gaps in mortality by education are larger for depressive symptoms. For those without qualifications, depressive symptoms are associated with an 8.2 percentage point higher probability of mortality, whereas for those with a degree (or equivalent) there is no statistically significant relationship between depressive symptoms before 65 and mortality.
Some other countries in Europe have limited the impact of increasing pension eligibility ages by introducing special rules for people who started working early, and in many cases allowing them early access to the old-age pension scheme. This is a way of allowing those who have fewer years of education to access their pension earlier, as lower-educated individuals are more likely to have worked in physically demanding jobs and face on average lower life expectancy (OECD, 2023).
However, analysis of an early-access scheme in Germany showed that the health of those who retired through an early-starter scheme was no worse than the health of those who were not able to access this scheme (Börsch-Supan et al., 2022) and that they in fact had relatively high lifetime earnings. A similar analysis from an early-access scheme in France showed that those retiring early through the early-access scheme were in better health at retirement than people who retired through the general old-age pension scheme. This is because early-starter schemes tend to also require a long career (for example, a 42-year career in France at the moment), which means that only comparably healthy people who have been able to work most of their adult life can benefit from the scheme (Aubert, 2023). These examples illustrate the difficulty in targeting additional support to individuals with lower life expectancy purely based on length of careers, and suggest that targeting based on actual health conditions may better help target support to those with lower life expectancies.
The public engagement work highlighted some support amongst lower-income people for offering greater financial assistance to people below the state pension age and on universal credit, especially those who had poor health or a disability.
‘Ten years is a long time to wait for your state pension if you are too ill to work. The worry and having to live on a reduced income cannot help with their health issues.’
Male, aged 76, pension credit, private renter
‘I would say that it would be such a good help, as although the pension age has increased because people are living longer, no one has told people’s bodies that. For myself, I have become unwell but not quite reached pension age so I struggle a lot to live on UC. Particularly with having no mortgage help unless I take out further debt.’
Female, aged 60, universal credit, homeowner
Summary
Increasing the SPA is a sensible approach for addressing public finance challenges in the context of rising longevity at older ages. However, a rising SPA may lead to more working-age people in poor health, as health tends to decline with age. This is particularly worrying in the context of recent signs that health improvements are slowing down or even reversing.
Many of those in poor health and unable to remain in paid work before reaching SPA may also face financial difficulties. The level of means-tested support for working-age individuals with the most severe health conditions, who are deemed to have limited capacity for work-related activities, has fallen significantly since the transition from legacy benefit systems to universal credit. Given that poor health in one’s 50s and 60s is linked to higher mortality, individuals in poor health are also expected to receive state pension benefits for a shorter duration. These trends suggest that, with the state pension age continuing to rise, increased support for those near SPA with limited capacity for work due to health conditions (and low incomes and assets) may be warranted.
While some countries allow those with the longest careers to access pensions early, evidence suggests this approach does not effectively target additional support to individuals with the highest mortality risk or lowest lifetime wealth. Therefore, as previously outlined in a Pensions Review report on the state pension system (Cribb, Emmerson, Johnson and Karjalainen, 2023), we propose that instead of early pension access, any additional support for those with poor health should be provided through the means-tested working-age benefit system. The next section discusses our analysis of a policy to increase means-tested health-targeted support for those in the year below the SPA.
3.4 Policy option: increase means-tested health-related support below state pension age
To address the challenges faced by low-income individuals approaching the SPA in poor health, we analyse a policy option that would target additional spending at this group. Specifically, we model increased support for people living with disability through additional amounts paid under UC, as this will target support to those disabled people with relatively low incomes and assets.
This option targets additional support to those who are within one year below SPA and receive disability benefits as well as UC. Specifically, we model a policy that boosts UC by up to £80 per week for families with a 65-year-old receiving PIP or DLA.16 We choose this amount as it is close to the pension credit disability award, although it is somewhat arbitrary and there may be good reasons to choose an amount lower or higher than this. And, as with the reform modelled in Section 3.2, one could choose to apply such a policy to a wider or narrower age group than those within one year of reaching the SPA.
This policy option would benefit the approximately 37,000 households currently receiving both UC and PIP/DLA within a year of the state pension age, while also bringing an additional 2,000 households who are currently receiving PIP/DLA into the UC system. This policy is smaller in scale compared with extending the base UC rate for all (as discussed in Section 3.2), but is still targeted towards those in the bottom half of the income distribution.
Figure 3.6 illustrates the expected effects of this policy on household incomes, with changes broken down by income decile (where household income is measured excluding income from PIP/DLA as these are intended to compensate for additional costs) for those within one year of reaching the SPA. The green bars and left-hand axis represent the average cash change per year, while the line shows on the right-hand axis the change as a percentage of baseline income. As shown, households in the fourth deciles experience the largest gains, with average cash changes of around £1,400 per year. This is because prevalence of PIP and DLA is lower among the poorest households and highest among the fourth income decile. This means that this additional support would not be as closely targeted at the very bottom of the income distribution as the previous policy option that we presented. Overall, this policy is estimated to reduce the relative poverty rate among those within one year of reaching the SPA by around 1 percentage point, lifting approximately 3,000 households out of poverty (measured as relative income poverty after deducting housing costs), at a cost of around £0.2 billion per year.17
Figure 3.6. Changes in household income from an increase in UC for people receiving disability benefits among people within a year of reaching SPA, by household income decile
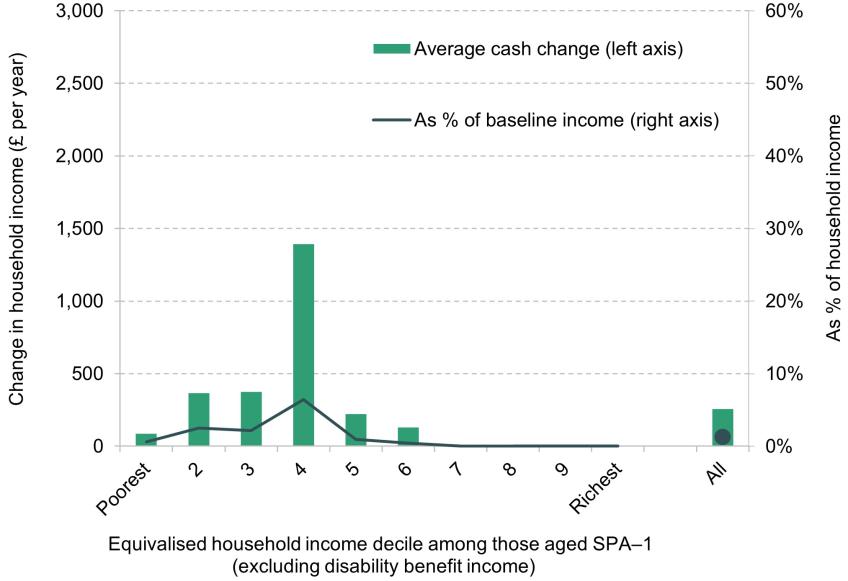
Note: Income deciles are calculated based on equivalised incomes before deducting housing costs excluding income from PIP and DLA among benefit units with at least one 65-year-old in them.
Source: Authors’ calculations using TAXBEN, the IFS tax and benefit microsimulation model.
As with Figure 3.3, in Figure 3.7 we illustrate how the income changes resulting from this policy compare with the reduction in incomes from a higher SPA. Again, the graph shows that the change in incomes resulting from the increase in the SPA is much larger for poorer households relative to their baseline income. Increasing the UC health element helps mitigate some of this decrease in incomes especially for those in the second, third and fourth income deciles.
Figure 3.7. Decrease in household income from a higher SPA, and change in income taking into account a higher UC health element, by household income decile
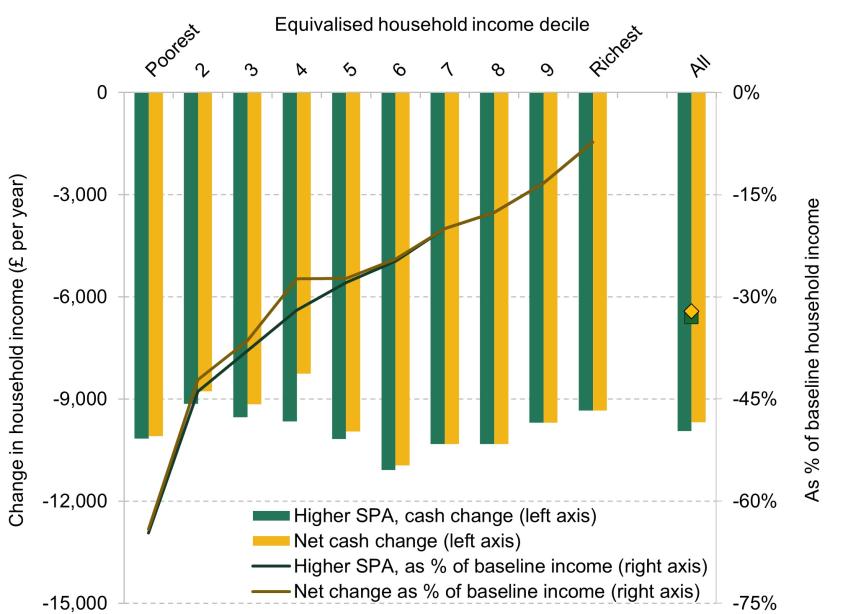
Note: Income deciles are calculated based on equivalised incomes before deducting housing costs among benefit units with at least one 65-year-old in them. The difference between pound amounts corresponds to the bars in Figure 3.2. The relative changes are calculated based on a baseline with the new state pension.
Source: Authors’ calculations using TAXBEN, the IFS tax and benefit microsimulation model.
As with the earlier policy option, an increase in UC allowances for people on disability benefits would weaken work incentives. However, this is likely to be less of an issue with a health-targeted policy option, as people receiving disability benefits are more likely not to be in paid work and in many cases their poor health will mean that they are further from the labour market, meaning that they will be less responsive to weakening financial incentives to work.
However, this kind of policy would increase the financial incentive for people to apply for health-related benefits. Increased prevalence of health-related benefits since 2019 – and the enormous strain this is placing on the public finances (e.g. Latimer, Pflanz and Waters, 2024) – is already a concern for the government. It is also worth noting that the receipt of PIP and DLA does not automatically end once people reach SPA. For most, the award will turn into an ongoing award with a light-touch review every 10 years, as the assumption is that health conditions are unlikely to improve for people at older ages.18 This means that if a policy induces more people to apply successfully for PIP in the year before the SPA, there would likely be additional long-run costs as many of those individuals will continue to receive PIP through retirement. This policy would also increase the importance of the health test in getting the distinction in eligibility right, as the gap between support for those successfully applying for PIP and those who do not receive PIP would grow.
In addition to those in poor health, there are also other specific low-income groups who may face significant barriers to employment while having low levels of income and assets in the year before SPA. For example, the Cridland Review (Department for Work and Pensions, 2017) identified long-term out-of-work full-time carers as a group of people who should receive similar additional means-tested support to those out of work due to poor health. Indeed, our policy of enhanced support through UC could be extended to other groups approaching SPA. Eligibility for support would have to be carefully designed – for example, based on long-term benefit receipt as proposed by Cridland.
Summary
This section has examined a policy option to provide greater means-tested financial support to people who receive disability benefits in the run-up to state pension age. The incomes of these people are disproportionately reduced by a rise in the state pension age, and policymakers may therefore be interested in targeting additional support towards them. This would be a more limited approach than the option of increasing UC standard allowances for all UC recipients in the run-up to state pension age, and would therefore cost the exchequer considerably less, at around £0.2 billion per year, although it would not target those at the very bottom of the income distribution – who generally do not receive disability benefits. Although the policy would weaken work incentives for the affected group, the responsiveness of disabled people to those incentives is likely to be low, though it would increase further the incentive to apply for disability benefits.
3.5 The asset test for means-tested support
The means-tested benefit system for people below the state pension age is intended to provide targeted support to those who need it most, and a key feature in targeting support is the asset test. Households with assets worth more than £16,000 (excluding any pension and primary housing wealth) are not entitled to any UC, and the payments are tapered down for those with more than £6,000 in assets. These thresholds have not been increased in cash terms since 2006, meaning that UC has become more targeted at those with the lowest levels of assets, as prices, average earnings and average wealth have increased significantly over this period. For example, if the asset test had been adjusted in line with prices since 2006, it would be closer to £27,000 today instead of remaining at £16,000. This is equivalent to a 40% real-terms cut to the asset test since 2006.
An implicit feature of the asset test is that it is more likely to affect older individuals. As people accumulate wealth over their lifetimes through saving and investment, older people are more likely to have assets above the £16,000 threshold, making them ineligible for support. Figure 3.8 illustrates this by showing the proportion of individuals who have assets over £16,000 (including any potential spouse’s assets), broken down by age group and income third. The income thirds are defined within each age group, representing the poorest, middle and richest thirds. The graph shows that the likelihood of having assets over £16,000 generally increases with age, with the highest proportions found in the 60–64 age group, and this is true across all income groups. For example, among the poorest third of people in their early 30s, only 9% have assets of more than £16,000, whereas this figure is 38% among the poorest third of people in their early 60s.
Figure 3.8. Share of individuals who (with their spouse) have assets over £16,000, by age and income third
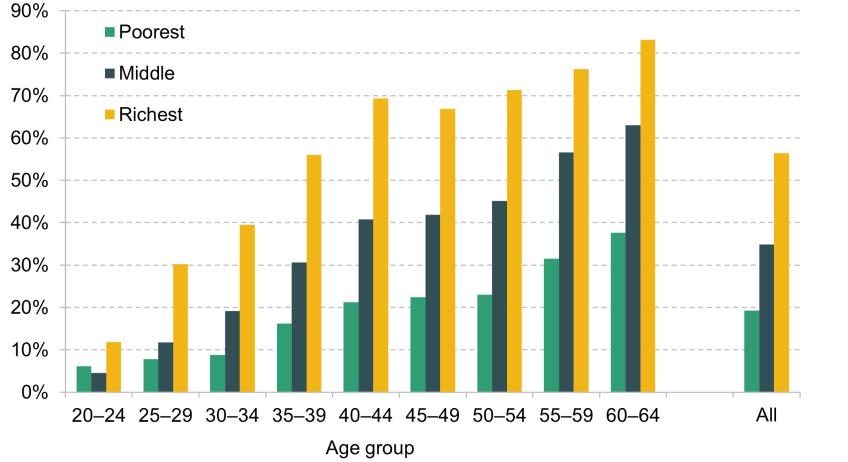
Note: Income thirds are defined within age groups.
Source: Authors’ calculations using the Wealth and Assets Survey round 7 (2018–20).
Additional modelling using the IFS tax and benefits microsimulation model shows that among those aged 60–64, an additional 135,000 people would qualify for UC if the asset test were removed, representing a 19% increase in eligibility for that age group. In contrast, for those aged 30–34, the increase in eligibility would be only 5%, or 40,000 people. This illustrates how the asset test ‘bites’ more for older individuals, as they are more likely to have low incomes while also having a higher level of assets. An implicit result of this is that older individuals facing low incomes – for example, due to unemployment shocks – are expected to spend down their assets before being able to access state support. While this is justifiable, as one of the reasons that people build up savings is to protect themselves from income shocks, it is also true that those close to the SPA would have less time to rebuild their savings before retirement than younger working-age individuals.
The asset test can be particularly consequential for those aged 55 and above, who can access their private pension pots without penalties. Any assets held in a pension before the SPA are exempt from the asset test for means-tested benefits, but any funds that are withdrawn from a pension will become subject to that asset test. There is some evidence suggesting that, for many people over 55, the first reaction to unemployment is to cash in their pension, making them vulnerable to losing entitlement to benefits as a result (Smart Data Foundry, 2022). Lump-sum drawdowns from defined contribution pensions before retirement are also common even without income shocks (as 25% can be drawn free of tax and the rest subject to income tax), and some people may not understand how those withdrawals may affect their eligibility for means-tested benefits either immediately or in the future. This issue is becoming even more important as the prevalence of defined contribution pension pots and their average size increase over time.
As part of this, it is important that the government’s free pensions guidance service (Pension Wise) provides information on how any lump-sum drawdowns below SPA can affect eligibility for means-tested benefits. While the take-up of free guidance is low (FCA statistics show that Pension Wise guidance had been used for only 10% of pension pots accessed for the first time in 2023–24 (Financial Conduct Authority, 2024)), the government should ensure that at least those seeking guidance will be told how pension drawdowns may affect benefit eligibility.
Lifetime ISAs (LISAs) are another form of saving that is incentivised for retirement income (or for first-time home purchases). These are particularly suitable for the self-employed who often face more volatile incomes and can benefit from having their assets in more liquid products and – by definition – are not able to receive an employer’s contribution into a private pension. While LISAs are intended to be a long-term savings product, assets held in them count towards the means-tested asset test. There is a strong case for excluding LISAs from the asset test for working-age people, as it would align the treatment of these assets with the treatment of other pension saving products. This was a recommendation by the Social Security Advisory Committee (SSAC) in 2022 (Social Security Advisory Committee, 2022).19
In addition to uprating the asset test and changing the treatment of LISAs, an alternative model for asset testing would be to change the working-age asset test to work in the same way as the asset test for pension credit, which has no upper capital limit but instead uses a taper system to assess income. This approach would provide a more gradual reduction in benefit entitlement as assets increase, avoiding the current cliff-edge effect where individuals lose all support once their assets exceed £16,000. Unlike the fixed asset limit of £16,000 for universal credit, pension credit’s approach ensures that people with moderate savings do not lose support entirely but instead receive a reduced amount.
Summary
The means-tested benefit system before state pension age has an asset test that limits the amount of financial support low-income people receive if they have more than a low level of assets (excluding pension and primary housing wealth). While many would agree that people with assets should be expected to draw on them rather than on state support when facing a low income, the limit above which no means-tested support can be received (£16,000) has been unchanged since 2006, representing a 40% real-terms cut. There is a good case to index this threshold over time for all working-age households, to prevent it being eroded by inflation. Moreover, as defined contribution pension wealth becomes more widespread, it will be important that people do not accidentally become ineligible for means-tested benefits based on not understanding how withdrawals from defined contribution pensions could see them lose eligibility to benefits.
4. Benefit system above the state pension age
The most important difference in the state financial support provided to individuals above state pension age compared with working-age people is that they are able to claim a state pension, which makes up a large majority of income for lower-income pensioners. However, other financial state support is still important over state pension age, with spending totalling £27 billion in 2023–24 and making up 14% of income for the lowest-income third of pensioners. While the means-tested part of this pensioner benefit system is more generous than the system facing people under state pension age, this chapter discusses a number of challenges facing low-income people over state pension age.
In this chapter, we first consider the appropriateness of support for housing costs in the private rented sector. A previous report of the Pensions Review (Cribb, Emmerson, Johnson and Karjalainen, 2023)identified that pensioners in private rented accommodation (especially single-person households) were the most likely pensioner group to live in income poverty despite the provision of the new state pension and the means-tested benefit system. We therefore go on to consider a potential policy reform that boosts the amount of housing benefit private renters over state pension age can claim. We subsequently address some of the other issues facing the means-tested pensioner benefit system, and examine the case for greater integration of benefits above state pension age.
4.1 Housing benefit for private renter pensioners
While the means-tested benefit system above SPA is significantly more generous than that below SPA, some pensioners are more likely to be living in income poverty than others. Figure 4.1 shows the relative income poverty rate (after deducting housing costs) among owner-occupiers, social renters and private renters above the state pension age over time. Over the last two decades, the relative income poverty rate has been highest among private renters. In the latest year of data (2022–23), the relative income poverty rate among private renters was 38%, compared with 34% among social renters and 12% among owner-occupiers.
Figure 4.1. Relative poverty rate for those above SPA, by housing tenure
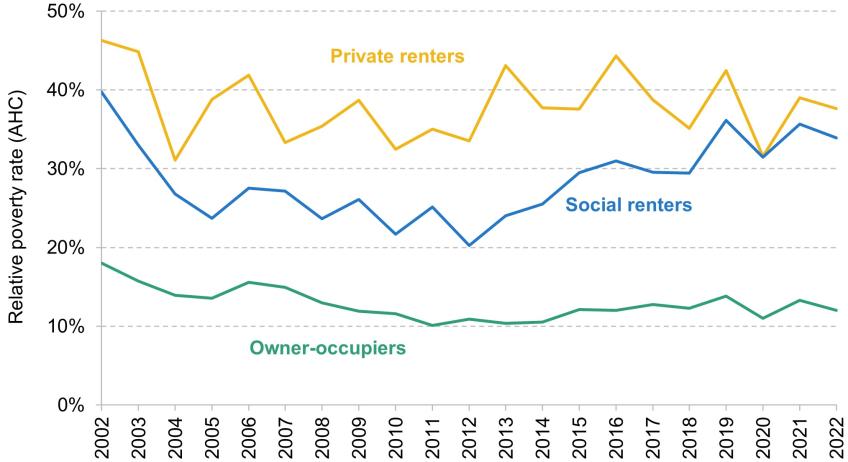
Note: Relative poverty rate is defined as having an equivalised household income (after deducting housing costs) of less than 60% of the contemporaneous median.
Source: Authors’ calculations using the Family Resources Survey 2002–03 to 2022–23.
In the last decade, relative income poverty rates among social renters above SPA have risen and are now close to the rates seen among private renters above SPA. Social renters are also more likely to be female, single and disabled than private renters,20 indicating they may be more likely to have lived in poverty for longer. However, there are several reasons why private renter pensioners are particularly disadvantaged compared with pensioners with other housing tenures.
Private renters have less security of tenure as landlords can increase rents or choose not to renew leases, and even sell the property to a person who no longer wants to let it. There are also key differences in the type of housing cost support available to private renters and social renters in retirement. The maximum support for low-income single or couple private renters who do not have any dependent children is in most cases (at the moment) equivalent to the 30th percentile of rents for one-bedroom properties in their area.21 This maximum level of support is known as the LHA (local housing allowance) rate.
At the same time, social renters face rents substantially below market rates. Additionally, unlike with the private renters’ maximum benefit being typically set based on a one-bedroom property for couples and singles, above the SPA social renters are not subject to the so-called ‘bedroom tax’, i.e. a reduction in their benefits for bedrooms that are deemed to be ‘spare’. This means that there is a clear difference in the number of ‘allowed’ bedrooms for private and social renters above the state pension age.
While in April 2024 the LHA rates were reset in a way that linked them to the 30th percentile of rents in the area, they will again be ‘frozen’ next year in cash terms (as they were from 2020 until April 2024). This means that if private rents continue increasing, even in cash terms, the LHA rates are increasingly unlikely to cover the rents of private renter pensioners. When rents are rising, renters in higher-rent parts of the country – therefore particularly in the South of England – will need a higher pound amount of other income or savings to make up the difference between the LHA rate and actual rent. In addition, the growing gap between the LHA rates and actual rent levels will put pressure on private renters in areas where one-bedroom properties are more difficult to find.
Indeed, availability of affordable one-bed properties is a key issue for low-income private renters. Back-of-the-envelope calculations suggest that there are more people receiving housing benefit or UC housing entitlement for one-bedroom properties than there are one-bedroom private rented properties in the rented sector in the country. We estimate that there are around 2.2 million households in England and Wales receiving housing benefit or UC housing entitlement for one-bedroom properties.22 According to the Census, 2.8 million homes in England and Wales had one bedroom in 2021,23 and around 19% of homes in England are in the private rented sector and 17% in the social rented sector.24 To match the number of housing benefit or UC housing entitlement claimants with one-bedroom allowance, the proportion of one-bed properties in the rental sector would have to be nearly 80% of all one-bed properties. While a higher proportion of one-bedroom properties than of larger houses will be in the private or social rented sector, the 80% figure seems unreasonably high. And even if it was true overall, it would be unlikely to be true in every part of the UK. Overall, this suggests that there will be parts of England and Wales where there are not enough one-bedroom properties for all of the households receiving housing support where the maximum rate is set based on the rents for one-bedroom properties in that local area.
The availability of (affordable) one-bedroom properties in the private rental market will also vary greatly between regions, but this is not taken into account when setting housing benefit amounts. Administrative data are not available on the extent to which LHA rates cover actual rents for pensioner households, but we can explore regional variation in this measure among the working-age households receiving the housing element of UC. While rents are higher in London and the South East, Figure 4.2 shows that the share of households whose rents are not covered by the LHA rates is highest in Wales and the North East of England. It is likely that at least some of this difference is due to the lack of availability of one-bedroom properties in those regions.
Figure 4.2. Percentage of households with UC housing entitlement in the private rented sector for whom LHA rate does not cover rent in May 2024
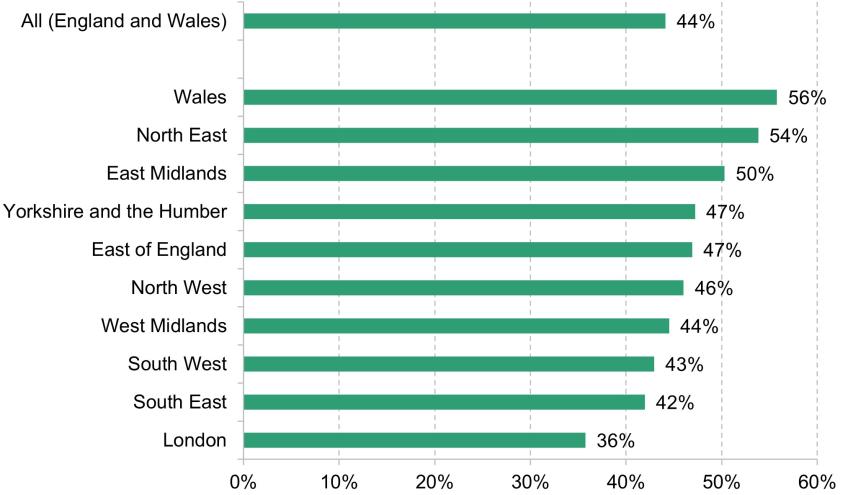
Source: DWP Stat-Xplore.
Issues around private renter pensioners are set to be more prominent in the future. Currently, only about 4% of pensioners are private renters, with 14% in social housing and the vast majority (82%) in owner-occupied housing. This means that, at the moment, the number of pensioners in relative income poverty who are owner-occupiers is higher (1.2 million) than the number of pensioners in relative income poverty who are social renters (0.6 million) or private renters (0.2 million).25 But current trends indicate that private renting in retirement will increase in prevalence – about 4% of those born in the 1940s were private renters in their mid 50s, compared with 10% of those born in the 1960s. Recent projections using data on the housing tenures of current 40- and 50-year-olds suggest that the prevalence of private renting in retirement will more than triple in the next two decades. The UK Collaborative Centre for Housing Evidence estimates that the proportion of people aged 65+ living in the private rented sector will rise from the current 4% to 13% by 2040 (Williams and Robinson, 2024), and the Pensions Policy Institute model suggests the number of households renting privately in retirement will rise by 1.2 million to 1.7 million by the early 2040s (Pensions Policy Institute, 2023).
The difficulties faced by private renters above state pension age face was also reflected in the public engagement work. Private renters were concerned about the availability of suitable housing – for example, a one-bedroom property – and, if available, how affordable it was.
‘It’s very tight to get a one-bedroom, even private rent. Unless you’re looking towards sort of the luxury end. Maybe one of those big apartment-type things with a balcony. But you’re paying through the nose for that.’
Male, aged 68, pension credit, homeowner
Private renters above SPA also remarked that rents had increased and that pensions and other benefits had not kept up with these increases.
‘My rent went up by 7% in April so my pension increase was wiped out.’
Female, aged 71, pension credit, private renter
‘The housing benefit has fallen behind the huge rises in rent over the last few years. It’s difficult to cover as the maximum for a two-bedroom property is £625 per month and with the vast majority of properties well over £1,000, it’s too great an amount to make up. The chance of finding new, affordable rentals is nil.’
Male, aged 76, pension credit, private renter
‘I am in receipt of housing benefit, which leaves me around £80ish pounds short, which is okay. But the problem is that there is a cap on how much you are allowed, which limits the type of property and the area you can live in. I think the maximum that I’m allowed is just over £500 a month, which only covers a room in shared accommodation. A basic house/flat costs well over £800, which becomes unaffordable.’
Male, aged 76, pension credit, private renter
Summary
Pensioners who live in private rented accommodation face higher income poverty rates than both social renters and owner-occupiers. There are a number of difficulties facing older people in private rented accommodation, including the insecurity of tenure and, for those on low incomes, housing benefit that does not cover their rent (unlike for most social renters). As few pensioners have dependent children, they are generally only eligible to housing benefit that covers a one-bedroom property (again, unlike social renters). And in many areas, there will be relatively few one-bedroom properties compared with the number of people eligible for state support for rent for a one-bedroom property.
4.2 Policy option: increase LHA number of bedrooms for pensioners
As described above, the maximum support for low-income single or couple private renters without dependent children is (at the moment) equivalent to the 30th percentile of rents for one-bedroom properties in their area, regardless of whether such properties are readily available. At the same time, social renters face rents substantially below market rates and, above the SPA, are (unlike those below the SPA) not subject to the so-called ‘bedroom tax’, i.e. a reduction in benefits for bedrooms that are deemed to be ‘spare’. So pensioners in the social rented sector can live in a two- or three-bedroom property and have their rent fully covered by housing benefit.26
A government concerned about the situation facing pensioners in private rented accommodation could increase the generosity of housing benefit above state pension age by using an additional bedroom to calculate the housing benefit rate. This would mean that the maximum support available would be equivalent to the 30th percentile of rents for two-bedroom properties in the area for singles and couples (rather than one-bedroom). This would benefit many groups of private renters, by varying amounts. For example, the median LHA rate for a one-bedroom property is £588 per month (in Central Norfolk & Norwich), whereas the median LHA rate for a two-bedroom property in the same area is £693 per month, a difference of £105 per month. There is a great deal of variation in the LHA rates of one- and two-bedroom properties between areas: the difference is £7 per month in Durham and £352 per month in Central London.
A higher LHA rate would immediately help those whose current rents are not covered by LHA – for example, those living in areas where relatively few affordable one-bedroom properties are available. A higher LHA rate would also mean that more one-bedroom properties would have rents that could be covered by LHA. By enabling more pensioners to live in two-bedroom properties, it would benefit those who want an additional bedroom to be available for children or grandchildren to come and stay in their own bedroom, and those in couples who want the option of having a bedroom each. This is particularly important for pensioners as they spend more time at home. There is already an allowance for an extra bedroom for overnight carers, but this is limited to those who can demonstrate that they require overnight care (e.g. those receiving attendance allowance). More generally, the suggested policy would move towards aligning the social and private rented sectors in terms of the rules around number of bedrooms allowed for pensioners.
To assess the impact of this policy, we can compare rents of private renter pensioners with current LHA rates and what they would be under this ‘second bedroom’ policy option. Figure 4.3 illustrates the cumulative distribution of rents that private renter pensioners are paying relative to the LHA rates in their area. We include all renters, both those receiving housing benefit or other means-tested benefits and those who are not (44% of these renting households are receiving some means-tested benefits and 39% are receiving housing benefit). We have restricted the sample to households with either a single person or one couple (where both are pensioners) with no dependent children, so the rents are compared with the LHA rate for one bedroom in the area (the green line). We then also compare the rents with the LHA rate for two bedrooms in the area (the yellow line).
Figure 4.3. Cumulative distribution of gross rent to LHA rate ratio among pensioner households who are private renters, in 2022–23
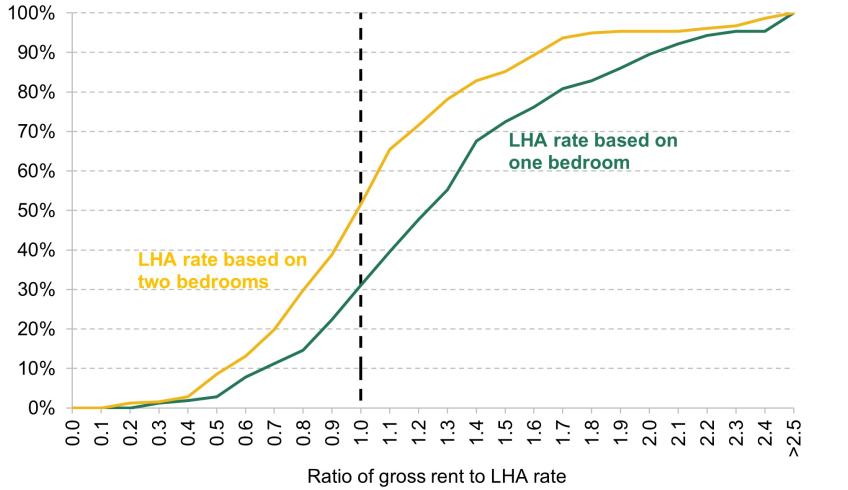
Note: Pensioner households with one or two adults and no dependent children. Rents are covered by LHA rate for the households left of the dashed vertical line.
Source: Family Resources Survey 2022–23 and LHA rates from Department for Work and Pensions (https://assets.publishing.service.gov.uk/media/622f20118fa8f56c1ba9dc6f/england-rates-2022-to-2023.csv/preview).
The graph shows that for the majority of private renters, the current local LHA rate is lower than their rents, and that only around a third (31%) of private rents among pensioners are covered by the local LHA rate when it is based on one-bedroom properties. Using two-bedroom properties to calculate LHA rates, the proportion of households whose rents are covered by the LHA rate would rise to 52%. If we restrict the sample to households receiving housing benefit, LHA rates currently cover 39% of rents, and this would increase to 64% using the two-bedroom rate.
We have also modelled the effect of this policy option on pensioner incomes and found that it would immediately provide additional support to the approximately 130,000 pensioner households (about 1.5% of all pensioner households) whose rents are not currently fully covered by LHA rates, with an average benefit for those affected of £95 per month. This support would be targeted towards lower-income renters, who tend to be among the lowest-income (after deducting housing costs) pensioners – Figure 4.4 shows that the largest gains from this policy are among the bottom income decile of pensioners. The cost of the policy would currently be £150 million per year, although the number of people affected, and the cost to the exchequer, would likely rise over time as the prevalence of private renting in retirement increases, and as more pensioners may choose (as a result of this policy) to live in more expensive properties.27
Figure 4.4. Changes in household income for pensioners resulting from setting LHA rates for pensioners based on an additional bedroom allowance
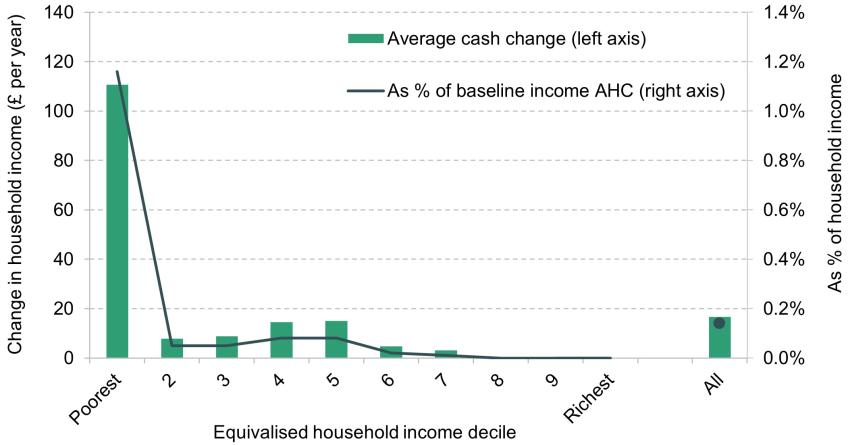
Note: Income deciles are calculated based on equivalised incomes after deducting housing costs among benefit units with at least one pensioner in them.
Source: Authors’ calculations using TAXBEN, the IFS tax and benefit microsimulation model.
There are other alternatives for increasing support for private renters in retirement – for example, setting the LHA rate based on a higher percentile of one-bedroom properties (rather than the current 30th percentile). If pensioners’ LHA rates were set only modestly above the 30th percentile – for example, at the 40th percentile – our approach is likely to be more generous for the vast majority. The 30th percentile of two-bedroom properties’ rent is, on average, equivalent to the 75th percentile of one-bedroom properties’ rents, ranging between the 36th percentile and the 95th percentile depending on the area.28 In addition, our approach of increasing the bedroom allowance would move towards aligning the treatment of an additional bedroom for pensioners in the social and private rented sectors.
It is worth noting that our modelling uses the LHA rates in 2024–25. LHA rates were uprated to match the 30th percentile of rents in the local area in April 2024. However, the rates do not automatically keep up with local rents. For example, in the last decade, rates were uprated by 1% in April 2014 and 2015, and raised by an average of 13% in April 2020 and 16% in April 2024 (Hobson, 2023). However, between those dates, the rates were ‘frozen’ and not uprated. As rents tend to rise over time (Office for National Statistics, 2024c), periods when LHA rates are frozen make it more difficult for households to find properties where rent would be covered by LHA rates. The LHA rates should be permanently linked to the 30th percentile of rents for all of those receiving state support with their housing costs.
Summary
For policymakers concerned about the material living standards of private renters in retirement, one immediate option available is to increase the amount of means-tested financial support through housing benefit. One way to do this would be to increase the number of bedrooms that pensioners are entitled to when calculating their maximum potential housing benefit. Adding an additional bedroom allowance would target additional income towards some of the very-lowest-income pensioners. In total, 130,000 pensioner households whose rents are not currently fully covered by LHA rates would benefit by an average of £95 per month, costing around £150 million per year; the number of people affected and the cost to the exchequer would likely rise over time.
4.3 Moving towards a more integrated benefit system above the SPA
In addition to housing benefit, the key means-tested benefit available to pensioners is pension credit, with around 1.3 million pensioners in receipt of this benefit in 2023–24. Pension credit tops up the incomes of low-income single pensioner households to £218.15 per week and couples to £332.95 per week, with additional amounts available to those receiving disability benefits, those with dependent children and those entitled to carer’s allowance.29 In addition to the pension credit payments, eligibility also ‘passports’ recipients to many other benefits such as (usually full) council tax support and, from Winter 2024–25, winter fuel payment.
Low take-up of pension credit
A key challenge facing the means-tested pensioner benefit system is low take-up of pension credit. As Figure 4.5 illustrates, according to DWP estimates, the take-up of pension credit has remained at or below 66% since 2010. Survey data suggest that reasons for low take-up include people thinking they have too much money to qualify, as well as perceived stigma in claiming (Wilson, Mawhinney and Hopkinson, 2022). Lack of awareness is also likely to play a role, and campaigners have tried to highlight the ‘superpower’ of receiving even one pound of pension credit due to the passporting to other benefits for those on pension credit.30 It is worth noting that there are also similar issues of less than full take-up of working-age benefits – DWP estimates from a decade ago (2014–15) show that the take-up rate (measured based on caseload) was 82% for income support or income-related employment and support allowance and only 50% for income-based jobseeker’s allowance.31 More recent estimates from Policy in Practice suggest that the universal credit take-up rate was 77% in 2023–24 (Clegg et al., 2023).
Figure 4.5. Pension credit uptake rate over time
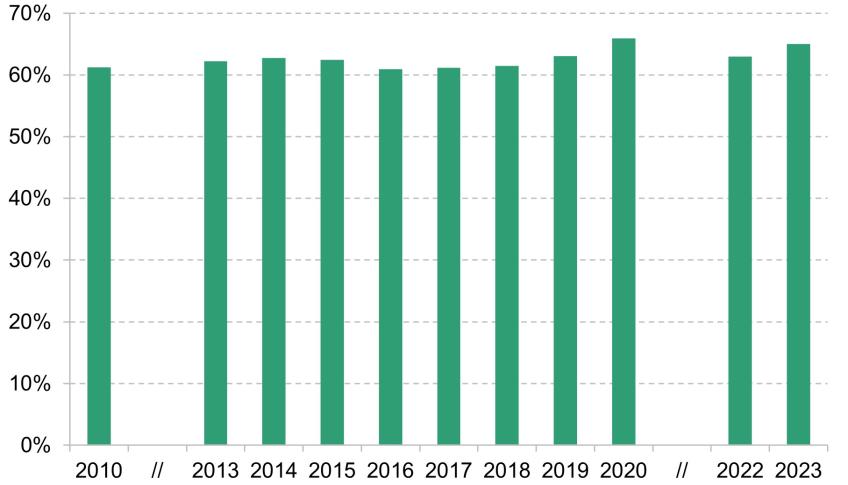
Note: Year refers to financial year end.
Source: Department for Work and Pensions (https://www.gov.uk/government/statistics/income-related-benefits-estimates-of-take-up-financial-year-ending-2023).
As the cliff edge in support for those who receive pension credit and those who do not grows, it becomes increasingly important that those who are eligible for pension credit receive it. Recent statistics from DWP show large increases in the number of pension credit claims being made since the announcement that winter fuel payment will only be paid to those receiving pension credit (Department for Work and Pensions, 2024b). Indeed, DWP’s costing of the policy assumed the pension credit take-up rate would increase by 5 percentage points from 63% (the 2022 figure) to 68% (Department for Work and Pensions, 2024a) as a result of the policy. This would be a big increase in take-up, but would still leave almost one-in-three pensioners who were eligible for pension credit not receiving it, and therefore also missing out on the winter fuel payment and other passported benefits too.
The full impact on take-up will depend not just on the number of new claims, but also on the rate at which the new claimants are awarded pension credit. There was a similar increase in claims in 2022–23 when additional cost-of-living support was paid to households receiving pension credit. However, it is notable that while the number of pension credit claims more than doubled (an increase of 117%) between 2021–22 and 2022–23, the number of claims granted increased by 75%. In other words, the award rate for claims fell from 74% to 60% (of claims cleared over the period), and the resulting increase in take-up over the same period was 2 percentage points.32
The prevalence of pension credit is also falling over time, as the pension credit amount (without the disability or care premium) is now below the value of a full new state pension. As the vast majority of people reaching SPA from the 2030s onwards are expected to receive the full new state pension (Department for Work and Pensions, 2013), future generations of pensioners will be less and less likely to be eligible for any pension credit. For example, the latest forecasts show that while the number of people receiving the state pension is expected to rise by 6% between 2023–24 and 2029–30, the number of people receiving pension credit is expected to fall by 7% over the same period.33 This also means fewer people will be passported to the additional benefits, and these will increasingly only be available for older pensioners, those who have only spent a relatively small fraction of their working life in the UK or those receiving the additional amounts due to entitlement to disability benefits or carer’s allowance. At the moment, the new state pension is £3.05 per week above the pension credit, whereas someone entitled to the severe disability premium due to receiving certain disability benefits could have other income of £78.45 per week (or over £4,000 per year) above the new state pension, while still being entitled to pension credit. The gap between the new state pension and pension credit is also expected to increase over time as the new state pension rises each year in line with the triple lock, whereas pension credit increases are linked to average earnings growth.
The passported benefits through pension credit are also perceived by pension credit recipients to be important, as highlighted by participants in the public engagement work.
‘I applied for pension credit and fortunately I got it. So, without that, I would have had to sell the house. I didn’t want to do that. Or struggle along. Yeah. So that has made the difference to enable me to have a reasonable life. I mean, I’m still not a millionaire but it means that if I need something, I can find a way to buy it. Whereas without the pension credit, there would’ve been no chance. And I don’t pay council tax either because of that. My council tax is £260 a month, I think.’
Male, aged 74, pension credit, homeowner
Integration of pension credit and housing benefit
Existing measures for improving take-up of pension credit have mainly consisted of public campaigns, such as ‘Pension Credit Day of Action’, aimed at increasing awareness and take-up of the benefit.34 However, as Figure 4.5 illustrated, this has not led to a transformative increase in headline take-up rates.
In order to address low take-up of pension credit, this government (as well as previous ones) has stated a commitment to integrating pensioner housing benefit and pension credit. Presently, claims for pension credit claims are handled by the Department for Work and Pensions (or, in Northern Ireland, the Department for Communities) while claims for housing benefit are administered by local authorities. Most of those who apply for pension credit can claim housing benefit at the same time, as the Pension Service should pass on the relevant details to the local authority. However, those who apply for housing benefit only through their local authority are not automatically checked for pension credit eligibility. Integration should make things easier for claimants in that they should only need to make a single claim under all circumstances. This would be a welcome step towards ensuring that all pensioners applying for housing benefit would also be checked for pension credit eligibility, though the commitment to integrate these benefits was pushed back by the previous government.
Encouragingly, in the 2024 Autumn Budget, the new government announced it would bring together the administration of housing benefit and pension credit for new claimants from 2026. This will mean that pensioners applying for housing benefit would automatically receive any pension credit they are entitled to. Integration may also increase pension credit and housing benefit claim rates, as the potential benefit from applying will be higher.35
While this will be a positive change in terms of improving take-up, moving housing benefit to be administered by central government will have to be managed carefully. It is possible that one of the reasons for higher take-up of housing benefit is that it is administered by local authorities, who can create more locally based and tailored engagement with potentially entitled households – for example, providing communications in the most important local minority languages or referring to local services that claimants know and trust. There is also potentially an increased risk of fraud when housing benefit is administered centrally, as central government may have less knowledge of the local markets and may lack the ability to check eligibility and validity of rental agreements. It is also worth noting that other support, such as council tax support schemes, will still be administered by local authorities, meaning that claimants will still have to interact with different administrative bodies in order to receive the full amount of support they are entitled to.
Integration of the working-age and pensioner benefit systems
Integration of the benefit system could go even further, in particular in terms of integration of the working-age and pensioner benefit systems. This could be done in a way that would broadly maintain the level of support (and lack of conditionality) for pensioners at the current level (including passporting36).
Integrating the working-age and pensioner benefit systems could have benefits such as improving claimant experience for those reaching SPA who are already receiving universal credit by making it easier for them to flow onto pension credit. Currently, those receiving UC have their claim stopped when they reach the SPA and have to make a fresh claim to DWP in order to receive pension credit. This may lead to delays in people receiving the right support when reaching the SPA, as was the case for some of the respondents in the public engagement work.
‘If I remember correctly, I was reminded to apply as I had passed the date when I was eligible. I didn’t actually know about pension credit and was only expecting my state pension. I was informed later of a cut-off date for applying for pension credit, which I did, and received a few hundred in back pay. I only receive less than £50 in pension credit a month, and as I didn’t know about pension credit it’s a bit of a bonus.’
Male, aged 76, pension credit, private renter
‘I went through this process for a parent a few years ago. There was a significant time delay with payment and it was a struggle for them.’
Female, aged 55, homeowner
An important group who could benefit from further integration of the working-age and pensioner benefit systems is mixed-age couples. As described in the introduction, since 2019 couples where one member is above the SPA and one is below are treated as a working-age couple when applying for benefits. This means that couples have to wait until the younger member of the couple reaches the SPA before accessing the more generous pensioner benefit system. For couples, the benefit system therefore moved from what might be considered the most generous interpretation of whether they are a pensioner couple (the older member is aged over the SPA, regardless of the age of their younger partner) to the least generous interpretation (the younger member is aged over the SPA, regardless of the age of their older partner). Because many couples are not the same age, before 2019 some relatively young spouses could benefit from the pensioner benefit system. For example, in 2009–10, the 10th percentile of age for those in mixed-age couples (one person aged 60 or over and one person aged under 60) was 52 years. On the other hand, there are now people well above the SPA who will be treated as being working-age in the eyes of the means-tested benefit system because of their younger spouse – in 2022–23, the 90th percentile of age for those in mixed-age couples (one person aged 66 or over and one person aged under 66) was 73 years.37
Figure 4.6 shows the relative income poverty rates (after deducting housing costs) for mixed-age couples, pensioner couples and working-age couples over time.38 In the early 2000s, the mixed-age couples’ poverty rate was following similar trends to the pensioner couples’ poverty rate, falling significantly in the decade from the mid 2000s to the mid 2010s. However, since then, the poverty rate among mixed-age couples has reached the same level as the poverty rate of working-age couples. Integration of the working-age and pensioner benefit systems could allow the government to set more easily a benefit rate for mixed-age couples that is more generous than the current treatment, without fully returning to the pre-2019 rules where mixed-age couples were treated as pensioner couples. In other words, rather than sticking with the least generous treatment of what counts as a pensioner couple, or moving back to the most generous treatment which previously existed, integration could allow something in between to be chosen. In principle, this could even be done without integrating the benefit systems, if the UC standard allowance was higher for couples where one member is above SPA.
Figure 4.6. Relative poverty rates (after housing costs) over time, for pensioner couples, mixed-age couples and working-age couples

Note: Couples only.
Source: Authors’ calculations using the Family Resources Survey 2002–03 to 2022–23.
With any changes to the benefit system, the government should be particularly sensitive to any ‘branding’ effects of new benefits. Some of the cited reasons for low take-up of pension credit include stigma around needing financial assistance, and pensioner households may feel discouraged from claiming UC as it is known as the main means-tested benefit for low-income working-age households. Any new integrated benefit for pensioners should have a different name that aims to minimise stigma for claimants – in effect, integrating the operations without making any changes that might adversely affect some pensioners.
Even without full integration of the pensioner and working-age benefit systems, better systems within government could help identify those current UC claimants who are likely to be entitled to pension credit. These households could then be more effectively targeted with communications on pension credit, potentially helping both take-up and claimant experience.
There was also strong support from current UC claimants in the public engagement work that the application process for universal credit and pension credit should be combined to make things easier and to avoid stress.
‘This will be less complicated and also a way of making certain that payments are made according to re- quirements. No need to check what you are entitled to. Also, less confusing for anyone applying.’
Male, aged 64, home owner
Summary
Pension credit is a key means-tested benefit for people above state pension age, and one that – although its value in addition to the state pension received may not be high – increasingly comes with a wide range of valuable passported benefits, including (from this year) the winter fuel payment. But take-up is low, and it is noticeable that in contrast to the great effort placed to integrate most means-tested benefits in the working-age system, the current pensioner benefit system remains unintegrated. It is encouraging that the government has stated that it will proceed with the integration of pension credit and pensioner housing benefit. There is also potential to consider benefit integration more widely over state pension age. This could have benefits such as improving claimant experience for those reaching SPA who are already receiving universal credit, making it easier for them to flow onto pension credit, and providing policymakers more flexibility in the treatment of couples where one is below the SPA and one is above it.
5. Conclusion
This report highlights some of the key features of the means-tested benefit system below and above the state pension age. We also provide policy options to provide greater support for groups who are particularly affected by the increase in the state pension age and for people more at risk of adverse financial outcomes under the existing pensioner benefits system.
A key disparity highlighted in this report is the differential level of support available to individuals above versus below the SPA. Raising the SPA is a coherent policy response to the fiscal pressures associated with rising longevity at older ages. However, due to the difference in the level of support available above and below SPA, this policy has significant implications especially for those who are already out of paid work before the SPA. To mitigate the negative consequences of increasing the SPA for their incomes, we put forward two potential policy options for additional support for low-income households: raising the UC standard allowance for those nearing the SPA; or alternatively targeting additional support only to UC recipients who are also receiving disability benefits.
These measures would help alleviate poverty among those just below the SPA, but they come with trade-offs. Both would directly add to spending on the working-age benefit system, although with costings of £0.6 billion and £0.2 billion per year, respectively, these are small relative to the estimated £6 billion of fiscal savings associated with a one-year increase in the SPA.
Both options would reduce financial incentives to work for those approaching the SPA. For people of this age who are in good health, this reduction will be of particular concern because their labour market decisions are likely to be influenced by the financial incentives they face. In contrast, those in poor health will typically be relatively unresponsive to diminished financial incentives to work. But targeting additional support based on health conditions would increase the incentives for people to apply for disability benefits. Despite these trade-offs, there is a good case for using some of the public finance savings resulting from a higher SPA for additional targeted support to the most affected groups, not least as this might help maintain public and political support for increasing the SPA as longevity at older ages increases further.
While pensioners receive more generous financial support from the state than the working-age population, specific subgroups, such as pensioners in rented accommodation, remain particularly vulnerable to poverty. In many cases, those in private rented accommodation – unlike those in the social rented sector – do not have their full rent covered by pensioner housing benefit. Pensioners in the social rented sector are also exempt from what has become known as the ‘bedroom tax’, whereas single pensioners and pensioner couples without dependent children who live in the private rented sector can only receive pensioner housing benefit calculated on the basis of a one-bedroom property. Increasing the local housing allowance (LHA) to cover an additional bedroom would provide financial relief for many in this vulnerable group, at the same time as the prevalence of private renting in retirement continues to rise. This is particularly important as private renters face distinct challenges, such as insecure housing tenure and exposure to rent increases. A second bedroom – which could allow an adult child to come and stay in a separate bedroom – might seem appropriate, and this would align rules with those for pensioners living in the social rented sector.
A key issue with means-tested benefits above the SPA is the low take-up of pension credit. The government has committed to integrating the administration of pension credit and pensioner housing benefit from 2026 for new claimants (as recommended in our report in which we made the case for a Pensions Review – Cribb, Emmerson, Johnson and Karjalainen (2023)), which should help improve take-up rates. In this report, we also consider a further integration of the working-age and pensioner benefit systems – or at least their administration – which could facilitate a smoother transition for individuals approaching the SPA, and would also provide policymakers with options for treating mixed-age couples more generously than they are at present without going right back to the much more generous way they were treated prior to 2019.
Ultimately, any of the policies discussed in this report must strike a careful balance between fiscal sustainability, labour market incentives, and the provision of adequate support for those most in need. We have illustrated the effects of policies that provide more support to groups most at risk of adverse financial outcomes. The government could choose to be more or less generous with these policies in terms of the level of additional support provided or in terms of eligibility for these benefits. The extent to which the benefit system should focus on redistribution is fundamentally a political decision, and the parameters discussed in this report – as well as other facets of the benefit system – can be adjusted to either broaden or narrow the scope of redistribution.
References
Adam, S., Joyce, R. and Pope, T., 2019. The impacts of localised council tax support schemes. Institute for Fiscal Studies, Report 153, https://ifs.org.uk/publications/impacts-localised-council-tax-support-schemes.
Aubert, P., 2023. Les départs anticipés pour carrière longue permettent-ils de compenser une plus grande pénibilité des métiers? Le blog des économistes de l’IPP, https://blog.ipp.eu/2023/03/06/les-departs-anticipes-pour-carriere-longue-permettent-ils-de-compenser-une-plus-grande-penibilite-des-metiers/.
Banks, J., Karjalainen, H. and Waters, T., 2024. Inequalities in disability. Oxford Open Economics, 3(Supplement_1), i529–48, https://doi.org/10.1093/ooec/odad091.
Börsch-Supan, A. and Coile, C., 2023. The effects of reforms on retirement behavior: introduction and summary. National Bureau of Economic Research, Working Paper 31979, https://www.nber.org/system/files/working_papers/w31979/w31979.pdf.
Börsch-Supan, A., Bucher-Koenen, T., Goll, N. and Hanemann, F., 2022. Targets missed: three case studies exploiting the linked SHARE-RV data. Journal of Pension Economics and Finance, 21(1), 1–21, https://doi.org/10.1017/S1474747220000359.
Clegg, A., Ghelani, D., Charlesworth, Z. and Johnson, T., 2023. Missing out: £19 billion of support goes unclaimed each year. Policy in Practice, https://policyinpractice.co.uk/wp-content/uploads/Missing-out-19-billion-of-support.pdf.
Cribb, J., Emmerson, C., Johnson, P. and Karjalainen, H., 2023. The future of the state pension. Institute for Fiscal Studies, Report 291, https://ifs.org.uk/publications/future-state-pension.
Cribb, J., Emmerson, C., Karjalainen, H., O’Brien, L. and Sturrock, D., 2023. The planned increase in the state pension age from 67 to 68. Institute for Fiscal Studies, Comment, https://ifs.org.uk/articles/planned-increase-state-pension-age-67-68.
Cribb, J., Henry, A. and Karjalainen, H., 2024. How have pensioner incomes and poverty changed in recent years? Institute for Fiscal Studies, Report 327, https://ifs.org.uk/publications/how-have-pensioner-incomes-and-poverty-changed-recent-years.
Cribb, J., Karjalainen, H. and Waters, T., 2022. Living standards of working-age disability benefits recipients in the UK. Institute for Fiscal Studies, Working Paper 22/24, https://doi.org/10.1920/wp.ifs.2022.2422.
Cribb, J. and O’Brien, L., 2022. How did increasing the state pension age from 65 to 66 affect household incomes? Institute for Fiscal Studies, Report 211, https://ifs.org.uk/publications/how-did-increasing-state-pension-age-65-66-affect-household-incomes.
Department for Work and Pensions, 2013. The single-tier pension: a simple foundation for saving. https://assets.publishing.service.gov.uk/media/5a7b622940f0b64646935cb1/single-tier-pension.pdf.
Department for Work and Pensions, 2017. Independent Review of the State Pension Age: smoothing the transition. https://www.gov.uk/government/publications/state-pension-age-independent-review-final-report.
Department for Work and Pensions, 2024a. Responses to Freedom of Information requests on equality impact assessments produced for targeting winter fuel payment. https://www.gov.uk/government/publications/responses-to-freedom-of-information-requests-on-equality-impact-assessments-produced-for-targeting-winter-fuel-payment/dwp-freedom-of-information-response.
Department for Work and Pensions, 2024b. Weekly pension credit claims received from 1 April 2024 to 22 September 2024. https://www.gov.uk/government/statistics/weekly-pension-credit-claims-received-from-1-april-2024-to-1-september-2024/weekly-pension-credit-claims-received-from-1-april-2024-to-1-september-2024.
Department for Work and Pensions, 2024c. Income-related benefits: estimates of take-up: financial year ending 2023. https://www.gov.uk/government/statistics/income-related-benefits-estimates-of-take-up-financial-year-ending-2023/income-related-benefits-estimates-of-take-up-financial-year-ending-2023.
Financial Conduct Authority, 2024. Retirement income market data 2023/24. https://www.fca.org.uk/data/retirement-income-market-data-2023-24.
Giupponi, G. and Seibold, A. (eds), 2024. Rethinking Pension Reform. CEPR Press, https://cepr.org/publications/books-and-reports/rethinking-pension-reform.
Hobson, F., 2023. Local housing allowance (LHA): help with rent for private tenants. House of Commons Library Research Briefing, https://researchbriefings.files.parliament.uk/documents/SN04957/SN04957.pdf.
Latimer, E., Pflanz, F. and Waters, T., 2024. Health-related benefit claims post-pandemic: UK trends and global context. Institute for Fiscal Studies, Report 333, https://ifs.org.uk/publications/health-related-benefit-claims-post-pandemic-uk-trends-and-global-context.
OECD, 2023. Pensions at a glance 2023. https://www.oecd.org/en/publications/2023/12/pensions-at-a-glance-2023_4757bf20.html.
Office for Budget Responsibility, 2024a. Economic and fiscal outlook – October 2024. https://obr.uk/efo/economic-and-fiscal-outlook-october-2024/.
Office for Budget Responsibility, 2024b. Fiscal risks and sustainability – September 2024. https://obr.uk/frs/fiscal-risks-and-sustainability-september-2024/.
Office for National Statistics, 2024a. National life tables – life expectancy in England and Wales: 2021 to 2023. https://www.ons.gov.uk/peoplepopulationandcommunity/birthsdeathsandmarriages/lifeexpectancies/bulletins/nationallifetablesunitedkingdom/2021to2023.
Office for National Statistics, 2024b. Health state life expectancies in England, Northern Ireland and Wales: between 2011 to 2013 and 2020 to 2022. https://www.ons.gov.uk/peoplepopulationandcommunity/healthandsocialcare/healthandlifeexpectancies/bulletins/healthstatelifeexpectanciesuk/between2011to2013and2020to2022.
Office for National Statistics, 2024c. Private rent and house prices, UK: November 2024. https://www.ons.gov.uk/economy/inflationandpriceindices/bulletins/privaterentandhousepricesuk/november2024.
Otto, S., 2024. When I’m 64: a strategy to tackle poverty before state pension age. Fabian Society, https://fabians.org.uk/wp-content/uploads/2024/04/Pre-retirement-poverty-long-version-COMPLETE-1.pdf.
Pensions Commission, 2004. Pensions: Challenges and Choices. First Report of the Pensions Commission, Stationery Office.
Pensions Policy Institute, 2023. Renting in retirement - the fault line below the UK pension system. PPI report, https://www.pensionspolicyinstitute.org.uk/research-library/research-reports/2023/2023-11-30-the-uk-pensions-framework-renting-in-retirement-the-fault-line-below-the-uk-pension-system/.
Phoenix Insight, 2023. An intergenerational contract: policy recommendations for the future of the state pension. https://www.thephoenixgroup.com/media/0oxdzhdc/an-intergenerational-contract-report.pdf.
Raleigh, V., 2024. What is happening to life expectancy in England? The King’s Fund, https://www.kingsfund.org.uk/insight-and-analysis/long-reads/whats-happening-life-expectancy-england.
Ray-Chaudhuri, S. and Waters, T., 2024. Recent trends in and the outlook for health-related benefits. Institute for Fiscal Studies, Report 311, https://ifs.org.uk/publications/recent-trends-and-outlook-health-related-benefits.
Smart Data Foundry, 2022. Older workers, later lives: financial vulnerability amongst the over 50s. A research collaboration between the University of Edinburgh and Smart Data Foundry, https://www.financialfairness.org.uk/docs?editionId=32f90b4e-335d-44d1-b9d5-919562af71b1.
Social Security Advisory Committee, 2022. Jobs and benefits: the COVID-19 challenge. Independent report, https://www.gov.uk/government/publications/jobs-and-benefits-the-covid-19-challenge/jobs-and-benefits-the-covid-19-challenge.
Williams, R. and Robinson, D., 2024. Projections of housing tenure and poverty in older age in Great Britain, 2022-2040. UK Collaborative Centre for Housing Evidence, https://housingevidence.ac.uk/publications/projections-of-housing-tenure-and-poverty-in-older-age-in-great-britain-2022-2040/.
Wilson, T., Mawhinney, P. and Hopkinson, S., 2022. Credit where it’s due: a briefing on low uptake of pension credit. Independent Age Policy Briefing, https://www.independentage.org/sites/default/files/2022-11/Pension-Credit-briefing_Nov-2022_Independent-Age_0.pdf.
Data
Banks, J., Batty, G. David, Breedvelt, J., Coughlin, K., Crawford, R., Marmot, M., Nazroo, J., Oldfield, Z., Steel, N., Steptoe, A., Wood, M., Zaninotto, P. (2024). English Longitudinal Study of Ageing: Waves 0-10, 1998-2023. [data collection]. 43rd Edition. UK Data Service. SN: 5050, DOI: http://doi.org/10.5255/UKDA-SN-5050-30.
Department for Work and Pensions, NatCen Social Research. (2021). Family Resources Survey. [data series]. 4th Release. UK Data Service. SN: 200017, DOI: http://doi.org/10.5255/UKDA-Series-200017.
Office for National Statistics, Social Survey Division. (2023). Wealth and Assets Survey, Waves 1-5 and Rounds 5-7, 2006-2020. [data collection]. 18th Edition. UK Data Service. SN: 7215, DOI: http://doi.org/10.5255/UKDA-SN-7215-18.
Acknowledgements
The abrdn Financial Fairness Trust has supported this project (grant reference 202206-GR000068) as part of its mission to contribute towards strategic change which improves financial well-being in the UK. Its focus is on tackling financial problems and improving living standards for people on low-to-middle incomes. It is an independent charitable foundation registered in Scotland. Co-funding from the ESRC-funded Centre for the Microeconomic Analysis of Public Policy at IFS (grant number ES/T014334/1) is also gratefully acknowledged.
We are grateful for comments and advice from our Steering Group members, David Gauke (Chair), Jeannie Drake, David Norgrove and Joanne Segars, from Karen Barker and Mubin Haq at the abrdn Financial Fairness Trust. We would also like to thank Janette Weir from Ignition House for the public engagement work undertaken alongside this work that has helped us better understand people’s experience with the means-tested benefit system. We also benefited from the thoughts of many colleagues including Stuart Adam, Paul Johnson and Tom Waters and, in particular, assistance from Anna Henry and Tom Wernham with the microsimulation of potential policy changes.
Data from the Family Resources Survey were accessed through an agreement with the Department for Work and Pensions. Data from the English Longitudinal Study of Ageing (ELSA) were supplied by the ESRC Data Archive. ELSA was developed by researchers based at University College London, the Institute for Fiscal Studies and the National Centre for Social Research, with funding provided by the US National Institute on Aging and a consortium of UK government departments.
This work contains statistical data (Wealth and Assets Survey) from the Office for National Statistics (ONS) which are Crown Copyright. The use of the ONS statistical data in this work does not imply the endorsement of the ONS in relation to the interpretation or analysis of the statistical data. This work uses research data sets which may not exactly reproduce National Statistics aggregates.
Endnotes
Authors

Jonathan Cribb
Jonathan joined IFS in 2011. His research areas includes: pensions, ageing and demographic change, public sector pay, housing, and inequalities.


Heidi Karjalainen
Heidi is a Senior Research Economist in the Retirement, Saving & Ageing sector. Her current research is on pensions and saving for retirement.
More from IFS
Understand this issue


Policy analysis


Academic research


