
Downloads
Download the report as PDF
PDF | 1.34 MB
Executive summary
Individuals in the UK with health conditions may be entitled to two types of benefits – incapacity benefits (for those whose condition prevents them from working) and disability benefits (to help with extra living costs arising from the disability). Since the onset of the pandemic, there has been a substantial increase in the number of individuals claiming these ‘health-related’ benefits – and official projections suggest that claimant numbers will rise further still. This report explores how the new claimants compare with those who began claims before the COVID-19 pandemic, the geography of new claims, and how the UK’s experience compares with that of other developed countries.
Key findings
1. Over the last four years, there has been a large increase in spending on working-age health-related benefits, from £36 billion in 2019–20 to £48 billion in 2023–24, and official forecasts expect this spending to increase further to £63 billion in 2028–29 (all in 2024–25 prices.) Total health-related benefits spending for all ages has increased from £52 billion in 2019–20 to £65 billion in 2023–24. The increase in working-age spending has been mostly driven by an increasing caseload: from 2.2 million in 2019–20 to 3.2 million in 2023–24 for disability benefits (39% growth) and from 2.5 million in 2019–20 to 3.2 million in 2023–24 for incapacity benefits (28% growth).
2. The rapid growth in health-related benefits seems to be largely a UK phenomenon. The number of claimants of similar benefits in most similar countries with available data (Australia, Austria, Canada, Germany, Ireland, the Netherlands, Sweden and the US) has in fact slightly fallen over the same period. There have been small percentage increases in claims in France and Norway. Denmark was the only other country with available data that saw a significant increase and, at 13%, even that was considerably smaller than the increase in health-related benefit claimants in the UK (where claimants for disability benefits have increased by more than 30%).
3. Following recent increases, UK health-related benefits spending is similar to that in comparable countries. Across the OECD (a club of rich countries), spending on working-age health-related benefits averaged 1.6% of GDP in 2019 (latest data). At that point, UK spending was considerably below that level, at 1.3% of GDP; the recent rises have pushed that figure to 1.7%. If spending on health-related benefits continues to grow (as forecast) to 2.1% of GDP in 2028, the UK will likely become one of the highest spenders on health-related benefits amongst comparable countries.
4. The increase in UK disability benefit claimants is due to both more people beginning claims and fewer people ending claims. Before the pandemic, around 250,000 people in England and Wales would start getting working-age disability benefits each year. These figures started to rise in mid 2021, and in the latest data (year to November 2023) almost 500,000 people began claiming disability benefits. At the same time, the share of claimants ending their claim has fallen, from 9.0% in 2019 to 7.4% in 2023. Overall, we estimate that at least two-thirds of the rise in the caseload is explained by an increase in the number of people beginning claims.
5. The new claimants of disability benefits are in some ways not like those who were beginning claims shortly before the pandemic. First, they are younger. The number of new awards made to under-40s has grown by 150% (from 4,500 a month in 2019–20 to 11,500 in 2023–24); growth for 40- to 64-year-olds was ‘only’ 82% (11,000 a month to 20,000 a month). Second, current new claimants are more likely to claim due to mental health problems (including learning, social and behavioural conditions). In 2019–20, 28% of all new awards were primarily for mental health conditions (3,900 claims a month); that figure now stands at 37% (12,100 a month), a 9 percentage point increase. Only 2 percentage points of this rise is accounted for by the increasing rate of claims among younger individuals – there has been a marked rise in claiming for mental health reasons at all ages. Third, new claimants are slightly more likely to be women, whose share of new claims has grown from 55% in 2019–20 to 58% in 2023–24.
6. New claimants have a similar attachment to the labour market now as they did before the pandemic. Both prior to and since the pandemic, the share of new disability benefit claimants out of work was around 70%. There has been a slight increase in the share of new claimants who have worked within the last two years, from 37% to 40%, but it remains the case that most new disability benefit claimants have been out of work for more than two years.
7. Broadly, the growth in claims has been fastest in areas that already had a large number of claimants. For example, in Merthyr Tydfil and Blackpool, around 15% of 16- to 64-year-olds were in receipt of a health-related benefit before the pandemic. Now that figure is around 19%. Conversely, in Windsor & Maidenhead and Wokingham, around 3% were receiving one of these benefits before the pandemic, and now around 4% are. After accounting for the pre-pandemic number of claimants, there is no relationship between the growth in claims and the local employment rate, or how the local employment rate has changed since the pandemic.
1. What are health-related benefits?
Health-related benefits in the UK are often grouped into two categories: incapacity benefits and disability benefits. Incapacity benefits supplement incomes for people whose health is judged to limit their ability to work. They are mostly means tested (only available to adults in low-income families). New claimants to means-tested incapacity benefits would receive additional support through universal credit (UC). Under UC, a new claimant assessed to have ‘limited capability for work-related activity’ receives an additional £4,994 a year on top the rest of their UC award and are exempted from requirements to look for a job. Those assessed as having a ‘limited capability for work’ – indicating a less severe incapacity – do not receive additional support but are exempted from some job-search requirements.
Disability benefits are intended to help cover additional living costs faced by people with disabilities. Personal independence payment (PIP) is the main disability benefit for working-age adults in the UK. It is not means tested and provides support of £1,500 to £9,610 a year. Eligibility and the level of support depend on an assessment of the applicant’s inability to do a range of tasks. Over the last 11 years, PIP has gradually replaced disability living allowance (DLA) for adults, although 6% of disability benefit claimants aged 16–64 are still on DLA. There are also disability benefits for children and pensioners; in this report, we focus on the working-age system. Scotland has also recently begun to replace PIP with its own benefit (adult disability payment); this creates some data difficulties, and so for some statistics on disability benefits we exclude Scotland.
This report focuses on incapacity and disability benefits. We do not include housing-related benefits received by disabled people, industrial injuries benefits or benefits provided to carers within our definition of health-related benefits.
2. How have health-related benefit spending and claimant numbers changed?
Spending on health-related benefits has grown rapidly over the last few years. Figure 1 shows that spending has grown from 1.3% of GDP in 2019–20 (£36 billion in 2024–25 prices) to 1.7% of GDP in 2023–24 (£48 billion). The official forecast is for it to reach 2.1% of GDP (£63 billion) by 2028–29, an all-time high. The rise has been faster for disability benefits: since 2019–20, disability benefit spending has grown by 45% in real terms and incapacity benefit spending by 26%.
Figure 1. Spending on working-age health-related benefits as a share of GDP
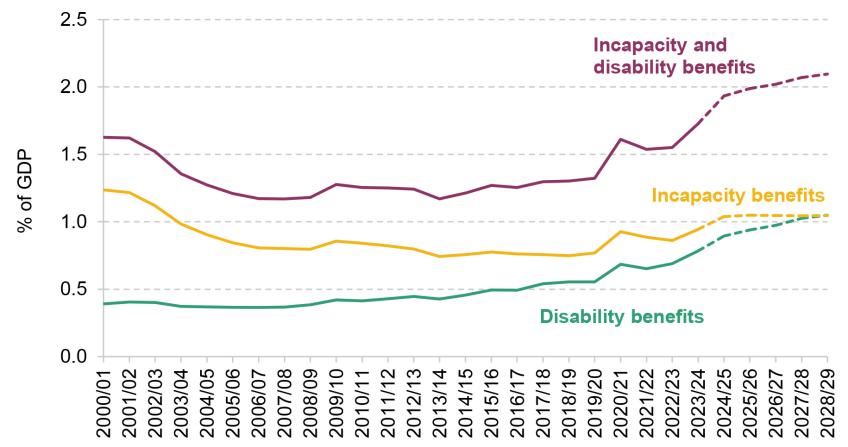
Note: Spending only for Great Britain compared with GDP for the United Kingdom.
Source: Authors’ calculations using DWP benefit expenditure and caseload tables 2024, chart 2.9 of Office for Budget Responsibility (2023) and Scottish Fiscal Commission out-turn and expenditure data.
Almost all the increase in spending since 2019–20 is due to more people claiming health-related benefits, rather than higher awards to claimants.1 The caseload for incapacity benefits has grown by 28% since 2019–20 and the disability benefits caseload by 39% – reversing previous declines in the incapacity benefits caseload and representing a significant acceleration in the pre-pandemic growth in the disability benefits caseload (see Figure 2). Official forecasts (which are highly uncertain) project that the caseloads will grow by a further 19% and 41% respectively by the end of the parliament.
Figure 2. Share of working-age population claiming health-related benefits
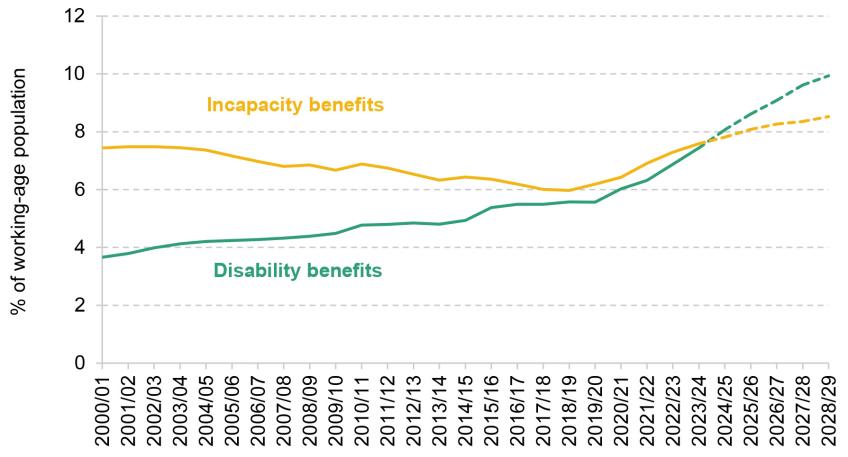
Note: Estimates of working-age population account for changes in state pension age.2
Source: Authors’ calculations using DWP benefit expenditure and caseload tables 2024, chart 2.9 of Office for Budget Responsibility (2023), Scottish Fiscal Commission and ONS population projections.
These increases mean that in England and Wales, 3.9 million working-age adults – 10.0% – now claim either incapacity or disability benefits (2.9 million – 7.6% – get incapacity benefits; 2.7 million – 7.0% – get disability benefits; just under half of claimants of health-related benefits get both).3 Prior to the pandemic, 2.8 million got at least one of these benefits (7.5% of working-age adults).
The increase in health-related benefits claims coincides with an increasing share of the working-age population reporting a disability. This figure was already rising before the pandemic, from 17% in 2014 to 19% in 2019. Since the pandemic, it has increased further: in 2023, 24% of the working-age population reported a disability. Most people with disabilities still do not claim incapacity or disability benefits. However, health-related benefit claims have grown faster than reported disability. We estimate that the share of people with a disability claiming health-related benefits has grown from 39% in 2019 to 41% in 2023.4
3. How does the UK compare with other countries?
Given that these rapid rises roughly coincide with the global pandemic, a natural question – and one that is potentially useful in pinning down what is driving the rise – is whether other countries have had similar experiences.
Of course, benefit systems vary across countries in their eligibility criteria and generosity, and so one would not expect the rate of people claiming to be the same even in countries that are otherwise similar. Nonetheless, the change in the caseload since the pandemic should still be instructive. There does not appear to be an existing database of health-related benefit claims across countries with much post-pandemic data; we therefore compiled data from various countries’ ministries and statistical offices where they were available. From these, we have calculated the share of the working-age population claiming health-related benefits.
Figure 3 shows that share – indexed to 2019, in order to ease post-pandemic comparisons. The share of people claiming health-related benefits has remained similar to pre-pandemic levels or declined in almost all other countries. Denmark is the only other country that has seen a significant rise in health-related benefit claims – still much smaller than that in the UK – which follows a decline in the previous decade.
Figure 3. Share of working-age population claiming selected health-related benefits: selected countries (indexed to 2019)
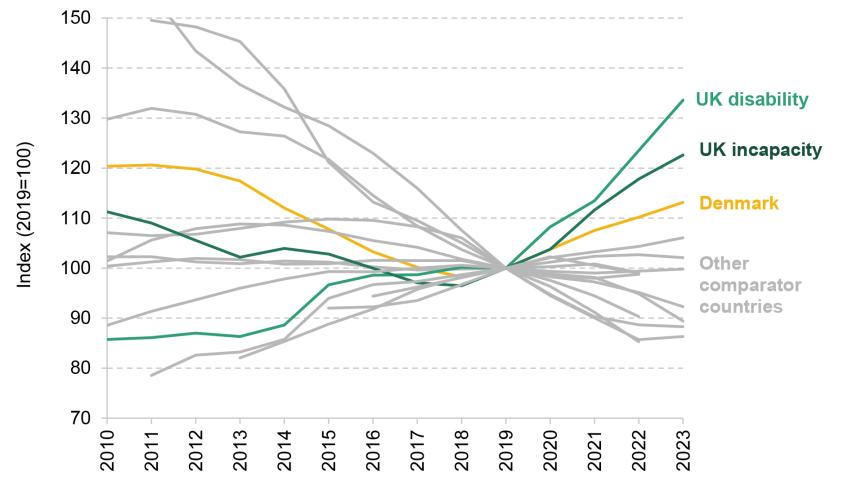
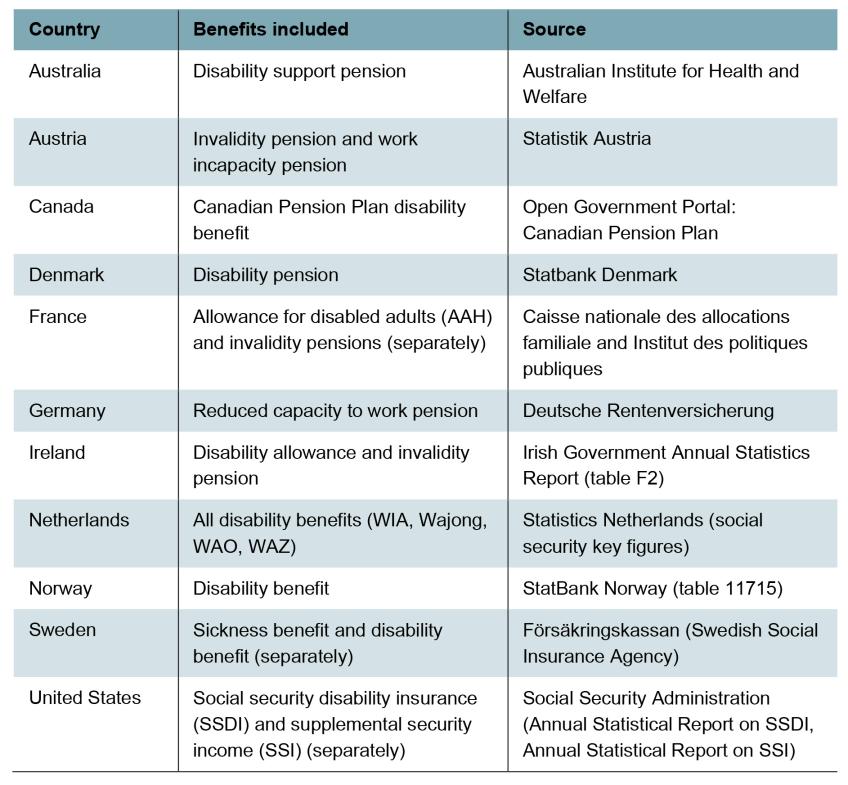
Note: Selected list of countries based on data availability. May not include all health-related benefits in relevant countries. Comparator countries are Australia, Austria, Canada, Denmark, France, Germany, Ireland, the Netherlands, Norway, Sweden and the US. For Ireland, Sweden and the US, we include information on multiple benefits separately as combined caseloads are not available.
Source: Authors’ calculations based on Figure 2 and national data for comparison countries. For country-specific detail on sources, see Table A4.
This suggests that there are UK-specific factors driving the recent upsurge in claims and indicates that the explanation for the rise is more complicated than two of the obvious contenders: the after-effects of the Covid pandemic and the rising cost of living. If the key cause was a shared factor such as these, we would expect to see more similar trends in other comparable countries that also experienced these shocks (albeit to somewhat differing degrees). This is not to say these two factors are irrelevant. It is entirely possible that health-related benefit claims have increased due to the interaction of these shocks with the nature of the UK economy and the design and condition of the UK’s public services. For instance, the UK is one of the few countries with a disability cash benefit such as PIP, which is not conditional on employment or income. This might mean that UK benefits are more responsive to health or cost shocks, irrespective of employment rates.
There is some also evidence that the UK has had a larger health shock than elsewhere. The share of people reporting a disability has increased by 5 people per 100 in the UK, whereas more like 2 people per 100 on average across the European Union (see Table A1). There has also been increase in economic inactivity due to ill health in the UK but not in most comparable countries (Office for Budget Responsibility, 2023). So, part of the story may be that the UK has had a particularly large health shock, perhaps due to the big increase in NHS waiting lists. This is unlikely to be a complete explanation though. If worsening health was the only factor driving increased health-related benefit claims, we would expect to see some increase in claims in other countries, even if those increases were slower than in the UK. Instead, we see no increase in most comparable countries.
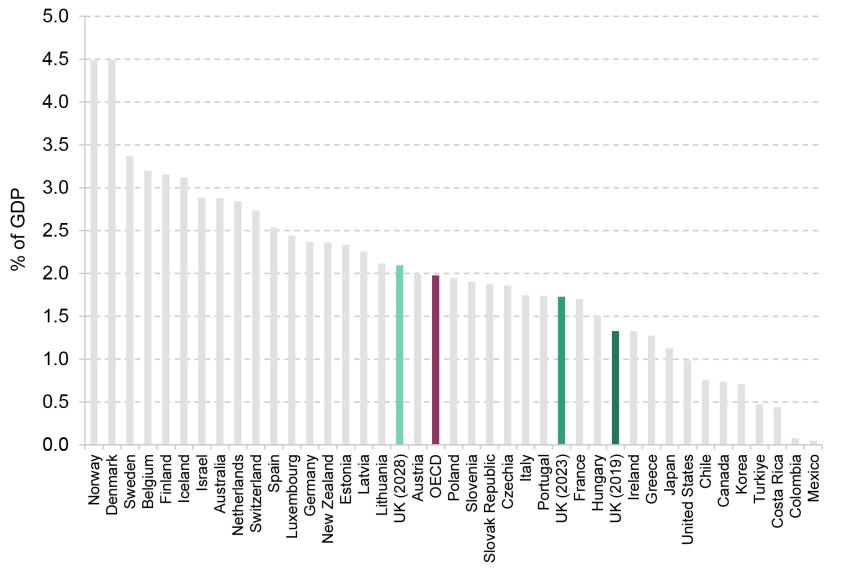
An important piece of context is that UK health-related benefit spending was lower than that in many comparable countries before the pandemic. Figure 4 shows spending on total health-related benefits for countries in the OECD (a club of rich countries) in 2019. In 2019, the UK spent 1.3% of GDP on health-related benefits (shown by the dark green bar) – below the OECD average (1.6% of GDP, shown by the purple bar). The two lighter green bars show UK health-related benefit spending in 2023 and projections for 2028. Even if health-related benefits grow as fast as official forecasts suggest, the UK’s 2028 health-related benefit spending would still be similar to the 2019 levels for comparable countries such as the Netherlands or New Zealand.
Figure 4. Sickness and disability benefits cash spending as a share of GDP: OECD countries (2019) and UK (2019, 2023, 2028)
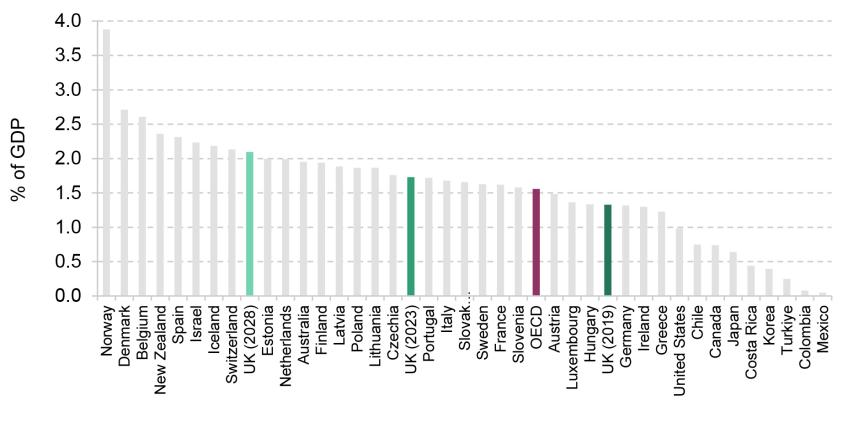
Note: This figure only includes cash spending on the working-age population. Some countries also have in-kind spending on programmes that provide assets to disabled people and directly provide care and support to disabled people. Adding in-kind benefits increases the OECD average from 1.6% to 2.0% of GDP. Figure A1 shows the distribution of total health-related benefits spending across OECD.
Source: Authors’ calculations using OECD social expenditure tables and Figure 1.
4. Flows into and out of disability benefits
The rise in the health-related benefit caseload that we have seen could be because more people are starting claims or because fewer people are ending them. This is the issue we turn to now. We focus on disability benefits, partly because there are better data available than for incapacity benefits and partly because disability benefits have seen faster growth than incapacity benefits. We will also focus on England and Wales as comparable statistics are only available for these two countries. Box 1 briefly discusses trends in disability benefit claims in Scotland following devolution of these benefits.
Box 1. Disability benefits in Scotland
Disability benefits were devolved to Scotland in 2022–23. The Scottish Government has replaced PIP with adult disability payment (ADP) in Scotland. The benefit levels for ADP match those for PIP but the assessment process is different. ADP applications require less information from claimants initially and only use a medical assessment if necessary (Scottish Government, 2022).
Since the introduction of ADP, new applications for disability benefits have increased faster in Scotland than in England and Wales. New applications to ADP in Scotland – as a share of the working-age population – were 41% higher in the three months to May 2023 than in the three months to May 2022 (Scottish Fiscal Commission, 2023). In comparison, new applications grew by only 16% in England and Wales in the same period. However, this is not a key driver of the aggregate growth in disability benefit claims. Scotland only makes up around 1 in 10 of the disability benefit claims in Great Britain, and some of the growth in disability benefit claims occurred before 2022. We estimate that the introduction of the ADP can only explain 2% of the growth in disability benefit claims in Great Britain between 2019–20 and 2023–24.
Figure 5 shows inflows and outflows for working-age disability benefits as a percentage of the working-age population. There has been a dramatic rise in inflows since 2019–20. Between 2019–20 and 2023–24, inflows into disability benefits have almost doubled from 250,000 a year (around 0.7% of the working-age population) to 490,000 a year (around 1.2% of the working- age population). At the same time, outflows have fallen, both as a percentage of population and as a percentage of claimants. We estimate that at least two-thirds of the increase in the caseload since 2019–20 is due to the rise in inflows.5
Figure 5. Annual flows into and out of working-age disability benefits as a share of working-age population
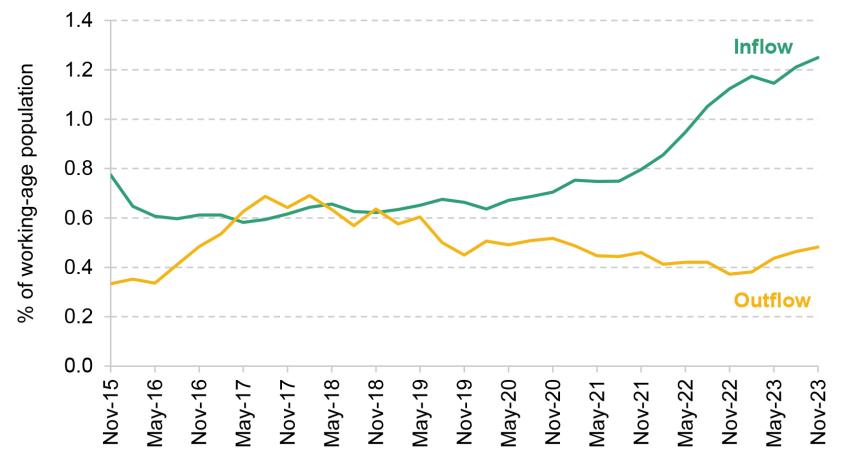
Note: This graph shows a four-quarter rolling sum of quarterly flow rates. Inflows include all new claims to PIP and successful reassessments from child DLA. Outflows include all outflows off PIP and outflows off adult DLA. These are estimates based on duration of claim information for PIP and DLA. For DLA, this may overstate outflows and inflows as people changing the reason for their claim may be counted as an inflow and an outflow.
Source: Authors’ calculations using DWP Stat-Xplore data.
Inflows
These patterns raise the question of why there are more people flowing into disability benefits. There are several stages that a claimant must go through to get the benefit, each of which could contribute to more awards. We cover these in turn.
- Register an application. Claimants must first ring the Department for Work and Pensions (DWP), provide some basic information about themselves (such as age and gender) and request a form.6 Between 2019–20 and 2023–24, the number of new registrations has almost doubled – similar to the percentage change in new awards. We estimate that more than 80% of the increase in inflows to PIP is due to an increasing number of people registering an application.
- Reach assessment. Some people who register an application are never assessed because they do not fill in subsequent forms or attend the assessment. In 2019–20, 72% of those who registered an application reached assessment; this had risen to 86% in 2023–24, accounting for around 10% of the overall increase in inflows. Part of this increase may be accounted for by the new option to fill out the form about their health needs online (since December 2021). The OBR also suggests that DWP has altered its approach to be more flexible to claimant needs in response to the Philippa Day case (Office for Budget Responsibility, 2023). This is in line with previous evidence which has shown that reducing the administration costs of applying for benefits can increase the number of claimants (Deshpande and Li, 2019).
- Be awarded PIP. There has been little change in the share of claimants being awarded PIP after initial assessment: it was 52% in 2019–20 and 54% in 2023–24.7, 8
Outflows
The share of disability benefit claimants flowing off the benefit each year (outflow rate) has fallen from 9.0% of claimants in 2019 to 7.4% in 2023. Figure 6 shows the percentage of claimants whose claim has ended, split by the duration of their claim and the year.9 For instance, the 2023 bar in the ‘5 years since start of claim’ category focuses on people who at the beginning of 2023 had been on PIP for five years (so started their claim in 2018) and shows the share of them who left PIP in 2023. Two key points emerge. First, typically in any given year, outflows tend to be highest for claimants in the third year of their claim. This is likely because a common award length is two years before claimants are reassessed. Second, the graph shows that outflow rates have been declining across all claimant lengths over time (i.e. the darker bars are smaller than the lighter bars). Outflow rates are particularly low in 2023. For example, in every year between 2018 and 2022, more than 7% of claimants who had already been on PIP for two years left that year. This fell to 3.3% in 2023, less than half the previous rate. More investigation is needed to understand why outflow rates appear to have fallen so dramatically. If outflow rates remain low, the caseload could continue to grow even if inflow rates fell back to pre-pandemic norms.
Figure 6. Share of claimants leaving PIP, by year and duration of claim
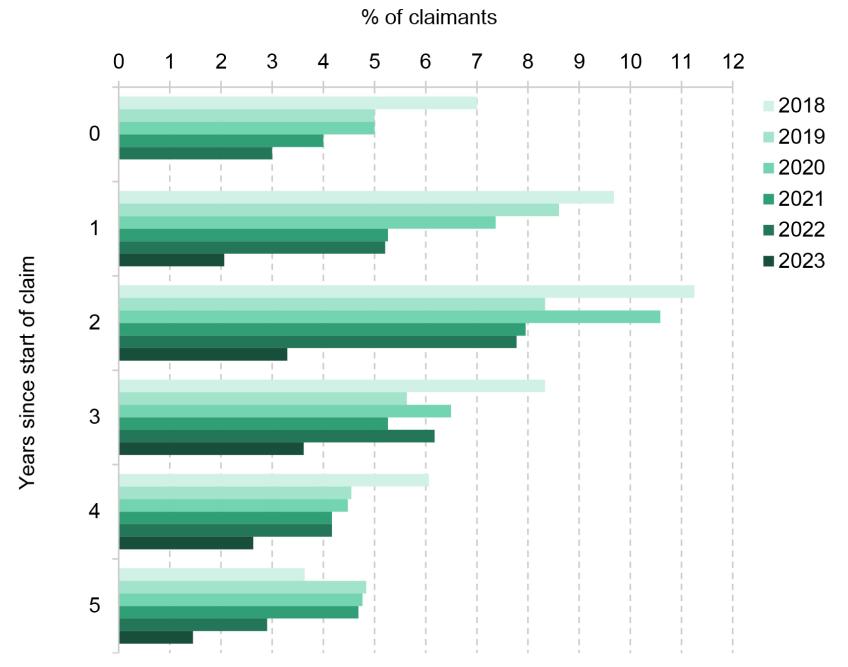
Note: Excludes PIP claimants who were reassessed from DLA and excludes PIP claimants on the Special Rules for End of Life.
Source: Authors’ calculations using DWP Health and Disability Green Paper evidence pack 2024.
5. Who are the new claimants?
Given the dramatic rise in the number of people beginning a claim, one might expect them to be importantly different from those who were beginning claims pre-pandemic. This is the topic to which we now turn.
Age and gender
New PIP claimants are now younger. Figure 7 shows the growth in new awards split by age and gender, comparing 2023–24 with 2019–20. The left-hand panel presents growth in proportional terms and the right-hand panel the absolute difference. In proportional terms, there has been much faster growth in claims for younger groups. The number of new awards to under-40s has grown by 150%, compared with 82% for 40- to 64-year-olds. In contrast, in absolute terms, there has actually been a greater increase in claims amongst 40- to 64-year-olds (9,000 additional claims a month compared with 7,000 for under-40s). This is because in 2019–20 there were far more claims amongst 40- to 64-year-olds.10
Figure 7. Growth and change in monthly PIP awards by age and gender, 2019–20 to 2023–24
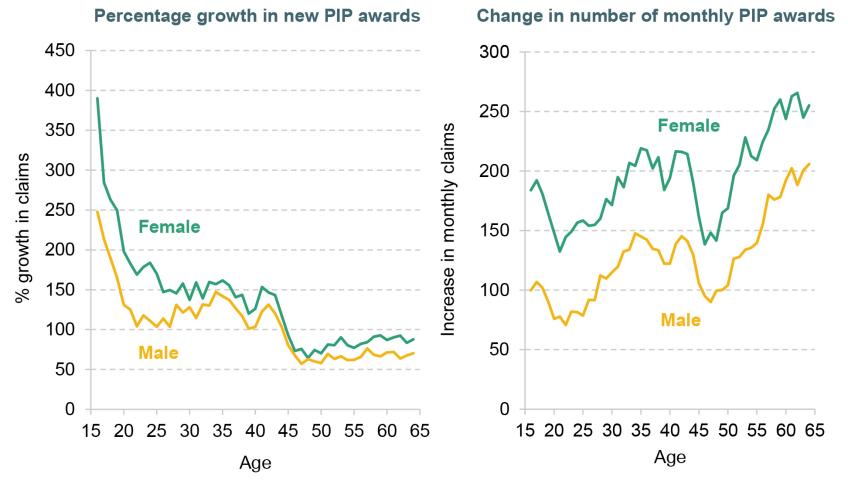
Note: Only includes initial claimants initially awarded PIP. Does not include successful appeals or reassessments from DLA.
Source: Authors’ calculations using DWP Stat-Xplore.
New claimants are now more likely to be female than they were pre-pandemic. The left-hand panel of Figure 7 shows that across all age groups, there has been faster growth in new claims for women. The share of new claims made by women has grown from 55% in 2019–20 to 58% in 2023–24.11
Health conditions
New claimants have become more likely to be claiming due to mental health conditions. Figure 8 shows how the number of new awards has changed by condition. The bars show that the number of awards has grown for each condition group. Claims have increased most for the two biggest groups: musculoskeletal disease (e.g. arthritis, back pain) and mental health conditions (e.g. anxiety and depression). Proportionally, new awards for learning, social and behavioural conditions have grown fastest (a 412% increase) followed by mental health issues (a 190% increase). This fast growth means that the share of awards for mental health conditions, or learning, social and behavioural conditions, has grown from 28% in 2019–20 to 37% in 2023–24.
Figure 8. Growth and change in monthly PIP awards by condition, 2019–20 to 2023–24
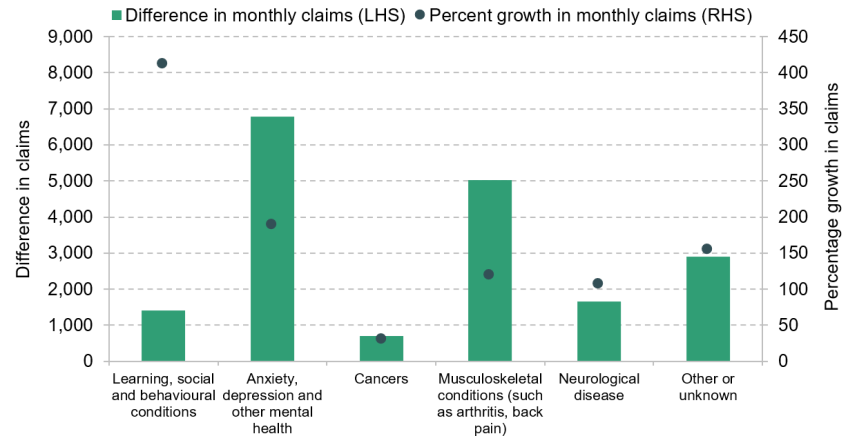
Note: Only includes initial awards for new PIP claims. Excludes awards on appeal or reassessments from DLA. Learning, social and behavioural conditions include specific learning difficulties such as dyslexia, learning disabilities and hyperkinetic disorders (e.g. ADHD), and autism spectrum disorder.
Source: Authors’ calculations using DWP Stat-Xplore.
The shift towards mental health conditions mirrors the wider shift in population health. Of people with disabilities, 38% reported a mental health problem (including learning, social and behavioural conditions) in 2014, 45% in 2019 and 52% in 2023.12 In Autumn 2022, 16% of adults had moderate to severe depressive symptoms up from 10% in 2019–20 (Office for National Statistics, 2022). We should interpret these figures with some caution as it is difficult to isolate changes in mental health from changes in norms about reporting mental health problems, but they do indicate worsening mental health across the population.
Given that the increase in claims has been tilted to younger people, a natural question is how much this accounts for the rise in claims for mental health reasons. Figure 9 investigates this issue, showing the share of new PIP awards that were primarily for mental health issues in 2019–20 and 2023–24 split by age and gender. Two points stand out. First, there is a persistent, steep gradient by age. In 2023–24, 82% of awards to 16-year-old women were primarily due to mental health conditions compared with 12% for 64-year-old women. This does indeed mean that part of the shift towards mental health claims is due to more claims from younger people. But, second, mental health claims are now a bigger share of claims for all ages than they were in 2019–20. The share of claims that relate to mental health within a given age–gender combination has increased by 7 percentage points on average. This accounts for most of the shift towards mental health claims in aggregate.13
Figure 9. Share of new PIP awards primarily for mental health issues, 2019–20 to 2023–24

Note: Only includes initial awards. Excludes awards on appeal or reassessments from DLA.
Source: Authors’ calculations using DWP Stat-Xplore.
The above statistics only cover claimants’ ‘main’ condition – but many disability benefit claimants have multiple health problems. Survey evidence suggests that 59% of new disability benefit claimants report multiple long-lasting health problems and 35% report both mental and physical health problems. Multiple health problems are more common amongst older claimants: 72% of new disability benefit claimants over age 50 report more than one long-lasting health problem and 40% report both mental and physical health problems. Any policy responses to the challenge of rising health-related benefit claims should account for the interaction between mental and physical health problems.
Employment history
The pandemic had profound labour market consequences, and the implications for individuals’ employment outcomes could have knock-on effects on health-related benefit claiming; previous evidence has shown that health-related benefits claims increase when local economic conditions are weak (Black, Daniel and Sanders, 2002; Charles, Li and Stephens, 2018). Table 1 compares the labour market histories of those who began a claim after the start of the pandemic and of those who began one in the five years before the pandemic, for both disability benefits and incapacity benefits. It shows that the share of new claimants who have recently left their job increased slightly (from 10.5% to 12.0% for disability benefits and from 19.1% to 21.0% for incapacity benefits), but it remains the case that most claimants have not worked in the two years before starting a claim (61% for disability benefits and 65% for incapacity benefits). There has been an increase in the share of new claimants who have never worked and a decline in the share who last worked at least five years ago, though this is likely driven at least in part by the shift towards younger claimants.
Table 1. Share of new claims for health-related benefits by employment history, 2014–23
| Employment history | Disability benefits (PIP/DLA) | Incapacity benefits | ||||
| Pre-pandemic (%) | Post-pandemic (%) | Difference (ppt) | Pre-pandemic (%) | Post-pandemic (%) | Difference (ppt) | |
| Currently work full-time | 12.3 | 12.8 | 0.5 | 4.6 | 6.4 | 1.8 |
| Currently work part-time | 13.6 | 13.6 | 0.0 | 5.3 | 6.1 | 0.9 |
| Total working | 25.9 | 26.4 | 0.5 | 9.9 | 12.6 | 2.7 |
| Left last job within two years | 10.5 | 12.0 | 1.5 | 19.1 | 21.0 | 1.9 |
| Left last job two to five years ago | 9.9 | 10.8 | 0.9 | 11.4 | 10.7 | –0.8 |
| Left last job more than five years ago | 36.0 | 28.9 | –7.1 | 41.0 | 33.8 | –7.2 |
| Never had a job | 16.9 | 20.8 | 3.9 | 17.3 | 20.8 | 3.5 |
| Total not worked in last two years | 62.8 | 60.5 | –2.2 | 69.8 | 65.3 | –4.5 |
| Total not working | 73.2 | 72.5 | –0.7 | 88.9 | 86.3 | –2.6 |
| Unknown | 0.9 | 1.1 | 0.2 | 1.3 | 1.2 | –0.1 |
Note: ‘Pre-pandemic’ refers to claimants who began their claims between 2014 Q3 and 2020 Q1. ‘Post-pandemic’ refers to claimants who began their claims between 2020 Q2 and 2023 Q4. No data are available for new claimants in 2023 Q2 and 2023 Q3, due to issues with the Labour Force Survey, so these quarters are excluded. The table only includes the population aged 16–64. These figures use survey data. Any small differences pre- and post-pandemic may reflect volatility in the sample. We classify anyone claiming employment & support allowance, incapacity benefit or severe disablement allowance as incapacity benefit claimants. We also count universal credit claimants as incapacity benefit claimants if they state the main reason for claiming is sickness/disability. This is an imprecise measure for universal credit health claimants as people can claim universal credit for multiple reasons.
Source: Authors’ calculations using Labour Force Survey.
This provides some evidence that while worsening labour market conditions may be a small contributing factor, they are not the primary cause behind the rise in claims. Most claimants of health-related benefits did not work in the two years prior to starting their claim, and while programmes to encourage or help them into work could have some impact on reducing the caseload, that is about as true now as it was before the pandemic – in other words, it does not seem that introducing such programmes would be a policy response specifically tailored to deal with the recent rapid rise.
Education levels
Finally, we turn to the level of education of new claimants – a factor relevant for thinking about how the rise in health-related benefit claims interacts with broader inequalities, as well as the appropriate policy response. Table 2 shows that only two-fifths of new disability benefit claimants have at least an A level. In comparison, approximately two-thirds of the wider working-age population have an A level. There has been a slight increase in the share of new disability benefit claimants with at least an A level from 39% before the pandemic to 43% since. However, this is roughly in line with increasing education levels across the wider population; the rate of new disability claims has grown similarly across groups with different qualification levels.
Table 2. Share of new claims for health-related benefits by highest qualification
| Highest qualification | Disability benefits (PIP/DLA) | Incapacity benefits | ||||
| Pre-pandemic (%) | Post-pandemic (%) | Difference (ppt) | Pre-pandemic (%) | Post-pandemic (%) | Difference (ppt) | |
| Degree or equivalent | 13.6 | 15.9 | 2.3 | 8.2 | 11.1 | 2.9 |
| Other higher education | 7.7 | 6.9 | –0.8 | 6.7 | 5.3 | –1.4 |
| A level or equivalent | 17.9 | 20.7 | 2.8 | 17.4 | 21.8 | 4.4 |
| Total, A levels or higher | 39.2 | 43.4 | 4.3 | 32.2 | 38.2 | 6.0 |
| GCSE grades A*–C or equivalent | 24.8 | 24.0 | –0.8 | 25.4 | 24.2 | –1.1 |
| Other qualifications | 14.4 | 11.8 | –2.6 | 16.1 | 15.5 | –0.7 |
| No qualifications | 20.8 | 19.1 | –1.7 | 25.5 | 19.9 | –5.6 |
| Unknown | 0.9 | 1.6 | 0.8 | 0.8 | 2.2 | 1.4 |
Note: See note to Table 1.
Source: Authors’ calculations using Labour Force Survey.
6. Where do the new claimants live?
Finally, we explore how the geography of health-related benefit claims has changed and what this tells us about the increase in claims.
There are stark geographic differences in the prevalence of health-related benefit claims. Figure 10 plots, for each local authority, the shares of the working-age population claiming health-related benefits in 2019–20 and 2023–24, on the horizontal and vertical axes respectively. The claim rate is four times higher in Blackpool (19.1%) or Merthyr Tydfil (18.4%) than in Wokingham (4.3%) or Windsor and Maidenhead (4.7%). These geographic differences map closely to differences in health outcomes and labour market strength (see Table A2). Richer and healthier areas, typically in London and the South East, have much lower claim rates than areas such as Wales and the North East (see Figure A2, which maps claims in England and Wales).
Figure 10. Share of working-age population claiming any health-related benefit by local authority, 2019–20 versus 2023–24
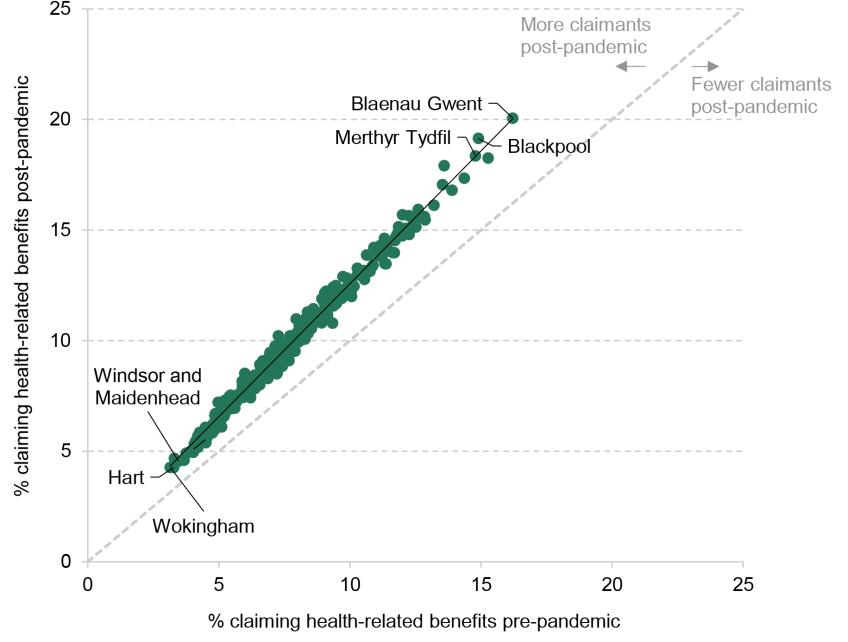
Note: Only includes adults aged 16–64. 2019–20 data cover May 2019 to April 2020 and 2023–24 data cover February 2023 to January 2024. Excludes City of London and Isles of Scilly.
Source: Authors’ calculations using DWP Stat-Xplore benefit combinations and ONS 2024 local population estimates.
Figure 10 also shows that the growth in health-related benefit claims has been – in absolute terms – larger for those local authorities that already had higher claim rates, though every single local authority apart from City of London has seen an increase in claims. These rises are approximately proportional to the number of claimants in 2019–20. This is shown by the fact that almost all local authorities are close to the solid line, which depicts the relationship between 2023–24 and 2019–20 claim rates. For instance, the claim rate in Blackpool has increased from 14.9% to 19.1%, a 28% increase (4.2 percentage points); in Wokingham, the claim rate has increased from 3.1% to 4.3%, a 36% increase (1.1 percentage points). Rises being proportional to 2019–20 claims means that the concentration of claims in the highest-claiming areas has remained broadly the same. Claim rates remain three times higher in the 10% of local authorities with the highest claim rates relative to the 10% of local authorities with the lowest claim rates.
We tested whether the rise in claims is associated with a range of factors – the share of people who reported a disability pre-pandemic, the employment rate pre-pandemic, the change in employment rate, and exposure to local lockdowns – controlling for the 2019–20 claim rate.14 Those areas with more people reporting a disability before the pandemic saw faster growth in claims, suggesting that some of the increase is accounted for by those with a disability but not claiming health-related benefits before the pandemic now claiming. Importantly, the labour market variables showed no association with the increase in claims – areas with high and low employment rates saw similar changes in benefit claims (after controlling for the 2019–20 claim rate), as did those areas where employment had risen or fallen. This is consistent with the evidence presented above, that the rise in claims does not seem to be primarily driven by shifts in the labour market.
7. Conclusions
To conclude, we reflect on what our analysis implies about the causes of the rise in health-related benefit claims. We also briefly assess the policy options facing the government.
The rise in health-related benefit claims eludes three simple explanations. One would be that the COVID-19 pandemic worsened population health and this drove up health-related benefit claims. This explanation may play a role – population health does appear to have worsened since 2019 – but cannot be the whole picture as most comparable countries have also seen increases in reported disability (even if less so than in the UK) but had no rise in health-related benefit claims. Similarly, high rates of inflation occurred across the western world, but the rise in health-related benefit claims is almost unique to the UK. Finally, there is little evidence to suggest that a shift in labour market conditions is playing a major role. We have not seen a big increase in claimants who have recently stopped working, with the labour market history of recent claimants similar to that of people who began claiming shortly before the pandemic. Nor has the rise been faster in areas with weaker employment growth since the pandemic.
More plausible explanations involve the interaction between recent health and income shocks and the condition of the UK’s economy, welfare system and public services. The UK’s health system has struggled to cope since the pandemic, and this may mean COVID has (directly or indirectly) had a greater impact on health and health-related benefit claims in the UK than elsewhere. The design of the UK’s benefit system (including employment support) also matters. For instance, the level of basic unemployment support is lower relative to earnings in the UK than in most comparable countries and the UK system has demanding job-search requirements. This may mean that following a shock to real incomes, more people with health conditions in the UK apply for health-related benefits than in other countries. There have also been some changes to the application process for disability benefits, which could have played some role in the increase in applications and claimants. More research is needed to untangle potential causes and their interactions. This is the first report in a series: in subsequent reports, we will explore in more detail the role of health and income shocks in the recent rise in health-related benefit claims.
So how might the government respond to the recent rise in health-related benefit claims. It faces four options, none of them easy. First, it could look to improve the health of the population and the economy, including addressing broader socio-economic drivers of poor health outcomes. For instance, the government could invest in NHS provision to reduce the number of people waiting for care or invest in programmes that support disabled people into work. Both would reduce demand for health-related benefits and have wider benefits for society. However, improved health and employment support are hard to deliver, would likely take time to have any effect on claims and will likely require significant fiscal outlay.
Second, the government could do nothing. This is a reasonable response – especially if the rise is in fact health-driven – but an expensive one. Spending has already grown by £12 billion since 2019 and is forecast to grow by a further £15 billion by 2028 (both in 2024–25 prices).
The government could also look to reform the health-related benefits system. The Labour Party has already committed to reforming the work capability assessment (which determines eligibility for the health element of universal credit). However, saving money by changing eligibility is difficult. The coalition government planned to reduce spending by replacing DLA with PIP in 2013. In fact, spending grew faster following the introduction of PIP. Finally, a very direct option would be to reduce the level of health-related benefits. This could be done almost immediately and deliver predictable savings.
Naturally, any savings from either changes to eligibility or changes to benefit levels would reduce incomes for health-related benefit recipients. Cribb, Karjalainen and Waters (2022) show that people on disability benefits are more likely to be in poverty and material deprivation than working-age adults in general. Making up the shortfall from any cuts could be extremely challenging for some claimants whose condition prevents them from working and this could have implications for their health.
None of these options is obvious or easy, and a lack of clarity on what is behind the rise in the number of claimants only makes the government’s job harder. More work to understand the phenomenon could go a long way to shedding some light on what the path forward might be.
Appendix
Figure A1. Sickness and disability benefits total working-age spending as a percentage of GDP: OECD countries (2019) and UK (2019, 2023, 2028)
Note: Only includes spending on working-age population. Includes in-kind spending and cash spending.
Source: Authors’ calculations using OECD social expenditure tables and Figure 1.
Table A1. Percentage of population aged 16–64 reporting a disability
| Country | Disability rate, 2019 | Disability rate, 2023 | Difference |
| Austria | 27.4 | 23.9 | –3.5 |
| Germany | 17.5 | 19.4 | 1.9 |
| Denmark | 27.7 | 32.8 | 5.1 |
| European Union | 16.8 | 18.6 | 1.8 |
| France | 18.2 | 19.9 | 1.7 |
| Ireland | 12.6 | 16.0 | 3.4 |
| Netherlands | 23.6 | 25.9 | 2.3 |
| Sweden | 10.6 | 19.4 | 8.8 |
| United Kingdom | 19.0 | 23.8 | 4.8 |
Note: A different measure and source are used for the UK as comparable data are not available for this period. This may lead to differences in levels. UK data use the ONS harmonised definition of disability. EU figures are people reporting a disability that limits their daily activity.
Source: Authors’ calculations using Eurostat HH-SILC table 12 and Labour Force Survey.
Figure A2. Share of working-age population claiming health-related benefits
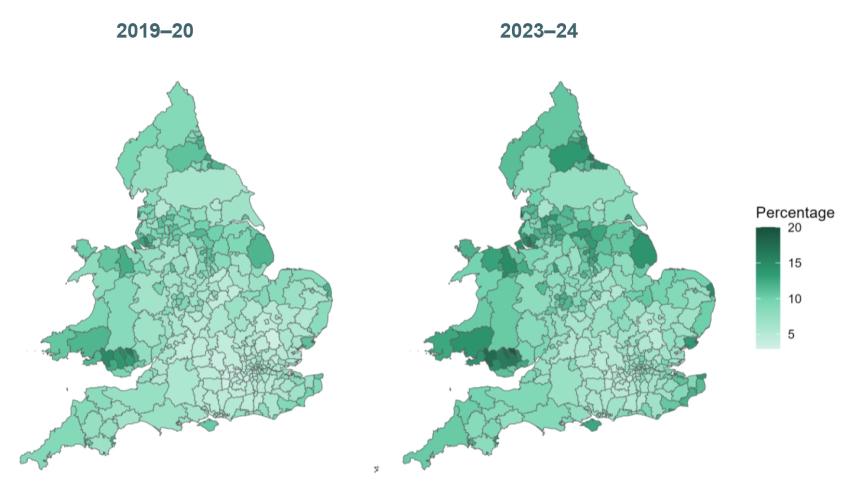
Note: Only includes adults aged 16–64. 2019–20 data cover May 2019 to April 2020 and 2023–24 data cover February 2023 to January 2024.
Source: Authors’ calculations using DWP Stat-Xplore benefit combinations and ONS 2024 local population estimates.
Table A2. Correlations between local measures of health and labour market strength with pre-pandemic health-related benefit claimant rates (2019)
| Variable | Correlation |
| Employment rate | –0.56 |
| Average weekly pay | –0.62 |
| Disability rate | +0.64 |
| Life expectancy at birth (women) | –0.86 |
| Life expectancy at birth (men) | –0.84 |
Note: Values range from –1 (strong negative association) to +1 (strong positive association). Only includes the 308 local authorities in England and Wales with no missing values for any data point. All data relate to 2019 other than life expectancy data, which relate to 2017–19.
Source: Authors’ calculations using DWP Stat-Xplore, Annual Survey of Hours and Earnings, Annual Population Survey, ONS life expectancy for local areas (published January 2024) and ONS 2024 population estimates.
Table A3. Regressions of change in health-related benefits claim at local authority level
| Variables | (1) | (2) | (3) | (4) | (5) |
| Intercept | 0.56*** (0.00) | 2.08*** (0.00) | 0.39*** (0.00) | 0.84 (0.06) | 1.03* (0.04) |
| Pre-pandemic claimant rate | 0.20*** (0.00) | 0.19*** (0.00) | 0.18*** (0.00) | 0.18*** (0.00) | |
| Pre-pandemic disability rate | 0.01* (0.02) | 0.01* (0.04) | 0.01* (0.03) | ||
| Change in employment rate | 0.00 (0.81) | –0.00 (0.29) | |||
| Pre-pandemic employment rate | –0.00 (0.32) | –0.01 (0.19) | |||
| Indoor mixing ban: medium | –0.03 (0.47) | –0.04 (0.37) | |||
| Indoor mixing ban: high | 0.03 (0.68) | 0.03 (0.72) | |||
| Number of observations | 316 | 316 | 316 | 316 | 316 |
| R-squared | 0.71 | 0.00 | 0.71 | 0.71 | 0.72 |
Note: Outcome variable is percentage point change in health-related benefit claims as share of population. To give an example, the 0.20 coefficient on the pre-pandemic claimant rate suggests that for each 1 percentage point higher the pre-pandemic claimant rate is, we would expect the change in claimant rate over the pandemic to be 0.20 percentage points higher. Standard errors are heteroskedasticity robust. p-values are shown in parentheses. *** p<0.001; ** p<0.01; * p<0.05.
Source: Authors’ calculations using DWP Stat-Xplore and Annual Population Survey.
Table A4. Data sources for international comparisons
References
Black, D., Daniel, K. and Sanders, S., 2002. The impact of economic conditions on participation in disability programs: evidence from the coal boom and bust. American Economic Review, 92, 27–50, https://doi.org/10.1257/000282802760015595.
Charles, K. K, Li, Y. and Stephens, M., 2018. Disability benefit take-up and local labor market conditions. Review of Economics and Statistics, 100, 416–23, https://doi.org/10.1162/rest_a_00692.
Cribb, J., Karjalainen, H. and Waters, T., 2022. Living standards of working-age disability benefits recipients in the UK. Institute for Fiscal Studies, Working Paper 22/24, https://ifs.org.uk/publications/living-standards-working-age-disability-benefits-recipients-uk.
Deshpande, M. and Li, Y., 2019. Who is screened out? Application costs and the targeting of disability programs. American Economic Journal: Economic Policy, 11, 213–48, https://doi.org/10.1257/pol.20180076.
Office for Budget Responsibility, 2023. Fiscal risks and sustainability report: July 2023. https://obr.uk/frs/fiscal-risks-and-sustainability-july-2023/.
Office for National Statistics, 2022. Cost of living and depression in adults, Great Britain: 29 September to 23 October 2022. https://www.ons.gov.uk/peoplepopulationandcommunity/healthandsocialcare/mentalhealth/articles/costoflivinganddepressioninadultsgreatbritain/29septemberto23october2022.
Scottish Fiscal Commission, 2023. Scotland’s economic and fiscal forecasts: December 2023. https://fiscalcommission.scot/publications/scotlands-economic-and-fiscal-forecasts-december-2023/.
Scottish Government, 2022. Adult disability payment: policy position paper. https://www.gov.scot/publications/adult-disability-payment-policy-position-paper/pages/1/.
Data
Office for National Statistics. (2024). Annual Survey of Hours and Earnings, 1997-2023: Secure Access. [data collection]. 25th Edition. UK Data Service. SN: 6689, DOI: http://doi.org/10.5255/UKDA-SN-6689-24.
Office for National Statistics. (2024). Labour Force Survey. [data series]. 11th Release. UK Data Service. SN: 2000026, DOI: http://doi.org/10.5255/UKDA-Series-2000026.
Endnotes
Authors

Eduin Latimer
Eduin is a Senior Research Economist in the Income, Work and Welfare sector. His research focuses on benefits policy and the low-paid labour market.

Freddie Pflanz

Tom Waters
Tom is an Associate Director at the IFS and Head of the Income, Work and Welfare sector.
More from IFS
Understand this issue


Policy analysis


Academic research


