
Downloads
Download the report as a PDF
PDF | 835.22 KB
In this report, we consider policies to help people appropriately manage their defined contribution (DC) pension wealth through later life. We draw on evidence in a report published alongside this one (Boileau, Cribb and Emmerson, 2025), which sets out key information on the landscape in which current and future retirees are making pension withdrawal decisions. That report describes the generation-on-generation rises in DC pension wealth, the huge amount of variation in how people currently draw upon that wealth, with relatively few purchasing annuities, and the wide range of financial risks that are faced throughout retirement.
Managing wealth in retirement is difficult, and policy design in this area is not straightforward – particularly after the near-compulsory annuitisation of DC pensions was abolished in 2015. Whatever its merits, we have found little support for returning to a pre-2015 situation. But change is needed to help people navigate how to make good decisions over how to draw on DC pension wealth and to help people balance the benefits of flexibility while limiting some of the risks they face. This report therefore sets out a set of policy suggestions that for many should reduce the risk that they end up with low living standards later in retirement as a result of making poor decisions on how to draw upon their DC pension wealth.
Key context
- The challenges for people managing defined contribution (DC) pension wealth through retirement are stark. People face significant uncertainties that can materially affect their standard of living: over how long they (and their spouse) are going to live, the asset returns they will receive, the rate of inflation through retirement and the way in which their cognitive capacities, and broader health, will evolve. All these risks and uncertainties can culminate in people either facing very low levels of private resources later in life as they exhaust their pensions too soon or being unnecessarily austere throughout retirement given concerns about ‘running out’ later in life.
- The rise in defined contribution pension wealth relative to defined benefit pension wealth, combined with pension freedoms, means that more people approaching retirement will have to make complex and consequential financial decisions in the coming decades compared with the recent past. While most – although by no means all – people currently drawing DC pension wealth are making low-stakes decisions, the share of people facing important financial decisions on how to draw their DC pension is rising substantially. Automatic enrolment also means that pension wealth is increasingly accumulated passively, with very limited – if any – engagement with their pension by most employees during working life. The numbers making high-stakes and difficult decisions are rising.
- Policymakers face a wide range of difficulties in developing a coherent policy landscape to help most people make good pension withdrawal decisions. Many will reach retirement with multiple DC pots, meaning that individuals have several pension pots to manage and that pension providers often have very incomplete information about their members’ overall financial situations. There is marked disagreement about how interventionist government should be in mandating or defaulting people towards particular options, particularly options involving annuitisation. There is huge variation in people’s financial situations close to retirement, which makes it hard to design defaults that are appropriate for a large majority. Poor-quality data also limit the ability of analysts to understand people’s current financial decisions.
Policy conclusions: future retirement income products
- Most people are likely to need more protection against longevity risk than is currently provided by the state pension alone, as their living standards would see sharp falls if they were reliant only on this at much older ages. Some people have defined benefit (DB) pension wealth that provides this insurance. For those with significant DC wealth, annuitisation at a later age can provide longevity protection. The decision to annuitise is a difficult one to make as it is irreversible, and the path of least resistance since pension freedoms is not to purchase an annuity. People risk undervaluing the longevity protection offered by annuitisation, given that on average people underestimate their remaining lifespan in the early stages of retirement. Therefore, people should be steered towards annuitising at least some of their DC pension wealth at a later point in retirement.
- A ‘flex then fix’ model, in which people have the flexibility to draw down on their DC pension wealth earlier in retirement, but later in retirement annuitise at least some of it, is likely to be a good solution for many people. This model preserves flexibility in the early stages of retirement, when cognitive function is likely to be better and relative uncertainty over remaining lifespan lower. And it guarantees an income at older ages when cognitive ability may be declining, the appetite for active management of wealth lower and relative uncertainty about lifespan higher. The precise details of these kinds of products remain crucial. Important decisions will include: the right age for the ‘fix’ part of the product, at which point an annuity is bought; of what type; and how easy it should be to opt out; and for the ‘flex’ part, whether default drawdown rates should be set to try to help people avoid being overly austere (and again how easy it should be to choose to deviate from this default).
- The government has stated an intention to require trust-based pension schemes to offer default retirement income solutions. In this situation, policymakers will have to consider two key issues. (1) How might any options or default products available to members of trust-based DC pension arrangements be made available to those in contract-based pensions, and vice versa? (2) How should competition – and shopping around for the best deal – be encouraged, given that many may stick with the default retirement income products from their current pension providers?
- To the extent that trustees and/or policymakers introduce new defaults for accessing DC pensions, effort should be made to make these defaults ‘soft’ – that is, easy to opt out of. Given the substantial variation in people’s situations around retirement, some will be best served by deviating from the path of least resistance, and many will need help doing so.For example, those with certain health conditions might well be better off opting out of any default purchase of an annuity. It should be as straightforward as possible to make such choices. Ideally, a menu of alternative options could be provided – as is often the case for people wanting to invest their private pension assets in ways other than the default asset allocations. Boosting the take-up of advice or guidance, or some combination thereof, will also help people to deviate from the path of least resistance. A ‘middle way’ between guidance and advice is likely to be important for a wider set of people than regulated advice is reaching at present – and will be especially valuable if government takes a less interventionist approach as to how people can draw on their pension wealth, although will still be important if defaults are introduced.
Policy conclusions: parameters of the retirement income system
- People should typically ultimately end up with one, or a small number of, defined contribution pension pots, through automatic consolidation of pension pots, or a mixture of auto-consolidation and encouraging people to consolidate through simple and hassle-free processes. Individuals making decisions (or trustees of pension funds making decisions on people’s behalf) over how to draw upon their resources appropriately will be unnecessarily hindered if people’s DC pension wealth is spread across a large number of pension pots administered by different providers.
- The age at which people are able to start to access their DC pension pots should be gradually increased over time (keeping existing exceptions for those in ill health), as pension saving is ultimately designed to provide financial resources in retirement. This normal minimum pension age is already rising from 55 to 57 by 2028. Although any increase can cause difficulty for some pension providers, where commitments guarantee access at an earlier age, there is a strong case for the age of access to rise gradually so it reaches 60 by the time the state pension age reaches 68 in the mid 2040s. There is a case to go further still: by the mid 2040s, on average 60-year-old men are expected to live for a further 26 years and 60-year-old women for 29 years. This is a long period over which to expect to draw down a pension. Increasing the age of first access further, though, would be challenging, as a large number of people retire in their early 60s, and many public sector workers can still get at least part of their pension unreduced from 60. It would be wise to keep the normal minimum pension age under review – most naturally every time the state pension age is reviewed.
- The way in which tax benefits of private pensions are described should not accidentally encourage people to withdraw large amounts from their pensions early in retirement. Up to a high limit, 25% of withdrawals from pensions can be taken free of income tax and this can be done by individuals in various ways, including 25% of each withdrawal being tax-free. However, there is a widespread discussion of this benefit as being a ‘tax-free lump sum’, and people have a ‘lump sum allowance’. This risks inadvertently – and inappropriately – steering people towards taking 25% of their pension up front as a lump sum. Discussion around this form of tax relief should avoid the terminology ‘lump sum’, so as not to steer people away from making more gradual pension withdrawals which may be more appropriate for them.
- Better data are needed both for individuals to help make financial decisions and for stakeholders (including policymakers) to understand emerging challenges as people reach older age with more DC pension wealth accumulated across multiple pensions. Pensions dashboards will cover someone’s whole pension wealth, so should be helpful for individuals making financial decisions – particularly in a world where people have multiple pensions at retirement – although will not cover other parts of wealth, or a partner’s pension wealth. Good-quality household survey data which can cover a family’s whole portfolio are needed for analysts and policymakers seeking to understand emerging challenges. The government should invest in improvements to the Wealth and Assets Survey: this survey came into being following an early recommendation of the Pensions Commission in the mid 2000s, but the quality and timeliness of the data currently fall below the required standard.
1. Introduction
Do people need more help to manage their pension wealth through retirement? The rise of defined contribution (DC) pension wealth, coupled with the fact that this DC wealth can now be flexibly accessed, means that future generations of retirees will have more complex and significant decisions to make about how to manage their finances through retirement than those in the recent past. These shifts – from defined benefit (DB) to DC pension wealth, and from the near-compulsory annuitisation of DC wealth to much more flexible access – have been called a ‘Great Risk Transfer’ (Institute and Faculty of Actuaries, 2021). Many more people must themselves manage longevity and investment risk, taking responsibility for stewarding their wealth right through retirement, rather than being paid a guaranteed annual income until death from the pension savings they have made through working life.
This report suggests some improvements to the current retirement income system in the UK in light of these shifts, aiming to reduce the complexity of the decisions being made in retirement and to guide people towards appropriate use of their pension wealth.
We draw on a wide range of empirical evidence on the amount and type of pension wealth working-age people are building, how current retirees are using their DC wealth and the risks they face, gathered together in our accompanying report (Boileau, Cribb and Emmerson, 2025). That report highlights that each successive generation will approach retirement with more DC pension wealth. It shows that in the future even lifetime low earners are likely to accumulate substantial DC pension wealth: a lower earner (making £18,000, e.g. working 30 hours a week on the minimum wage) working every year between age 22 and state pension age might, under a set of reasonable assumptions about economy-wide earnings growth and asset returns, accumulate a pot of £150,000. At the moment, however, most – but by no means all – retirees are making comparatively low-stakes decisions over the withdrawal of their DC pension wealth, due to low amounts saved and/or significant DB pension wealth. There is also great heterogeneity in how people draw this wealth, with many withdrawing (often fairly small) pots in one go and others drawing on their pots only very slowly.
This is a reminder of the two key concerns in this area: first, that some might draw on wealth too fast and exhaust private resources; and second and opposite, that faced with a wider variety of risks (including longevity and investment risk), some might draw down so slowly on their wealth that they are needlessly austere.1 In a system where individuals consistently make financial decisions on how much to draw on their pension throughout retirement, people are also exposed to a greater extent to the significant risk of cognitive decline affecting their financial decision-making later in retirement.
Alongside this set of empirical evidence, we draw on qualitative work to understand better people’s financial behaviour in this area and their concerns. In particular, we have benefited from public engagement with recent retirees undertaken by Ignition House, commissioned by abrdn Financial Fairness Trust to run alongside the Pensions Review. We include in this report quotes from individuals interviewed in focus groups as part of this work. In addition, we have benefited from a set of advisory group meetings with key stakeholders in this area, including representatives from interested parties in the public sector, the pensions industry, trade unions, think tanks and other third sector bodies (listed in Appendix B). We also draw on a wide range of previous reports on these issues (in both the UK and in other countries that face similar issues) published by think tanks, pension providers and other financial institutions, academics, international organisations and others.2 A full list of these is provided in the References and they are cited and discussed throughout the report.
We identify five core challenges that policymakers face in developing a coherent policy landscape in this area.
First, the issue of how people are managing their pension wealth in retirement interacts with another pensions policy issue: the proliferation of DC pension pots. As noted by many, including the Pensions Review report on this topic (Cribb et al., 2025), it is much harder for individuals (or pension providers) to make appropriate decisions on how to draw down on their pension wealth if that wealth is scattered across a large range of pots and providers.
Second, stakeholders significantly disagree about the extent to which government intervention is appropriate regarding how people can draw on their DC pension wealth. This disagreement occurs not only between different types of institutions (with consumer groups being much more likely to favour more substantial intervention) but also within groups of similar stakeholders.
Third, there is substantial variation in the financial situation that people find themselves in around retirement, even amongst people who have had fairly similar earnings in working life.3 This can be due to differences in their history of pension provision (in particular, whether they had significant DB pension wealth), the financial situation of their partner, and their housing wealth. In this context, it is harder for policymakers, or pension providers, to design default retirement income solutions appropriate for the vast majority.
Fourth, there is the challenge that the appropriate set of policies for today’s situation is almost certainly inappropriate for the situation in (say) 20 years’ time, due to the rising importance of DC pension wealth relative to DB pension wealth. Drawing unwisely on DC pension wealth in 20 years’ time is much more likely to be consequential for an individual’s subsequent standard of living than it is for an individual doing so today. But it is challenging to design policy for today which can accommodate these large future changes.
Finally, poor data quality hampers policymakers’ understanding of both the current situation and future trends. Compared with other issues in pensions policy, challenges in drawing down pension wealth through retirement are viewed through a glass darkly. Pensions industry data generally only cover part of an individual’s pensions portfolio, with data collected at the level of the pension pot. Household survey data provide an important source of information but rely both on appropriate resourcing from government and on surveyors carefully designing questions to elicit meaningful responses from individuals. We discuss this issue in more detail in the conclusion.
Despite these difficulties, we think that improvements to the current system that faces individuals drawing on their pension wealth are both necessary and possible, as we set out in the following chapters. We take as given that there will be no reversal of pension freedoms back to the pre-2015 policy landscape. Irrespective of the merits of that decision, we judge that there is no realistic political appetite to return to near-compulsory annuitisation of DC pension wealth. Indeed, justifying a change back could become more difficult over time, as increasing numbers of individuals could correctly claim that they had placed funds into a DC pension under the expectation that they would not have to purchase an annuity. And many value at least some flexibility on how to draw upon their DC pension wealth. We therefore start from the point of how to make the post-2015 policy landscape work as well as possible.
The rest of this report proceeds as follows. In Chapter 2, we focus on key issues regarding the types of retirement income products that are available, or that are likely to be available in the future, in relation to the risks that people face. In particular, we discuss the merits of a ‘flex then fix’ approach, in which – by default – individuals have the flexibility of drawdown earlier in retirement, followed by the purchase of an annuity later in retirement, and we discuss how individuals may be steered towards good outcomes in a future world where pension providers may default individuals into particular retirement income solutions.
In Chapter 3, we describe some changes to what could be considered to be other ‘parameters’ of the retirement income system, including: the degree of consolidation of DC pension pots upon reaching retirement; the age at which DC pensions can typically first be accessed (the minimum normal pension age); and terminology regarding the income tax benefits of private pensions which may inadvertently have unhelpful impacts on how people draw on their pensions. Chapter 4 provides a brief conclusion. Across the report, we highlight eight key conclusions.
Finally, we should add a note on terminology: although pension experts frequently use the term ‘decumulation’ to describe spending down wealth in retirement, we have deliberately avoided it in this report. This is because it is unfamiliar to the general public.
2. Decisions over retirement income products
Since 2015, no one has been required to annuitise their DC pensions – and most people do not choose to do so. Small DC pots – by far the most numerous – are most often withdrawn in full; larger DC pots are generally used to purchase drawdown products (Boileau, Cribb and Emmerson, 2025). This pattern implies that those with DC wealth will largely be taking more complex decisions over pension wealth than before 2015, and are likely to continue having to make active decisions over their pension wealth through retirement. At the same time, we know that understanding of pensions is limited and that there is low take-up of guidance or regulated advice. This situation risks people making poor financial decisions.
This chapter examines the rising importance of individuals’ decisions about how to draw on their DC pension wealth and sets out four key conclusions as to how policy should respond.
We first examine the potential consequences of longevity risk for people’s standard of living in retirement, considering how incomes would change if private pension resources were exhausted. Second, therefore, we examine the potential role for annuitisation. Third, we discuss the potential development of hybrid ‘flex then fix’ solutions in which individuals initially use a drawdown product and later in retirement receive an annuity. We examine the important roles played by drawdown rates, investment risk and longevity risk in determining individuals’ incomes and their probability of exhausting private resources, and we discuss potential issues with the introduction of these hybrid products. Fourth, we discuss the impacts that defaults might have and considerations over their design. Finally, we examine the role that financial advice or personalised information or guidance might play in helping people to make appropriate decisions.
2.1 Consequences of longevity risk
Arguably, the key risk faced in managing income through retirement is the risk of running out of private resources before death. That is largely driven by the uncertainty surrounding remaining lifespan: people do not know how long they will live and so do not know how much time they must spread private resources over. As a result of this longevity risk, some (although by no means all) countries that rely on DC pensions, such as the Netherlands and Singapore, impose default annuitisation of these assets (Pensions Policy Institute, 2023a). The OECD set out as one of its key principles of DC pension plan design in 2022 that plans ‘should provide some level of lifetime income as a default for the pay-out phase’ in order to protect against longevity risk, saying that a key way of providing this was annuitisation (OECD, 2022).
Although in the UK DC pensions no longer need be annuitised, DC pensions are not currently the most important part of individuals’ overall wealth at retirement in general. Other parts of wealth, if annuitised, can provide some insurance against living longer than expected and so running out of private resources, making it less important that DC pensions also provide this insurance. The state pension is an important annuitised part of retirees’ wealth. Particularly after the reforms that came in from April 2010 and April 2016 (Cribb, Emmerson and Karjalainen, 2023), the state pension provides an effective foundation of income in retirement for the vast majority of those who have spent their whole working life in the UK. In addition to this, almost 80% of pensioners own their home outright (Cribb, Wernham and Xu, 2023) and so face minimal housing costs in retirement. Many pensioners – or their partners – currently have defined benefit pensions, too, which provide an annuitised stream of income, though these are becoming much less common for younger generations.
In this context, it is important to understand how effective the state pension – in particular – is at providing longevity insurance. We do this by quantifying the potential financial consequences of running out of private resources. Figure 2.1 illustrates how a family with the median disposable income at ages 66–74 would see their income drop if they exhausted their private resources and so their income was reduced to the level provided by just a full new state pension (and any means-tested benefits to which they would be entitled if their income was that low). The graph shows a set of scenarios – considering the drop in income that would be experienced by a single 66- to 74-year-old on a median (single’s) income, then a couple on a median (couple’s) income. Finally, it shows the fall in income if a couple aged 66–74 were to have their income reduced to just one full new state pension. This would be due to the death of one member of the couple, so this reflects the potential fall in income for the surviving member of a couple.
Figure 2.1. Percentage fall in income for family with median disposable income at ages 66–74 if their income were reduced to the level provided by a full new state pension, 2023–24
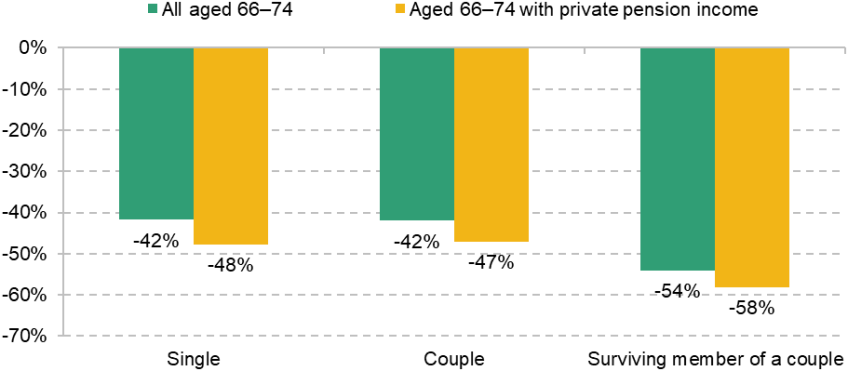
Note: ‘Single’ compares the income of single 66- to 74-year-olds and the level of income provided by one new state pension. ‘Couple’ compares the income of partnered 66- to 74-year-olds and the level provided by two new state pensions. ‘Surviving member of a couple’ compares the income of partnered 66- to 74-year-olds and the income provided by only one new state pension, but accounting (‘equivalising’) for the fact that the household has one less person. Income from new state pension includes income resulting from any means-tested benefits that individuals may be entitled to, taking into account housing benefit towards social or private rental costs. Results are essentially unchanged if we exclude families with employment income.
Source: Authors’ calculations using the Family Resources Survey (uprated to 2023–24) and the IFS microsimulation tax and benefit model, TAXBEN.
Figure 2.1 shows that income would fall almost 50% at the median for both singles and couples with some private pension income if they were to run out of private resources, and by almost 60% if widowed and running out of private resources. These numbers are slightly higher than for all 66- to 74-year-olds (as is to be expected, given that pensioners with private pension incomes have higher incomes). Of course, these are just changes in income at the median, and people with higher private pension incomes would naturally see larger falls in their income if they were only to rely on the state pension than would people with lower private pensions.
Another way of displaying the falls in incomes that would occur if retirees were to rely only on the state pension for income is shown in Figure 2.2. The graph shows the share of 66- to 74-year-olds (with private pension income) who would see their income more than halve if their income were reduced to the level provided by a full new state pension. This is around 40% of 66- to 74-year-old single people with some private pension income, 45% among couples and 65% for the surviving member of a couple.
Figure 2.2. Percentage of 66- to 74-year-olds who would see their disposable income more than halve if their income were reduced to the level provided by a full new state pension, 2023–24
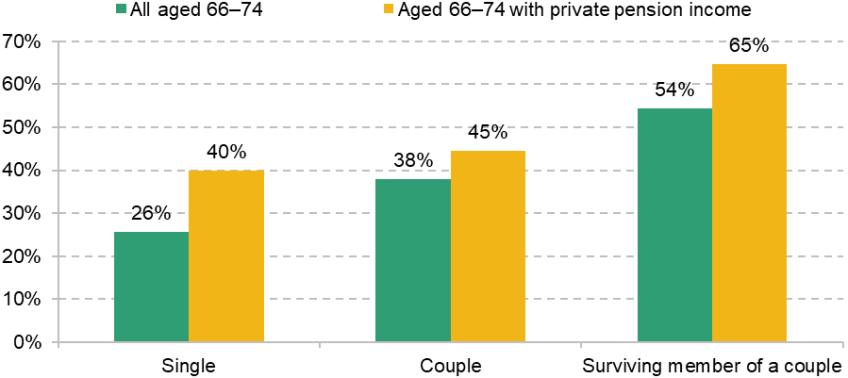
Note: As for Figure 2.1.
Source: Authors’ calculations using the Family Resources Survey (uprated to 2023–24) and the IFS microsimulation tax and benefit model, TAXBEN.
This sharp fall in living standards implies that most people are likely to need more protection against longevity risk than is provided by the state pension and owner-occupied housing. For many current pensioners, DB pensions play that role; but in the future, DB pensions will become much less important. The share of employees participating in a DB pension fell almost two-fifths, from 46% to 28%, between 1997 and 2021 (Boileau, Cribb and Emmerson, 2025). Consistent with this analysis, in focus groups run alongside this project, the risk of running out of private pension wealth and relying solely on the state pension was recognised as key.
My belief is the state pension is in place to give a basic living standard to those who have worked all their lives and paid in National Insurance payments to qualify for it. It does not meet the expectations of retired people who would struggle to live on the state pension alone as the only source of income for retirement.
Male, aged 70–74, homeowner
The state pension is there to support your running costs as you enter old age ... It is not intended to cover every aspect of your life. It meets my expectations although I wouldn’t be able to manage solely on that income. I never expected the state pension to cover everything I do in my life as I go through retirement.
Female, aged 65–69, homeowner
Key conclusion 1. Most people are likely to need more protection against longevity risk than provided by the state pension alone.
2.2 What role for annuitisation?
One way of managing longevity risk – the risk of living longer than expected and so exhausting financial resources – is converting (some) DC pension wealth into an annuity.4 Annuities provide a guaranteed regular income until death, ensuring that people’s income will continue until they die. They are also simpler when it comes to financial decision-making than a drawdown product, which must generally be more actively managed through retirement (whereas, having annuitised, the rule of thumb of ‘spend your income’ might not be a bad option). Annuitisation also mitigates the risk of experiencing cognitive decline at older ages.
Despite this, the number of annuity purchases has plummeted since pension freedoms were introduced in 2015, falling by around three-quarters between 2013 and 2024 (Boileau, Cribb and Emmerson, 2025). The unpopularity of annuitisation is not unique to the UK: it is common across a set of countries (James and Song (2001) chart similar trends internationally). Much academic literature has sought to explain the reasons why people seem so reluctant to annuitise (Brown (2007) provides a summary). The main reasons have to do with: features of the annuity market (adverse selection may mean that annuities are poor value for many); the desire to leave an inheritance; the desire to insure against ‘lumpy’ expenses – in particular, medical and long-term care expenses; the fact that substantial fractions of wealth – for example, from social security and housing – are already annuitised; and people underestimating their likely lifespan, making even fair-priced annuities seem to be poor value.
Policy research in the UK has also sought to explain low annuitisation rates. This work generally stresses low levels of financial literacy or trust in financial services, as well as people’s ‘present bias’, which leads them to overvalue the present relative to the future (Pensions Policy Institute, 2022). There is a tension between the popularity of the idea of a guaranteed lifetime income and the unpopularity of the risk of people dying soon after purchase. The focus groups run alongside this Review reflected this tension. Indeed, no respondent said that they would be ‘very comfortable’ with a fluctuating income in retirement, with most expressing discomfort at the idea.
I am not comfortable with having a fluctuating income at this stage in life. I prefer to know exactly how much income I am to receive each year so that I can cut my cloth accordingly.
Male, aged 65–69, homeowner
But the same group expressed discomfort at the idea of not having flexibility in the amount and timings of withdrawing their retirement savings.
[Flexibility is] very important due to sometimes needing it at a very important time and being left without a choice. Especially with the cost-of-living crisis.
Female, age 70–74, private renter
To some extent, there is a fundamental tension here between a desire for flexibility and distaste for fluctuation. In order to have full flexibility in drawing down retirement savings, wealth must not be annuitised. But not annuitising wealth will heighten the chance of experiencing a fluctuating income, since people will continue to be exposed to both investment risk and longevity risk. These risks could necessitate reductions to people’s incomes if they see lower-than-expected returns or live longer than expected.
Some of the tension in our respondents’ answers could be driven by the fact that they tended to have a DB pension alongside any DC savings, implying that they could have a regular and known income from their DB pension and treat their DC pension more like a savings pot. The extent to which this is true will change in future, as later retirees tend to have more DC wealth and are less likely to have DB wealth, meaning they will be more reliant on their DC wealth to provide a regular and known income. BlackRock (2024) highlights evidence from focus groups in which 85% of retired ‘Baby Boomers’ (born between 1946 and 1964) said a secure income made a ‘bigger difference than they thought it would in retirement’. A quote from the focus groups we ran illustrates this point:
Having both types of pensions, I tend to treat them differently. The final salary one gives me a guaranteed sum each month. Whereas I treat the other one as a savings account.
Male, 65–69, homeowner
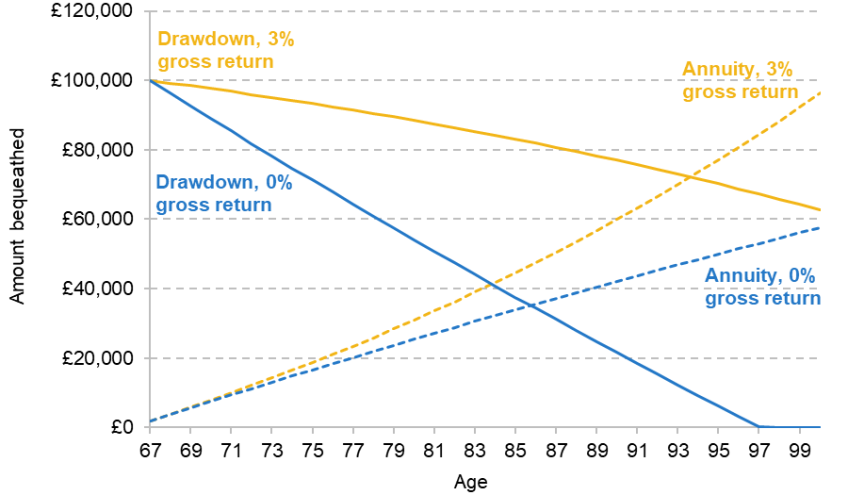
We can construct some indicative scenarios to show income through retirement under different approaches to pension wealth and how the stream of income provided by an annuity may compare with drawdown. We take as an example someone who first accesses their pension wealth at 67 (which from 2028 will be the state pension age), with an accumulated DC pot of £100,000. We start by assuming that the real rate of return they receive on their wealth while invested is 3%, from which we deduct 0.7 percentage points to account for fees and charges. Then we assume they draw down at 4% in the first year and keep that drawdown constant in real terms thereafter, while receiving these returns. We calculate that they would still have money left in their pot even if they reached age 100, as Figure 2.3 shows – although this will be at the ‘price’ of perhaps needlessly low income through retirement.
Figure 2.3. Real annual income from a £100,000 pension pot: (a) drawn down at 4%, 5% or 6% initially starting at age 67, then constant in real terms; and (b) used to purchase a single-life RPI-linked annuity at 67
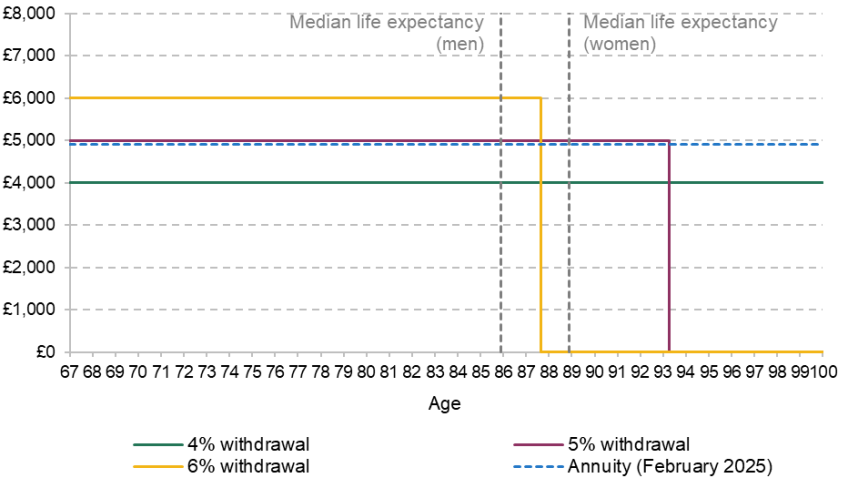
Note: Drawdown lines assume a 3% real rate of return, from which we subtract 0.7 percentage points to account for costs faced (in line with our approach elsewhere in the Pensions Review (O’Brien, Sturrock and Cribb, 2024; Boileau, Cribb and Emmerson, 2025). Median life expectancy is measured at 67, using 2022 cohort-based life tables. Annuity line assumes a single-life annuity rising with RPI is bought with £100,000 at 67 by someone in good health, generated using Hargreaves Lansdown’s annuity tool on 7 February 2025 and taking the second-best available annuity rate.
Source: Authors’ calculations using Financial Conduct Authority long-term return projections, ONS 2022-based life tables and Hargreaves Lansdown’s free annuity quote tool (https://annuitysupermarket.hl.co.uk/personalclient.aspx).
At a withdrawal rate of 5% initially, our representative individual might exhaust their pot by 93 – well above median life expectancy, but at about the 80th percentile for men or the 70th percentile for women. So, in other words, 20% of 67-year-old men and 30% of 67-year-old women would have exhausted their pot before they die – a minority, but a substantial number of people. Or at an initial withdrawal rate of 6%, a pot might be exhausted at 88 – around the 60th percentile for men or close to the median for women, i.e. 40% of men and half of women would have exhausted their pot before they die.
Figure 2.3 also illustrates annuity income each year if the pot is instead used to buy an annuity. Here we use the second-highest-value annuity quoted by Hargreaves Lansdown in February 2025 when requesting a single-life annuity escalating with RPI for a 67-year-old in good health living in London.5
These drawdown profiles are of course extremely stylised, and do not allow for people to adjust the amount they draw down in response to their pot shrinking faster than their remaining life expectancy, but they illustrate the point: that choosing to draw down can result in a higher income, but entails the risk of running out of money.
Something else they fail to illustrate is the risk involved in the rate of return, as discussed in our accompanying report (Boileau, Cribb and Emmerson, 2025). In Figure 2.3, we assume a 3% real rate of return before fees and charges, based on the intermediate nominal rate of return the Financial Conduct Authority (FCA) instructs firms offering investment products to use when projecting potential returns, 5%, adjusted for the assumption that long-run inflation is 2%. We could instead assume a 0% gross real rate of return (i.e. before fees are paid), in line with the lower nominal rate the FCA sets out, adjusted for inflation. This is, of course, a lower bound, but reflects one end of a reasonable range of outcomes. Under this real return, DC pots would be exhausted considerably sooner.6
Figure 2.4 shows the ages at which a £100,000 pot could be run down, if withdrawn at an initial rate of 4%, 5% or 6% and if annual income is then kept constant in real terms. The square points here mirror the ages at pot exhaustion shown in Figure 2.3: these are the points where a pot is run down under 3% gross real returns. The circles represent the scenario if the real rate of return is instead 0%. As shown, even with relatively conservative withdrawal rates (of 4% initially), with poor investment returns, the pot could be exhausted by around age 90, whereas an annuity would guarantee a higher annual income throughout retirement with no chance of it being exhausted, as was shown in Figure 2.3. This is illustrating the downside of investment risk – if returns instead turn out better than 3%, the age at which a pot could be exhausted will of course be higher.
Figure 2.4. Age at which a pension pot is exhausted, based on different withdrawal rates and rates of investment return, assuming drawdown starts at age 67

Note: Circles represent a real rate of return of 0% and squares a real rate of return of 3%. Fees and charges are represented by subtracting 0.7 percentage points from the real rate of return, consistent with the modelling of O’Brien, Sturrock and Cribb (2024). Median life expectancy is measured at 67, using 2022 cohort-based life tables.
Source: Authors’ calculations using Financial Conduct Authority long-term return projections and ONS 2022-based life tables.
The extent to which people want to leave an inheritance also has a bearing on the desirability of purchasing an annuity. Lockwood (2012 and 2018) argues that ‘bequest motives’ – where people value leaving an inheritance – can help to explain why annuities are so unpopular in the US. But it is not entirely straightforward to calculate whether a drawdown or annuity product is preferable if the desire is to leave an inheritance.
Consider an individual with a £100,000 DC pension pot at age 67, deciding between flexible drawdown (withdrawing varying amounts annually from their pension pot) or buying a single-life indexed annuity (providing fixed inflation-adjusted annual income for life). If they opt for flexible drawdown and die before their pension pot has been exhausted, they will be able to bequeath the remaining balance in their pension. In contrast, if they have bought an annuity, they will be able to bequeath any savings from unspent annuity income. The fact that annuity income need not necessarily be spent, but may be saved, is key, meaning that an annuity may be preferable over drawdown even if a drawdown pot is not exhausted.
For those dying at younger ages in retirement, there is less time for savings from unconsumed annuity payments to accumulate, meaning drawdown would be better for inheritance purposes. For those dying at older ages, though, unspent annuity income will build up and eventually begin to exceed what remains under drawdown, so buying an annuity will be preferable. The crossover point will depend on the rate of return: when this is higher, remaining in drawdown is preferable for longer. It will also depend on how much is being spent each period: when less is being saved from annuity income, remaining in drawdown is preferable for longer. But the point remains that conditional on how much you spend, if you die relatively early on in drawdown you leave a larger inheritance. And if you live surprisingly long, it is possible that an annuity would result in a bigger inheritance being left.
The effect of the rate of return on potential bequests is illustrated in Figure 2.5. Here we assume a starting pot of £100,000 and that £3,000 (in real terms) is spent each year, and show the potential bequest under the purchase of a £4,900 per year index-linked annuity compared with drawing down £3,000 each year from a £100,000 pot.7 We show bequests under 3% real gross returns and under 0% real gross returns. As described above, when returns are higher, drawdown would lead to a bigger bequest. Under 3% gross real returns, an annuity only results in a bigger bequest for those surviving to age 94 or beyond. Under 0% gross real returns, it leads to a bigger bequest for those surviving to age 86 or older.
Figure 2.5. Potential bequests by age, under an annuity purchase versus flexible drawdown, assuming £3,000 is spent each year
Note: Annuity value is £4,898 each year, in line with assumptions detailed in Figure 2.3.
Source: Authors’ calculations using Financial Conduct Authority long-term return projections and Hargreaves Lansdown’s free annuity quote tool (https://annuitysupermarket.hl.co.uk/personalclient.aspx).
Finally, if the pension pot is fully exhausted under flexible drawdown (assuming all withdrawn income is spent), as it is in Figure 2.5 under 0% gross returns after age 97, no inheritance would be left from the pension. An annuity, however, will continue paying annual income for life, with any unspent annual payments bequeathable – so an annuity would lead to a bigger bequest.
The question of whether flexible drawdown or annuitisation is preferable if the aim is to maximise an inheritance from pension assets, as well as sustain spending through retirement, therefore depends importantly both on longevity and on the rate of return received (as well, of course, on there being some unspent annuity income each period).
2.3 Development of ‘flex then fix’ products
Starting retirement by drawing down on pension wealth flexibly does not preclude someone from buying an annuity at a later point. A hybrid product in retirement, which features flexible drawdown at the start of retirement followed by the later purchase of an annuity – either deferred, so purchased at the start of retirement to kick in later, or later-life, so bought later on – has been suggested by many stakeholders (NEST, 2015; Boyle and Webb, 2022; Pensions and Lifetime Savings Association, 2022).
Boyle and Webb (2022) term this type of product ‘flex first, fix later’. They lay out four benefits of such a product: specifically that this form of product harnesses inertia in favour of buying an annuity; that key decisions are made at an age when cognitive decline is less likely to have set in; and at an age that people are more likely to have sought out guidance or advice; and that this approach is likely to increase value in the annuity market (especially if bulk annuities are purchased by pension schemes).
In addition to this, from the view of most individuals, buying an annuity at a later age may look like better value compared with at a younger point in retirement. Remaining life expectancy is generally underestimated at earlier points in retirement among both men and women, which will make even an actuarially fair annuity look like poor value (O’Dea and Sturrock, 2023). In contrast, at later points in retirement, expectations of remaining life expectancy look, on average, much closer to ‘objective’ measures of remaining life expectancy (estimated using ONS life tables).
The fact that cognitive decline increases at older ages also makes annuitisation midway through retirement more theoretically appealing. It is likely that active management of pension wealth – deciding on the amount to withdraw, perhaps adjusting this dependent on investment performance, and perhaps adjusting the mix of investments held – will be easier, and more possible, at earlier points in retirement; by people’s 80s, there might be less ability and desire to manage pensions actively in this way. In contrast, annuities – where a ‘consume your income’ rule of thumb does not have any associated longevity or investment risk – might be more appealing.
When testing the idea of a ‘flex then fix’-type product with the focus groups of recent retirees run alongside this project, opinions were generally positive:
The flexibility looks like a good idea. I would certainly give it a go. While an annuity gives security, being able to draw down funds when necessary and doing so knowing you still have security is great.
Female, aged 65–69, homeowner
A range of different ages at which annuitisation might best take place have been proposed: NEST (2015) suggests annuitisation at 85 while Boyle and Webb (2021) suggest that annuitisation might optimally take place in people’s late 70s. In Figure 2.6, we illustrate what annuity incomes in a ‘flex then fix’ product might look like if people were to annuitise at 75 or 80, after having withdrawn £5,000 a year in real terms from the age of 67. The outcome depends on what rate of investment return people have received between ages 67 and 75 or 80.8
Figure 2.6. Annual incomes upon annuitisation at 75 or 80 following 5% withdrawals from a £100,000 pension pot starting at age 67, depending on investment return
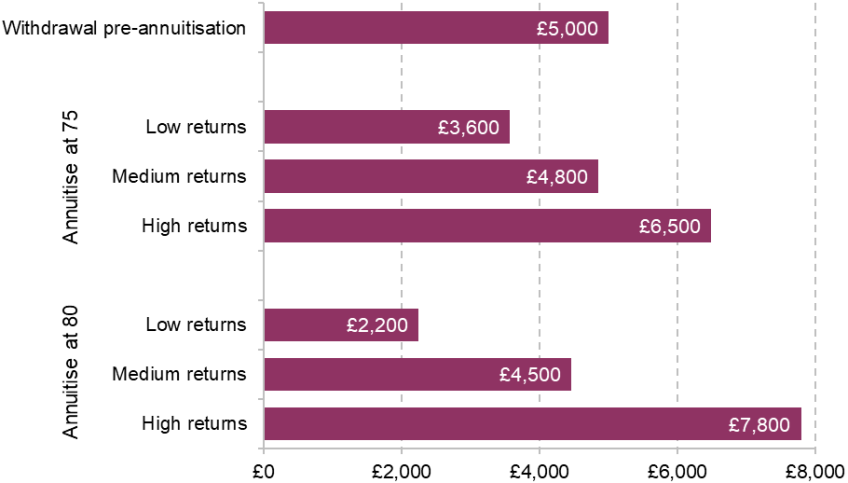
Note: Annuities at 75 or 80 calculated by using Hargreaves Lansdown’s free annuity quote tool on 5 March 2025 and taking the second-highest quote. Annuity rate at 75 is approximately 6.4%; annuity rate at 80 is approximately 7.7%. Annuity rates can rise and fall, though rising cohort life expectancies would suggest that, all else equal, annuity rates at 75 or 80 would be lower when current 67-year-olds reach those ages than they are now.
Source: Authors’ calculations using Financial Conduct Authority long-term return projections and Hargreaves Lansdown’s free annuity quote tool (https://annuitysupermarket.hl.co.uk/personalclient.aspx).
Under medium returns (3% real), an annuity bought at 75 can provide similar income to the previous annual withdrawal (along with the promise of lifetime payouts), at around £4,800; if bought at 80, it will be slightly lower, at £4,500. As shown, though, under high returns, income from an annuity bought at 75 will be £6,500, and will reach £7,800 if bought at 80; waiting for investments to compound can lead to much better outcomes. In contrast, when returns are low, the value of later-life annuities falls sharply. We are here using current annuity rates – if returns (particularly bond yields) are high, or low, for a prolonged period, annuity rates might be higher or lower respectively to reflect this. This would accentuate the spread between outcomes under high and low returns we note. The point here is that the longer people wait before purchasing an annuity, the more risk they are exposed to – outcomes can be both much better and much worse, with the spread increasing.
This is, of course, an illustrative exercise. Annuity rates used are current; as life expectancy continues to increase, annuity rates might fall at these older ages, meaning annual incomes upon annuitisation would be lower. Alternatively, if later-life annuities become more common, the market might become more competitive – with more demand for these annuities – and there might be less adverse selection in the later-life annuity market. This would mean annual incomes upon annuitisation would be higher. The point is the spread between outcomes, resulting from the exposure to investment risk before annuitisation.
In the King’s Speech following the election (Prime Minister’s Office, 2024), it was announced that the forthcoming Pension Schemes Bill would require trust-based pension providers to offer retirement products.9 This was reiterated in an October 2024 speech by the (then) Pensions Minister Emma Reynolds, noting that these retirement products would include a default retirement solution.10 In general, we think that the form of hybrid product described above may be the kind of approach that trust-based pension providers are likely to adopt for their customers. For many people, a product of this type will be an appropriate option, balancing the flexibility that allows people to vary spending earlier in retirement with insurance against the increasing importance of longevity risk through purchasing an annuity at a later point in retirement. And with the right to opt out, no one would be forced into either the initial ‘flex’ default withdrawal rate or the subsequent ‘fix’ where an annuity was purchased.
Key conclusion 2. A ‘flex then fix’ model, where people can flexibly draw down on their pension wealth early in retirement, before being defaulted into annuitisation later on, is likely to be a good default solution for many.
That being said, if this kind of product is the future of retirement income for many DC pensions, trustees will have to make a wide range of decisions about how to structure these products. This will be not only about the age at which to ‘fix’, but also about what drawdown rate to set as a default, and whether it should differ for people before and after state pension age, amongst other decisions. In addition, there remain – we think – two additional elements for policymakers to consider.
First, it is likely that trust-based and contract-based pension schemes may end up with different default outcomes. The King’s Speech suggests that the legislation will be brought forward that means trust-based schemes will offer a default retirement solution, while contract-based schemes do not seem to be included. Trust-based and contract-based schemes have had different requirements imposed before: for example, ‘investment pathways’ – whereby non-advised consumers are asked to choose one of four options for how they plan to access their money in the next five years, and this governs their pension investments – only apply to contract-based schemes.
There therefore remains an open question about how policymakers will ensure that those in trust- and contract-based schemes have similar defaults and similar options available to them. This is important because it is likely that few people actually understand the type of DC pension scheme that they are enrolled in. One potential option that could be considered is to facilitate the transfer of pension assets between different types of schemes at, or close to, retirement, but there may well be other solutions too. More work is needed on this.
Second, value for money will be an important consideration. We know that few people shop around for annuity providers. The reasons people report for sticking with an existing provider are rarely to do with the annuity rates (Financial Conduct Authority, 2023). Instead, people report staying with their provider due to trust in existing providers. Prior to 2015, Banks, Crawford and Tetlow (2015) found more numerate and financially literate people in particular were more likely to shop around for a better annuity rate. This raises some concerns about the competitive nature of introducing default retirement income solutions:11 the lack of shopping around could mean that people do not end up with providers with low fees in the drawdown stage. At the ‘fix’ stage, it is likely to be desirable to have an open market option in the purchase of an annuity, to help ensure competition amongst providers.
2.4 Designing defaults and a choice architecture
Defaults in the pension system – for example, over the rate at which DC pension wealth is drawn down, or whether an annuity is automatically bought at a certain age – can significantly affect outcomes. This is because individuals often stick with the options into which they have been defaulted. Much evidence exists on the persistence of defaults (Madrian and Shea, 2001; Thaler and Sunstein, 2008), including in the context of retirement savings and the drawdown of pension wealth (Choi et al., 2004; Beshears et al., 2009). Beshears et al. (2009) find that defaults are particularly powerful for low-earning employees in the context of automatic contribution rates. Concerningly, there is evidence that defaults in the context of pension decisions may be sufficiently powerful to result in mistakes being made (Choi, Laibson and Madrian, 2011).
The power of defaults in this setting seems likely to be particularly strong given that many of those reaching retirement with DC pots in the future will have acquired these passively through automatic enrolment, so are particularly unused to making active decisions about their pensions. As we charted in our evidence report, many of those with DC pensions do not know how they will access them, and have not encountered any information about pension or retirement planning in the recent past (Boileau, Cribb and Emmerson, 2025). Ignition House (2017) found that among most of those in a 171-person focus group who had accessed their pension via partial encashment, it ‘did not even cross their minds’ to shop around for a drawdown provider.
As discussed in Section 2.3, it is expected that the forthcoming Pension Schemes Bill will require trust-based pensions to provide default retirement income solutions. This will not necessarily be straightforward: providers do not always know many relevant characteristics of their customers – the other assets they own, whether they have a partner (and their partner’s assets), their level of risk aversion, their spending patterns and desires – all of which are very relevant for their desired pattern of spending through retirement. Heterogeneity among retirees means that a single default strategy is unlikely to be optimal for everyone.
Although for many we think that a ‘flex then fix’ model will be appropriate, buying an annuity may be much less appropriate for other people. Annuitisation at older ages will not make sense, for example, for those who have good reason not to expect to live long, unless they can get a sufficiently attractive enhanced annuity. Some people may want to purchase a joint-life annuity instead of a single-life annuity, especially if their spouse has relatively low pension wealth of their own. Annuitisation might also not make sense for those who spend portions of their working lives in the public sector and so can accumulate substantial DB pension wealth. In this case, more of their wealth will be annuitised (through the DB pension), and so running out of DC wealth will not lead to reliance just on the state pension (and any owner-occupied housing). And even as DB pensions have become rare in the private sector, they remain in the public sector, where a significant minority are employed (around one in five employees according to recent data from Understanding Society). Importantly, people also sometimes move between these sectors, thereby accumulating DB pensions in some years and DC pensions in others.
To illustrate this, in Figure A1 in Appendix A, we analyse a sample of employees over a nine-year period and find that 22% of employees work in both the public and private sector at some point. 14% have both some time in the private sector and at least three years in the public sector. All this means that a sizeable minority of people with DC pensions will approach retirement with significant (effectively annuitised) DB pension wealth resulting from work in the public sector, even in the long run as DB pensions disappear in the private sector.
For all these reasons, when default retirement income solutions are introduced, it will be important that it is straightforward for individuals to opt out and into another good option, particularly where irreversible and substantial elements – for example, the purchase of an annuity – are involved in the default. Most people are likely to stick with the default – that is to be expected and is likely to be a good option for many. But the choice architecture around deviating from the default will be important. Ideally, providers would facilitate comparing other alternative easy-to-understand options, all of which are broadly sensible options for people to take.
One model to follow could be the presentation of a menu of options, similar to those often presented to savers when choosing how their pension savings are to be invested during working life if individuals want to deviate from the default investment path. The ‘investment pathways’ options offered to those saving in contract-based pensions when approaching retirement are another example of a menu-like approach. These were introduced by the FCA in 2021; in 2024, around half of consumers chose to pick an option, a share roughly constant since their introduction. Choices were relatively evenly split between three of the four choices (with the option of buying an annuity far less popular) in 2024 (which has been the case since the introduction of investment pathways), as shown in Figure 2.7. While having no plans to touch money was the most commonly chosen option in 2024, none of the four options was selected by more than half of consumers. This indicates that there is some appetite to engage and make menu-like choices among those making decisions about their retirement wealth. It will be important for the government to monitor the success of investment pathways.
Figure 2.7. Choice of investment pathway among customers who chose to use investment pathways in 2024

Source: Authors’ calculations using Association of British Insurers – Investment Pathways – 2024Q4. Copyright of the ABI.
Key conclusion 3. If new defaults are introduced, these defaults should be designed so they are easy to opt out of.
2.5 The role of guidance or financial advice
Getting help with decisions about how to manage pension wealth in retirement involves getting free guidance – as provided by the government-funded Pension Wise – or paying for regulated financial advice.
Guidance is free to access, but cannot provide a personalised recommendation – instead, it sets out the options people have for how to access their pension. Sources of guidance include the Money and Pensions Service, or Pension Wise which was established by the government when ‘pension freedoms’ were implemented in 2015 to help people make decisions about how to access their pensions. Pension providers have been required to ‘nudge’ consumers towards using Pension Wise guidance when accessing their pension since 2022 (Financial Conduct Authority, 2022), although use at the point of access remains low (Boileau, Cribb and Emmerson, 2025). If anything, the share of pension pots accessed for the first time by those using guidance has fallen slightly in recent years, from 15% to 10%, as Figure 2.8 shows.
Figure 2.8. Share of pension pots when first accessed which have been accessed by someone using advice or guidance

Source: Authors’ calculations using Financial Conduct Authority retirement income market data, September 2024.
Regulated advice, on the other hand, can provide a personalised recommendation. However, it tends to be high-cost, which is identified as the primary barrier by around a third of people surveyed in 2023 who did not seek advice (Standard Life, 2023). According to Which? (2024), the up-front cost of getting advice about consolidating three pension pots totalling £500,000 and subsequently managing it would be significant, at almost £9,000, with a further cost of ongoing advice over five years of £19,000.
In the Schroders 2024 UK Financial Adviser Survey (Schroders, 2024), covering almost 300 advisers, 57% of advisers charged between 0.5% and 0.75% each year for ongoing advice (and a further 37% charged 0.75% to 1%, covering more than 90% of the surveyed advisers). The share charging below 0.5% each year was just 4%, having fallen from 44% in 2014. The use of advice also seems to be increasingly concentrated among a high-wealth group: 24% of advisers surveyed by Schroders had a minimum asset size for new clients of £200,000 or more in 2024 (up from 11% in 2019) and only 26% had a minimum asset size below £50,000 (down from 52% in 2019).
As shown in Figure 2.8, the majority of pension pots when first accessed are accessed by people who had used neither guidance nor advice. Of particular potential concern, as charted in our accompanying report (Boileau, Cribb and Emmerson, 2025), is the fact that in 2023–24, around three in ten DC pots worth £250,000 and above were accessed by people who had not used guidance or advice. As DC pots grow in absolute size and in relative importance in people’s pension wealth, it will become increasingly important that people have access to help – whether in the form of information, advice, guidance or something in between – in making decisions about accessing and using their money. Overton and Smith (2022) recommend the creation of a price-capped advice service. They also recommend enabling Pension Wise to work more closely with regulated advice firms so that referrals can be made from guidance services to advice, helping people to identify reliable sources of advice when they want more personalised information than possible using Pension Wise. Employers might also play some role in signposting employees nearing state pension age to guidance and financial advice, although evidence on whether and how this currently takes place is thin. The Pensions and Lifetime Savings Association (2021) has published a guide for employers as to how to deliver more guidance themselves without crossing the line into regulated financial advice.
The FCA is currently conducting an ‘advice–guidance’ boundary review. This is largely in response to the perceived gap between expensive, personalised advice, and relatively limited guidance which cannot provide a tailored recommendation. Pension providers are reluctant to provide personalised guidance at present, in order to avoid mistakenly providing advice, which is regulated and exposes them to liability risk (OECD, 2024) – another reason for an ‘in-between’ solution. The FCA’s proposed reforms at the time of writing (March 2025) involve the provision of ‘targeted support’, which would collect a limited amount of information from a consumer, and give them a suggestion based on what would be appropriate for consumers in similar circumstances with similar needs (Financial Conduct Authority, 2024; HM Treasury 2024). This would fall short of personalised financial advice and should therefore be cheaper to provide.
Targeted support, or a similar ‘middle way’ between advice and guidance, is not uncontroversial, although the idea of a middle way has been recommended by some stakeholders (e.g. Overton and Smith, 2022). The specific regulations that will apply to firms offering targeted support are under debate. The FCA writes that if introduced today, targeted support would be treated as advice (Financial Conduct Authority, 2024), but is working with the Treasury to consider how the regulatory framework might be amended. The consumer group Which? (2025) argues that proposed regulations would not ‘sufficiently guard against firms making suggestions not suited to the individual’s personal circumstances’ and that these regulations are important following a history of various mis-selling scandals in pensions.
It will be important to see how this evolves, particularly after the advice–guidance boundary review has concluded, as well as in light of developments such as artificial intelligence and other digital tools, which some have argued (House of Commons Work and Pensions Committee, 2022; Pensions and Lifetime Savings Association, 2024) will help with advice provision, and may lower costs significantly. There is some early evidence (Fieberg et al., 2025) that large language models (LLMs) might be able to generate suitable financial advice, although this is mixed as of yet (Smith, 2024). LLMs could certainly increase the efficiency with which advisers can work, potentially bringing down costs: reports suggest that some banks are already developing technology to help advisers.12 And one could imagine that it may not be long before specially trained LLMs would be able to do a good job, potentially supporting advisers, at a low cost.
Improving and promoting advice and guidance are not the only ways in which people can be helped with managing their pension wealth in retirement. Pensions dashboards will be helpful in terms of providing information for people on their pension wealth. These have not yet been finalised in the UK but, when complete, should provide a summary of pension wealth from all sources, including the state pension. This summary will likely be particularly helpful where DC pension pots have not been consolidated, so people may have several or even many small pots, but should also be helpful in simplifying the information available even if pots have been consolidated. The deadline for pension schemes to connect to the dashboards is October 2026, with public access to follow subsequently.13 This represents a substantial delay on the original plan, announced in 2016, that the pensions dashboard would be up and running in 2019 (HM Treasury, 2016).
Currently, the goal is for pensions dashboards just to provide information; in other countries, such as Australia, China, Latvia and Mexico, pensions dashboards also provide (limited) account management tools (OECD, 2024). In Sweden, the pension tracking tool allows users to see the impact of making different decisions over pension access – which has helped increase the share choosing a lifetime income (OECD, 2024). The way in which the UK’s pensions dashboards function, and the way in which information is displayed, might have important effects on people’s choices at retirement and on their ability to manage their pension wealth. Once the pensions dashboards have been delivered, policymakers could consider whether to pilot new functionality, similar to what Sweden offers.
The way in which defaults, and people’s options if they opt out of defaults, are designed will also be important, as described in the previous section – NEST (2015) argues that it is particularly important that defaults work for the majority of people, since a significant share of their membership would not be willing to pay for either regular or one-off financial advice. Where defaults are well designed, advice and guidance will be less necessary.
Key conclusion 4. Some people will need to deviate from the path of least resistance and will need help doing so.
3. Parameters of the retirement income system
In the previous chapter, we discussed issues regarding the types of products used in drawing a defined contribution (DC) pension. In particular, we examined the need for some longevity insurance through annuitisation (or other routes), and the potential for the development of hybrid retirement income products. We also discussed how those who would need to deviate from the path of least resistance could be helped to do so, whether through the way in which any defaults or steers were designed, or through the provision of information, guidance and advice.
In this chapter, we discuss three other key issues to do with the DC pension system in retirement. First, we examine the fact that a pension provider can only provide a product for the pot that they manage, and increasingly people have a large number of DC pension pots scattered over a number of providers. Second, we examine the age at which DC pensions can typically be accessed. Third, we discuss the withdrawal of lump sums from DC pension pots and the extent to which this is related to tax relief.
3.1 Addressing the proliferation of DC pension pots
One feature of the current workplace pension system is that each time an employee moves between employers (within the private sector), they generally start saving into a new pension pot. This sometimes even occurs if those employers use the same pension provider. This has created a huge number of pots with low amounts invested. Figure 3.1 shows that in 2023 there were 12 million pension pots with less than £1,000 saved and a further 8 million with between £1,000 and £10,000. The fixed costs of administering so many pots will drive up the costs faced by the pensions industry and, in turn, the fees that pension savers pay.
Figure 3.1. Number and value of deferred pension pots worth under £10,000, in 2023

Source: Cribb et al. (2025) based on data from Department for Work and Pensions (2023).
In the King’s Speech in July 2024 (Prime Minister’s Office, 2024), the government stated that the forthcoming Pension Scheme Bill will contain legislation that will both help consolidate small deferred pension pots and aim to consolidate the market more generally, reducing the number of providers. In a previous report of the Pensions Review(Cribb et al., 2025), we recommended the consolidation of small deferred pension pots and the consolidation of all pots within the same provider (‘same-scheme consolidation’).
Policy discussion to date has often focused on the issues this has created in terms of people losing track of their pots and the fact that very small pots are uneconomical to provide, driving up costs for providers. More relevant for this report is the fact that the proliferation of DC pension pots creates significant issues for people’s retirement incomes. If an individual’s DC pension wealth is scattered across a wide range of pots, it becomes harder for them to make sensible choices about how to withdraw their pension savings.
The fact people’s DC pension wealth may be spread across multiple pots also raises the question of how pension providers can provide defaults that depend in any way on pot size. For example, some work has suggested that hybrid solutions (as discussed in the previous chapter) would only be applied to medium and larger DC pots, and not to small pots, which might typically be withdrawn in full (e.g. NEST, 2015). In extremis, then, someone with five pots of just under £10,000 each could end up withdrawing them in full, rather than ending up with a hybrid solution for a pot worth (approximately) £50,000. An important feature of the future retirement income landscape, therefore, is that people end up with a small number of DC pension pots (or, ideally, just one).
Key conclusion 5. Most people should end up with few (or perhaps ideally one) defined contribution pension pots.
There are a number of ways that this could be done in practice, which we discuss in more length in Cribb et al. (2025). The first is the introduction of a ‘lifetime provider’ (or ‘pot for life’) model, under which each individual chooses a pension provider, and employers have to pay pension contributions into the individual’s nominated fund. This idea was floated by the previous Chancellor of the Exchequer, Jeremy Hunt, but does not look to be proceeding under the current government.
The second is automatic consolidation of pension pots (with which the government has said that it will proceed). This can be done in two broad ways. If the government uses a ‘pot follows member’ approach with a very high ‘limit’ (meaning that each time you move to a new employer, your previously saved contributions are transferred to your new pension pot), this would lead to only a small number of pension pots per person existing by the time individuals reach retirement. The alternative way of automatically consolidating pension pots (using a small set of ‘default consolidators’ to which small deferred pots are transferred) would make it much harder to dramatically reduce the number of pension pots that each individual has. That is because if you substantially increased the limit below which pots were automatically consolidated (to help reduce the number of pots), the only providers left in the market would be these consolidators, which would mean relatively little competition.
In the case that the government proceeds with neither a ‘pot for life’ nor a ‘pot follows member’ method of consolidating pots – or opts for these methods but only applies them to pots below a relatively low threshold – a different approach would be needed to ensure that individuals only have a small number of DC pots upon retirement. Ultimately, this is likely to require people consolidating their own pensions as they approach retirement. Challenges here include the facts that this may not be something people have done before, that people generally have low confidence in what they are doing with pensions and that complexity of decisions is known to be associated with people putting off those decisions. Therefore, steps would need to be taken to make this process as simple and hassle-free as possible, and to provide people with clear and highly trusted information to give them confidence that consolidating pension pots is likely to be a good way to help manage their pension in retirement.
3.2 Age at which DC pensions can typically be accessed
The age at which people can typically access their DC pension savings is known as the normal minimum pension age (NMPA). If people access their pension savings before this age, then they face a prohibitively high tax charge, unless they are retiring due to ill health (HM Revenue and Customs, 2021). The NMPA was first introduced in April 2006 and was increased from 50 to 55 in April 2010. Under current legislation, it will be increased from 55 to 57 in April 2028 (which is also when the state pension age will reach 67).
Important context for the setting of the NMPA is the ages at which people typically start to draw a private pension and at which they exit paid employment. The median age at which DC pension pots were first accessed in recent years, according to a DWP survey of around 2,700 people, was 60, and only 16% of people aged 55–59 with a DC pension had accessed at least one pension (Department for Work and Pensions, 2022).
Figure 3.2 provides more evidence on this issue, showing profiles of employment and of drawing a private pension between the ages of 50 and 75 from the Family Resources Survey. A limitation of these data is that they include DB pensions, alongside lump-sum withdrawals from DC pensions as well as annuity or drawdown income from DC pensions. Bearing this caveat in mind, the graph shows that 14% of people have private pension income by age 59, jumping to 24% at age 60 and rising to around 55% from age 67 onwards. This evidence is broadly consistent with DWP’s findings cited above.
Figure 3.2. Percentage of people aged 50–75 in employment, receiving a private pension, and both in employment and receiving a private pension, 2021–23
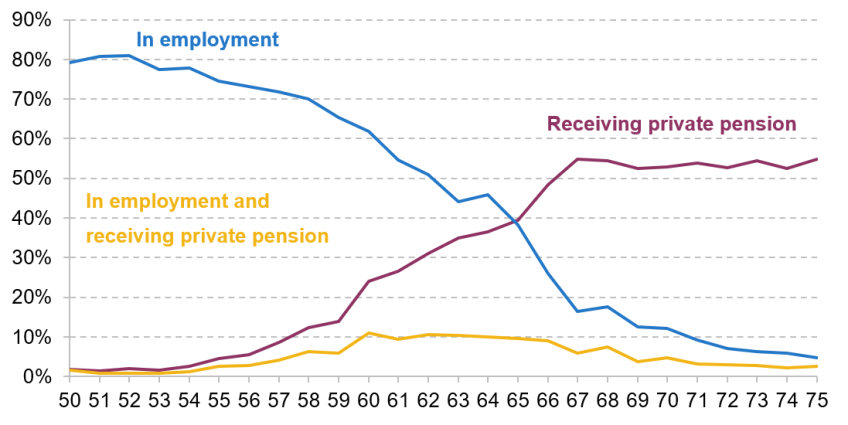
Source: Authors’ calculations using the Family Resources Survey, 2021–22 and 2022–23.
The profile of employment is different, with gradually falling employment between ages 55 (75% in paid work) and 59 (65%). The falls steepen after age 60, with employment reaching 38% by age 65 and 26% by state pension age (66). This means that any policy affecting people’s ability to draw pensions after 60 is likely to be particularly consequential, because of the number of people who retire at these ages, as well as because of the high fraction of those who draw a private pension in their early 60s who are not in paid work. In contrast, the yellow line in Figure 3.2 shows that, amongst those who draw a private pension in their late 50s, a substantial share (around 40%) are also in paid work.
In this context, what is the case for a further change in the NMPA? A key case for increasing the NMPA is that, even when it is increased to 57, that will still be 10 years below the state pension age. In 2028, current life tables suggest that 57-year-old women will live 30.5 more years on average, and 57-year-old men 27.3 more years. If people retire at 57, most will face a very long retirement over which they must spread their pension, making it harder to reach a reasonable income in retirement. If the minimum age of access does not continue to rise at least by a few years, there is a risk that it becomes increasingly detached from when most people retire, especially as the state pension age continues to rise. Ignition House (2017) highlighted this detachment beginning already, finding a ‘decoupling’ of decisions made about DC pots and retirement planning more generally, and that most respondents in their late 50s who had accessed their pension had done so without firm retirement plans.
This case is strengthened if DC pension savings are viewed as pensions, whose key aim is to provide financial resources in later life, rather than as savings products which could be used for a variety of financial goals. There are indications that the current government views DC pensions in this way. The King’s Speech (Prime Minister’s Office, 2024) stated that the forthcoming Pension Schemes Bill will require ‘pension schemes to offer retirement products so people have a pension and not just a savings pot when they stop work’ (emphasis added).
There are some difficulties associated with raising the age at which a DC pension can be accessed. As set out by Aviva (2024), schemes that, before the increase from 55 to 57 was announced, promised members they could access their pension at 55 will continue to allow those members saving in the scheme pre-announcement to access their pension at 55. Those members have what is called a ‘protected pension age’.14 These protected pension ages can cause difficulties for pension schemes, especially if they are considering accepting transfers in from schemes that have a protected pension age. In addition, because the increase from 55 to 57 kicks in on a particular date, 55- and 56-year-olds in early 2028 will need either to access their pension almost immediately or to wait until they turn 57. This is in contrast to the equivalent increases in Australia that have occurred in recent years, where the access age for DC pensions has risen from 55 to 60 by allocating specific dates of birth with different minimum access ages (known as the ‘preservation age’; see State Super (2025)).
The minimum normal pension age should be increased to 60 by the mid 2040s when state pension age reaches 68, so that DC pensions do not become divorced from what we consider should be their primary purpose: providing income in retirement. The increase should be done carefully, with people given significant notice of the change so as not to unreasonably interrupt plans to draw their pension in their late 50s.
Key conclusion 6. The normal minimum pension age should be increased to 60 by the mid 2040s.
There is debate about whether policy should go further and increase the NMPA beyond 60. Currently, life expectancy at 60 is 24 years for men and 27 for women, as shown in Figure 3.3. This is projected to rise to 26 years for men and 29 for women by the mid 2040s. At this point, the state pension age is currently legislated to reach 68. These are significant lengths of time over which to draw down on private pensions, with knock-on consequences for the potential adequacy of people’s pensions.
Figure 3.3. Life expectancy at 60, by year reaching 60, by sex

Note: Figures based on cohort life expectancy, which includes projections of future improvements in mortality.
Source: Authors’ calculations using ONS life tables (2022-based).
However, raising the NMPA beyond 60 would, as shown in Figure 3.2, likely interfere to a much greater extent with people’s plans for retirement or exit from the labour force.15 It would also raise issues of horizontal inequity between people who have saved in public sector and private sector pension schemes. In particular, it remains the case that many public sector workers can access parts of their public service pension unreduced at age 60. That will continue to be the case in the future for pension rights accrued prior to the reforms of 2015 (or, in some cases, before the reforms of the late 2000s; see House of Commons Library (2018)). On balance, we think that an NMPA of 60 is a reasonable medium-term target.
3.3 Terminology around tax benefits of private pensions
Currently, 25% of a DC pension can be withdrawn tax-free from normal minimum pension age onwards, up to a limit of £268,275.16 This ability to make tax-free withdrawals is only one of the forms of tax relief applied to private pension savings (Adam et al., 2023), but it is generally considered to be the most well-known and salient form of pensions tax relief (Ignition House, 2017 and 2021). This form of tax relief can be applied in a variety of ways. Individuals can withdraw 25% from a pension pot, paying no income tax, and subsequently pay income tax on the remaining withdrawals, whether they be done through drawdown, through withdrawing further lump sums or through purchasing an annuity. They can choose to withdraw the whole pot and only pay tax on 75% of the withdrawal. Or they can make a series of withdrawals from the pension pot, where 25% of each withdrawal is tax-free and 75% is subject to income tax, something catchily known as an ‘uncrystallised funds pension lump sum’ (UFPLS).17
There are rising concerns that many people are withdrawing the maximum tax-free amount from their pension pots, often without clear plans for the use of their money. For example, research by Overton and Smith (2022) found that the majority of people who took out a lump sum took out the maximum they could without paying tax (25%) and that the ‘default’ decision for most was to take 25%. Legal & General Investment Management (2021) found that nearly half of those withdrawing a lump sum would not have taken a lump sum if it had not been tax-free and nearly a third could have used savings instead of withdrawing from a pension. One quote from a woman aged 55–65 interviewed as part of research undertaken for Legal & General Investment Management (2018) is instructive and concerning: ‘Well, obviously I am taking the 25%, because that’s a no brainer. I’m not sure what I’m going to use that for yet.’ It is clear that for large numbers of people, a tax-free lump sum facilitates big-ticket purchases or is simply held in savings accounts (Financial Conduct Authority, 2023). More generally, withdrawing and consuming large quantities of pension savings at early stages of retirement can reduce future pension income, increasing the risk of financial hardship later.
In this context, we think that there are three concrete steps that could be taken to reduce the extent to which people see the withdrawing of 25% of their pension pot as a lump sum as sensible. First, we would encourage institutions, including the government, not to refer to these tax benefits of private pension savings as the ‘tax-free lump sum’, but instead to refer to the benefits of withdrawals being ‘25% tax-free’. Second, we suggest that the government rename the ‘lump sum allowance’,18 which is the maximum that individuals can withdraw tax-free. These two steps are fairly small, but we are concerned that current terminology and discussion of the tax benefits of private pensions risk inappropriately steering people towards taking 25% of their pension up front. We think, finally, that people might be more likely to withdraw the 25% early because they do not trust the government not to withdraw or limit the tax relief. There is a good case for limiting this relief (Adam et al., 2023), but if the government does not intend to do so, it should explicitly rule out this action. It would be worth further thought or examination of how not to encourage people from inappropriately making very large withdrawals from their pension pots early in retirement.
Key conclusion 7. Terminology around tax benefits of private pensions should not inadvertently encourage people to withdraw large amounts inappropriately.
4. Conclusion
This report has set out some suggestions for how the government should improve the policy landscape in which people make decisions on how to draw their DC pension wealth through retirement. As noted in the introduction, policymakers face a range of important challenges in this area: the proliferation of DC pension pots; marked disagreement amongst stakeholders about the appropriate extent of government intervention; significant variation in financial situation at retirement even amongst those on fairly similar earnings in working life; and the difficulties of managing the transition from DC pensions typically playing a limited role in retirement resources to DC pensions playing a substantial one, with even many lifetime low earners having very consequential decisions to make.
Underlying our conclusions is a recognition that it needs to be made easier for people to make good decisions about how to draw their DC pensions. These decisions are potentially difficult. But with automatic enrolment has come broad accumulation of DC pension wealth across the population; people should not need to be experts to use the funds sensibly to provide resources through retirement to supplement the state pension.
Many people need to be steered towards solutions that provide some insurance against living much longer than expected and that do not require them to make complex financial decisions at older ages. At the same time, these solutions should – both for pragmatic, political reasons and in light of some of the real benefits of flexible pension access – preserve some of the post-2015 flexibilities. A hybrid ‘flex then fix’ model is likely to be a good solution for many. Concerns remain about whether those in trust- and contract-based schemes will be treated similarly, as well as about the potential effects of retirement income defaults limiting competition. In addition, steers or defaults of this type will not be right for everyone. This means people should be given the opportunity to choose alternative appropriate options very easily, perhaps from a menu. And a well-functioning third way between expensive regulated advice and basic guidance needs to be found in order to help some people to deviate sensibly from the path of least resistance.
The design of (and access to) these retirement income products are not the only issues facing the system. Decisions made by individuals, or pension schemes on people’s behalf, will be better if individuals’ DC pension wealth is not spread across many pots. Whether by automatic consolidation, or via a hassle-free process that enables individuals to consolidate their own pots easily, it is important that people end up with a small number of DC pension pots (or even one) close to retirement. It would be wise for policymakers not to keep the normal minimum pension age fixed at 57, but look to increase it gradually to 60 by the time we get to the mid 2040s, in order that the age of private pension access increases broadly in lockstep with the state pension age and longevity at older ages. And discussion of the tax treatment of private pensions should not inadvertently risk guiding people inappropriately towards taking out 25% of their DC pension immediately as a lump sum when they first access their pension.
Finally, better data about people’s wealth accumulation and their decisions about how to draw on those portfolios are needed – both for those trying to make sensible decisions about how to draw down their pension wealth in retirement and for analysts and policymakers seeking to understand this area.
For those trying to make informed decisions about how to draw down their pension wealth, the upcoming introduction of pensions dashboards will bring together information on all the pensions people have. This should help individuals begin to make more informed decisions.
For analysts and policymakers, most industry data, although useful, are insufficient, only allowing things to be looked at at the pension pot level. This means that the full picture of people’s pension – let alone total – wealth is missed. Survey data, including large-scale household survey data, that cover a family’s decisions and whole portfolio are therefore needed. The most comprehensive data source on household wealth portfolios is the Wealth and Assets Survey (WAS), a biennial longitudinal household survey run by the Office for National Statistics (ONS), which was established following an early and welcome recommendation of the Pensions Commission. WAS can be an extremely useful resource to analysts in government, industry and elsewhere, and we have carefully drawn on it throughout the Pensions Review.
But its quality and timeliness currently fall below the standard that is required. Figure A2 in Appendix A shows that the questions it asks to determine pension participation do not capture the split in DB/DC pension participation found in employer-reported data (from the Annual Survey of Hours and Earnings). Adam et al. (2025) have identified a set of problems in the calculation of private pension wealth.19 And data are only made available with a long lag. Data that cover 2020–22 were released in February 2025, around three years after the collection of the last of those data. Given the importance of these data and challenges in this policy area, it would be wise for the government and the ONS to ensure that sufficient resource and expertise are dedicated to improving this data source considerably.
Investment in other data sources would also help build a picture of individuals’ and households’ pension provision and overall wealth in retirement. The Department for Work and Pensions should repeat its Planning and Preparing for Later Life survey, a survey run in 2020–21 which provided useful data on how pension freedoms were affecting people’s decisions. More generally, this leads us to our final key conclusion: better data are needed for both individuals and stakeholders. These will be crucial given that the importance of getting policy in this area right will grow over coming decades.
Key conclusion 8. Better data are needed for both individuals and stakeholders.
Appendix A. Additional figures
Figure A1. Percentage of employees who work in the private sector, public sector or both over a nine-year period
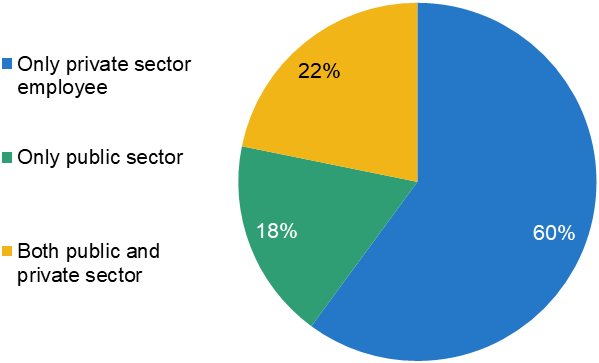
Source: Authors’ calculations using Understanding Society.
Figure A2. Private pension participation rate (%) split between defined benefit and defined contribution, in the Annual Survey of Hours and Earnings (ASHE) and the Wealth and Assets Survey (WAS), 2019

Note: Working-age employees only (ages 22–59 for ASHE and 25–59 for WAS).
Source: Authors’ calculations using the Annual Survey of Hours and Earnings and the Wealth and Assets Survey.
Appendix B. List of advisory group organisations
Age UK
Association of British Insurers
Behavioural Insights Team
Department for Work and Pensions
Financial Conduct Authority
Generation Rent
HM Treasury
Institute and Faculty of Actuaries
Institute for Government
Lane Clark and Peacock
Pensions and Lifetime Savings Association
Pensions Policy Institute
Trades Union Congress
Which?
References
Adam, S., Delestre, I., Emmerson, C. and Sturrock, D., 2023. A blueprint for a better tax treatment of pensions. IFS Report, https://ifs.org.uk/publications/blueprint-better-tax-treatment-pensions.
Adam, S., Delestre, I., Emmerson, C. and Sturrock, D., 2025. £2 trillion poorer than previously thought? Assessing changes to household wealth statistics. IFS Report, https://ifs.org.uk/publications/ps2-trillion-poorer-previously-thought-assessing-changes-household-wealth-statistics.
Aviva, 2024. Changes to the normal minimum pension age. https://www.aviva.co.uk/retirement/pension-basics/changes-to-pension-age/#:~:text=From%206%20April%202028%2C%20the,have%20a%20protected%20pension%20age.
Banks, J. and Crawford, R., 2022. Managing retirement incomes. Annual Review of Economics, 14, 181–204, https://doi.org/10.1146/annurev-economics-051420-014808.
Banks, J., Crawford, R. and Tetlow, G., 2015. Annuity choices and income drawdown: evidence from the decumulation phase of defined contribution pensions in England. Journal of Pension Economics and Finance, 14, 412–38, https://doi.org/10.1017/S1474747215000256.
Beshears, J., Choi, J., Laibson, D. and Madrian, B., 2009. The importance of default options for retirement saving outcomes: evidence from the United States. In J. R. Brown, J. B. Liebman and D. A. Wise (eds), Social Security Policy in a Changing Environment, University of Chicago Press.
BlackRock, 2024. Retirement. It’s personal. Read on Retirement 2024, https://www.blackrock.com/us/individual/literature/presentation/read-on-retirement-insight-report.pdf.
Boileau, B., Cribb, J. and Emmerson, C., 2025. Individuals’ challenges managing pensions through retirement. Pensions Review, IFS Report, https://ifs.org.uk/publications/individuals-challenges-managing-pensions-through-retirement.
Boyle, P. and Webb, S., 2021. Is there a right time to buy an annuity? LCP on point, https://www.lcp.com/media/1150053/is-there-a-right-time-to-buy-an-annuity.pdf.
Boyle, P. and Webb, S., 2022. ‘The flex first, fix later’ pension – is this the future of retirement? Lane Clark and Peacock, https://www.lcp.com/en/media-centre/press-releases/the-flex-first-fix-later-pension-is-this-the-future-of-retirement.
Brown, J., 2007. Rational and behavioral perspectives on the role of annuities in retirement planning. National Bureau of Economic Research, Working Paper 13537, https://www.nber.org/papers/w13537.
Choi, J., Laibson, D. and Madrian, B., 2011. $100 bills on the sidewalk: suboptimal investment in 401(k) plans. Review of Economics and Statistics, 93, 748–63, https://doi.org/10.1162/REST_a_00100.
Choi, J., Laibson, D., Madrian, B. and Metrick, A., 2004. For better or for worse: default effects and 401(k) savings behaviour. In D. A. Wise (ed.), Perspectives on the Economics of Aging, University of Chicago Press.
Cribb, J., Emmerson, C. and Karjalainen, H., 2023. The future of the state pension. IFS Report, https://ifs.org.uk/publications/future-state-pension.
Cribb, J., Emmerson, C., O’Brien, L. and Sturrock, D., 2025. Small pension pots: problems and potential policy responses. Pensions Review, IFS Report, https://ifs.org.uk/publications/small-pension-pots-problems-and-potential-policy-responses.
Cribb, J., Wernham, T. and Xu, X., 2023. Housing costs and income inequality in the UK. IFS Deaton Review of Inequalities, IFS Report, https://ifs.org.uk/publications/housing-costs-and-income-inequality-uk.
Department for Work and Pensions, 2022. Planning and Preparing for Later Life survey. https://www.gov.uk/government/publications/planning-and-preparing-for-later-life/planning-and-preparing-for-later-life#peoples-response-to-pension-freedoms.
Department for Work and Pensions, 2023. Consultation outcome: ending the proliferation of deferred small pots. https://www.gov.uk/government/consultations/ending-the-proliferation-of-deferred-small-pension-pots/ending-the-proliferation-of-deferred-small-pots.
Fieberg, C., Hornuf, L., Meiler, M. and Streich, D., 2025. Using large language models for financial advice. CESifo Working Paper 11666, https://www.cesifo.org/en/publications/2025/working-paper/using-large-language-models-financial-advice.
Financial Conduct Authority, 2022. The stronger nudge to pensions guidance: feedback on CP21/11 and final rules and guidance. https://www.fca.org.uk/publication/policy/ps21-21.pdf.
Financial Conduct Authority, 2023. Financial Lives 2022 survey. https://www.fca.org.uk/publication/financial-lives/fls-2022-pensions.pdf.
Financial Conduct Authority, 2024. Advice Guidance Boundary Review – proposed targeted support reforms for pensions. https://www.fca.org.uk/publications/consultation-papers/cp24-27-advice-guidance-boundary-review-targeted-support-reforms-pensions.
French, E., Jones, J. B. and McGee, R., 2023. Why do retired households draw down their wealth so slowly? Journal of Economic Perspectives, 37(4), 91–114, https://doi.org/10.1257/jep.37.4.91.
Hanegbi, R., 2017. Should the superannuation access age be raised? Australian Tax Forum, 32, https://papers.ssrn.com/sol3/papers.cfm?abstract_id=3054400.
HM Revenue and Customs, 2021. Increasing normal minimum pension age. https://www.gov.uk/government/publications/increasing-normal-minimum-pension-age/increasing-normal-minimum-pension-age.
HM Treasury, 2016. Budget 2016. https://assets.publishing.service.gov.uk/media/5a80231c40f0b62305b8966d/HMT_Budget_2016_Web_Accessible.pdf.
HM Treasury, 2024. Advice Guidance Boundary Review: proposed targeted support reforms for pensions. https://www.gov.uk/government/news/advice-guidance-boundary-review-proposed-targeted-support-reforms-for-pensions.
House of Commons Library, 2018. Public service pension age – the Labour Government’s reforms. https://researchbriefings.files.parliament.uk/documents/SN02209/SN02209.pdf.
House of Commons Work and Pensions Committee, 2022. Protecting pension savers – five years on from the pension freedoms: accessing pension savings. Fifth Report of Session 2021–22, https://committees.parliament.uk/publications/8514/documents/86189/default/.
Ignition House, 2017. Qualitative consumer research for assessing the non-advised journey. Prepared for the Financial Conduct Authority, Retirement Outcomes Review Interim Report, https://www.fca.org.uk/publication/market-studies/retirement-outcomes-review-interim-report-annex3.pdf.
Ignition House, 2021. New choices, big decisions – 5 years on: the evolution of consumer decision making and behaviours under pension freedom and choice. https://thepeoplespension.co.uk/wp-content/uploads/New-choices-big-decisions-5-years-on.pdf.
Institute and Faculty of Actuaries, 2021. The great risk transfer: campaign recommendations. https://actuaries.org.uk/media/31hbykda/campaign-recommendations-april-2021.pdf.
James, E. and Song, X., 2001. Annuities markets around the world: money’s worth and risk intermediation. Center for Research on Pensions and Welfare Policies (CeRP), Working Paper 16/01, https://www.cerp.carloalberto.org/wp-content/uploads/2008/12/wp_16.pdf.
Legal & General Investment Management, 2018. Four pots for your retirement: creating personalised solutions. https://prod-epi.lgim.com/landg-assets/lgim/_old-document-library/solutions/four-pots-for-your-retirement.pdf.
Legal & General Investment Management, 2021. Like it or lump it: retiree attitudes to tax-free cash. https://prod-epi.lgim.com/landg-assets/lgim/_document-library/capabilities/defined-contribution/like-it-or-lump-it---tax-free-cash-brochure-2021-final.pdf.
Lockwood, L., 2012. Bequest motives and the annuity puzzle. Review of Economic Dynamics, 15, 226–43, https://doi.org/10.1016/j.red.2011.03.001.
Lockwood, L., 2018. Incidental bequests and the choice to self-insure late-life risks. American Economic Review, 108, 2513–50, https://doi.org/10.1257/aer.20141651.
Madrian, B. C. and Shea, D. F., 2001. The power of suggestion: inertia in 401(k) participation and savings behavior. Quarterly Journal of Economics, 116, 1149–87, http://www.jstor.org/stable/2696456.
NEST, 2015. The future of retirement: a retirement income blueprint for NEST’s members. National Employment Savings Trust, https://www.nestpensions.org.uk/schemeweb/dam/nestlibrary/the-future-of-retirement-blueprint.pdf.
O’Brien, L., Sturrock, D. and Cribb, J., 2024. Adequacy of future retirement incomes: new evidence for private sector employees. Pensions Review, IFS Report, https://ifs.org.uk/publications/adequacy-future-retirement-incomes-new-evidence-private-sector-employees.
O’Dea, C. and Sturrock, D., 2023. Survival pessimism and the demand for annuities. Review of Economics and Statistics, 105, 442–57, https://doi.org/10.1162/rest_a_01048.
OECD, 2022. Improving the design of retirement saving pension plans. https://web-archive.oecd.org/temp/2022-03-06/57613-designingfundedpensionplans.htm.
OECD, 2024. OECD Pensions Outlook 2024: improving asset-backed pensions for better retirement outcomes and more resilient pension systems. https://www.oecd.org/en/publications/oecd-pensions-outlook-2024_51510909-en.html.
Overton, L. and Smith, C., 2022. Pension decision-making in the new retirement landscape: understanding and improving outcomes for consumers. https://www.financialfairness.org.uk/docs?editionId=f15049b7-6f8a-451e-8db4-c770f4f862fb.
Pensions and Lifetime Savings Association, 2021. An employer’s guide to talking about workplace pensions. https://www.plsa.co.uk/Portals/0/Documents/Policy-Documents/2021/An-employers-guide-to-talking-about-workplace-pensions.pdf.
Pensions and Lifetime Savings Association, 2022. Retirement choices: the evolution of products and support. https://www.plsa.co.uk/portals/0/Documents/Policy-Documents/2022/Retirement-choices-the-evolution-of-products-and-support-June-2022.pdf.
Pensions and Lifetime Savings Association, 2024. DC scheme guidance on retirement arrangements and partnerships. https://www.plsa.co.uk/Portals/0/Documents/Policy-Documents/2024/DC-scheme-guidance-on-retirement-arrangements-and-partnerships-Sep-2024.pdf.
Pensions Policy Institute, 2022. Set for life? Guaranteed incomes in retirement. PPI Briefing Note 130, https://www.pensionspolicyinstitute.org.uk/media/z11l0zl0/202205-bn130-set-for-life-a-guaranteed-income.pdf.
Pensions Policy Institute, 2023a. What can the UK learn about other countries’ approaches to accessing DC savings? https://www.pensionspolicyinstitute.org.uk/media/z23hcl5o/20231101-international-dc-decumulation-report.pdf.
Pensions Policy Institute, 2023b. The role of collective defined contribution in decumulation. https://www.pensionspolicyinstitute.org.uk/media/tysokiid/20231205-the-role-of-cdc-in-decumulation-final.pdf.
Prime Minister’s Office, 2024. The King’s Speech 2024. https://assets.publishing.service.gov.uk/media/6697f5c10808eaf43b50d18e/The_King_s_Speech_2024_background_briefing_notes.pdf.
Schroders, 2024. Schroders 2024 UK Financial Adviser Survey: adviser report. https://mybrand.schroders.com/m/3526c2ec6b42ea3e/original/614045_SC_IDD_Adviser-survey-2024_v01_PRINT_V01-V2.pdf.
Smith, G., 2024. LLMs can’t be trusted for financial advice. Journal of Financial Planning, 37(5). https://www.financialplanningassociation.org/learning/publications/journal/MAY24-llms-cant-be-trusted-financial-advice-OPEN.
Standard Life, 2023. Retirement Voice 2023. https://library.standardlife.co.uk/RetirementVoice2023.pdf.
State Super, 2025. Preservation rules. https://www.statesuper.nsw.gov.au/pss/benefits/preservation-rules.
Thaler, R. H. and Sunstein, C. R., 2008. Nudge: Improving Decisions about Health, Wealth, and Happiness. Yale University Press.
The Pensions Regulator, 2023. DC trust: scheme return data 2022 to 2023. https://www.thepensionsregulator.gov.uk/en/document-library/research-and-analysis/dc-trust-scheme-return-data-2022-2023.
Which? 2024. How much financial advice costs. https://www.which.co.uk/money/investing/financial-advice/how-much-financial-advice-costs-aODa70J6nYs7.
Which? 2025. Consultation Response: Which? response to the Financial Conduct Authority’s consultation on Advice Guidance Boundary Review – proposed targeted support reforms for Pensions. https://media.product.which.co.uk/prod/files/file/gm-2df11f70-e884-4db6-91a0-a4ba09a98f45-fca-advice-guidance-boundary-review-proposed-targeted-support-reforms-for-pensions-february-2025-.pdf.
Data
Department for Work and Pensions, NatCen Social Research. (2021). Family Resources Survey. [data series]. 4th Release. UK Data Service. SN: 200017, DOI: http://doi.org/10.5255/UKDA-Series-200017.
Office for National Statistics. (2019). Wealth and Assets Survey. [data series]. 2nd Release. UK Data Service. SN: 2000056, DOI: http://doi.org/10.5255/UKDA-Series-2000056.
Office for National Statistics. (2025). Annual Survey of Hours and Earnings, 1997-2024: Secure Access. [data collection]. 26th Edition. UK Data Service. SN: 6689, DOI: http://doi.org/10.5255/UKDA-SN-6689-25.
University of Essex, Institute for Social and Economic Research (2024). Understanding Society: Waves 1–14, 2009–2023 and Harmonised BHPS: Waves 1–18, 1991–2009. [data collection]. 19th Edition. UK Data Service. SN: 6614, http://doi.org/10.5255/UKDA-SN-6614-20.
Acknowledgements
The abrdn Financial Fairness Trust has supported this project (grant reference 202206-GR000068) as part of its mission to contribute towards strategic change which improves financial well-being in the UK. Its focus is on tackling financial problems and improving living standards for people on low-to-middle incomes. It is an independent charitable foundation registered in Scotland. Co-funding from the ESRC-funded Centre for the Microeconomic Analysis of Public Policy at IFS (grant number ES/T014334/1) is also gratefully acknowledged.
We are grateful for comments and advice from our Steering Group members, David Gauke (Chair), Jeannie Drake, David Norgrove and Joanne Segars, from Karen Barker and Mubin Haq at the abrdn Financial Fairness Trust, and from members of our advisory groups (see list of member organisations in Appendix B). We would also like to thank Janette Weir from Ignition House for the public engagement work undertaken alongside this work, which has helped us better understand people’s understanding and views relating to the issues examined in this report. We also benefited from the thoughts of many colleagues including James Banks, Paul Johnson and Heidi Karjalainen.
Data from the Family Resources Survey were accessed through an agreement with the Department for Work and Pensions. Data from the Annual Survey of Hours and Earnings (ASHE) were accessed via the Office for National Statistics (ONS)’s Secure Research Service. Understanding Society is an initiative funded by the Economic and Social Research Council (ESRC) and various government departments, with scientific leadership by the Institute for Social and Economic Research, University of Essex, and survey delivery by NatCen and Verian (formerly Kantar Public). The research data are distributed by the UK Data Service. Data from the Wealth and Assets Survey (WAS) are Crown Copyright and are reproduced with the permission of the Controller of HMSO and the King’s Printer for Scotland. WAS is produced by the ONS. The use of the ONS statistical data in this work does not imply the endorsement of the ONS in relation to the interpretation or analysis of the statistical data. This work uses research data sets which may not reproduce National Statistics aggregates.
Endnotes
Authors

Bee Boileau
Bee joined the IFS in 2021 as a Research Economist and works in the Retirement, Saving and Ageing sector.

Jonathan Cribb
Jonathan joined IFS in 2011. His research areas includes: pensions, ageing and demographic change, public sector pay, housing, and inequalities.

More from IFS
Understand this issue


Policy analysis


Academic research


