
Downloads
Download the report as a PDF
PDF | 406.89 KB
Executive summary
The total wealth of Britain’s households in 2018 to 2020 was approximately £2.2 trillion less than was previously believed – a 14% reduction. That, at least, is the implication of a recent change in methodology made by the Office for National Statistics (ONS) to the UK’s leading official measure of household wealth. The revision makes three changes to previous methodology for valuing households’ pension wealth. Two are clear improvements. But the third change – by far the biggest, by itself subtracting a staggering £2.3 trillion from recorded wealth – is a mistake, stemming from faulty economic reasoning. It is quite possible that the ONS’s revised estimates of household wealth are actually further from the truth than the estimates it started with (themselves undoubtedly flawed). The result is that policymakers lack a reliable set of household wealth statistics on which to base policy.
Key points
- The ONS has published a major revision to Britain’s leading official survey of household wealth. The three changes in methodology – which relate to the valuation of private pensions – together reduce estimated total household wealth in 2018 to 2020 (the only period for which the ONS presents the results under both old and new methodologies) by £2.2 trillion – 14% of the previous total.
- Two welcome changes have been made to the survey’s methodology. One corrects a serious error in how inflation is accounted for when valuing pensions – an error that has been impacting official wealth estimates for a decade, though the ONS still does not acknowledge explicitly that it was an error. Correcting it increases estimates of total household wealth by around £500 billion. The second welcome change improves estimates of the age at which individuals can start to draw their full pension – subtracting around £300 billion from previous estimates of total household wealth. Unfortunately, the ONS has not gone back and made these two adjustments to estimates for earlier periods.
- The biggest change made by the ONS relates to how the value of future pension income is converted into today’s terms, and subtracts £2.3 trillion from estimates of total household wealth in 2018 to 2020. This change is a mistake, making an already flawed methodology substantially worse.
- The key error stems from the ONS’s choice to move away from the use of market interest rates to convert future pension income into today’s terms and towards greater use of a measure of forecast GDP growth. That is faulty economics. The result is that pensions are valued in a way that is fundamentally flawed and inconsistent with all other assets.
- These revisions have serious implications for official estimates of the distribution of wealth – particularly across age groups. The ONS’s estimate of the total wealth in 2018 to 2020 of those aged 65–74 has been revised downwards by 38% while that for those aged 25–34 has been revised upwards by 11%. While the increase in the measured wealth of the younger group largely results from correcting an error, the very big reduction in the measured wealth of the older generation results from the misguided approach to valuing future income.
- The problematic elements of the new methodology may not have such a large impact on measures of household wealth for the present day because market interest rates and GDP growth are more similar now than they were in 2018 to 2020. However, this does not remove the problems inherent in the new approach. In their current state, official statistics do not provide a reliable picture of total household wealth or of the inequality in wealth between young and old.
1. Introduction
The total wealth of Britain’s households in 2018 to 2020 was approximately £2.2 trillion less than was previously believed – a 14% reduction. That, at least, was an implication of a report from the Office for National Statistics (ONS) published in December (Office for National Statistics, 2024). The revision was entirely due to changes in how private pension wealth was valued – resulting in the total estimated value of this wealth in 2018 to 2020 being reduced by over one-third, from £6.4 trillion to £4.2 trillion (see Table 1).
Table 1. Total household private pension wealth in Great Britain according to the Wealth and Assets Survey
| April 2018 to March 2020 | April 2020 to March 2022 |
New methodology | £4.2 trillion | £4.8 trillion |
Old methodology | £6.4 trillion | Unknown |
Difference | £2.2 trillion | Unknown |
Source: Authors’ calculations using https://www.ons.gov.uk/peoplepopulationandcommunity/personalandhouseholdfinances/incomeandwealth/datasets/impactofupdatedpensionsmethodologyonpensionwealth and https://www.ons.gov.uk/peoplepopulationandcommunity/personalandhouseholdfinances/incomeandwealth/datasets/totalwealthwealthingreatbritain.
The revision results from three changes in methodology made by the ONS to its Wealth and Assets Survey (WAS), which aims to record the level and distribution of wealth of British households every two years. Two of these changes are welcome improvements, in one case correcting a serious error in the methodology previously used (though unfortunately not correcting the estimates for previous years which remain based on this erroneous methodology). But the third change – by far the biggest, by itself subtracting a staggering £2.3 trillion from recorded wealth – is misguided, resulting from jumbled economic reasoning. The change matters not only because of its colossal magnitude but because, while data on income are comparatively plentiful (not least from tax records), WAS represents practically the only official source of information regarding the distribution of household wealth in Great Britain. It is quite possible that the ONS’s revised estimates of household wealth are actually further from the truth than the estimates it started with (themselves undoubtedly flawed).
This report proceeds as follows. Section 2 describes the challenge of valuing defined benefit pensions. Section 3 sets out the two changes made to the methodology that are welcome improvements. Section 4 discusses the change that makes a flawed aspect of the methodology worse.
2. Valuing defined benefit pensions
The changes announced by the ONS relate to the measurement of pension wealth – primarily defined benefit (DB) pension wealth. Typically, DB pensions involve an employer promising to pay an employee a percentage of their final or career-average salary every year from a set retirement age until death,1 with the percentage increasing for each year that the employee remains in the scheme. Calculating how much such promises are worth is challenging. Ultimately, what WAS is aiming to capture is the market value of household wealth. When measuring housing wealth, for example, respondents are asked: ‘About how much would you expect to get for your current home if you sold it today?’ (UK Data Service, undated). Valuing assets consistently on a market basis is a sensible approach and allows values to be compared or added together to produce an estimate of a household’s total wealth. Unlike houses, however, DB pension rights are not generally bought and sold, meaning no market price is available when it comes to valuing them.2
How then might a reasonable estimate of a DB pension’s market value be reached? Broadly speaking, it is an exercise that requires three steps:
- Work out the period for which pension payments will be made. This depends both on the age at which full pension benefits can first be drawn (known as the ‘normal retirement age’) and on the life expectancy of the individual (as benefits are generally paid out until death).3
- Calculate the income that the pension will provide each year. An individual earning £40,000 a year who has built up a promise of 10% of their final salary, for example, has accrued a benefit of £4,000 a year in retirement. If (as is usually the case) the policy holder is promised £4,000 a year plus inflation (up to a cap), the valuer must account for this by increasing the promised benefit accordingly.
- Convert that future income to today’s terms. A DB pension is a promise of an income in the future. The valuer’s final step, therefore, is to calculate how much that promise – the amount calculated in step 2 for the period determined in step 1 – is worth today (its ‘present value’). One way to think of this is that they must ask how much money an individual would need to have in savings today to accumulate the stream of income promised in the future. The key variable here is the interest rate. If the rate of interest is expected to be high, savings will grow rapidly, making it cheaper (in today’s terms) to accumulate the promised amount. If the interest rate is low, more would need to be saved today to build up the same amount in the future, making the pension promise more valuable.
3. Welcome changes
Three changes have been made to how the ONS carries out the valuation of pensions: two welcome, one much less so. Let us start with the good news. DB pensions are, in almost all cases, subject to at least some inflation protection: the promised income is typically increased in line with inflation every year both before and after benefits begin to be paid. As a result of a methodological error introduced in the 2010–12 edition of the survey,4 WAS has for the last decade treated DB pensions as if the promised income were not increased with inflation for the period before it became payable, only for the period after the payments started. The ONS had therefore been understating the cash amount of the benefit when carrying out step 2 of the calculation set out in Section 2.5
This was a straightforward mistake, with the result that official statistics on household wealth have for ten years been erroneously reducing the estimated DB pension wealth of British households. Among those affected, the error is most acute for the young, who have many more years of inflation-linked increases to benefit from before retirement. Happily, and in line with advice from IFS researchers, this error has now been corrected for the latest data and going forward, a change that increases total household wealth as measured by WAS by roughly £500 billion (as shown in Figure 1). Unfortunately, the ONS is not revising its estimates for earlier years to correct the mistake (indeed it still does not acknowledge explicitly that it was a mistake), so official estimates of DB pension wealth from April 2010 to March 2020 remain downwardly biased in that respect and should be regarded as unreliable.
Figure 1. Impact of ONS methodology changes on measured total household wealth
(2018–20)
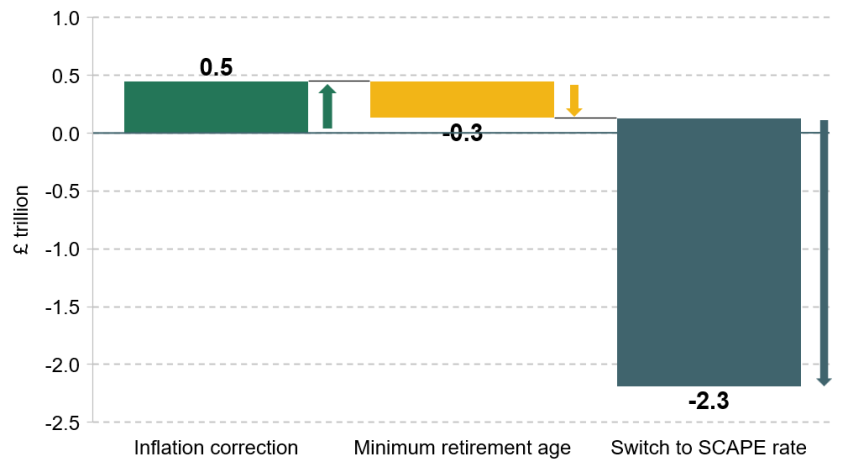
Note: Figures shown for the inflation correction and the minimum floor on normal retirement ages represent the impact of imposing each of these changes separately and so are not strictly additive. In other words, the ‘Minimum retirement age’ bar shows the impact of imposing a minimum normal retirement age relative to the current methodology, not the impact of imposing the minimum age after the inflation correction has been made. The ‘Switch to SCAPE rate’ bar shows the aggregate impact of making all three changes minus the sum of the amounts shown by the first two bars. The impact of the three methodology changes on the most recent vintage of WAS (covering the period April 2020 to March 2022) has not been published by the ONS.
Source: Authors’ calculations using https://www.ons.gov.uk/peoplepopulationandcommunity/personalandhouseholdfinances/incomeandwealth/datasets/impactofupdatedpensionsmethodologyonpensionwealth and https://www.ons.gov.uk/peoplepopulationandcommunity/personalandhouseholdfinances/incomeandwealth/datasets/totalwealthwealthingreatbritain.
The second welcome change made by the ONS (again following advice from IFS researchers) has been to impose the blanket assumption that the holders of DB pensions are able to begin drawing their full pension no earlier than age 60. This alters the previous state of affairs where a large number of individuals were treated as being able to start drawing their full pension implausibly early.6 (This, in effect, meant that too many years of benefit were being included in step 1 of the calculation above). Correcting for this problem reduces the estimated total value of DB pensions – by roughly £300 billion (again as shown in Figure 1) – because a DB pension is more valuable if the promised income can be drawn, unreduced, from an earlier age. Again, the data for previous years are unfortunately not being revised.
4. A bad feature made worse
Both of the revisions described so far represent unambiguous improvements to the ONS’s methodology going forward. The same, unfortunately, cannot be said of the final, and much larger, change that the ONS has chosen to make. Unlike the two changes described so far, this revision relates not only to DB pensions but also to defined contribution (DC) pensions. A DC pension differs from a DB pension in that it does not promise a particular level of pension income: rather, it is a fund into which contributions are paid, with the value of the fund (and therefore the retirement income it can provide) depending on the amounts contributed and the investment returns earned. The change made by the ONS concerns the method used, in the latest and all future releases of WAS, to translate future pension income (from both DB and DC pensions) into today’s terms.
To understand the new methodology, it is important first to understand the method that preceded it. WAS approached the present-value calculation in two stages:
- Post-retirement: First, the ONS estimated what the value of the pension rights accumulated by an individual at the point of interview would be when they reached normal retirement age (or, for those already receiving their pension, its value at their current age). This was done by looking at the market price of an annuity (a financial product that provides the purchaser with a guaranteed annual income for life) that would pay out the promised amount of income from that age until death. This was done both for pensions already producing a regular income – whether a DB pension or an annuitised DC pension – and for DB pensions that had yet to begin producing an income (i.e. where the individual had yet to reach retirement).7 So if you had a DB pension that would provide £10,000 a year from age 67 and the annuity rate for a 67-year-old were 5% then that £10,000 a year flow would be converted into a cash value, at age 67, of £200,000.
- Pre-retirement: For DB pensions not yet in payment, a further step was required. The annuitisation procedure outlined above provided the value of the pension at the normal retirement age; this then needed converting into today’s terms, its ‘present value’. Since 2010, that conversion has been done using the formidably named Superannuation Contributions Adjusted for Past Experience (SCAPE) rate – currently set at CPI inflation + 1.7% a year – the details of which we return to below. The question that this effectively answered was how much would need to be invested today in order to obtain the lump-sum value of the DB pension at the point of retirement – assuming that investments grew each year at the SCAPE rate.
This approach was far from perfect. For one, using different methodologies for the periods before and after retirement meant, in the case of DB schemes, applying two inconsistent valuation methods to the same pension. Worse, while the annuitisation procedure used to value the payment phase of pensions was broadly sensible, the SCAPE rate was a fundamentally flawed choice for calculating present values.
The SCAPE rate is not in any meaningful sense a rate of interest. Rather, it is a government-published rate used to determine the level of contributions that public sector employers must make to the Treasury in respect of their DB pensions promises to their employees. Crucially, it is based not on the prevailing rate of interest in the market but on medium-term forecasts of the rate of UK GDP growth. GDP growth is a key driver of the future tax revenues that will be used to fund the government’s pension liabilities. Because of that, it affects the future affordability of public sector pension promises to the exchequer and may therefore be useful for calculating appropriate funding flows within the public sector to recognise their cost. It is not, however, an appropriate tool for converting the value of a future income into today’s terms. How much would need to be invested today to accumulate the promised benefit of the pension in the future? To answer that, what matters is the market interest rate, not the rate of GDP growth.
Unfortunately, the ONS has made a bad situation worse. The new methodology does away with the use of market-based annuity rates for valuing the post-retirement phase of the pension, replacing it with an expanded role for the (fundamentally inappropriate) SCAPE rate, which is now used to value both the pre- and post-retirement phases of the pension (see Figure 2).
Figure 2. Summary of changes to present-value calculation methodology
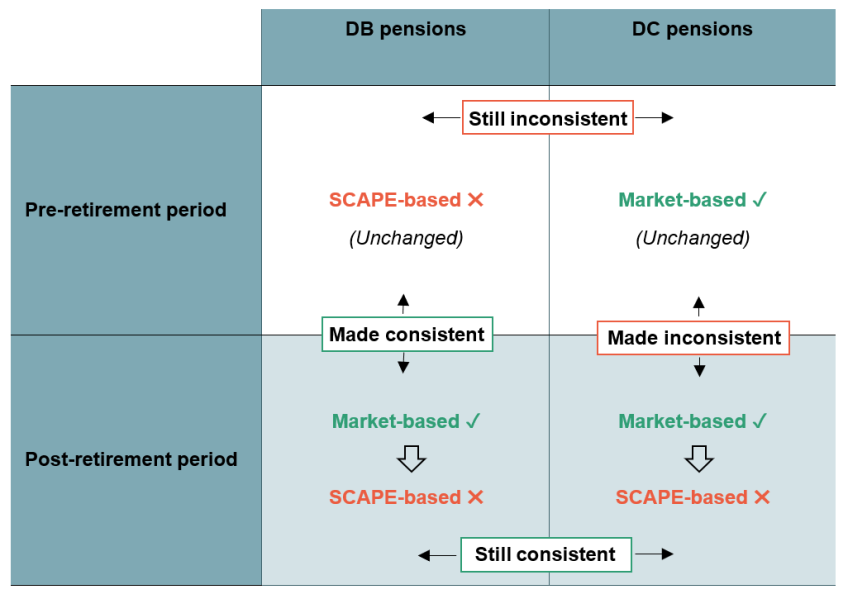
For DB pensions, this does at least have the advantage of introducing a consistent approach to the present-value calculation for the periods before and after retirement, rather than using the SCAPE rate for the period before retirement and a market-based annuity rate for the period after retirement. However, it does so at the expense of introducing a new inconsistency in the valuation of DC pensions. DC pensions were previously valued on a consistent market basis throughout, but are now assessed at market value until they are annuitised and using a SCAPE-based valuation thereafter. The estimated value of someone’s DC pension wealth in WAS may therefore change suddenly at the point they annuitise it; equivalently, two individuals with identical DC pension pots, one who annuitises and one who does not, may be assigned very different levels of wealth in WAS. That is clearly absurd. Given that DC pension pots (like other assets) are valued on a market basis, the way to achieve consistency before and after retirement for both DC and DB pensions would be to use market interest rates throughout. Rather than moving from market to SCAPE rates for valuing pensions in payment, the ONS should be moving from SCAPE to market interest rates for valuing DB pension promises.
The ONS argues that the choice of SCAPE ‘protects against undue volatility and reflects the stability of DB pension promises for those that hold them’ (Office for National Statistics, 2024). That is confused thinking. There can be no doubt that DB pensions are characterised by stability of a certain sort. If I have been promised that I will be paid 50% of my final salary (adjusted for inflation) when I reach 65, then that is what I will be paid; regardless of what investment returns I would have been able to earn in the meantime. Yet while it may be true that the income stream a DB pension provides remains stable, it does not follow that the present value of that income stream remains stable. The promise of £10,000 in 30 years’ time is worth less (£2,300) today if I can be assured of an interest rate of 5% than if I can only expect a return of 2% (£5,500). Just like a DB pension promise, the £10,000 remains stable, but as interest rates change its present value alters dramatically. To put it another way, someone without a DB pension needs to save more to match a DB promise when interest rates are low than when they are high.
If using a market interest rate to value DB pensions produces volatility, therefore, that is not ‘undue’. Quite the opposite: it is an accurate reflection of the fact that the current value of future DB pensions changes as interest rates change. DB pensions are much more valuable in a period of low interest rates than in a period of high interest rates. That is why employers offering DB pensions in the private sector must increase the level of underlying assets funding the scheme when interest rates fall. As rises in interest rates in recent years have reduced the value of DB pension promises, the funding position of many such schemes has moved from deficit to surplus (Pension Protection Fund, 2025).8
Housing is the most obvious analogy here. The benefit a homeowner derives from living in their house may be stable (like income from a DB pension). Yet the market value of the house can rise and fall, not least when interest rates change (just like the value of a DB pension). The change in market value might be irrelevant to a homeowner who plans never to sell their house, or to someone with a DB pension. But it is nonetheless true that the market value of their wealth has changed. The same is true of other assets as well: the value of company shares and bonds (and, therefore, DC pension pots) changes as market interest rates change, even if the expected stream of dividends or coupons does not. For all these assets, WAS captures their changing market value.
Implicitly, in other words, market interest rates already underpin the valuation of all other household assets recorded in WAS. Using a constant SCAPE rate instead – severing the link to market rates – thus means that WAS values DB and DC pensions in payment, as well as future DB pension rights, in a way that is inconsistent with all other assets. As the Government Actuary’s Department (GAD) makes clear in its advice to the ONS (Morley and Madden, 2024), the use of the GDP-based SCAPE rate results in a valuation that bears ‘no relation’ to that of other assets in WAS. That throws serious doubt on the comparability of the DB pension values calculated to the measured values of other assets and limits the usefulness of the dataset for calculating household wealth totals.
Precisely which market interest rate should be used in calculating the present value of DB pension promises is a complex and subtle question upon which reasonable people may disagree. As with the inflation error described in Section 3, the current use of the SCAPE rate for pre-retirement periods was ill-advisedly introduced in 2010;9 before that, WAS used the interest rate on AA-rated corporate bonds. Returning to that would be one reasonable option, but there are others (including several candidates mentioned in GAD’s advice to the ONS). We do not take a stance on what is the ‘best’ choice of interest rate to use. That it should be a market interest rate rather than the rate of GDP growth, however, should not be a serious point of debate.
All this might seem arcane, but measurement matters. WAS is virtually the only guide that policymakers have to how wealth is distributed amongst Britain’s households. Valuing pensions (which prior to the revision made up no less than 42% of measured household wealth) correctly is a crucial part of that. During the 2010s and early 2020s, the SCAPE rate was typically set substantially higher than the market interest rates underpinning the ONS’s previous annuity-based approach. As a result, the shift to a purely SCAPE-based approach represents a reduction in the measured value of household wealth by a whopping £2.3 trillion (see Figure 1), knocking around a third off the total estimated pension wealth of British households overnight. It is worth emphasising that these figures relate to the vintage of WAS covering the period from March 2018 to April 2020 (the only period for which the ONS has produced estimates under both old and new methodologies). The gap between the SCAPE rate and market interest rates has shrunk in the past couple of years, so the change in methodology should have a smaller effect on estimated wealth today, when data on that become available. Yet that narrowing of the gap between the SCAPE rate and market rates of interest is by no means mechanical and could easily be reversed again in the future. And regardless of the changing magnitude of the effect, the principle that present-value calculations should be based on market interest rates rather than economic growth rates is the right one.
It is not only estimates of aggregate wealth that matter. The estimated distribution of wealth across the population – and particularly across generations – has changed even more dramatically as a result of the ONS’s methodological changes. While the ONS’s revisions reduce the total measured pension wealth of those aged 65–74 by a staggering 38%, that of those aged 25–34 is actually increased by 11%. This is because moving to use SCAPE-based rather than market-based annuity rates reduces the estimated value of all DB pension wealth but only the DC pension wealth of those already receiving a pension, while correcting the former omission of pre-retirement inflation protections in DB pensions increases pension values most for younger contributors (who will benefit from many years of inflation increases). Whether that narrowing in the wealth gap between old and young is an accurate reflection of reality could have real consequences for the policy choices that are made.
Statistical choices are (understandably) rarely the stuff of front-page news. But the quality of our policymakers’ decisions can only be as good as the information available to them. It is a crucial function of official statistics to provide policymakers with as reliable a guide as possible to how the world really looks. And it is one which – at least when it comes to household wealth – they are currently failing to fulfil.
References
Morley, C. and Madden, S., 2024. ONS Wealth and Assets Survey: valuing defined benefit pension wealth. Government Actuary’s Department, https://assets.publishing.service.gov.uk/media/6751d2aa6da7a3435fecbd7c/ONS_Wealth_and_Assets_Survey_Valuing_Defined_Benefit_Pension_Wealth__1_.pdf.
Office for National Statistics, 2024. Estimating defined benefit pension wealth in Great Britain: December 2024. https://www.ons.gov.uk/peoplepopulationandcommunity/personalandhouseholdfinances/incomeandwealth/articles/estimatingdefinedbenefitpensionwealthingreatbritain/december2024.
Pension Protection Fund, 2025. The PPF 7800 index: March 2025 update. https://www.ppf.co.uk/PPF-7800-index.
UK Data Service, undated. Household Assets Survey Round 7 Main-Stage. UK Data Archive Study 7215 – Wealth and Assets Survey, https://doc.ukdataservice.ac.uk/doc/7215/mrdoc/pdf/7215_was_questionnaire_round_7.pdf.
Acknowledgements
The authors gratefully acknowledge financial support from the ESRC Centre for the Microeconomic Analysis of Public Policy (ES/T014334/1). They thank Paul Johnson for comments on an earlier draft.
Endnotes
Authors

Stuart Adam
Stuart is a Senior Economist working in the Tax sector, and focuses on analysing the design of the tax and benefit system.

Isaac Delestre
Isaac is a Senior Research Economist in the Taxation sector, focusing on the taxation of high-income individuals and closely-held corporate entities.


More from IFS
Understand this issue


Policy analysis


Academic research


