
Downloads
Download the report as a PDF
PDF | 1.04 MB
Executive summary
Key findings
- For many older people, navigating financial decision-making before and after retirement is increasingly complicated. One reason for this is that many more people approaching retirement now have defined contribution pension pots, which are rarely converted into annuities that would guarantee an income stream until death. This means that increasing numbers of older people will have to make active financial decisions into advanced age, when they may have started experiencing significant cognitive decline.
- Average cognitive scores, as measured by memory tests, remain relatively stable through individuals’ 50s and early-to-mid 60s but generally begin to fall steadily from the late 60s onwards, with even steeper falls for those in their 80s. The average memory score recorded in the English Longitudinal Study of Ageing falls by about a third between people’s early 60s and late 80s, with most of the decline coming after the late 70s.
- In order to understand how cognitive decline, and in particular reaching a low level of cognition, are associated with financial outcomes, we define a measure of ‘low cognition’ as scoring less than 7 out of 20 on the word recall memory test recorded in our dataset (compared with an average score of 11). The prevalence of low cognition starts rising particularly rapidly for those from their mid 70s onwards. Prevalence rises from between 2% and 5% for those in their 50s and 60s to 14% for those in their late 70s, and above 40% for those in their late 80s.
- These rapid increases in the prevalence of low cognition occur across all education groups. However, clear differences in the prevalence of low cognition remain at all ages, with less educated people more likely to have low cognition throughout. For example, the prevalence of low cognition for those in their 50s with degrees is less than 2%, compared with 7% among those with no qualifications. Among people in their late 80s, 33% of those with degrees have a low cognition score, compared with 50% of those with no educational qualifications.
- We study how net financial wealth changes after people are first recorded as having a low cognition score. The trajectories of wealth for those who experience cognitive decline and those who do not are similar immediately after the initial onset of low cognition, but substantial gaps appear 8–10 years later. By that point, people who have experienced cognitive decline have a level of net financial wealth that is roughly £30,000 less than those who did not.
- Wealthier households who experience cognitive decline see the largest declines both in absolute (£) and percentage terms – the decline in financial wealth is concentrated among those in the top half of the wealth distribution. One potential factor in driving these differences may be greater exposure to complex or risky assets. The declines in wealth are not explained by formal (non-residential) care costs or financial transfers (e.g. to children or grandchildren). We see a similar pattern of declining wealth even among those who never receive formal care, and transfers outside the household also tend to fall following cognitive decline.
- The exact mechanisms behind the decline in net financial wealth are not yet clear. The reductions could be a sensible response to worsening cognition where people decide to spend down their wealth more quickly. For example, even in the absence of formal care, those with cognitive decline may want to spend more on household services to help with day-to-day living. However, related research from other countries finds that the likelihood of financial mistakes increases with age.
- These results suggest that there is potential for policy to do more to protect financial security in later life. In the next few years, new regulations will require UK pension funds to provide a default retirement income product to their members. Default products that involve an annuity (income for life) being purchased with some of an individual’s pension wealth, potentially around age 75 or 80, could help make financial decisions in older age easier and protect those with cognitive decline from adverse financial outcomes. Other types of early planning – such as arranging power of attorney – could also help mitigate risks. But as the effects of cognitive decline on financial wealth appear only slowly, there is a window of opportunity for policymakers, pension providers and individuals themselves to put these protections in place.
1. Introduction
Many older individuals are responsible for managing increasingly complex wealth portfolios. This is especially the case in countries such as the UK (and the US), where there has been a shift from defined benefit (DB) pensions – which automatically guaranteed an income stream until death – to defined contribution (DC) pensions, which require the individual to make their own choices around how to use their private pension wealth. This is particularly the case as very few people in the UK purchase an annuity with their DC pension wealth, which would convert a pot of savings into a guaranteed income stream. Together, the rise in the prevalence of DC pensions and low rates of annuitisation mean that an increasing number of older people are likely to have to make active financial decisions – a cognitively intensive task – well into later life when cognitive decline becomes much more common. As a result, understanding the economic and financial effects of cognitive decline at older ages is becoming increasingly important.
Cognitive decline refers to a decrease in people’s cognitive abilities, and is often noticeable through issues such as impaired memory and lower attention span, or lessened ability to process information, solve problems and make decisions. Natural decline in cognitive abilities will occur to some extent among all people as they age, but the impacts can be extreme for some – such as due to the onset of Alzheimer’s disease and related dementias. In this report, we study patterns of cognitive decline and how it is associated with financial outcomes at older ages using a longitudinal survey dataset drawn from the population of England aged 50 and over.
There are many mechanisms through which cognitive decline could affect financial outcomes, since making financial decisions requires significant cognitive ability, such as numeracy. Indeed, there is a broad literature that shows that cognitive ability (especially numerical ability) is associated with wealth portfolio choices and financial outcomes (Banks and Crawford, 2022). For example, higher cognitive ability is associated with higher stock market participation (Banks and Oldfield, 2007; Christelis, Jappelli and Padula, 2010), more age-appropriate portfolio allocation (Fong et al., 2021) and shopping around for a better annuity rate (Banks, Crawford and Tetlow, 2015). Cognitive decline can also affect financial outcomes and wealth through susceptibility to fraud (Wood and Lichtenberg, 2017).
This existing evidence on the relationship between cognitive ability and financial outcomes suggests that as individuals age and experience cognitive decline, they may be more susceptible to making worse choices around their finances. Indeed, some existing evidence shows that financial mistakes, such as paying higher than market interest rates or incurring fees, display a U-shaped pattern by age, with middle-aged adults (mid 50s) making fewer financial mistakes than both younger and older adults (Agarwal et al., 2009). Investor performance also shows a hump-shaped pattern, with a peak at around age 42 and a significant drop in performance after age 70 (Korniotis and Kumar, 2011). Both of these findings are consistent with cognitive decline affecting financial decision-making at older ages (Keane and Thorp, 2016). Interestingly, Angrisani, Burke and Kapteyn (2023) find that older adults with higher cognitive ability (who tend to be more financially sophisticated) tend to take on higher levels of debt, leading to increased financial fragility which could be heightened by cognitive decline later on.
The research questions and methodology in this report are closely related to those of two studies using longitudinal data in the US, which find that the onset of cognitive decline is associated with reductions in wealth. Angrisani and Lee (2019) focus specifically on differences in wealth trajectories based on whether the financial decision-maker – that is, the member of the household who responds in the survey that they are in charge of the household finances – was the one experiencing cognitive decline. Mazzonna and Peracchi (2024) study whether the changes in financial wealth differ in size based on whether the respondent was aware of their cognitive decline. This report examines the relationship between the onset of cognitive decline and financial wealth using data for England. Unlike the two earlier studies, we use an ‘event-study’ style design, which allows us to study how differences in wealth evolve over time between those who experience cognitive decline and those who do not.
Understanding how cognitive decline affects financial outcomes is important for policy. While some people may sensibly respond to cognitive decline by starting to run down their assets faster, this may not be the case – especially for those unprepared for potential cognitive decline. A recent UK study showed that there is a real risk that people are not prepared for dealing with cognitive decline at older ages: among non-advised private pension holders aged 65–75, nearly four in ten (39%) had either ‘never’ or ‘not really’ thought about the risk of cognitive decline on their finances (Age UK and Aviva, 2025). This lack of preparation suggests that many older people are at risk of adverse outcomes if they are faced with cognitive decline later on. There is therefore a potential role for policymakers to explore cost-effective interventions to help reduce the risk of such outcomes, and to examine how older people’s families might be able to help when faced with these outcomes.
This report is structured as follows. Section 2 discusses the data we use and the definitions of cognitive decline and other key variables. Section 3 documents age profiles of cognition and how these differ between groups. Section 4 discusses our analysis of the associations between cognitive decline and financial wealth. Section 5 provides a brief conclusion.
2. Data
The dataset we use in this report is the English Longitudinal Study of Ageing (ELSA), a nationally representative survey of the population aged 50 and over in England. ELSA runs every two years, and we use 10 ‘waves’ of data from 2002–03 to 2021–23. For most of the analysis, we use a ‘balanced panel’, which refers to the set of individuals who we observe (and who complete the memory test we use as our key measure of cognition) in each wave. This means that we follow the same set of people for 20 years. We restrict the sample to those aged 50–69 in 2002–03 during Wave 1 who were born between 1932 and 1952. This leads to a sample of 1,680 people observed every two years for 20 years. For more information on the sample, see Appendix Table A1 for descriptive statistics.
While ELSA does attempt to include sample members who move into residential care homes between survey waves, it can be difficult to obtain interviews from people in residential care. In addition, some of the interviews of care home residents will be completed by a proxy respondent, meaning that the sample member would not respond to the cognitive test questions and would not be included in our sample. Given these caveats, we can think of our sample as capturing the older population in England, but excluding most of those who end up in residential care.
The key measure of cognition that we use in our analysis is word recall. In each wave of the survey, participants are read a list of 10 words, and then asked to repeat as many as they can immediately, and then again later in the survey. We add the scores from the ‘immediate’ and ‘delayed’ word recall together (so the possible range for this measure is 0 to 20) and use this as the main cognition score in this analysis.
We can think of cognition as an umbrella term that could refer to a number of different domains, such as attention and focus, memory, executive function, language, numeracy and visuospatial function (Langa et al., 2020). Out of these, the word recall test is a measure of memory and focus in particular, although these scores have also been shown to be strongly associated with other domains of cognition – for example, numeracy (Smith, McArdle and Willis, 2010).1 Celidoni, Dal Bianco and Weber (2017) find that in the European version of ELSA (known as the SHARE2 data), declines in the verbal recall test scores are predictive of the onset of dementia.
Verbal recall scores have been used as the measure of cognition in various studies relating cognitive decline to economic activity (e.g. Rohwedder and Willis, 2010; Banks et al., 2025). One of the reasons for the widespread use of this measure is that it has a relatively wide distribution, so it picks up a range of cognitive performance (rather than being a memory test that almost everyone ‘passes’, such as recalling the current date or prime minister). Angrisani and Lee (2019) also find that the association between cognitive decline and financial outcomes is more apparent when using the word recall score rather than a more general cognition score, suggesting that memory and focus (which are better captured by the word recall task) are among the most critical cognitive functions in determining the quality of financial decision-making at older ages.
In Section 3, we document the distribution and age profiles of cognition scores. But when considering the associations between age-related cognitive decline and financial decision-making, it is likely that reaching a certain level of low cognitive capacity matters more than the magnitude of the cognitive decline. In particular, moving from a medium to a low level of cognition may have more of an effect on decision-making than going from a high to middle level of cognition. For this reason, for the majority of the analysis, we focus on a measure of low cognition. We define this as having a score of less than 7 (on a scale of 0 to 20), which means being in the bottom 3% in terms of word recall scores for those aged 50–59 in Wave 1. In robustness checks (in Section 4.2 and Appendix C), we also confirm that the results hold for different definitions of this measure of low cognition – for example, using scores of 6 or 8 as the cut-off, or defining low cognition as when the average score over the last waves of data (two years apart) is less than 7.
Our main outcome of interest is net financial wealth, meaning financial assets less financial debt. We focus on this measure because we may expect that less liquid assets such as housing and defined benefit pensions are less likely to change following cognitive decline. The prevalence and amounts of defined contribution pension wealth among the generations studied here are also relatively low, as DB pensions were still more common in the late 1990s and early 2000s than DC pensions. Financial wealth is measured at the family3 level and defined as all savings (current accounts, savings accounts, shares, bonds and so on) less financial debt. This measure excludes housing and pension wealth. The measure of net financial wealth we present is adjusted for CPI inflation (presented in 2024 prices) and we winsorise the distribution within each wave of data at the 99th percentile of the distribution such that very high levels of wealth at the top of the distribution do not unduly affect the results.
In Section 4, we study how our measure of cognitive decline is associated with different trajectories of financial wealth. We do this using an ‘event-study’ style regression model, where we follow people who have experienced cognitive decline both before and after they reach the low-cognition threshold, and compare them with equivalent people (based on their other characteristics) who do not experience that decline. The regression analysis is described in more detail in Section 4 and Appendix B.
ELSA collects a variety of information on individuals and households. This means that we can control for a wide range of individual and household characteristics in our analysis. In particular, we control for demographic characteristics (sex, age, education, partner status, whether the respondent has children, housing tenure, region, health as measured by people’s ability to undertake different activities of daily living,4 whether the respondent has a high depressive score), baseline characteristics based on the first wave in 2002–03 (whether in paid work, whether receiving care, cognition and numeracy scores, who in the household manages finances, whether the respondent holds risky assets such as equities, quartile of the wealth distribution, whether they have any defined benefit pension wealth, whether they have any defined contribution pension wealth) and partner characteristics where relevant (partner age, whether partner has low cognition).
3. Patterns of cognitive decline
Before considering the relationship between cognitive decline and financial wealth, we document age profiles of cognition. The analysis in this section can help us better understand how cognition evolves with age and the stage at which cognitive decline becomes more prominent among older adults in England.
First, in order to understand the baseline level of cognition for people in their 50s and 60s, Figure 1 illustrates the distribution of scores among our sample in the first wave of data (where scores below 4 and above 17 have been aggregated together and shown at 3 and 18 respectively). The graph shows that the distribution of scores is somewhat bell-shaped, centred on a mean score of 11.4 and a median of 11, with a standard deviation of 2.8. The possible range of scores is 0 to 20, and among our sample 90% of the respondents have a score between 7 and 16. The multivariate regression results in the first column of Appendix Table A2 show that cognition scores tend to be higher among women, those with higher levels of education, those in better health (without functional limitations) and those in the top quartile in terms of financial wealth.
Figure 1. Distribution of cognition score of individuals aged 50-69, 2002-03
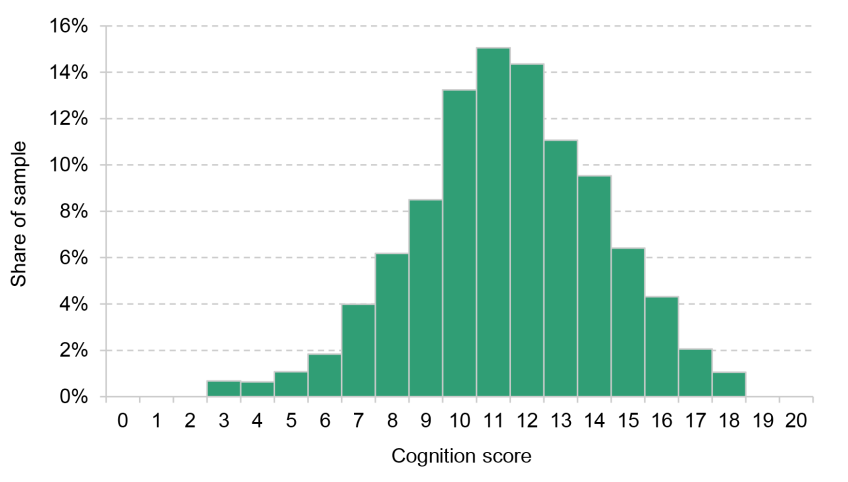
Note: Cognition score defined as the sum of immediate and delayed word recall tests. Sample of those observed in every wave, 1 to 10 (sample size 1,680). Scores below 3 and above 18 are aggregated to 3 and 18 respectively for disclosure reasons. Weighted using sampling weights.
Source: Author’s calculations using the English Longitudinal Study of Ageing, Wave 1 (2002–03).
In order to examine patterns of cognitive decline, we can draw age profiles of cognition scores using the data from all 10 waves, as shown in Figure 2. To take into account the fact that there may be differences in cognition score levels between different generations (e.g. due to differences in educational levels between groups born earlier and later), we draw the age profiles after controlling for five-year year-of-birth cohorts.
Figure 2. Mean cognition (word recall) score out of 20, by age
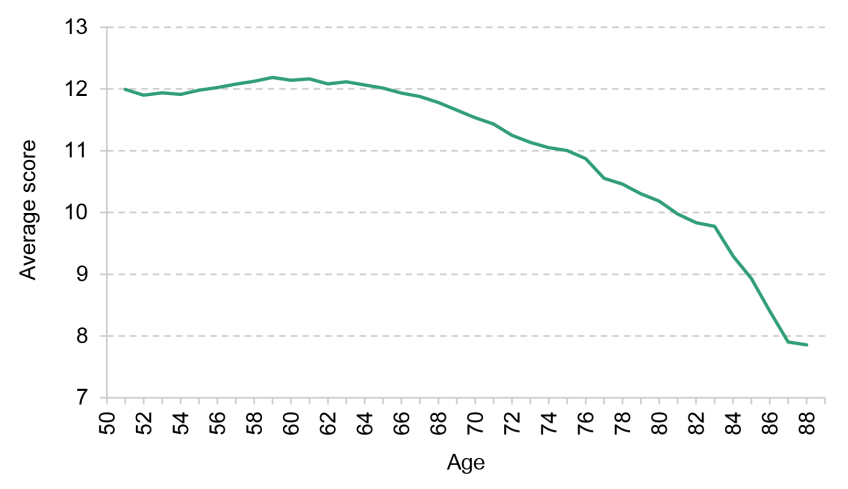
Note: The age profile is constructed by taking the three-year moving average of the age coefficients from a regression of the cognition score on year-of-age dummy variables and five-year year-of-birth cohort dummy variables. The profile is drawn for the 1948–52 cohort’s level.
Source: Author’s calculations using the English Longitudinal Study of Ageing, Waves 1 to 10 (2002–03 to 2021–23).
The graph shows that average cognitive scores remain relatively stable through people’s 50s and early 60s but begin to fall steadily from the late 60s onwards, with even steeper falls for those in their 80s. The average score falls by a third from the early 60s to the late 80s, with a 10% decline in scores between the late 60s and the late 70s, and a further 24% decline between the late 70s and the late 80s.
We would expect life expectancy to be positively correlated with cognition scores (given we know wealth and education are positively correlated with both). This means that in our analysis, ignoring differences in mortality rates between groups would flatten the age profile of cognition,5 as the earlier average cognition scores would be based on a sample where we have more lower-life-expectancy and lower-cognition individuals. However, we use a ‘balanced panel’, meaning we only include those who are present in each wave of the data. This means that, by definition, these profiles are not affected by differential mortality (or attrition).6
As discussed in the previous section, when studying the relationship between cognition and financial decision-making, we may care more about individuals reaching a low level of cognition than about the magnitude of the drop in cognition score, as those with high baseline cognition may experience large falls in their scores while still maintaining a level of cognition that would not necessarily affect their financial decision-making. In other words, we may be more interested in the proportion of the sample who reach particularly low cognition scores, rather than just looking at the average score.
To better understand these patterns, we can draw age profiles of the prevalence of ‘low cognition’ scores. As described in the previous section, we define this as having a score of less than 7.7 Figure 3 shows the age profile of having a low cognition score, again taking into account cohort differences in prevalence of cognition. As the graph illustrates, the prevalence of low cognition starts rising particularly rapidly from the mid 70s onwards. It rises from 2–5% for those in their 50s and 60s to 14% for those in their late 70s, and above 40% for those in their late 80s.
Figure 3. Prevalence of low cognition (word recall) score, of less than 7, by age
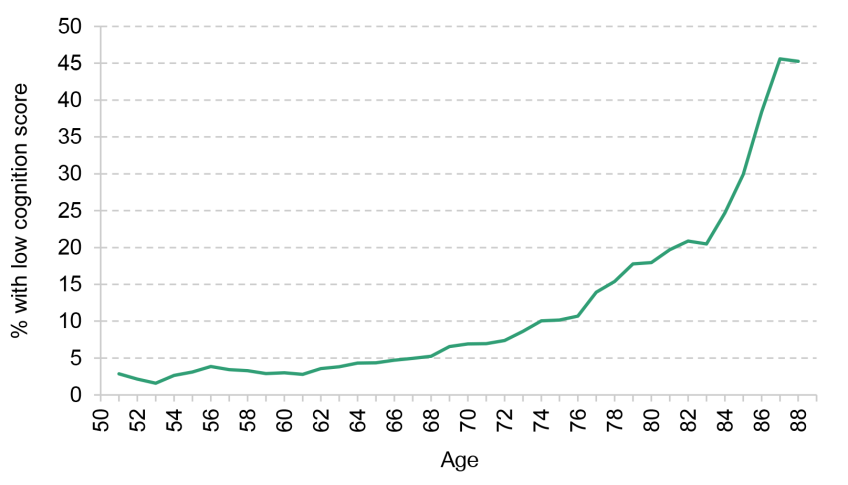
Note: Low score defined as less than 7 out of 20 on an immediate and delayed word recall memory test. The age profile is constructed by taking the three-year moving average of the age coefficients from a regression of the low score indicator on year-of-age dummy variables and five-year year-of-birth cohort dummy variables. The profiles are drawn for the 1948–52 cohort’s level.
Source: Author’s calculations using the English Longitudinal Study of Ageing, Waves 1 to 10 (2002–03 to 2021–23).
We can also look at how age profiles of low cognition differ between different groups. Education and cognition may be positively correlated because those with higher innate cognitive ability choose to stay in education for longer, but also through a causal channel where education may improve cognitive abilities.8 Indeed, using ELSA, Banks and Mazzonna (2012) show that an additional year of schooling, induced by an increase in the minimum school-leaving age from 14 to 15 in the late 1940s in England, improved later-life cognition scores.
Figure 4 shows differences in the prevalence of low cognition between educational groups in our sample. It shows that those with no qualifications are much more likely to have a low cognition score in their 50s and 60s – for example, the prevalence of low cognition for those in their 50s with degrees is less than 2%, compared with 7% among those with no qualifications. While these gaps remain throughout, prevalence of low cognition increases rapidly for those in their late 70s and 80s across all educational groups. Among people in their late 80s, 33% of those with degrees have a low cognition score, compared with around 50% of those with no educational qualifications.
Figure 4. Prevalence of low cognition score, by age and education
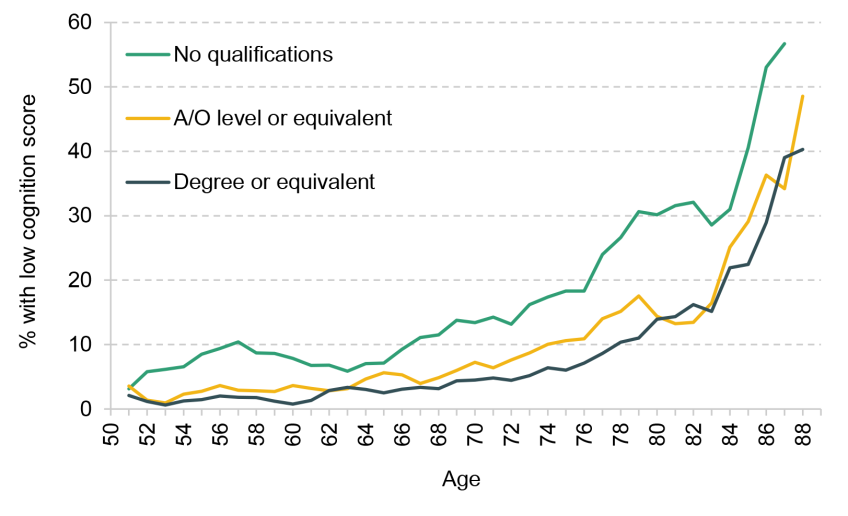
Note: Low score defined as less than 7 out of 20 on an immediate and delayed word recall memory test. The age profile is constructed by drawing the three-year moving average of the age coefficients from a regression of the low score indicator on year-of-age dummy variables and five-year year-of-birth cohort dummy variables. The profiles are drawn for the 1948–52 cohort’s level. Cells based on fewer than 10 observations excluded.
Source: Author’s calculations using the English Longitudinal Study of Ageing, Waves 1 to 10 (2002–03 to 2021–23).
This illustrates that while low cognition is less prevalent in midlife among those with more educational qualifications, all groups are at risk of low cognition at more advanced ages. This is also the case even though the starting level of cognition among the highly educated is much higher (Appendix Figure A1), meaning that they will have to experience a larger decline in their cognition score (in both absolute and relative terms) in order to reach a score of less than 7.
Similar differences between groups arise when looking at gender and baseline wealth (as illustrated in Appendix Figures A2 and A3). The second column of Appendix Table A2 shows results from a regression of ‘ever reaching low cognition score’ on a set of characteristics (where ‘ever reaching low cognition score’ is a dummy variable that takes the value 1 if the respondent reaches the low cognition score during the 20 years we observe them, and 0 otherwise). The results show that even when controlling for a number of different characteristics at the same time (including the baseline cognition score), reaching low cognition is less likely for example among those who were younger to begin with, women, those with higher levels of education and homeowners, and these differences are statistically significant. However, once controlling for a wide range of characteristics in this multivariate regression set-up (in Appendix Table A2), we do not see a systematic relationship between the level of initial wealth and the likelihood of ever experiencing cognitive decline.
A potential concern with our measure of cognition is that the test is performed only once every two years, and depending on factors such as how well rested the respondent is, the word recall test could capture a temporary reduction in memory function (or poor performance in the test on the day) rather than permanent decline in cognitive ability. Because of this concern, we show that the age profiles of prevalence of low cognition look very similar when defining low cognition based on the average of two consecutive waves being less than 8, or when defining it as having a score of less than 7 in each of two consecutive waves. This is also the case when using score 6 or 8 instead of 7 as the threshold for low cognition: while the prevalence of low cognition is higher with a higher threshold and lower with a lower one, the overall age profiles look similar when using these definitions (as shown in Appendix Figure A4).
4. Cognitive decline and financial outcomes
In the previous section, we showed that cognitive decline affects a significant minority of people, starting in people’s 70s. In this section, we look at how our measures of cognitive decline are associated with changes in financial wealth, by following people who experience cognitive decline, both before and after they reach the low-cognition threshold, and compare them with equivalent people (based on their other characteristics) who do not experience that decline.
We do this using an event-study style regression model where the outcome is net financial wealth, using all individuals in the sample. We define the first time a person reaches the low cognition score as the ‘event’ of cognitive decline. In essence, we follow the net financial wealth trajectories of people who are similar in terms of their characteristics, comparing those who do (treatment group) and do not (control group) experience cognitive decline. This means that we can examine to what extent reaching a low cognition state is associated with a different trajectory of financial wealth. In the analysis, we control for time effects and individual- and household-level characteristics described in Section 2. For more technical detail on the analysis, see Appendix B.
Figure 5 presents the results from this analysis. It shows differences in the trajectories of net financial wealth in the years before and after the first signs of cognitive decline among those who experience cognitive decline, compared with those who do not. The black dots mark the estimated change in financial wealth (in 2024 prices), while the bars show the 95% confidence intervals around those estimates, indicating their precision – when these bars span 0, the estimate is not statistically significant at the 5% level. We observe outcomes every two years. Year 0 on the horizontal axis is the wave where the treatment group are first observed as experiencing cognitive decline.
Figure 5. Association between experiencing low cognition score for the first time and financial wealth, by years since first having low cognition
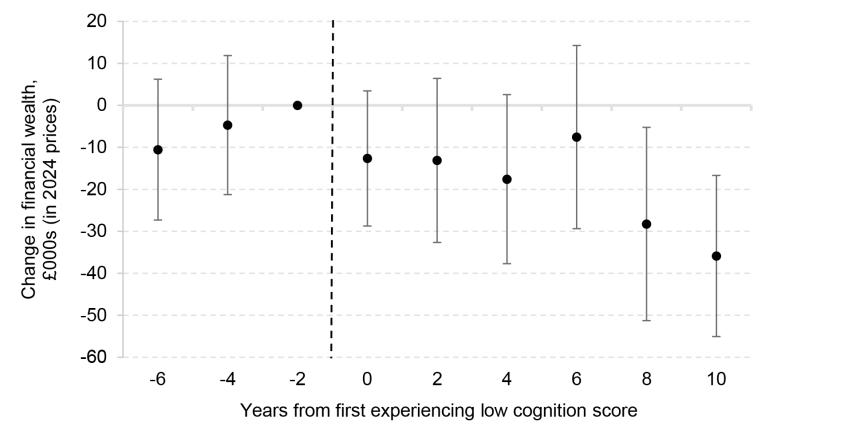
Note: Estimated coefficients from an event study (see Appendix B for details). Outcome variable is net financial wealth; number of observations is 15,961. Estimation includes controls for demographic characteristics (sex, age, education, partner status, whether the respondent has children, housing tenure, region, health as measured by people’s ability to undertake different activities of daily living, whether the respondent has a high depressive score), baseline characteristics based on the first wave in 2002–03 (whether in paid work, whether receiving care, cognition and numeracy scores, who in the household manages finances, whether the respondent holds risky assets such as equities, quartile of the wealth distribution, whether they have any defined benefit pension wealth, whether they have any defined contribution pension wealth) and partner characteristics where relevant (partner age, whether partner has low cognition). The bars indicate the 95% confidence intervals.
Source: Author’s calculations using the English Longitudinal Study of Ageing, Waves 1 to 10 (2002–03 to 2021–23).
We see that in the years leading up to the first signs of low cognition – looking at the first two data points from the left – trajectories of net financial wealth among those who do and do not experience low cognition look very similar. This means that there are no systematic differences in levels of wealth before the onset of low cognition for the treatment group.
The estimates to the right of the dashed line illustrate whether the trajectories of wealth start diverging between those who experience cognitive decline and those who do not, after the first signs of cognitive decline. The estimates immediately after the first event of low cognition are statistically insignificant around 0, which suggests that trajectories of wealth immediately after the first event of cognitive decline are similar between the two groups. However, the estimates for 8 and 10 years on from the first sign of cognitive decline show that gaps in wealth trajectories appear later on. By then, those who had experienced cognitive decline have a level of net financial wealth that is roughly £30,000 less than those who did not (compared with a baseline mean net financial wealth of around £105,000). In essence, these results show that those who reach the low-cognition threshold have lower levels of wealth in later years than those who did not experience such a change – although this difference appears later on, not immediately.
It is worth noting that we should be careful before interpreting these as conclusive causal estimates of the effect of cognitive decline on financial wealth; rather, we are looking to document how net financial wealth evolves before and after reaching the low cognition score compared with those who do not experience low cognition. In reality, many things could be happening at the same time as cognitive decline. While we control for factors such as functional limitations and partner’s cognitive decline in our regression model, we cannot rule out that there could be other things that would contribute to these changes in wealth in addition to cognitive decline. However, while we do not claim that this is a conclusive causal relationship, these results can still provide important evidence on the associations between cognitive decline and financial wealth.
4.1 Do trajectories of net financial wealth following cognitive decline differ between groups?
In order to shed more light on the main results in Figure 5, we can also look at how the association between cognitive decline and trajectories of net financial wealth differs between different groups.
First, some of the those experiencing cognitive decline may end up paying for formal care to help them with their daily activities. In order to assess whether this is driving the results, we can split the sample into those who receive formal care at some point and those who do not. As shown in Panel B of Appendix Figure C2, we see a similar pattern in terms of lower levels of wealth 8–10 years after the low cognition event even among those who never receive formal care, which suggests that formal care receipt outside of residential care cannot (at least fully) explain these patterns. We do find that the changes in wealth are larger for those who do receive formal care, although a regression with interaction terms confirms that these differences are not statistically significant. However, it is worth keeping in mind that (as discussed in Section 2), our sample does not comprehensively cover those in residential care, meaning that we cannot rule out residential care being associated with declines in wealth after cognitive decline.
We may also expect that people with higher levels of wealth might see larger declines in their wealth, both because they have more wealth to start with and because they tend to hold riskier assets. Indeed, Mazzonna and Peracchi (2024) find, using data from the US, that those experiencing a severe decline in cognition while being unaware of it are more likely to experience declines in wealth than other groups, and these declines are concentrated among those who were initially wealthier and active on the stock market. They speculate that this higher initial level of financial activity and decision-making makes these people more exposed to making financial errors after experiencing cognitive decline.
In our results, we find that the decline in wealth is larger in both absolute (pound terms, shown in Appendix Figure C3) and proportional terms for wealthier individuals than for those with less wealth to begin with. Figure 6 shows the same analysis as previously, but where the change in wealth is presented as a percentage change, and with the sample split into those in the top half (Panel A) and bottom half (Panel B) of the financial wealth distribution, measured at the baseline (in 2002–03).9 This figure shows that the main results in Figure 5 are larger among those in the upper half of the wealth distribution than among those in the lower half. This suggests that higher wealth exposes people to potentially larger changes in their financial wealth.
Figure 6. Association between experiencing low cognition score for the first time and net financial wealth, by years since first having low cognition and by baseline wealth
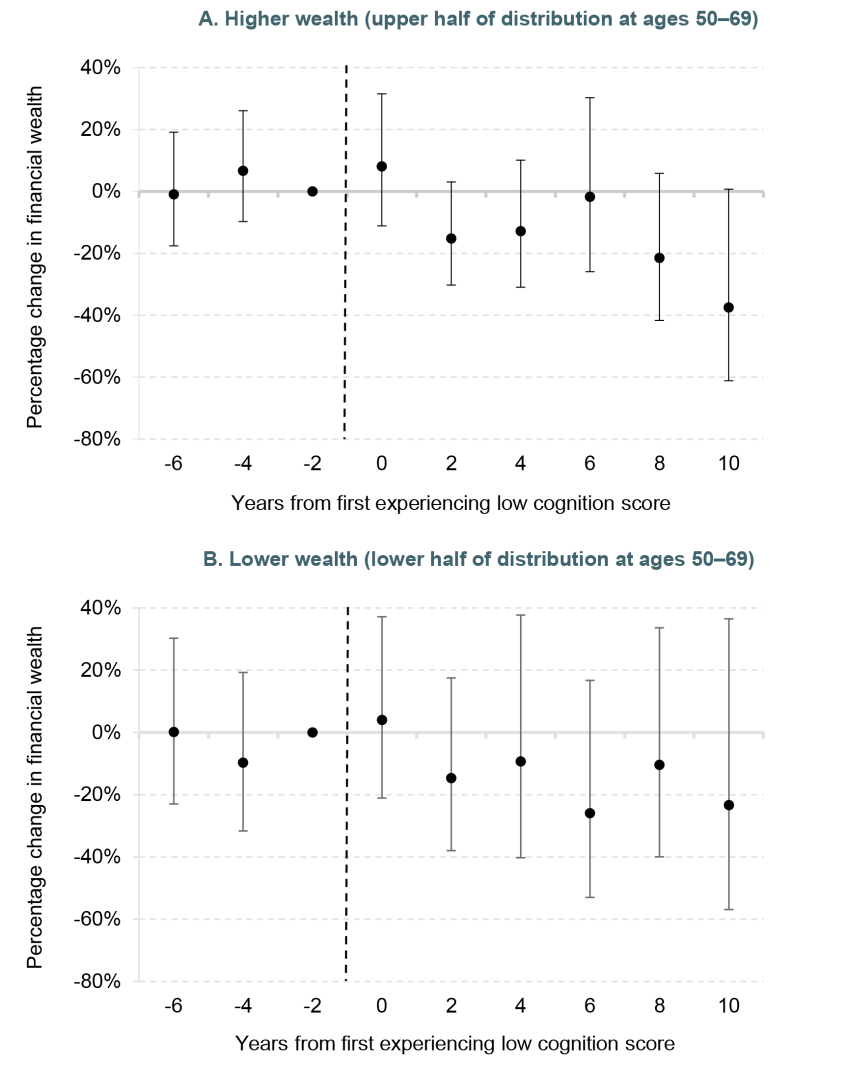
Note: Estimated coefficients from an event study. Outcome variable is log net financial wealth which has been transformed to ensure zero and negative wealth is defined (more detail on the transformation is given in Appendix B). The estimates are shown as percentage change in wealth. Estimation includes controls listed in the note to Figure 5. The bars indicate the 95% confidence intervals. Number of observations is 7,802 in Panel A and 7,471 in Panel B.
Source: Author’s calculations using the English Longitudinal Study of Ageing, Waves 1 to 10 (2002–03 to 2021–23).
These results cannot determine whether these patterns are due to wealthier households using up their wealth more rapidly following cognitive decline for ‘rational’ reasons, such as increasing spending when faced with the risk of a shorter retirement in good cognitive health. The results could also arise because those with higher levels of wealth are more likely to hold more complex and risky assets (Banks and Tanner, 2000), which could expose them more to making financial errors.
We have also examined other potential mechanisms that could explain these results. First, in ELSA, people are asked if they have made financial transfers to family, friends or charity in the previous four weeks. Changes in transfers could potentially explain the patterns we find, if we think that people experiencing cognitive decline started making large transfers outside the household. We run the same analysis as before using transfers as an outcome (Appendix Figure C4), but find that transfers also fall after the event of cognitive decline, and the magnitude of these changes is much smaller than the magnitude of the changes in wealth that we find. This suggests that making these kinds of financial transfers cannot explain the patterns we find.
An existing study from the US (Angrisani and Lee, 2019) shows that changes in financial wealth following an event of cognitive decline are larger among households where the person in charge of finances was the one experiencing cognitive decline. We run our analysis separately for couples where the person in charge of finances experienced cognitive decline and those where the one experiencing cognitive decline was not solely responsible for finances. While the effects are slightly larger for those where the person in charge of finances was experiencing cognitive decline, we find a decline in financial wealth that is comparable to the main results for those where finances are managed jointly as well (Appendix Figure C5). We also find that individuals who have children see larger decreases in their wealth after reaching a low cognitive score (Appendix Figure C6). This is somewhat in contrast with Angrisani and Lee (2019), who find that those who receive help with their finances from their children see smaller decreases in financial wealth following cognitive decline. Given that this result differs from the evidence from the US, the potential reasons for the difference may be an interesting area for further study.
4.2 Robustness checks
In order to ensure that the results are not driven by the specific definition of cognitive decline that we use, we have also tested their robustness to a range of different definitions. Appendix Figures C7 to C10 show the main results where the event of cognitive decline is defined as having an average score from two consecutive waves of less than 7, or a score of less than 8 in two consecutive waves, or a score of less than 6 or less than 8. There are some differences in exact magnitude of the effects under the alternative thresholds, but all of them confirm similar patterns where wealth declines more among those who experience cognitive decline, and the effect takes place a number of years after the event.10
The last wave in our data is after the COVID-19 pandemic. There is increasing evidence that the pandemic may have had an impact on older people’s cognition both directly from the viral infection (Nature Ageing, 2024) and through other channels such as lockdowns and social isolation (Conroy, 2025). At the same time, both prolonged illness and lockdowns may have also affected people’s wealth accumulation and decumulation. In order to confirm that our results are not driven by the pandemic, we have also run the analysis excluding the last wave of ELSA data, and Appendix Figure C11 confirms that the patterns look very similar.
5. Conclusion and discussion
In this report, we have shown that average cognitive scores start falling and the prevalence of low cognition starts rising with age, especially for those in their 70s and 80s. While there are differences in the level of cognition by education for example, all groups in their 80s have a relatively high prevalence of low cognition scores, meaning that no particular group is protected from this risk.
Our analysis also shows that when individuals first fall below the low-cognition threshold, their financial wealth slowly begins to diverge from that of similar people whose cognition remains above the threshold – within a decade, they have around £30,000 lower net financial wealth. The impact is largest among the wealthiest half of the population, indicating that they are more exposed to the effects of cognitive decline on wealth. We find that the wealth declines are not explained by transfers outside the household or by formal care costs (at least in non-residential settings).
Although we have shown that cognitive decline is associated with falls in wealth, we cannot necessarily determine whether this relationship is driven by financial mistakes. Indeed, it could instead be a rational response by the household to spend more resources. For example, even in the absence of formal care, those with cognitive decline may want to spend more on household services to help with day-to-day living.
However, these results do suggest that it is important for individuals to be aware of the potential effects of cognitive decline on financial outcomes. Policymakers also need to recognise that as populations age, financial security in later life may be undermined by cognitive decline.
There are a number of policy options that could help address these risks. In the next few years, new regulations will require UK pension funds to provide a default retirement income product to their members. Many individuals could benefit from having access to financial products that protect against poor decision-making at older ages, such as ‘flex-then-fix’ type retirement income products where part of an individual’s pension wealth is annuitised at a later stage, potentially around age 75 or 80. These products have a number of benefits – for example, they ensure that people who do not make active decisions around pension decumulation can still have longevity protection in place at older ages. Crucially for this research, they also help ensure that key decisions are made at an age when cognitive decline is less likely to have set in (e.g. Boileau, Cribb and Emmerson, 2025; Boyle and Webb, 2022).
It is also important for pension providers and financial advisers to encourage people to engage in other forms of early planning – for example, putting in place safeguards such as power of attorney arrangements before the onset of cognitive decline. This is particularly important for those who have significant non-annuitised pension wealth and other financial wealth. There is also a role for older people’s families in helping to set up these arrangements.
However, our results show that as the effects of low cognition on financial wealth emerge only relatively gradually, there is a potential window of opportunity for policymakers, pension providers, individuals and families to put in place these protections. For example, it may not be too late for households to start thinking about protections when they are already in retirement. If individuals were nudged to consider advance financial planning at a set age (e.g. 75), many could still be able to put in place arrangements to protect their finances from the effects of significant cognitive decline.
Appendix A. Additional descriptive information
Table A1. Descriptive statistics of analysis sample used in this report in Wave 1 (2002–03), by whether experienced low cognition between 2002–03 and 2021–23
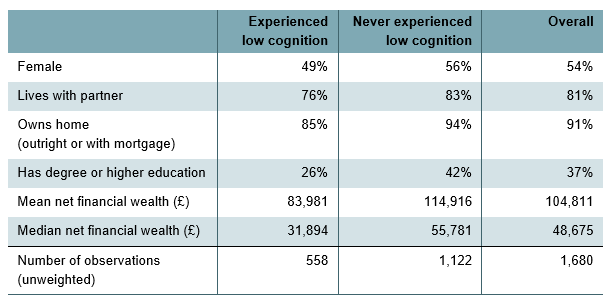
Source: Author’s calculations using the English Longitudinal Study of Ageing, 2002–03 to 2021–23.
Table A2. Regression results of Wave 1 cognition score and ‘ever experienced low cognition’ on characteristics
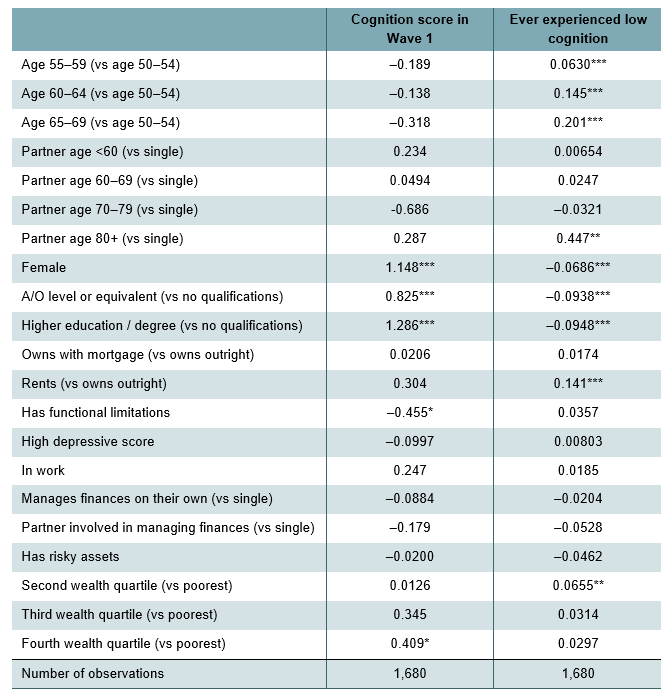
Note: The stars indicate significance level where * p<0.10, ** p<0.05, *** p<0.01. Regression coefficients from regressions of cognition memory test score in Wave 1 and whether ever reached score of less than 7 over the study period of 10 waves (2002–03 to 2021–23). We also control for numeracy (higher numeracy is associated with higher cognition score in the first column), and Wave 1 cognition in the second column (where higher baseline cognition is associated with lower likelihood of ever experiencing low cognition). We also control for 10 regions of England – none of the coefficients in the first column is significant; in the second column, those in the North West, West Midlands and East are less likely to ever experience cognitive decline than those in the North East (coefficient significant at 10% or 5% level). We also control for whether has children, whether receiving formal or informal care, whether family has defined contribution or defined benefit pension wealth and whether partner has cognition score of less than 7 in Wave 1; none of the coefficient estimates on these is significant at the 10% level in either regression.
Source: Author’s calculations using the English Longitudinal Study of Ageing, 2002–03 to 2021–23.
Figure A1. Average cognition score, by education
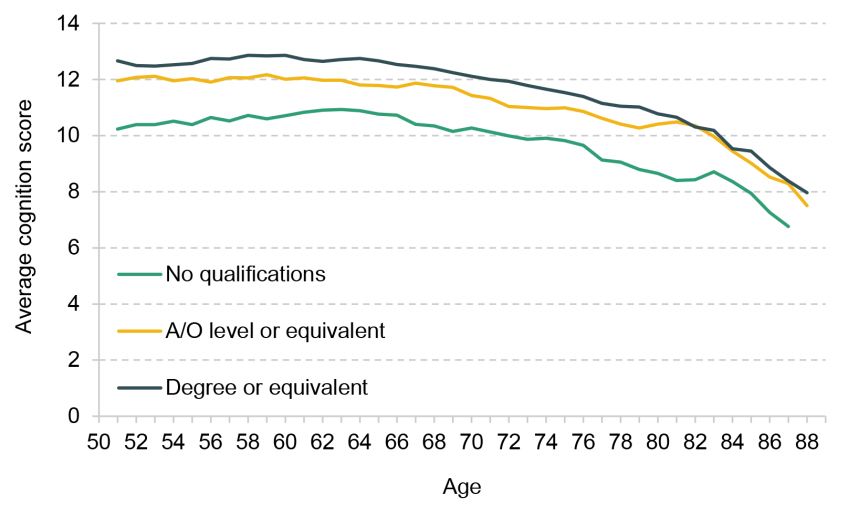
Note: The age profile is constructed by taking the three-year moving average of the age coefficients from a regression of the cognition score on year-of-age dummy variables and five-year year-of-birth cohort dummy variables. The profile is drawn for the 1948–52 cohort’s level. Excludes cells with fewer than 10 observations.
Source: Author’s calculations using the English Longitudinal Study of Ageing, 2002–03 to 2021–23.
Figure A2. Prevalence of low cognition score, by gender
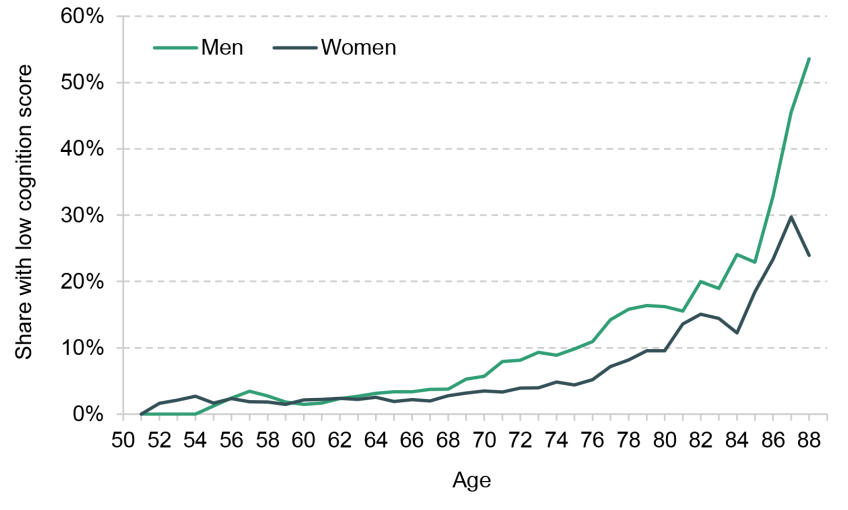
Note: Low score defined as less than 7 out of 20 on an immediate and delayed word recall memory test. The age profile is constructed by taking the three-year moving average of the age coefficients from a regression of the low score indicator on year-of-age dummy variables and five-year year-of-birth cohort dummy variables. The profile is drawn for the 1948–52 cohort’s level. Excludes cells with fewer than 10 observations.
Source: Author’s calculations using the English Longitudinal Study of Ageing, 2002–03 to 2021–23.
Figure A3. Prevalence of low cognition scores, by initial wealth quartile
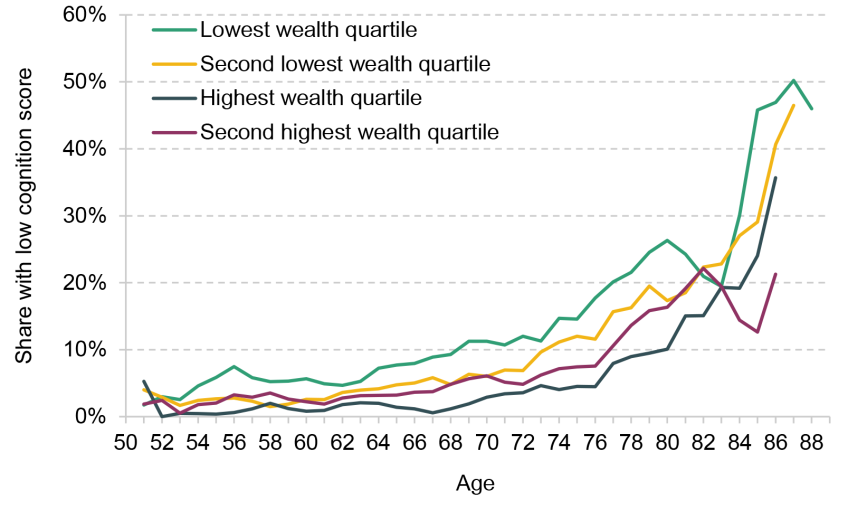
Note: Low score defined as less than 7 out of 20 on an immediate and delayed word recall memory test. The age profile is constructed by taking the three-year moving average of the age coefficients from a regression of the low score indicator on year-of-age dummy variables and five-year year-of-birth cohort dummy variables. The profile is drawn for the 1948–52 cohort’s level. Excludes cells with fewer than 10 observations.
Source: Author’s calculations using the English Longitudinal Study of Ageing, 2002–03 to 2021–23.
Figure A4. Low cognition defined as: score less than 8; score less than 6; average of two consecutive waves less than 7; score less than 8 in two consecutive waves
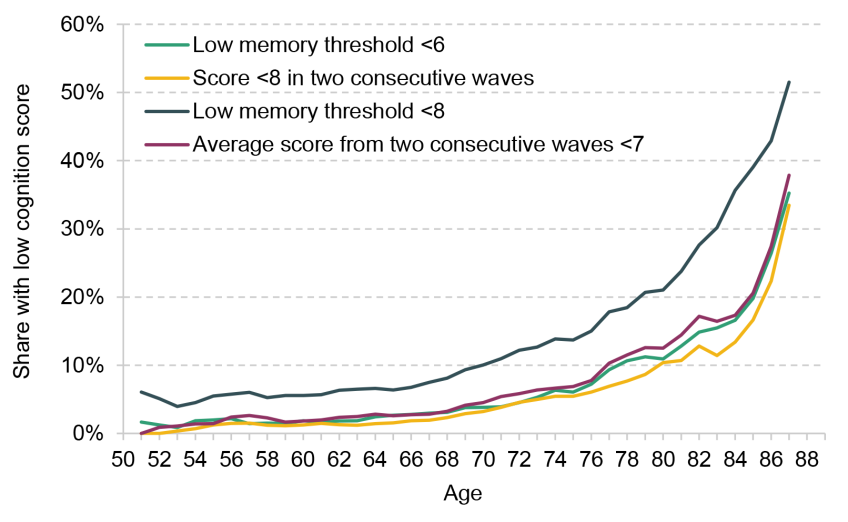
Note: The age profile is constructed by taking the three-year moving average of the age coefficients from a regression of the low score indicator on year-of-age dummy variables and five-year year-of-birth cohort dummy variables. The profile is drawn for the 1948–52 cohort’s level. Excludes cells with fewer than 10 observations.
Source: Author’s calculations using the English Longitudinal Study of Ageing, 2002–03 to 2021–23.
Appendix B. Regression model and estimation
In the analysis in Section 4, the model we estimate is
where the outcome variable is wealth for individual in wave , is a constant, and are the wave fixed effects. is the date of treatment, so that the dummies given by the indicator function indicate being periods before or after treatment. These variables are always 0 for the ‘never treated’ control group who do not experience cognitive decline over the period. is the idiosyncratic error term. The coefficients of interest, which are presented in the figures in Section 4 and Appendix C, are . The vector presents a set of covariates described in Section 2. We cluster the standard errors at the individual level. The regressions are estimated using two-way fixed effects estimation with sampling weights. We have confirmed the results are also robust to estimation using the imputation method by Borusyak, Jaravel and Spiess (2024), which takes into account the fact that there may be heterogeneous treatment effects when using staggered treatment.
When the outcome is log financial wealth, we transform the variables so that when wealth is positive, log wealth is defined as , and when wealth is zero or negative, log wealth is defined as . This follows the approach by Kleinjans and Lee (2006), for example. The results using log financial wealth are also robust to using different transformations such as shifting wealth by a constant to ensure all values are defined or using the inverse hyperbolic sine.
Appendix C. Additional regression results
Figure C1. Main results using an unbalanced panel
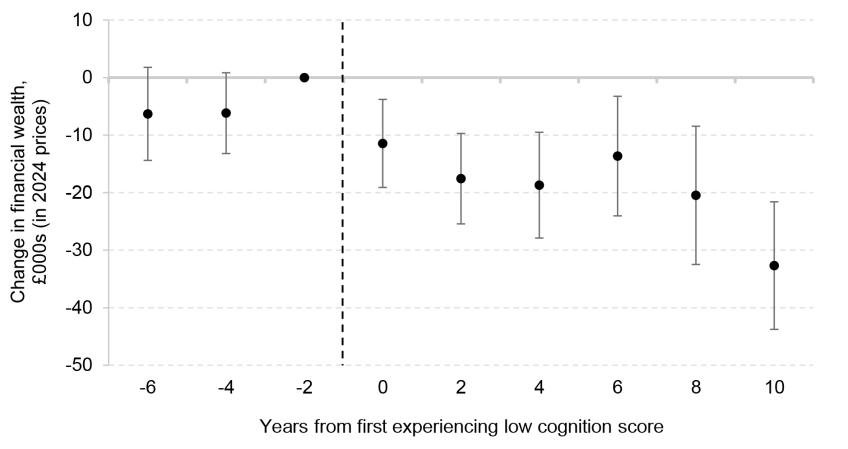
Note: Unbalanced panel means that we include everyone in the sample who was aged 50–69 in Wave 1, rather than restricting to those who we observe in each wave as in the main results. Estimated coefficients from an event study (see Appendix B for details). Outcome variable is net financial wealth; number of observations is 40,359. Estimation includes the same controls as in the main results. The bars indicate the 95% confidence intervals.
Source: Author’s calculations using the English Longitudinal Study of Ageing, 2002–03 to 2021–23.
Figure C2. Main results by whether received formal care
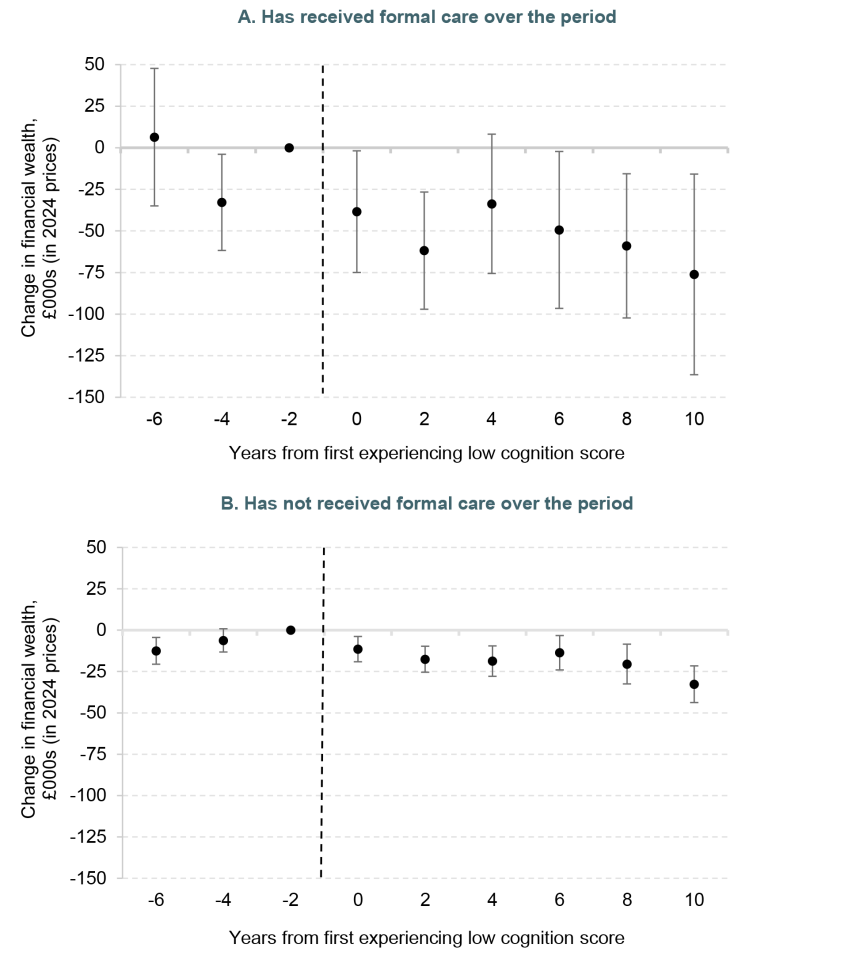
Note: Estimated coefficients from an event study (see Appendix B for details). Outcome variable is net financial wealth; number of observations is 1,400 for Panel A and 14,561 for Panel B. Estimation includes the same controls as in the main results. The bars indicate the 95% confidence intervals.
Source: Author’s calculations using the English Longitudinal Study of Ageing, 2002–03 to 2021–23.
Figure C3. Main results by baseline wealth
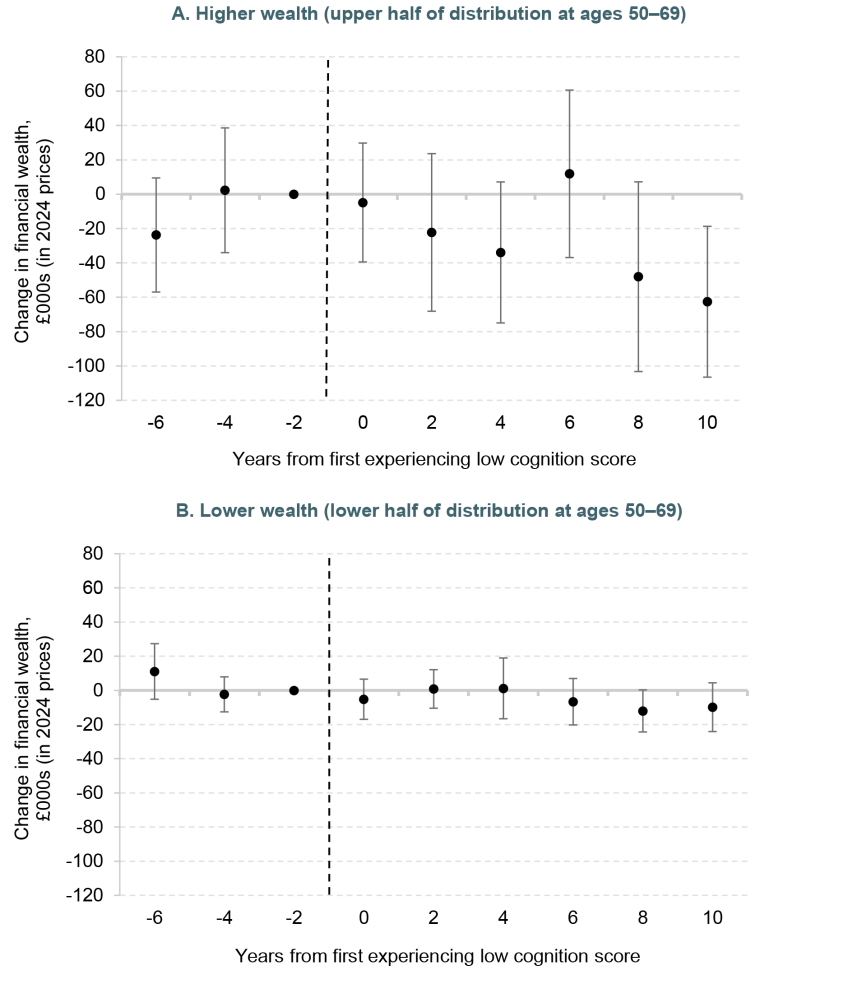
Note: Estimated coefficients from an event study (see Appendix B for details). Outcome variable is net financial wealth; number of observations is 7,867 for Panel A and 7,471 for Panel B. Estimation includes the same controls as in the main results. The bars indicate the 95% confidence intervals.
Source: Author’s calculations using the English Longitudinal Study of Ageing, 2002–03 to 2021–23.
Figure C4. Main results where outcome is transfers (over the past four weeks)
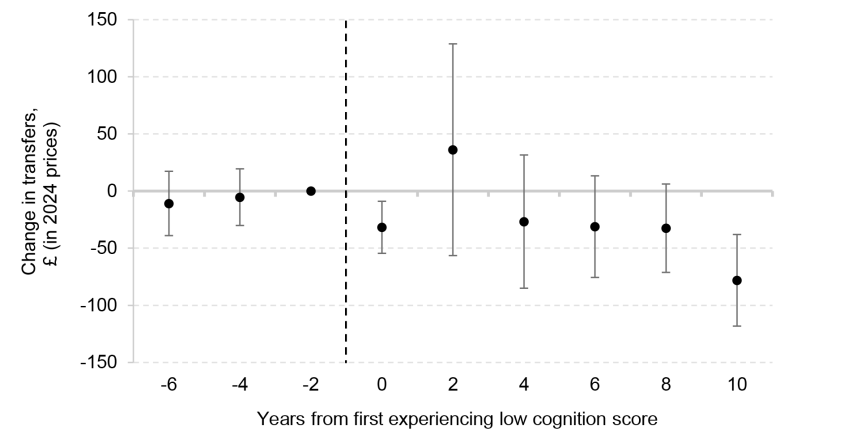
Note: Estimated coefficients from an event study (see Appendix B for details). Outcome variable is transfers made outside the household in the last four weeks. Sample size is 16,120. Estimation includes the same controls as in the main results. The bars indicate the 95% confidence intervals.
Source: Author’s calculations using the English Longitudinal Study of Ageing, 2002–03 to 2021–23.
Figure C5. Main results by whether the financial respondent is the one experiencing cognitive decline (couples only)
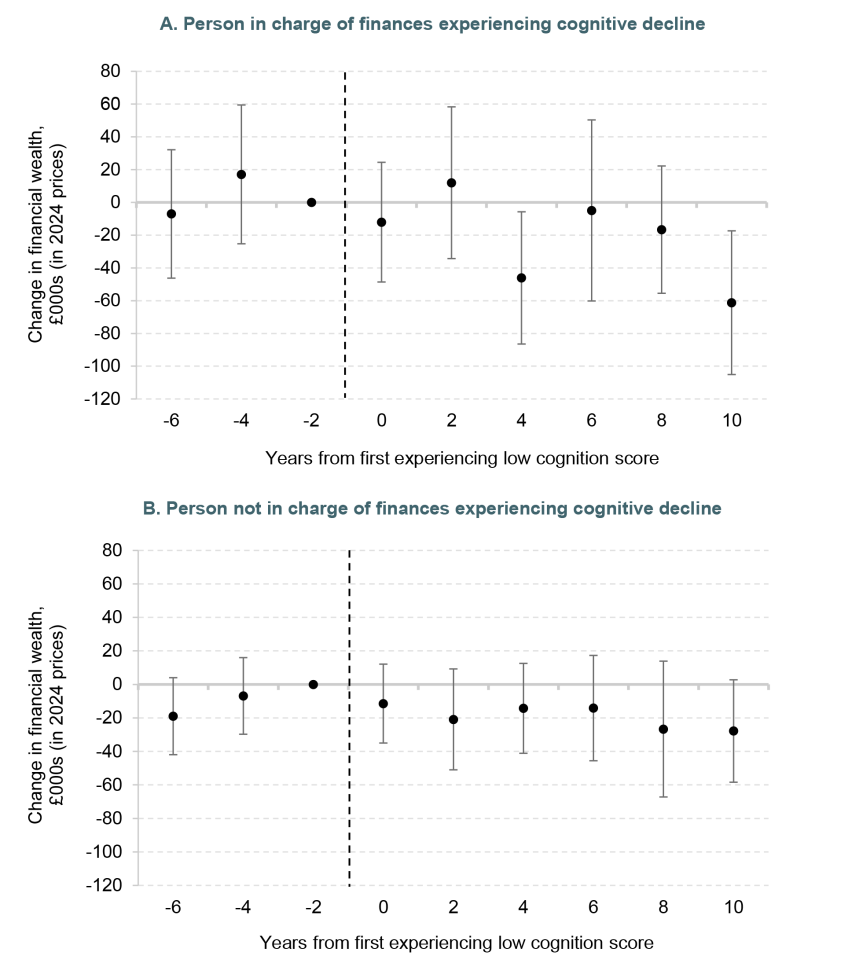
Note: Estimated coefficients from an event study (see Appendix B for details). Outcome variable is net financial wealth. Sample size is 3,211 for Panel A and 8,496 for Panel B. Estimation includes the same controls as in the main results. The bars indicate the 95% confidence intervals.
Source: Author’s calculations using the English Longitudinal Study of Ageing, 2002–03 to 2021–23.
Figure C6. Main results by whether has children
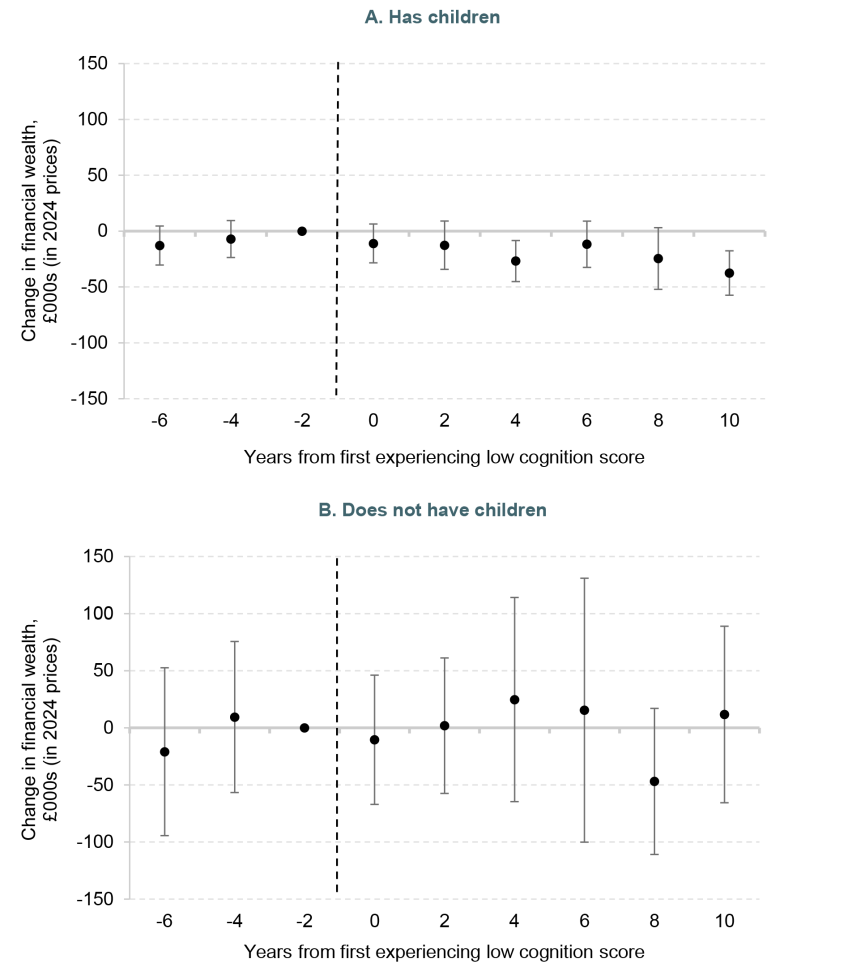
Note: Estimated coefficients from an event study (see Appendix B for details). Outcome variable is net financial wealth. Sample size is 13,302 for Panel A and 1,925 for Panel B. Estimation includes the same controls as in the main results. The bars indicate the 95% confidence intervals.
Source: Author’s calculations using the English Longitudinal Study of Ageing, 2002–03 to 2021–23.
Figure C7. Main results where low cognition defined based on average score from two consecutive waves of less than 7
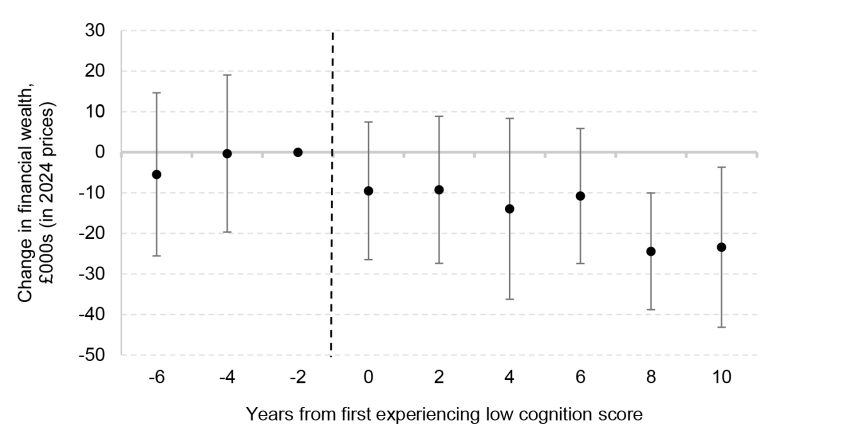
Note: Estimated coefficients from an event study (see Appendix B for details). Outcome variable is net financial wealth. Sample size is 16,680. Estimation includes the same controls as in the main results. The bars indicate the 95% confidence intervals.
Source: Author’s calculations using the English Longitudinal Study of Ageing, 2002–03 to 2021–23.
Figure C8. Main results where low cognition defined based on score from two consecutive waves being less than 8
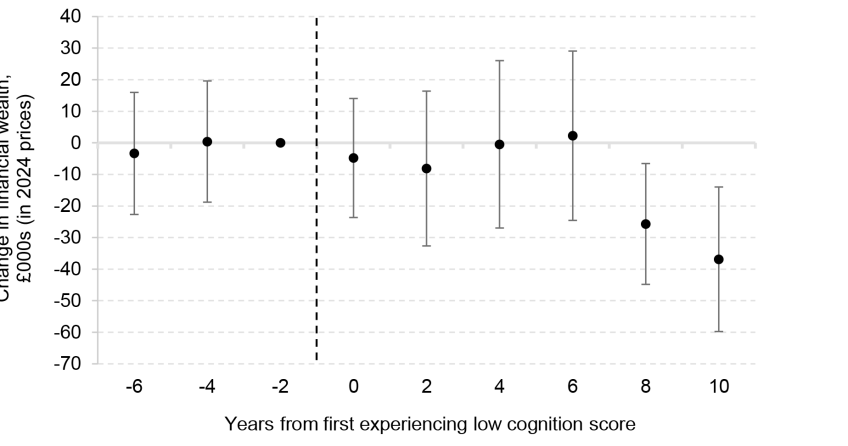
Note: Estimated coefficients from an event study (see Appendix B for details). Outcome variable is net financial wealth. Sample size is 16,680. Estimation includes the same controls as in the main results. The bars indicate the 95% confidence intervals.
Source: Author’s calculations using the English Longitudinal Study of Ageing, 2002–03 to 2021–23.
Figure C9. Main results where low cognition defined as score of less than 6
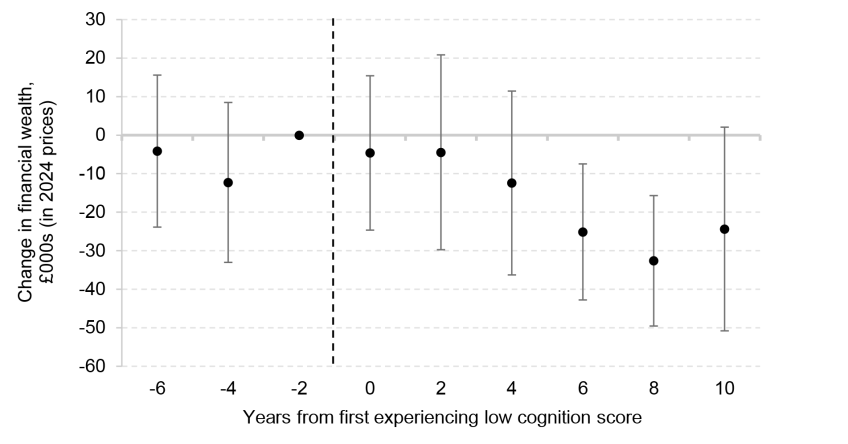
Note: Estimated coefficients from an event study (see Appendix B for details). Outcome variable is net financial wealth. Sample size is 16,277. Estimation includes the same controls as in the main results. The bars indicate the 95% confidence intervals.
Source: Author’s calculations using the English Longitudinal Study of Ageing, 2002–03 to 2021–23.
Figure C10. Main results where low cognition defined as score of less than 8
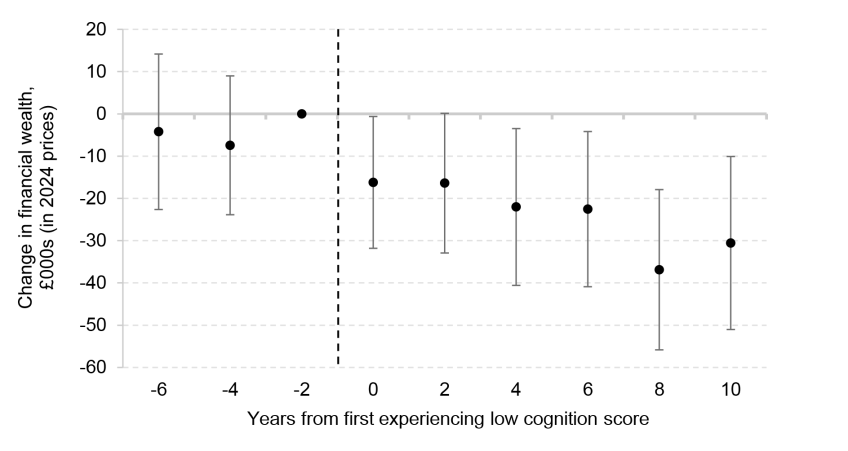
Note: Estimated coefficients from an event study (see Appendix B for details). Outcome variable is net financial wealth. Sample size is 15,288. Estimation includes the same controls as in the main results. The bars indicate the 95% confidence intervals.
Source: Author’s calculations using the English Longitudinal Study of Ageing, 2002–03 to 2021–23.
Figure C11. Main results without the post-pandemic period
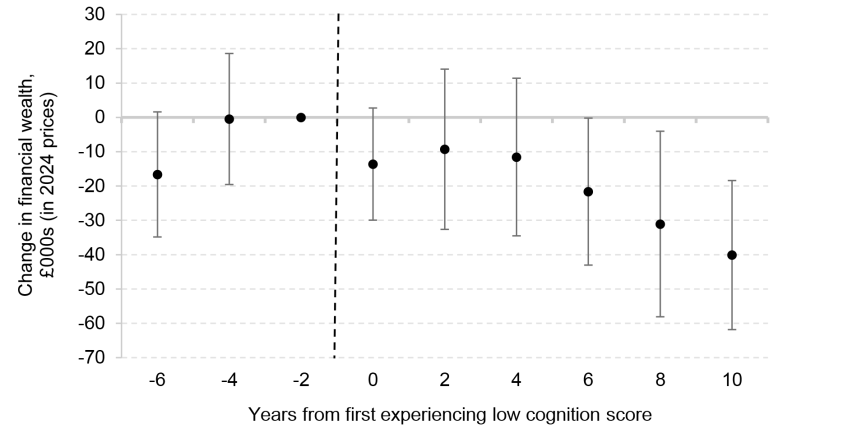
Note: Estimated coefficients from an event study (see Appendix B for details). Outcome variable is net financial wealth. Sample size is 14,371. Estimation includes the same controls as in the main results. The bars indicate the 95% confidence intervals.
Source: Author’s calculations using the English Longitudinal Study of Ageing, 2002–03 to 2021–23.
References
Agarwal, S., Driscoll, J. C., Gabaix, X. and Laibson, D., 2009. The age of reason: financial decisions over the life cycle and implications for regulation. Brookings Papers on Economic Activity, Fall, 51–117.
Age UK and Aviva, 2025. Managing money in mid-retirement. https://static.aviva.io/content/dam/aviva-corporate/documents/newsroom/pdfs/reports/Aviva-Age-UK-Retirement-Report-2025.pdf.
Angrisani, M., Burke, J. and Kapteyn, A., 2023. Cognitive ability, cognitive aging, and debt accumulation. Journal of Banking & Finance, 148, 106747, https://doi.org/10.1016/j.jbankfin.2022.106747.
Angrisani, M. and Lee, J., 2019. Cognitive decline and household financial decisions at older ages. Journal of the Economics of Ageing, 13, 86–101, https://doi.org/10.1016/j.jeoa.2018.03.003.
Attanasio, O. P. and Hoynes, H. W., 2000. Differential mortality and wealth accumulation. Journal of Human Resources, 35(1), 1–29, https://doi.org/10.2307/146354.
Banks, J. and Crawford, R., 2022. Managing retirement incomes. Annual Review of Economics, 14, 181–204, https://doi.org/10.1146/annurev-economics-051420-014808.
Banks, J., Crawford, R. and Tetlow, G., 2015. Annuity choices and income drawdown: evidence from the decumulation phase of defined contribution pensions in England. Journal of Pension Economics & Finance, 14(4), 412–38, https://doi.org/10.1017/S1474747215000256.
Banks, J., Cribb, J., Emmerson, C. and Sturrock, D., 2025. The impact of work on cognition and physical disability: evidence from English women. Labour Economics, 94, 102730, https://doi.org/10.1016/j.labeco.2025.102730.
Banks, J. and Mazzonna, F., 2012. The effect of education on old age cognitive abilities: evidence from a regression discontinuity design. The Economic Journal, 122(560), 418–48, https://doi.org/10.1111/j.1468-0297.2012.02499.x.
Banks, J. and Oldfield, Z., 2007. Understanding pensions: cognitive function, numerical ability and retirement saving. Fiscal Studies, 28(2), 143–70, https://doi.org/10.1111/j.1475-5890.2007.00052.x.
Banks, J. and Tanner, S., 2000. Household portfolios in the UK. IFS Working Paper WP0014, https://ifs.org.uk/publications/household-portfolios-uk.
Boileau, B., Cribb, J. and Emmerson, C., 2025. Policies to help people manage defined contribution pension wealth through retirement. IFS Report, https://ifs.org.uk/publications/policies-help-people-manage-defined-contribution-pension-wealth-through-retirement.
Borusyak, K., Jaravel, X. and Spiess, J., 2024. Revisiting event-study designs: robust and efficient estimation. The Review of Economic Studies, 91(6), 3253–85, https://doi.org/10.1093/restud/rdae007.
Boyle, P. and Webb, S., 2022. ‘The flex first, fix later’ pension – is this the future of retirement? Lane Clark and Peacock, https://www.lcp.com/en/media-centre/press-releases/the-flex-first-fix-later-pension-is-this-the-future-of-retirement.
Celidoni, M., Dal Bianco, C. and Weber, G., 2017. Retirement and cognitive decline. A longitudinal analysis using SHARE data. Journal of Health Economics, 56, 113–25, https://doi.org/10.1016/j.jhealeco.2017.09.003.
Christelis, D., Jappelli, T. and Padula, M., 2010. Cognitive abilities and portfolio choice. European Economic Review, 54(1), 18–38, https://doi.org/10.1016/j.euroecorev.2009.04.001.
Conroy, G., 2025. People’s brains aged faster during the COVID pandemic – even the uninfected. Nature, 643(8074), 1167–8, https://doi.org/10.1038/d41586-025-02313-3.
Fong, J. H., Koh, B. S. K., Mitchell, O. S. and Rohwedder, S., 2021. Financial literacy and financial decision-making at older ages. Pacific-Basin Finance Journal, 65, 101481, https://doi.org/10.1016/j.pacfin.2020.101481.
Keane, M. P. and Thorp, S., 2016. Complex decision making: the roles of cognitive limitations, cognitive decline, and aging. In J. Piggott and A. Woodland (eds), Handbook of the Economics of Population Aging, North-Holland. https://doi.org/10.1016/bs.hespa.2016.09.001.
Kleinjans, K. J. and Lee, J., 2006. The link between individual expectations and savings: do nursing home expectations matter? University of Aarhus, Department of Economics, Working Paper 2006-5, https://papers.ssrn.com/sol3/papers.cfm?abstract_id=1147034.
Korniotis, G. M. and Kumar, A., 2011. Do older investors make better investment decisions? The Review of Economics and Statistics, 93(1), 244–65, https://doi.org/10.1162/REST_a_00053.
Langa, K. M., Ryan, L. H., McCammon, R. J., Jones, R. N., Manly, J. J., Levine, D. A., Sonnega, A., Farron, M. and Weir, D. R., 2020. The Health and Retirement Study Harmonized Cognitive Assessment Protocol Project: study design and methods. Neuroepidemiology, 54(1), 64–74, https://doi.org/10.1159/000503004.
Mazzonna, F. and Peracchi, F., 2024. Are older people aware of their cognitive decline? Misperception and financial decision-making. Journal of Political Economy, 132(6), 1793–830, https://doi.org/10.1086/728697.
Nature Aging, 2024. Long-term cognitive change after COVID-19 in older individuals. Nature Aging, 4(9), 1180–1, https://doi.org/10.1038/s43587-024-00687-z.
Rohwedder, S. and Willis, R. J., 2010. Mental retirement. Journal of Economic Perspectives, 24(1), 119–38, https://doi.org/10.1257/jep.24.1.119.
Smith, J. P., McArdle, J. J. and Willis, R., 2010. Financial decision making and cognition in a family context. Economic Journal, 120(548), F363–80, https://doi.org/10.1111/j.1468-0297.2010.02394.x.
Wood, S. and Lichtenberg, P. A., 2017. Financial capacity and financial exploitation of older adults: research findings, policy recommendations and clinical implications. Clinical Gerontologist, 40(1), 3–13, https://doi.org/10.1080/07317115.2016.1203382.
Data
NatCen Social Research, University College London, Institute for Fiscal Studies. (2023). English Longitudinal Study of Ageing. [data series]. 7th Release. UK Data Service. SN: 200011, http://doi.org/10.5255/UKDA-Series-200011.
Acknowledgements
Funding for this research was provided by the IFS Retirement Saving Consortium: Aegon; Age UK; Association of British Insurers; Association of Consulting Actuaries; Aviva; Department for Work and Pensions; Franklin Templeton; Institute and Faculty of Actuaries; The Investment Association; Joseph Rowntree Foundation; Lane, Clark and Peacock; Money and Pensions Service; Nucleus; Pensions UK; People’s Partnership; Royal London; and Standard Life.
I also gratefully acknowledge the support of the Economic and Social Research Council (ESRC) Joint Programming Initiative More Years Better Lives (project ‘Unequal ageing: life-expectancy, care needs and reforms to the welfare state’, grant reference ES/W001594/1) and the ESRC Centre for the Microeconomic Analysis of Public Policy (ES/Z504634/1). I have benefited from the advice and comments of the members of the Retirement Saving Consortium, Jonathan Cribb, Carl Emmerson and Laurence O’Brien.
Endnotes
Authors

Heidi Karjalainen
Heidi is a Senior Research Economist in the Retirement, Saving & Ageing sector. Her current research is on pensions and saving for retirement.
More from IFS
Understand this issue


Policy analysis


Academic research


