
Downloads
Download the report as a PDF
PDF | 942.71 KB
Executive summary
Key findings
- Employment for 55- to 64-year-olds is lower in the UK than in many other Northern European countries and rose more slowly than in many comparable countries during the 2010s. Between 2012 and 2022, employment in this age group increased by 7 percentage points in the UK, compared with an average rise of 11 percentage points across the OECD. Official statistics show employment to be lower than in many comparably high-income countries, such as the Netherlands, Germany and Denmark.
- Health is an important constraint on labour force participation, particularly among people with lower levels of wealth. 18% of men and 22% of women in the poorest third of the wealth distribution reported being out of the labour market due to permanent sickness or disability in 2023–24, compared with less than 5% for people with middle or high levels of wealth.
- Overall, health among men in their late 50s and early 60s has improved modestly over the past two decades, while health among women has remained broadly stable, though with a small rise in the number of women reporting a significant number of conditions. In 2002–03, the shares of men and women of these ages reporting six or more health problems out of a set of twelve were equal, at 7%. In contrast, by 2023–24, 3% of men and 11% of women reported six or more health problems.
- Mobility problems have declined in prevalence, but the prevalence of mental health problems has risen slightly over time. Between 2002–03 and 2023–24, the share of 55- to 64-year-olds experiencing at least one mobility problem fell by 10 percentage points among men and 7 percentage points among women. Since mobility problems are more common for women at these ages, the proportional decline was half that for men, at 16% compared with 32%. The share of men experiencing depressive symptoms over this period has been broadly stable, ranging between 10% and 13%. Among women, there was stability through the 2000s and much of the 2010s, but there has been a more recent rise in prevalence, increasing from around 15% in the mid 2010s to 21% in 2023–24.
- Older adults in lower-wealth households remain significantly more likely to report poor health. In 2023–24, 54% of women aged 55–64 in the lowest third of the wealth distribution reported at least one mobility problem, compared with just 20% in the wealthiest third. Among men, the corresponding figures were 35% and 10%, respectively. In 2023–24, 22% of the poorest third of men aged 55–64 reported depressive symptoms, compared with just 5% in the highest-wealth third; there was a similarly large disparity among women.
- Disparities in health by wealth have widened over time for women, but the same is not true for men. There has been a marked rise in the prevalence of depressive symptoms among the poorest third of women, from around 30% in the mid 2010s to 39% in 2023–24. This rise has been smaller among the wealthiest third of women, widening absolute (although not relative) gaps in the prevalence of depressive symptoms. Over the longer run, between 2002–03 and 2023–24, there was a 13 percentage point fall in the share of the richest third of women experiencing mobility problems, while the poorest third saw a small rise in mobility problems over the same period.
1. Introduction
Patterns of employment for people in their 50s and 60s in the UK have changed substantially in recent decades. Between the mid 1990s and the COVID-19 pandemic, employment rates for both men and women in their late 50s and early 60s rose substantially (Cribb, 2023). Since the pandemic, there has been considerable debate over how rates of employment and economic inactivity have changed (e.g. Boileau and Cribb, 2022a and 2022b; House of Lords Economic Affairs Committee, 2022; Corlett and Slaughter, 2024). According to headline Labour Force Survey (LFS) data, employment among 50- to 64-year-olds peaked at 72.8% in the last quarter of 2019; the latest estimate for the same age group is 71.7% (in July–September 2025). While concerns about the quality of the LFS make it difficult to be confident about post-pandemic trends, there is no doubt that this is an age group among which employment has been substantially changing over a longer period.1 Rising life expectancy and an ageing population make it vitally important to understand drivers of employment at these ages, as longer working lives have often been raised as a solution to adjusting to the costs of an ageing population.
The UK has not been unique in seeing significant changes to the employment rates of 55- to 64-year-olds over time. Indeed, over the last decade or so, rises in employment in the UK at these ages have been relatively modest in international comparison. Figure 1 shows how employment rates for 55- to 64-year-olds have changed between 2012 and 2022 in a set of OECD countries. In the UK, employment rose by 7 percentage points over this period, from 57% to 64%; the average increase over this period across all OECD countries was 11 percentage points. Several countries – Ireland, Belgium, the Netherlands and Denmark – saw particularly large rises in employment of more than 15 percentage points. Increases were smaller in the US, as well as in those countries with the highest employment rates in 2012 (Switzerland, Sweden and New Zealand). Although there is uncertainty over the precise level of labour market participation (the OECD data are based on the – troubled – LFS data in the UK), employment rates of people at these ages appear to be lower in the UK than in many – but not all – comparably high-income countries, especially those in Northern Europe.2
Figure 1. Percentage of 55- to 64-year-olds in employment, 2012 and 2022, across selected OECD countries

Source: Older Workers’ Scoreboard, OECD (https://www.oecd.org/en/data/datasets/oecd-dashboard-on-older-workers.html).
As Latimer (2024) shows, the UK’s relatively low employment rate among 55- to 64-year-olds suggests that there is particular potential for increasing employment in the UK within this age group. Understanding the factors influencing the labour market participation of those in their 50s and 60s is therefore critical. Employment falls substantially at these ages. As shown in Figure 2, employment rates fall from 87% for men and 79% for women at age 50, to 68% and 59% respectively at age 60, and to 20% and 15% respectively at age 69.
Figure 2. Employment rates of men and women in their 50s and 60s, by age, 2023–24

Source: Authors’ calculations using the Labour Force Survey, 2023 and 2024.
Health and disability are key predictors of labour market activity, and worsening health at older ages can have important effects on individuals’ ability to work (Blundell et al., 2021). The recent Mayfield review of health-related economic inactivity stressed the importance of health conditions – particularly musculoskeletal issues – leading older workers to withdraw from the workforce (Mayfield, 2025). Understanding the health constraints people can face in their 50s and 60s is therefore of key concern. In this report, we seek to understand trends in health in the run-up to state pension age, to understand how much of a constraint health may play in terms of increasing labour force participation.
To examine these trends in health, we make use of newly released data from the English Longitudinal Study of Ageing (ELSA), a rich longitudinal dataset tracking individuals aged 50 and over in England. We draw on 11 waves of data, spanning 2002–03 to 2023–24. ELSA is expressly designed to capture the health, economic and social circumstances of older people. It therefore includes detailed information on wealth, income, health conditions, work history and family structure.
Throughout this report, we examine three splits of interest. The first is that – while we present some aggregated measures of health – we generally examine physical health separately from mental health. Second, we consider men and women separately. Understanding differences by sex is particularly important when considering the interactions of health and employment over this period, since women have seen large increases in their state pension age since 2010, pushing up employment (Coile et al., 2025). Third, we consider how trends differ across the wealth distribution. As Figures 3 and 4 show, this is because wealth is a key predictor of employment patterns at this age.
Figure 3. Employment rate of 55- to 64-year-olds in England, 2023–24, by sex and third of the wealth distribution

Source: Authors’ calculations using the English Longitudinal Study of Ageing, 2023–24.
Figure 4. Percentage of 55- to 64-year-olds in England who are economically inactive due to permanent sickness or disability, 2023–24, by sex and third of the wealth distribution

Source: Authors’ calculations using the English Longitudinal Study of Ageing, 2023–24.
Figure 3 shows that both men and women in the middle of the wealth distribution are more likely than those richer or poorer than them to be in paid work at ages 55–64. This has been consistently true over the last 20 years (though to slightly different degrees) even as employment rates have risen (see Appendix Figure D1). However, the reasons that richer and poorer people are out of paid work at these ages differ importantly. Those with higher wealth are more likely to have voluntarily retired before state pension age, often relying on having built up significant private pension wealth (Cribb, 2023). Those with lower wealth are more likely to be out of the labour market as a result of permanent sickness or disability. Figure 4 shows that 18% of men and 22% of women in the poorest third of the wealth distribution report being economically inactive for this reason, compared with less than 5% for people with middle or high wealth.
The importance of permanent sickness or disability prompts us to focus on underlying health levels and trends in the older working-age population, and the differences Figure 4 shows between wealthier and poorer groups prompt our focus on interactions with wealth throughout.
The structure of this report is as follows. Section 2 investigates how health in the run-up to state pension age has changed over the last two decades, its relationship with wealth and how these trends interact with employment patterns. Section 3 provides a short conclusion and discussion. In addition, four appendices provide details about some of the uncertainty regarding changes in employment at older ages since the COVID-19 pandemic, an examination of which types of older workers left the labour market during the pandemic, and some additional details on the data and main results.
2. Changes in health in people’s late 50s and early 60s
As highlighted in the introduction, health problems play an important role in explaining labour market non-participation in the run-up to state pension age, particularly amongst poorer people. To understand the importance of health concerns in constraining employment amongst older working-age people, in this section we examine changes over the last 20 years in the prevalence of health conditions among 55- to 64-year-olds in England.3 We split trends observed by sex and wealth, and relate these changes to employment status.4
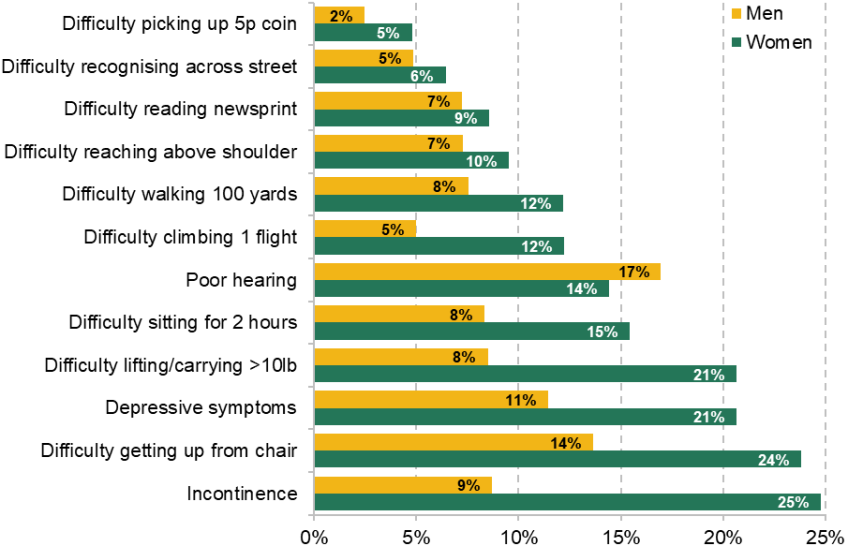
There is no single measure of health that can capture the variety of health concerns that people may experience. Faced with this issue, to explore health problems amongst people in their late 50s and early 60s, we use an index of health and disability, similar to the index used by Banks, Blundell and Emmerson (2015). This index was designed to include those conditions covered by the ELSA data and also assessed as part of the ‘work capability assessment’, the test used by the Department for Work and Pensions to test capacity to work. The index covers 12 self-reported indicators of physical and mental health problems, including mobility limitations, vision problems, incontinence and symptoms of depression. Appendix C contains a detailed description of the conditions covered by this index and they are also set out in Figure 5, which shows the share of 55- to 64-year-old men and women who report experiencing one of these health conditions.
Figure 5. Percentage of 55- to 64-year-olds experiencing each of the 12 conditions included in the health index used, 2023–24
Source: Authors’ calculations using the English Longitudinal Study of Ageing, 2023–24.
There is considerable variation here in the extent to which people experience different health concerns. The share of women experiencing each condition ranges from 5% (for having difficulty picking a 5p coin up from the table) to 25% (having experienced urinary incontinence in the last year). For men, having difficulty picking up a 5p coin is similarly the least common concern but, in contrast to women, having poor hearing is the most common condition (and the only one of these problems experienced by a higher share of men than women). The strong differences between men and women in terms of the pattern and prevalence of these conditions are one reason we separate our analysis in this section by sex.
We use our 12-condition index to classify individuals into four categories, in line with Banks, Blundell and Emmerson (2015): those with essentially ‘no’ health conditions (reporting 0–1 conditions), those with ‘mild’ conditions (2–3 conditions), those with ‘moderate’ conditions (4–5 conditions) and those with ‘severe’ conditions (6+ conditions). This approach enables us to distinguish broad differences in health status.
Using this approach, we find that trends in health look very different for men and women over the last 20 years. Among 55- to 64-year-old men, health has improved modestly on average, as shown in the first panel of Figure 6. The share reporting at most one of the twelve health problems increased from 71% to 79% between 2002–03 and 2023–24, while the share reporting ‘severe’ (6+) health problems more than halved from 7% to 3%.
Figure 6. Percentage of 55- to 64-year-olds with ‘mild’, ‘moderate’ and ‘severe’ levels of health problems, by sex, 2002–03 to 2023–24
Men

Women

Note: ‘Mild’, ‘moderate’ and ‘severe’ health problems are as defined in the text.
Source: Authors’ calculations using the English Longitudinal Study of Ageing, 2002–03 to 2023–24.
The trend among women, however, is more mixed, as shown in the second panel. The share with essentially no health problems initially rose between 2002–03 and 2010–11, before stabilising and then falling post-pandemic. There has also been a gradual rise in the share of women with ‘severe’ levels of health problems since around 2010–11, suggesting a growing concentration of health difficulties. The difference over time between men and women with ‘severe’ health problems is particularly notable. In 2002–03, 7% of 55- to 64-year-old women and 7% of 55- to 64-year-old men had ‘severe’ health problems. In 2023–24, the shares were 11% of women and 3% of men.
To dig into more detail on this issue, we can break down this measure of health to consider more specific health problems reported. Given that musculoskeletal and mental health conditions are the most common reasons for receiving disability benefits (Karjalainen, 2025) and that disability benefit receipt for these reasons has seen some of the largest increases (Latimer, Pflanz and Waters, 2024), Figure 7 shows the trends in the share experiencing any mobility problems (out of the seven listed in Appendix C) and in the share experiencing depressive symptoms.
Figure 7. Percentage of 55- to 64-year-olds experiencing any mobility problems or depressive symptoms, by sex, 2002–03 to 2023–24
Mobility problems

Depressive symptoms

Note: Mobility problems and depressive symptoms are as defined in the text.
Source: Authors’ calculations using the English Longitudinal Study of Ageing, 2002–03 to 2023–24.
In 2023–24, amongst 55- to 64-year-olds, around a fifth of men and a third of women experienced at least one mobility problem. There has been a decline among both men and women in the prevalence of mobility problems over time. Between 2002–03 and 2023–24, the share experiencing any mobility problem fell by 10 percentage points among men and 7 percentage points among women.
The patterns for mental health are different: the share of men experiencing depressive symptoms has remained broadly stable over our data period, fluctuating between 10% and 13%. Among women, the share experiencing depressive symptoms was relatively stable through the 2000s and much of the 2010s, at around 16%, before rising from the mid 2010s to reach 21% in 2023–24. This rise is consistent with wider evidence of worsening mental health for adults in the UK (Latimer, Ray-Chaudhuri and Waters, 2025), although the fact we only see it for women is notable.
Difference in health trends by wealth
There is a strong association between health, as measured by our index, and labour market participation. Individuals with ‘severe’ health problems are markedly less likely to be in paid work and are more likely to report being economically inactive for reasons other than retirement, such as long-term sickness.
It is natural to ask how health has been changing for people who are, and are not, in paid work in the run-up to state pension age. However, descriptive evidence on changes in health for those in and out of work can be hard to interpret, for two reasons. First, health and employment at these ages are likely to affect each other – with poorer health impacting the probability of employment, and employment itself causally affecting at least some measures of health (Banks et al., 2025). Second, there have been significant long-run increases in employment, as shown in Appendix Figure D1.
Instead, we can look at changes in health by wealth. Wealth at our ages of interest is a good measure of socio-economic status that reflects income accumulated over a long working life and is not (unlike weekly or monthly income) dramatically affected by recent changes in employment status. Using a measure of family non-pension wealth, we divide 55- to 64-year-olds into wealth thirds and compare levels and trends in health outcomes. Clear socio-economic gradients are evident in Figure 8. In 2023–24, 54% of women aged 55–64 in the lowest third of the wealth distribution reported at least one mobility problem, compared with just 20% in the highest third of the distribution. Among men, the corresponding figures were 35% and 10%, respectively. These differences are substantial and suggest that poorer individuals are far more likely to experience physical limitations in later working life.
Figure 8. Percentage of 55- to 64-year-olds experiencing at least one mobility problem, by wealth third and sex, 2002–03 to 2023–24
Men

Women

Note: Mobility problems are as defined in the text. Wealth thirds are defined using benefit-unit wealth, within five-year age group, wave and sex.
Source: Authors’ calculations using the English Longitudinal Study of Ageing, 2002–03 to 2023–24.
Trends in mobility problems may also differ across the wealth distribution. For men, trends look relatively similar across the distribution, with falls in the share with mobility problems over time across each third of the distribution. Among the richest third of men, the share experiencing mobility problems fell by 10 percentage points between 2002–03 and 2023–24, compared with a fall of 13 percentage points among the poorest third of men. For women, there is much more of a difference in trends across the wealth distribution: while the richest third experienced a 13 percentage point fall, the poorest third saw a small rise in mobility problems over the same period. These patterns indicate that for women gains in physical health have been concentrated among higher-wealth groups, with much less improvement – indeed, a slight deterioration – among the poorest.
Mental health outcomes in later working life also vary substantially by wealth, as illustrated in Figure 9. In 2023–24, 22% of the poorest third of men aged 55–64 reported depressive symptoms, compared with just 5% in the highest third of the wealth distribution. A similarly large disparity is evident among women. These differences in prevalence mirror those observed for physical health, and underscore the close link between socio-economic status and health more broadly.
Figure 9. Percentage of 55- to 64-year-olds experiencing depressive symptoms, by wealth third and sex, 2002–03 to 2023–24
Men

Women

Note: Mobility problems are as defined in the text. Wealth thirds are defined using benefit-unit wealth, within five-year age group, wave and sex.
Source: Authors’ calculations using the English Longitudinal Study of Ageing, 2002–03 to 2023–24.
Trends over time further highlight this. Among men, the prevalence of depressive problems remained broadly stable across each third of the wealth distribution between 2002–03 and 2023–24. In contrast, there has been a marked rise in the prevalence of depressive symptoms among the poorest third of women, rising from around 30% in the mid 2010s to 39% in 2023–24. Although relatively small sample sizes make it hard to be certain, Appendix Figure D2 presents analysis that indicates that the deterioration in mental health for women in the run-up to state pension age has also been concentrated amongst single women.
For both mobility and depressive problems, then, we have seen a growing disparity in health by wealth among women over time. A falling share of richer women are experiencing mobility problems over time, in contrast to poorer women, among whom the share experiencing mobility problems has been stable. The share of poorer women experiencing depressive symptoms is rising by more than the share of richer women in absolute terms, widening absolute – although not relative – disparities by wealth. Men are not seeing these same widening disparities, with trends in health looking much more similar across wealth thirds.
Although compositional differences complicate interpretation of changes in health by employment status over time, we can think about how the high prevalence – and increase – in depressive symptoms among women might affect employment. Figure 10 shows that the rise in depressive symptoms, as well as being concentrated among the poorest third of women, has been concentrated among those not in paid work. These symptoms are also far more common among those 55- to 64-year-olds who are out of work. If the worsening of mental health among the poorest third of women, who are disproportionately likely to be out of paid work, continues, it may prove to be an important headwind to a government looking to boost employment rates in coming years.
Figure 10. Percentage of 55- to 64-year-old women experiencing depressive symptoms, by whether in paid work, 2002–03 to 2023–24

Source: Authors’ calculations using the English Longitudinal Study of Ageing, 2002–03 to 2023–24.
3. Conclusion
In this report, we have presented new evidence on trends in physical and mental health in the run-up to state pension age, using new data (and the long back series) from the English Longitudinal Study of Ageing, and we have considered how these trends in health might affect employment. Over this period (2002–03 to 2023–24), mobility has been improving among those aged 55–64 on average, while the prevalence of depressive symptoms has slightly risen, particularly among women.
As shown, inequalities in health both by sex and by wealth seem to have been widening over this period. Overall, health among men in their late 50s and early 60s has improved modestly over the past two decades, while health among women has remained broadly stable, with an increasing prevalence of having many conditions (which we term having ‘severe’ conditions). The inequality in health trends by sex is notable – since the early 2000s, the share of men in their late 50s and early 60s with ‘severe’ health conditions has more than halved, from 7% to 3%. Meanwhile, the share of women with ‘severe’ conditions has increased from 7% to 11%.
Those in lower-wealth households are significantly more likely to be in poor health, and among women – although not among men – disparities in the share experiencing mobility and depressive problems by wealth have widened over time. In particular, there has been a significant rise in the prevalence of depressive symptoms among the poorest third of women, from around 30% in the mid 2010s to 39% in 2023–24.
Health is an important constraint on labour force participation, which has changed substantially among those in their 50s and 60s in recent decades. Increasing employment rates is one aim of the government, and employment among older working-age people looks low in international comparison, especially compared with other nations in Northern Europe. However, the trends we have documented – in particular, that of worsening mental health especially for lower-wealth women – are likely to be an important headwind for a government looking to boost employment rates. Policy aiming to boost employment at these ages should take account of the widening inequalities in health over time.
Appendix A. Data quality and employment rates in the Labour Force Survey
Data from the Labour Force Survey (LFS) imply that, at the beginning of the COVID-19 pandemic, there was a fall in employment among those in their 50s and 60s, accompanied by a rise in economic inactivity (Boileau and Cribb, 2022a). This break from the trend of rising employment rates from the mid 1990s would be notable, and very different from the experience of many other countries (see Figure 1 of the main text) where impacts of the pandemic on older workers’ labour market participation appear to have been more muted.
The LFS is the primary source of official UK statistics on employment, unemployment and inactivity. However, the quality of the LFS has deteriorated substantially since the onset of the COVID-19 pandemic, raising serious questions about the reliability of recent estimates and about the weight that should be put on this story of increasing economic inactivity since the pandemic. The long-term decline in response rates to the survey accelerated from 2020 onwards. As shown in Figure A1, the response rate to the LFS fell from 36% in 2020Q1 to just 13% in 2023Q3. In October 2023, the Office for National Statistics (ONS) suspended publication of key labour market estimates derived from the LFS due to concerns over representativeness.
Figure A1. Response rates to the Labour Force Survey, 2006–25

Source: Authors’ calculations using Office for National Statistics (2017 and 2025).
Estimates based on the LFS began to be published again in February 2024, with new population weights and additional investment aimed at improving response rates. There has since been a partial recovery in response rates: by 2025Q2, the response rate had increased to around 20%, as shown in Figure A1. Nevertheless, concerns persist. In November 2023, the Office for Statistics Regulation removed the LFS’s ‘National Statistics’ designation, citing issues with data quality and representativeness (Office for Statistics Regulation, 2024). That status had not been reinstated as of late 2025.
Alternative data sources cast doubt on the narrative of a sharp rise in inactivity among older people during the pandemic. For example, Pay As You Earn (PAYE) Real Time Information (RTI) data – an administrative source covering those in paid employment – suggest that employment among individuals aged 50–64 continued to rise after a short-lived dip in early 2020, as shown in Figure A2.
Figure A2. Estimated employment rate in the Labour Force Survey (LFS) and implied by Pay As You Earn (PAYE) Real Time Information, among 50- to 64-year-olds, compared with 2019Q4

Source: Authors’ calculations using Pay As You Earn tables as of 11 November 2025 (https://www.ons.gov.uk/employmentandlabourmarket/peopleinwork/earningsandworkinghours/datasets/realtimeinformationstatisticsreferencetableseasonallyadjusted), UK population estimates (https://www.ons.gov.uk/peoplepopulationandcommunity/populationandmigration/populationestimates/datasets/populationestimatesforukenglandandwalesscotlandandnorthernireland) and Labour Force Survey.
Similarly, data from the English Longitudinal Study of Ageing (ELSA) imply that employment rates among 55- to 64-year-olds remained stable or even increased during the pandemic period, as shown in Figure A3. These patterns stand in contrast to those from the LFS, which implies a marked reversal in employment trends among this group. The Resolution Foundation has created an alternative time series for the employment rate, based on PAYE RTI data, self-employment data and the latest population estimates (Corlett, 2024). This implies that the employment rate is being substantially underestimated overall, and that the ‘true’ inactivity rate is lower than thought.
Figure A3. Employment rate for 55- to 64-year-olds, by sex, 2002–03 to 2023–24

Source: Authors’ calculations using the English Longitudinal Study of Ageing, 2002–03 to 2023–24.
Appendix B. Movements into economic inactivity during the pandemic
In this appendix, we explore predictors of leaving employment in the run-up to state pension age during the COVID-19 pandemic. We focus on those aged 50–61 who were in paid work at the time of the 2018–19 wave (wave 9) of the English Longitudinal Study of Ageing (ELSA), and who were subsequently also observed in the 2021–23 wave (wave 10). We estimate two multivariate regressions using ordinary least squares (OLS): the first with the dependent variable being an indicator for whether the individual retired by 2021–23; and the second with the dependent variable being an indicator for whether they became economically inactive for another reason (e.g. long-term sickness or caring responsibilities).
Our regression specifications include a range of demographic and socio-economic characteristics as predictors of these labour market transitions. Specifically, we control for age, sex, highest educational qualification (grouped into two categories) and broad region of residence (North, Midlands, South). We also include indicators for occupational type (grouped into three categories), take-home pay and non-pension wealth (each split into thirds of the distribution). To capture health status, we include binary indicators for experiencing mobility difficulties and depressive symptoms. Finally, we include indicators for pension wealth, distinguishing between those with defined contribution (DC) and defined benefit (DB) pension wealth.
To investigate the role of pandemic-era experiences, we use a subsample of respondents who also participated in two online ELSA COVID-19 surveys, conducted in Summer 2020 and Winter 2020. This allows us to incorporate additional variables capturing experiences during the pandemic, such as receipt of furlough, health experiences or changes in employment status.
The results reveal distinct patterns for different types of employment exit. Poor mental health is associated with a higher probability of becoming inactive for reasons other than retirement, but is not strongly linked to transitions into retirement itself. We find no clear relationship between DC pension wealth and the probability of leaving work, either to retire or to become otherwise inactive. Nor is there strong evidence that being furloughed during the pandemic increased the likelihood of retirement or other inactivity by 2021–23. These findings suggest that exits from work during the pandemic were often associated with poorer health, rather than financial readiness to retire.
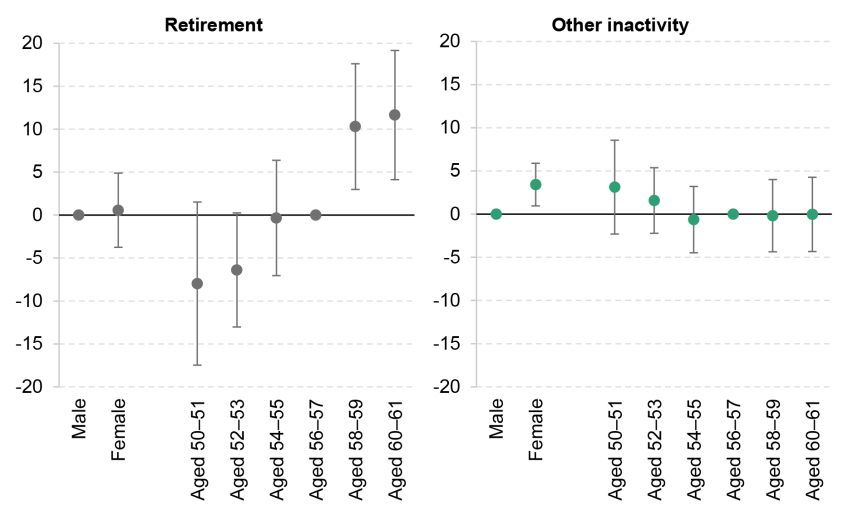
Figure B1 shows estimated percentage point associations between individual characteristics and the probability of moving into (a) retirement or (b) other sorts of economic inactivity between 2018–19 and 2021–23, holding the other factors controlled for in the regression constant. As shown, these relationships differ notably comparing the probabilities of retiring and of moving into other inactivity. Being female is not associated with a higher probability of retiring but is associated with a 3 percentage point higher probability of entering other inactivity during the pandemic, other things equal. Age is strongly associated with the probability of retiring, as we would expect; older people are much more likely to move into retirement during the pandemic. In contrast, there is essentially no relationship between age and the likelihood of moving into other sorts of inactivity.
Figure B1. Percentage point associations between selected characteristics and the probability of those in work (a) retiring or (b) moving into other inactivity during the COVID-19 pandemic
Sex and age
Wealth and take-home pay

Health problems and type of pension wealth

DC = defined contribution. DB = defined benefit.
Note: Sample is constructed and dependent variables are included as explained in the text. Transitions are those between 2018–19 and 2021–23.
Source: Authors’ calculations using the English Longitudinal Study of Ageing, waves 9 and 10.
These relationships are very similar to those observed in pre-pandemic data (transitions between wave 7 (2014–15) and wave 9 (2018–19) of ELSA).5 In the pre-pandemic period, being female was associated with a statistically significant higher probability of retiring, and not with a higher probability of entering other forms of inactivity, but the differences between the pre-pandemic and pandemic relationships are not statistically significant.
We also see different patterns when thinking about the association between wealth and take-home pay with the probability of moving into economic inactivity. Those who have higher levels of wealth are much more likely to have retired during the pandemic: those in the highest third of the wealth distribution, all else equal, are 7 percentage points more likely to have retired than those in the middle third of the wealth distribution. Those in the lowest third of the wealth distribution are 8 percentage points less likely to have retired. In contrast, for movements out of work into other forms of economic inactivity, the relationship is both less strong and in the opposite direction, with indicative evidence (although not statistically significant) that those who have higher wealth are less likely to have moved into other inactivity during the pandemic.
This is consistent with pre-pandemic evidence about the characteristics of retirees and those inactive for other (health-related) reasons: Cribb (2023) shows that retirement before the state pension age is concentrated among the wealthiest, while those who are less wealthy are more likely to be out of work for health-related reasons, as shown in Figure 4 of the main text.
There are less strong relationships between take-home pay and movements out of work into retirement or other forms of inactivity. However, there is some indication that those who are in the lowest third of the take-home pay distribution are more likely to have moved into economic inactivity during the pandemic. Again, these are similar relationships to the pre-pandemic relationships, with no statistically significant differences.
Figure B1 also shows that the relationship between experiencing health problems (mobility problems and depressive symptoms, in particular) and the probability of retirement is not strong, but there are signs that experiencing a health problem is associated with a lower probability of retiring. In contrast, experiencing depressive symptoms is, all else equal, associated with a higher probability of moving into other sorts of inactivity during the pandemic, of around 5 percentage points. The relationship between mobility problems and the probability of moving into other forms of inactivity is not statistically significant, although the sign of the effect is positive.
Finally, having defined contribution pension wealth (a pension pot that does not guarantee a lifetime income through retirement) is not statistically significantly associated with moving either into retirement or into other inactivity, although the sign of the effect is negative in both cases. This is in contrast to some of the hypotheses set out in the early stages of the debate about changes in economic activity during the pandemic, which sometimes highlighted the relative flexibility of the UK’s DC pensions system, arguing that people could have drawn on their DC pensions in order to afford to retire earlier than the state pension age (House of Lords Economic Affairs Committee, 2022). Having defined benefit pension wealth has a slightly negative, although statistically insignificant, association with moving into other inactivity; it is positively associated with retiring, though.
Figure B2 shows percentage point associations between experiences people had during the COVID-19 pandemic and the probability that they (a) retire or (b) move into other inactivity. The figure shows that those a little or moderately worried about job security in June–July 2020 are less likely to have retired than those not worried and that those with a hospital appointment cancelled are slightly more likely to have moved into other inactivity than those without a hospital appointment cancelled. It does not find any statistically significant relationship between being furloughed and moving into retirement or other forms of economic inactivity.
Figure B2. Percentage point association between COVID-related experiences and the probability of those in work (a) retiring or (b) moving into other inactivity
Retirement

Other inactivity

* Being retired in Summer 2020 is associated with a 47.7 percentage point higher probability of retiring between 2018–19 and 2021–23.
Note: Sample is constructed and dependent variables are included as explained in the text. Transitions are those between 2018–19 and 2021–23.
Source: Authors’ calculations using the English Longitudinal Study of Ageing, waves 9 and 10.
Appendix C. Components of health index
Mobility problems: seven components
Difficulty sitting for two hours
Difficulty getting up from chair after sitting
Difficulty walking 100 yards
Difficulty climbing one flight of stairs without resting
Difficulty picking up 5p coin from table
Difficulty reaching/extending arms above shoulder level
Difficulty lifting or carrying weights over 10 pounds
Mental health problems: one component
At least four out of eight on the CES-D scale:
Eight questions measuring depressive symptoms an individual has expressed ‘much of the time’ in the last week. The symptoms are: felt depressed; felt everything was an effort; sleep was restless; was not happy; felt lonely; did not enjoy life; felt sad; could not get going.
Eyesight problems: two components
Problems reading close print
Problems recognising friend across street
Other: two components
Hearing fair or poor
Urinary incontinence in last 12 months
Appendix D. Supplementary figures
Figure D1. Employment rate for 55- to 64-year-olds, by wealth third and sex, 2002–03 to 2023–24
Men

Women

Source: Authors’ calculations using the English Longitudinal Study of Ageing, 2002–03 to 2023–24.
Figure D2. Percentage of 55- to 64-year-olds experiencing any mobility problems or depressive symptoms, by sex and partnership status, 2002–03 to 2023–24
Any mobility problems

Depressive symptoms

Source: Authors’ calculations using the English Longitudinal Study of Ageing, 2002–03 to 2023–24.
References
Banks, J., Blundell, R. and Emmerson, C., 2015. Disability benefit receipt and reform: reconciling trends in the United Kingdom. Journal of Economic Perspectives, 29(2), 173–90, https://www.jstor.org/stable/24292128.
Banks, J., Cribb, J., Emmerson, C. and Sturrock, D., 2025. The impact of work on cognition and physical disability: evidence from English women. Labour Economics, 94, 102730, https://doi.org/10.1016/j.labeco.2025.102730.
Blundell, R., Britton, J., Costa Dias, M. and French, E., 2021. The impact of health on labor supply near retirement. Journal of Human Resources, 58(1), 282–334, https://doi.org/10.3368/jhr.58.3.1217-9240R4.
Boileau, B. and Cribb, J., 2022a. The rise in economic inactivity among people in their 50s and 60s. Institute for Fiscal Studies, report, https://ifs.org.uk/publications/rise-economic-inactivity-among-people-their-50s-and-60s.
Boileau, B. and Cribb, J., 2022b. Is worsening health leading to more older workers quitting work, driving up rates of economic inactivity? Institute for Fiscal Studies, comment, https://ifs.org.uk/articles/worsening-health-leading-more-older-workers-quitting-work-driving-rates-economic.
Börsch-Supan, A. and Coile, C., 2023. The effects of reforms on retirement behavior: introduction and summary. NBER, Working Paper 31979, https://doi.org/10.3386/w31979.
Coile, C., Cribb, J., Emmerson, C. and O’Brien, L., 2025. Why does raising the early retirement age affect employment? Evidence from the UK. Institute for Fiscal Studies, Working Paper 25/01, https://ifs.org.uk/publications/why-does-raising-early-retirement-age-affect-employment.
Corlett, A., 2024. Get Britain’s stats working: exploring alternatives to Labour Force Survey estimates. Resolution Foundation, https://www.resolutionfoundation.org/publications/get-britains-stats-working/.
Corlett, A. and Slaughter, H., 2024. Measuring up? Exploring data discrepancies in the Labour Force Survey. Resolution Foundation, https://www.resolutionfoundation.org/publications/measuring-up/.
Cribb, J., 2023. Understanding retirement in the UK. Institute for Fiscal Studies, report, https://ifs.org.uk/publications/understanding-retirement-uk.
House of Lords Economic Affairs Committee, 2022. Where have all the workers gone? Second Report of the Session 2022–23, https://committees.parliament.uk/committee/175/economic-affairs-committee/news/175197/early-retirement-and-our-ageing-population-are-causing-labour-shortages-says-lords-report/.
Karjalainen, H., 2025. Rise in health conditions and disability benefits. Institute for Fiscal Studies, https://ifs.org.uk/sites/default/files/2025-03/Rise_in_health_conditions_and_disability_benefits_HK.pdf.
Latimer, E., 2024. The government’s 80% employment rate target: lessons from history and abroad. Institute for Fiscal Studies, comment, https://ifs.org.uk/articles/governments-80-employment-rate-target-lessons-history-and-abroad.
Latimer, E., Pflanz, F. and Waters, T., 2024. Health-related benefit claims post-pandemic: UK trends and global context. Institute for Fiscal Studies, report, https://ifs.org.uk/publications/health-related-benefit-claims-post-pandemic-uk-trends-and-global-context.
Latimer, E., Ray-Chaudhuri, S. and Waters, T., 2025. The role of changing health in rising health-related benefit claims. Institute for Fiscal Studies, report, https://ifs.org.uk/publications/role-changing-health-rising-health-related-benefit-claims.
Mayfield, C., 2025. Keep Britain working: final report. https://assets.publishing.service.gov.uk/media/6909fac488a98da87e292282/keep-britain-working-review-final-report.pdf.
Office for National Statistics, 2017. Labour Force Survey performance and quality report: Oct to Dec 2016. https://www.ons.gov.uk/employmentandlabourmarket/peopleinwork/employmentandemployeetypes/methodologies/labourforcesurveyperformanceandqualityreportocttodec2016.
Office for National Statistics, 2025. Labour Force Survey performance and quality monitoring report: April to June 2025. https://www.ons.gov.uk/employmentandlabourmarket/peopleinwork/employmentandemployeetypes/methodologies/labourforcesurveyperformanceandqualitymonitoringreportapriltojune2025.
Office for Statistics Regulation, 2024. Quality under challenge: regulating statistics and data from the Labour Force Survey. https://osr.statisticsauthority.gov.uk/blog/quality-under-challenge-regulating-statistics-and-data-from-the-labour-force-survey/.
Data
Banks, J., Batty, G. David, Breedvelt, J., Coughlin, K., Crawford, R., Marmot, M., Nazroo, J., Oldfield, Z., Steel, N., Steptoe, A., Wood, M., Zaninotto, P. (2025). English Longitudinal Study of Ageing: Waves 0-11, 1998-2024. [data collection]. 47th Edition. UK Data Service. SN: 5050, DOI: http://doi.org/10.5255/UKDA-SN-5050-34.
Office for National Statistics. (2024). Labour Force Survey. [data series]. 11th Release. UK Data Service. SN: 2000026, DOI: http://doi.org/10.5255/UKDA-Series-2000026.
Acknowledgements
Funding for this research was provided by the IFS Retirement Saving Consortium: Aegon; Age UK; Association of British Insurers; Association of Consulting Actuaries; Aviva; Department for Work and Pensions; Franklin Templeton; Institute and Faculty of Actuaries; The Investment Association; Joseph Rowntree Foundation; Lane, Clark and Peacock; Money and Pensions Service; Nucleus; Pensions UK; People’s Partnership; Royal London; and Standard Life.
We also gratefully acknowledge the support of the ESRC Centre for the Microeconomic Analysis of Public Policy (ES/Z504634/1). Throughout the project we have benefited from the advice and comments of the members of the Retirement Saving Consortium and Carl Emmerson.
Endnotes
Authors

Bee Boileau
Bee joined the IFS in 2021 as a Research Economist and works in the Retirement, Saving and Ageing sector.

Jonathan Cribb
Jonathan joined IFS in 2011. His research areas includes: pensions, ageing and demographic change, public sector pay, housing, and inequalities.
More from IFS
Understand this issue


Policy analysis


Academic research


