
Downloads
Since the COVID-19 pandemic started, the UK has seen a rise in the rate of economic inactivity among older people. This is a reversal of earlier trends. In particular, the proportion of people aged over 50 who are economically inactive – neither in work nor actively searching for work – had fallen steadily in the decade prior to the pandemic. This change of employment patterns for older people comes despite very little change in ‘unemployment’ (people out of work and searching for a job) – which early in the pandemic was widely expected to reach very high levels. In July 2020, the Office for Budget Responsibility (2020) forecast unemployment of 10% in 2021. In fact, the unemployment rate (for people aged 16+) peaked at just over 5% in late 2020 and by the first quarter of 2022 had fallen back to its pre-pandemic level of just 3.7%.
In the face of these modest changes in unemployment, it is more surprising that there has been such a large fall in employment – and rise in economic inactivity – that has been concentrated amongst older people. The number of people in paid work in the first quarter of 2022 was 32.6 million, 500,000 lower than its pre-pandemic peak of 33.1 million in the three months to February 2020. As we show, this fall has been concentrated among 50- to 69-year-olds.
There are a range of potential reasons for the rise in economic inactivity. First, increases in economic inactivity could be driven by lower levels of labour demand – shown, for example, by higher levels of redundancies – and that older people respond by no longer looking for work rather than being officially ‘unemployed’. Second, rising economic inactivity could be driven by an increased number of people unable to work for health reasons, perhaps as a result of COVID or long COVID. Alternatively, people may want to avoid the potential exposure to COVID that comes through greater contact with other people in the workplace. Third, a trend towards remote work might have prompted some workers to take early retirement, if opportunities for socialisation are a factor keeping people in work at older ages, or if people who worked from home appreciated the extra time at home and did not want to return to the workplace. Fourth, people could have chosen to take early retirement, for a variety of reasons, including having increased their wealth during the pandemic, when consumption opportunities were minimal, and when asset prices (particularly housing) increased.
This report seeks to shed new light on the fall in employment and rise in economic inactivity amongst older people in the UK, with a particular focus on those in their 50s and 60s.
Key findings
- The rate of economic inactivity among people in their 50s and 60s has risen since the start of the pandemic. It rose from 35.4% in the first quarter of 2020 to 36.5% in the first quarter of 2022, an increase of 1.1 percentage points, back to the level seen at the end of 2018. This follows many years of falling inactivity prior to the pandemic; the inactivity rate for this group had been 42% in 2010. Falls in inactivity were always likely to slow because 2021 was the first year in a decade in which the state pension age was not rising, but the rises in inactivity had not been anticipated.
- The rise in economic inactivity has been larger for people in their 50s and 60s than for people younger or older than them. While those aged 70+ have also seen an increase in economic inactivity, it has been much smaller than for 50- to 69-year-olds, and 35- to 49-year-olds saw no change at all. With an increase of 270,000 economically inactive 50- to 69-year-olds when comparing October 2021 to March 2022 with the same period two years earlier, 43% of the overall rise in economic inactivity in the UK population since the pandemic began has been driven by changes among 50- to 69-year-olds.
- The fraction of 50- to 69-year-old workers moving from employment directly into retirement or other forms of economic inactivity increased substantially during the pandemic. This was the key driver of the rise in economic inactivity. It contributed two-thirds of the increase in inactivity over the last two years compared with pre-pandemic data. The remaining third of the increase in inactivity was due to fewer people leaving inactivity for employment, and more people moving from unemployment to economic inactivity, than pre-pandemic.
- More than half of the growth in 50- to 69-year-olds leaving work for economic inactivity seen during the pandemic was due to people reportedly leaving work because they were retiring. Retired people are less likely to return to work than people (of the same ages) in other forms of inactivity. Indeed, they are unlikely to ever return to employment – previous research has found that only 5–10% of retired people ever return to paid work.
- On some dimensions, the rise in economic inactivity has been very broad based. Strikingly, there has been relatively little difference in the trends of 50- to 69-year-olds leaving employment for inactivity between men and women, between those with and without degrees, between those in professional and non-professional occupations, and between public and private sector employees.
- However, there have been particularly large increases in the proportions of part-time workers, self-employed workers and workers in their 60s moving out of employment and into economic inactivity during the pandemic. These are all groups that are in some sense closer to retirement than full-time workers, employees, and those in their 50s. There have also been slightly larger increases in the rate of leaving paid work for economic inactivity amongst those working in occupations where it is relatively easy to work remotely than amongst those working in occupations where it is harder, or not possible, to work from home.
- Importantly, we do not find differences in the increase in rates of leaving employment for inactivity between those working in occupations that have seen particularly high, or relatively low, growth in vacancies over the last two years. This suggests that weak labour demand for particular occupations or skills is unlikely to be driving the increased rates of inactivity in this age group. It also suggests that higher inactivity for 50- to 69-year-olds is likely to be contributing at least partially to the labour market tightness seen in some areas.
- Redundancies and dismissals significantly contributed to increases in 50- to 69-year-olds moving from employment into inactivity in 2020, but much less so in 2021. Over a third (37%) of the increase in 50- to 69-year-olds leaving the labour force between pre-pandemic data (2017–19) and 2020 was driven by redundancies or dismissals. But as the economy recovered in 2021, these only made up 11% of the growth between 2017–19 and 2021. It appears that redundancies do not continue to play an important role in driving higher inactivity rates.
- Overall, it does not seem as if poor health is the primary driver of these increases in economic inactivity rates. The fraction of workers in their 50s and 60s moving from employment into being economically inactive due to ‘long-term sickness or disability’ has stayed relatively constant, with around 0.3–0.5% of 50- to 69-year-old workers per quarter making this transition both before and after the pandemic. Growth in health-related reasons for leaving the labour force only accounts for 5% of the overall growth in inactivity among this age group. And changes in transitions from employment to inactivity are similar between those with and without a long-standing health condition.
- Overall, the rise in economic inactivity among 50- to 69-year-olds does not look to be driven primarily either by poor health or by low labour demand leading to people being unable to find work and becoming discouraged. It looks more consistent with a lifestyle choice to retire in light of changed preferences or priorities, possibly in combination with changes in the nature of work post-pandemic (in particular more remote work) which reduce the appeal of staying in employment.
1. Introduction
Since the COVID-19 pandemic started, the UK has seen a rise in the rate of economic inactivity among older people. This is a reversal of earlier trends. In particular, the proportion of people aged over 50 who are economically inactive – neither in work nor actively searching for work – had fallen steadily in the decade prior to the pandemic. This change of employment patterns for older people comes despite very little change in ‘unemployment’ (people out of work and searching for a job) – which early in the pandemic was widely expected to reach very high levels. In July 2020, the Office for Budget Responsibility (2020) forecast unemployment of 10% in 2021. In fact, the unemployment rate (for people aged 16+) peaked at just over 5% in late 2020 and by the first quarter of 2022 had fallen back to its pre-pandemic level of just 3.7%.
In the face of these modest changes in unemployment, it is more surprising that there has been such a large fall in employment – and rise in economic inactivity – that has been concentrated amongst older people. The number of people in paid work in the first quarter of 2022 was 32.6 million, 500,000 lower than its pre-pandemic peak of 33.1 million in the three months to February 2020. As we show, this fall has been concentrated among 50- to 69-year-olds.
There are a range of potential reasons for the rise in economic inactivity. First, increases in economic inactivity could be driven by lower levels of labour demand – shown, for example, by higher levels of redundancies – and that older people respond by no longer looking for work rather than being officially ‘unemployed’. Second, rising economic inactivity could be driven by an increased number of people unable to work for health reasons, perhaps as a result of COVID or long COVID. Alternatively, people may want to avoid the potential exposure to COVID that comes through greater contact with other people in the workplace. Third, a trend towards remote work might have prompted some workers to take early retirement, if opportunities for socialisation are a factor keeping people in work at older ages,1 or if people who worked from home appreciated the extra time at home and did not want to return to the workplace. Fourth, people could have chosen to take early retirement, for a variety of reasons, including having increased their wealth during the pandemic, when consumption opportunities were minimal, and when asset prices (particularly housing) increased.
This report seeks to shed new light on the fall in employment and rise in economic inactivity amongst older people in the UK, with a particular focus on those in their 50s and 60s. We use up-to-date Labour Force Survey (LFS) data (Office for National Statistics et al., 2022a) to do so, in particular using the two-quarter longitudinal LFS data (Office for National Statistics et al., 2022b) that allow us to follow individuals from one quarter to the next as they are interviewed by the Office for National Statistics multiple times. This means that rather than just observing the number and type of people who are in paid work or not, we are able to observe transitions as people move between different types of economic activity. We include data up to and including the end of March 2022. This analysis builds upon the recent work published by the Institute for Employment Studies (2022) and the Office for National Statistics (2022b), which also uses labour market transitions to examine the rise in inactivity.
We start in Section 2 by looking at the trends in inactivity rates among 50- to 69-year-olds in the UK over time, split by age, sex and form of inactivity. We also examine flows out of employment into inactivity and vice versa from one quarter to the next. We then consider in Section 3 which groups of workers have experienced particularly big rises in inactivity. Finally, we look in Section 4 at flows into inactivity broken down by the reason newly inactive workers give for leaving their last job, to help get a sense of what is driving increased inactivity. Section 5 provides a brief conclusion.
2. Changes in economic inactivity for 50- to 69-year-olds
Before examining trends in economic inactivity, it is worth being precise about what ‘economic inactivity’ is. Consistent with international definitions, the Office for National Statistics categorises people into three mutually exclusive groups based on their labour market status. The first group is those who are in employment. Those who are not in employment are classified as either ‘unemployed’ or ‘economically inactive’. A person is deemed to be unemployed if they have been seeking work within the last four weeks and are able to start work within the next two weeks. Alternatively, a person is ‘economically inactive’ if they are not in employment and were not seeking work within the last four weeks and/or are not able to start work within the next two weeks.
Prior to the pandemic, there had been a gradual, secular decline in the fraction of people in their 50s and 60s who were economically inactive, as shown in Figure 2.1. The steady fall in the proportion of 50- to 69-year-olds who report being economically inactive between 2006 and 2019 is clear: from 43.5% at the start of 2006, the proportion fell by 8 percentage points to 35.4% in the first quarter of 2020.
There are a variety of reasons for this, including successive generations of women having greater attachment to the labour market through their working lives, which boosts employment and reduces economic inactivity at older ages (Banks, Emmerson and Tetlow, 2019). People at these ages are also considerably healthier than in previous decades (Banks, Emmerson and Tetlow, 2017). But, in addition, rises in the state pension age, since 2010 for women and since 2018 for both men and women, have also acted to increase employment (and unemployment) and reduce economic inactivity.
Cribb, Emmerson and O’Brien (2022) estimate that the increase in the state pension age from 65 to 66 meant that 60,000 fewer 65-year-olds were economically inactive at the end of 2020 than in Autumn 2018 as a direct result of that reform. Given that increases in the state pension age stopped in Autumn 2020, when the state pension age reached 66, we would probably always have expected a slowdownin the falls in economic inactivity since 2020 – this is a key reason not simply to extrapolate a pre-pandemic trend in falls in economic inactivity. However, this does not explain why inactivity has actually risen since early 2020.
Figure 2.1. Economic inactivity rate among 50- to 69-year-olds between 2006 and 2022
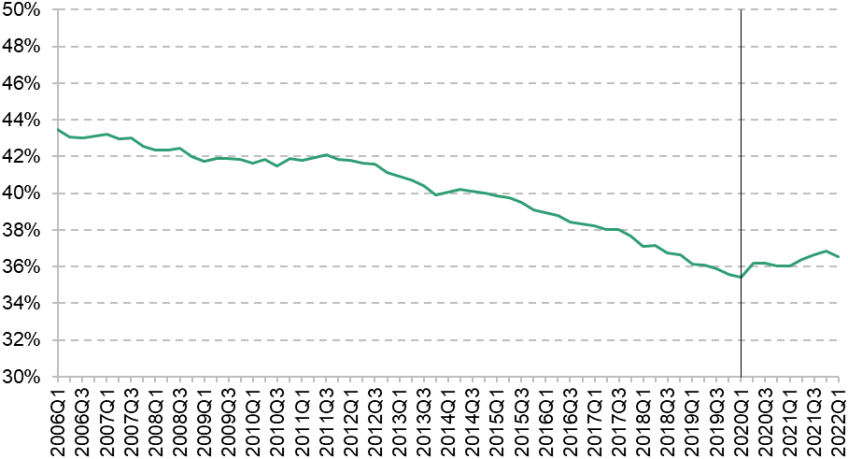
Note: Vertical line shows 2020Q1, when economic inactivity in this group reached a pre-pandemic low.
Source: Authors’ calculations using the Labour Force Survey.
From the first quarter of 2020, rates of economic inactivity began to rise for 50- to 69-year-olds. By the beginning of 2022, the inactivity rate amongst this group had risen by 1.1 percentage points to 36.5%. This took place, as the graph shows, in two discrete periods. There is the initial sharp rise between the first and second quarters of 2020, with the inactivity rate rising by 0.8 percentage points. Then inactivity rates stayed stable over the rest of 2020, before rising again, more steadily, over the course of 2021 to 36.8%. With the slight fall in inactivity in early 2022, to reach 36.5%, the inactivity rate for this group in early 2022 was back to where it was at the end of 2018.
Figure 2.2 makes clear why we are specifically choosing to focus on those aged 50–69 in this analysis. It shows the change in the fractions of each age group who are employed, unemployed and economically inactive, from the six months before the pandemic (October 2019 to March 2020) to the latest six months of data (October 2021 to March 2022). We aggregate two quarters of data together to boost sample size and make results less dependent on exactly which quarters are compared – as Figure 2.1 shows, there can be sizeable quarter-to-quarter changes.
Figure 2.2. Change in fractions of population who are employed, unemployed and economically inactive (percentage points), from October 2019–March 2020 to October 2021–March 2022, by age group
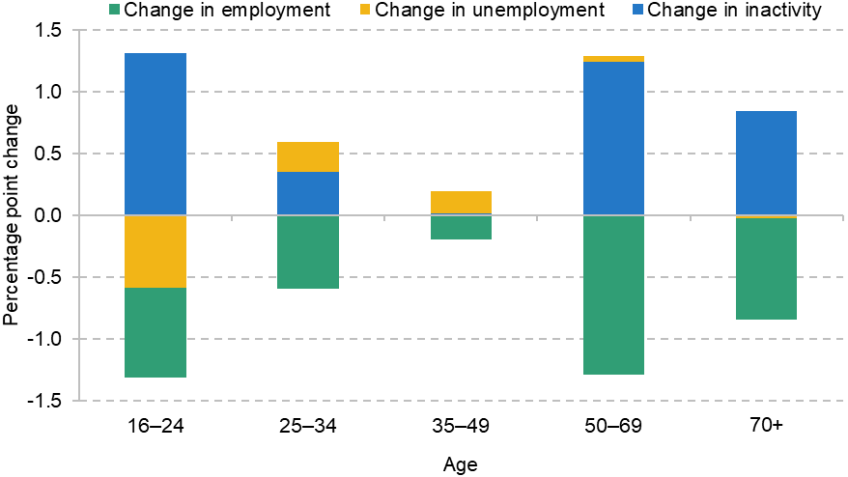
Note: By definition, the changes in employment, unemployment and economic inactivity sum to zero.
Source: Authors’ calculations using the Labour Force Survey.
The increase in the fraction of older individuals who are economically inactive during the pandemic has been particularly large compared with other groups. Over this period, inactivity rose by 1.2 percentage points for 50- to 69-year-olds. While this is not as large as the rise for 16- to 24-year-olds (+1.3 percentage points), 85% of the increase in inactivity for 16- to 24-year-olds is as a result of more people in full-time education.
For other younger groups (25- to 34-year-olds and 35- to 49-year-olds), there has been little change in the rates of economic inactivity. There have also been an increase in the fraction of people aged 70+ who are economically inactive – of 0.8 percentage points – and a commensurate fall in their employment rate. But with an increase of 270,000 economically inactive 50- to 69-year-olds when comparing October 2021 to March 2022 with the same period two years earlier (October 2019 to March 2020), this means 43% of the overall rise in economic inactivity in the population since the pandemic has been driven by changes for 50- to 69-year-olds.
Over the same period as shown in Figure 2.2 (October 2019–March 2020 to October 2021–March 2022), Figure 2.3 shows that the increases in inactivity rates have been bigger among those in their late 50s (+1.8 percentage points), while still sizeable among those aged 50–54 (+1.1 percentage points) and 60–64 (+1.5 percentage points). The changes have been smallest for those in their late 60s, for whom there was essentially no change (though this specific group will have been affected by the increase in the state pension age from 65 to 66, as previously discussed, which will have reduced inactivity). Figure 2.3 also shows that there have been increases in inactivity both for men (+1.5 percentage points) and for women (+1.0 percentage points).
Figure 2.3. Change in rate of economic inactivity (percentage points) for 50- to 69-year-olds, October 2019–March 2020 to October 2021–March 2022, by subgroup
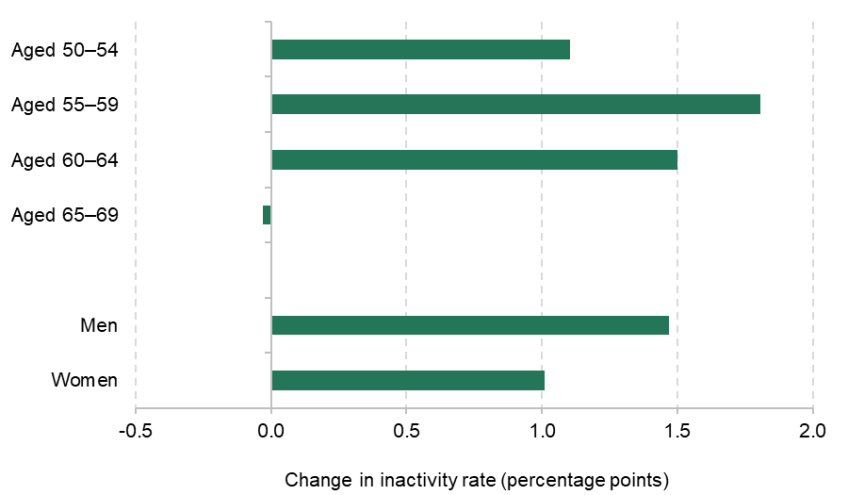
Source: Authors’ calculations using the Labour Force Survey.
We can also look at the change in different sorts of inactivity over time. The Labour Force Survey asks questions that aim to understand the main reason why people are economically inactive. Figure 2.4 decomposes the change in the inactivity rate into those who moved into retirement, long-term sickness or disability, and other forms of inactivity. It shows that the fraction of people who were retired was trending sharply downwards before 2020; this trend was reversed during the pandemic, with retirement rates roughly unchanged in early 2022 compared with early 2020, though there is variation from quarter to quarter.
Despite relatively little change since around 2013, there has been a tick up in the fraction of 50- to 69-year-olds saying that they are out of work due to long-term sickness or disability, which is 0.5 percentage points higher than in early 2020. Other inactivity – including caring responsibilities, and discouraged workers (i.e. those who want a job but have given up searching) – rose during 2020, earlier than retirement began to rise, and remained at its elevated level into early 2022, 0.8 percentage points higher than in early 2020.
Figure 2.4. Percentage point change in different forms of inactivity for 50- to 69-year-olds from 2020Q1
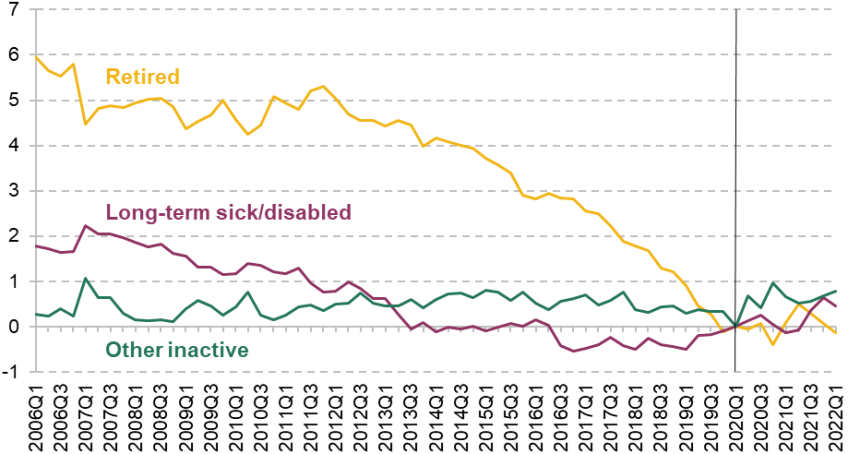
Note: Vertical line shows 2020Q1, when economic inactivity in this group reached a pre-pandemic low and from which we measure the change in forms of inactivity in this figure.
Source: Authors’ calculations using the Labour Force Survey.
Using a longitudinal form of the LFS, which links individuals between two quarters, allows us to focus on the specific flows into and out of economic inactivity over the course of three months (i.e. between quarters), in order to see what is driving the change in the rates of economic inactivity.
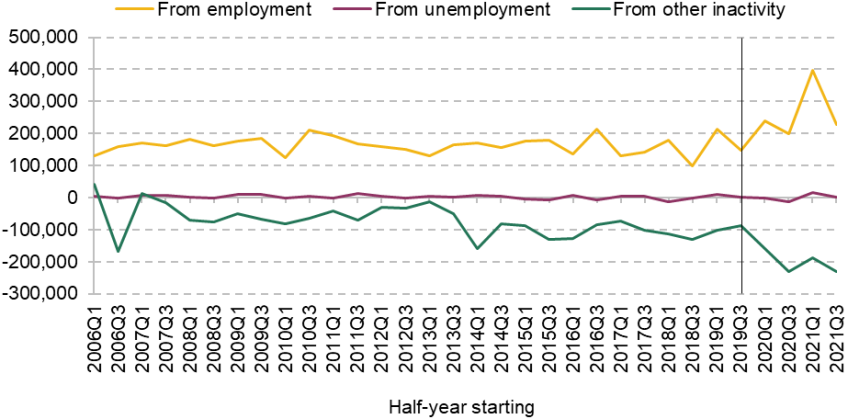
Figure 2.5 illustrates the flows into and out of economic inactivity between quarters for 50- to 69-year-olds using these data. (We aggregate the data together into half-years in order to smooth the series out, as there are relatively small numbers of people who make each transition each quarter.) The graph shows that the rise in inactivity rates illustrated above is being driven primarily by movements from employment into inactivity. Comparing the two years since the pandemic started with the last six months before the pandemic, an average of an additional 170,000 older workers have moved into inactivity per half-year. This compares with an average of around 40,000 fewer people of this age per half-year moving from inactivity into employment, which also pushes up rates of inactivity.
Figure 2.5. Number of 50- to 69-year-olds moving from employment to inactivity (and vice versa) and from unemployment to inactivity (and vice versa) within three months, by half-year
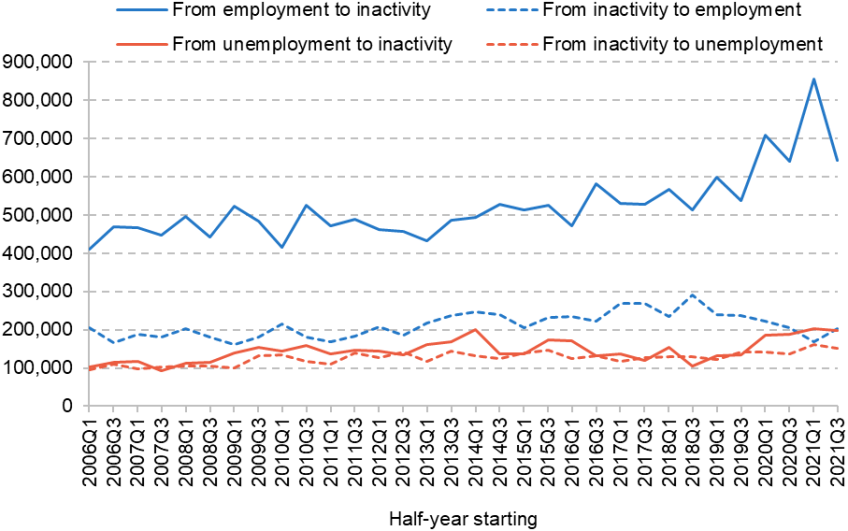
Note: The vertical line indicates the final data point unaffected by the COVID-19 pandemic.
Source: Authors’ calculations using Longitudinal Labour Force Survey.
There have also been more people in their 50s and 60s moving from unemployment to inactivity (60,000 more per half-year since the pandemic compared with pre-pandemic), while there has been minimal change in the number of 50- to 69-year-olds leaving inactivity for unemployment. Overall, this implies that around two-thirds of the increase in the net flow into economic inactivity is as a result of more people leaving paid work for economic inactivity during the pandemic. We therefore focus on this particular transition in much more detail in the remainder of this report.
Figure 2.6 breaks down the flow from employment directly into inactivity in more detail, looking at how the proportion of employed 50- to 69-year-olds moving into retirement and other sorts of inactivity between quarters has changed during the pandemic. The key finding of this graph is that 50- to 69-year-olds have been leaving work for both retirement and other forms of inactivity during the pandemic.
Figure 2.6. Percentage of 50- to 69-year-old workers moving into inactivity in a three-month period, by form of inactivity
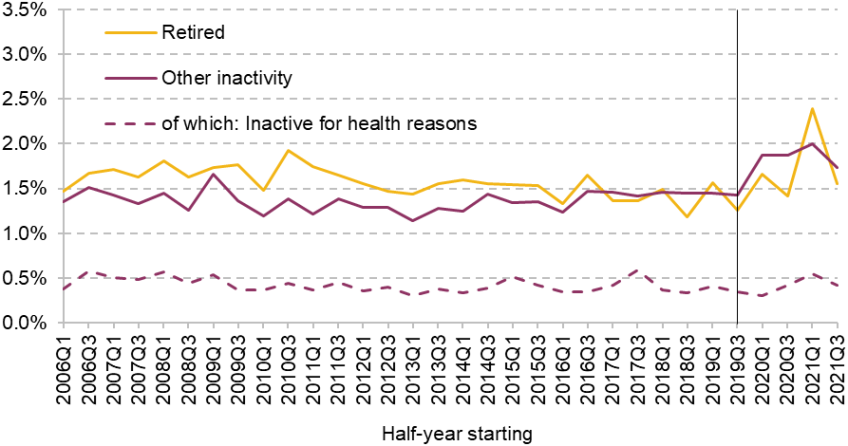
Note: The vertical line indicates the final data point unaffected by the COVID-19 pandemic.
Source: Authors’ calculations using Longitudinal Labour Force Survey.
On average during the pandemic, the fraction of workers in this age group leaving work for retirement is around 40% higher than it was immediately pre-pandemic, and there has been a roughly 30% increase in the fraction of workers leaving for other forms of inactivity.2 The rates of leaving work for either retirement or other forms of inactivity are higher than at any point since at least 2006 (the longitudinal LFS has a consistently coded definition of inactivity since 2006). It looks as if relatively little of this increase is driven by moves into ‘long-term sickness or disability’, for which the rates of around 0.3–0.5% per quarter are similar to those seen pre-pandemic, although there is a slight tick up late in 2020.
Overall, these results imply that more workers aged 50–69 have been leaving work during the pandemic, at high rates compared with recent history, both for retirement (particularly later in the pandemic) and other forms of inactivity (throughout the pandemic); this has therefore driven up rates of economic inactivity.
3. Moves into economic inactivity for different groups
We now look in more detail at people in their 50s and 60s moving out ofemployment into economic inactivity, and we consider which groups this rise in exits from the labour force has been most prevalent in. As in the previous section, we examine flows from employment into retirement and into other forms of inactivity separately, since economic inactivity other than retirement tends to be less persistent as a state than retirement – retirees were less likely to move back into work than those who are inactive for other reasons prior to the pandemic, controlling for age and sex. Indeed, Kanabar (2013) estimates that only between 5% and 10% of people ever return to employment after having retired. We examine how these moves from employment to retirement and other forms of inactivity vary by a range of individual and job characteristics.
When looking at each of these groups, we look at the average rate of workers leaving employment for retirement / other inactivity within three months, averaged over a whole year (compared with over six months as done in the previous section). That is so we gain sufficient sample size to give greater certainty to our conclusions when looking at subgroups of the population.
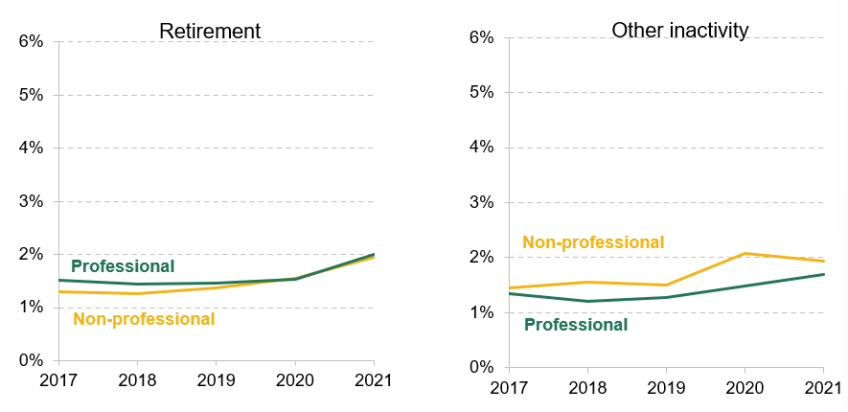
First, Figure 3.1 shows that the increase in the rate at which workers retired during the pandemic was more marked for those in their 60s than for those in their 50s. This is especially the case in 2021, when the proportion of workers in their 50s retiring within three months was 0.7%, up from 0.4% in 2019 and the proportion of workers in their 60s retiring was 5.0%, up from 4.0% in 2019. The increase in the rate at which workers moved into other forms of inactivity during the pandemic was also greater for those in their 60s, although the difference was smaller than for moves into retirement.
Second, Figure 3.2 shows that working men and working women saw similar increases in the rate of moving from employment into retirement during the pandemic. And the increases in the rate of men and women leaving employment for other forms of economic inactivity have been fairly similar during the pandemic too.
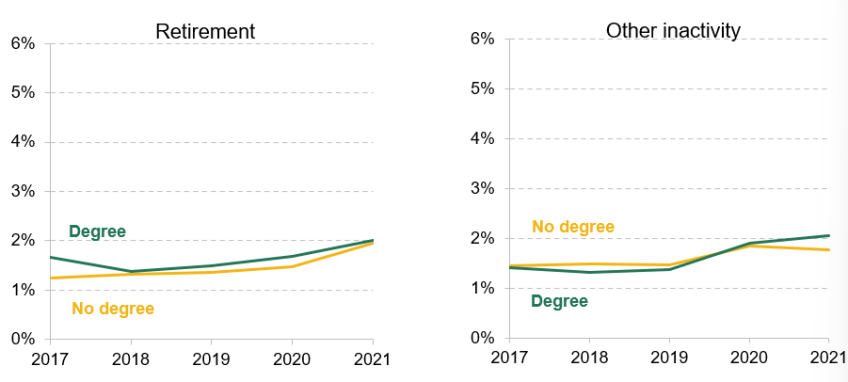
In addition to there being relatively little difference between men and women, Figure A.2 in the appendix shows that there is little difference in the rate of leaving employment for inactivity between people in professional jobs and those in other occupations or between people with degrees and those without. University-educated and professional workers are typically more affluent than the average 50- to 69-year-old worker; the lack of significant difference in rates of movement into inactivity for the groups in Figure A.2 means that we can reject the idea that the increase in inactivity is purely amongst those who are relatively well off.3
Figure 3.1. Percentage of 50- to 69-year-old workers moving into inactivity in a three-month period, by form of inactivity and age
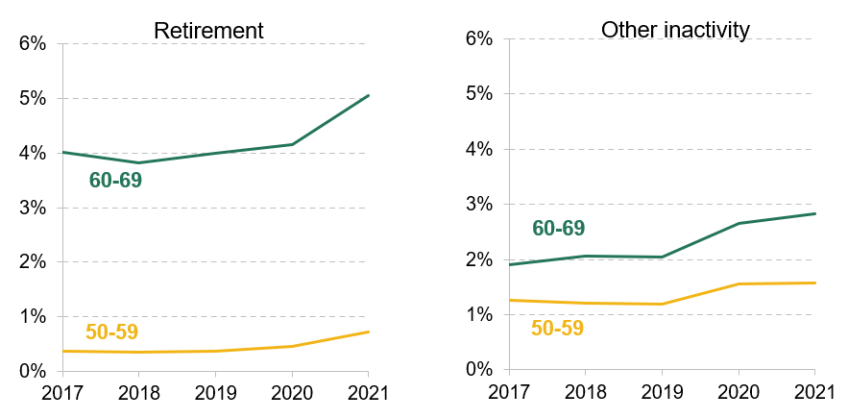
Source: Authors’ calculations using Longitudinal Labour Force Survey.
Figure 3.2. Percentage of 50- to 69-year-old workers moving into inactivity in a three-month period, by form of inactivity and sex

Source: Authors’ calculations using the Longitudinal Labour Force Survey.
There are, however, two groups for whom there are particularly different trends. First, the trends between employees and the self-employed leaving work for inactivity are markedly different, as shown in Figure 3.3. While there have been similar increases in the rate of leaving work for retirement for the self-employed versus employees between 2019 and 2021, the left-hand part of Figure 3.3 shows that the increase happened earlier (i.e. in 2020) for the self-employed than for employees.4 Much more dramatic has been the increase in the fraction of self-employed workers leaving for other forms of inactivity, which rose by 50% between 2019 and 2020. This increased rate of leaving self-employment for inactivity has pushed down the fraction of 50- to 69-year-olds who are self-employed, as shown in Cribb and Emmerson (forthcoming).
There have also been very different trends between part-time and full-time workers, as shown in Figure 3.4. Part-time workers experienced a larger increase in movements into retirement than did full-time workers and there have also been larger increases in the fraction of part-time workers moving into other forms of inactivity than for full-time workers. Similar to the falls in self-employment, Cribb and Emmerson (forthcoming) show that these changes have fed through into falls in the number of part-time workers aged 50–69 in the UK population.
One similarity that self-employed people and part-time workers have is that they are – in a sense – closer to retirement already than full-time employees. By definition, part-time workers work fewer hours than full-time workers, with more time for leisure, caring for family members or other activities. Some part-time workers will have reduced their hours of work in recent years, having previously been full-time workers (Banks, 2016). Self-employed workers tend to have lower earnings than employees (Cribb, Miller and Pope, 2019) and almost by definition have more control over their working lives than employees. In that sense, it seems that there have been greater increases in economic inactivity since the pandemic for the people who were closer to retirement.
Figure 3.3. Percentage of 50- to 69-year-old workers moving into inactivity in a three-month period, by form of inactivity and employment type
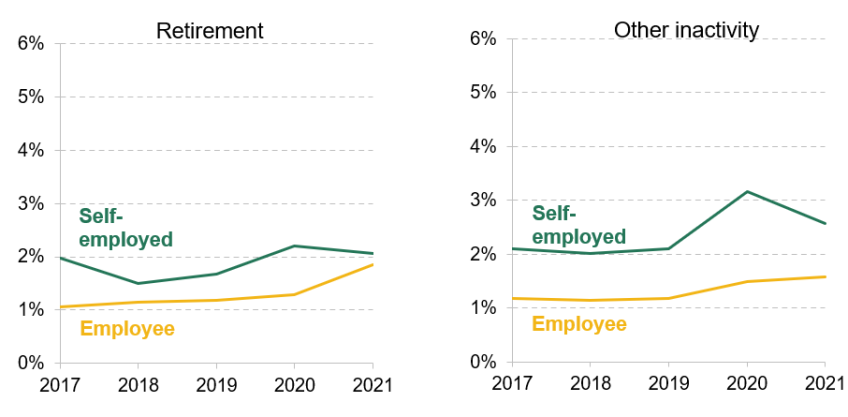
Note: Enter note content here.
Source: Authors’ calculations using the Longitudinal Labour Force Survey.
Figure 3.4. Percentage of 50- to 69-year-old workers moving into inactivity in a three-month period, by form of inactivity and full-time or part-time work
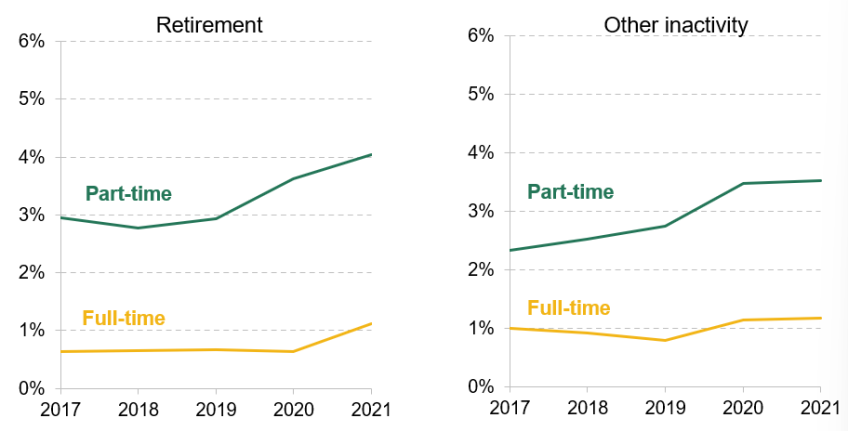
Note: ‘Full-time’ refers to people working at least 30 hours per week.
Source: Authors’ calculations using the Longitudinal Labour Force Survey.
With the increases in moves out of employment and into inactivity concentrated amongst self-employed workers and (particularly) part-time workers, it is worth asking whether these patterns could reflect a role played by differential labour demand in the pandemic and the recovery from it. One way to answer this is to examine whether the patterns of leaving paid work for inactivity are greater in occupations with low vacancy growth than in occupations with higher vacancy growth.
To do this, we examine growth in vacancies between late 2019/20 (October 2019 to February 2020) and late 2021/22 (October 2021 to February 2022), measured at the four-digit SOC code in the Adzuna vacancy data, as calculated by Joyce et al. (2022) – see figure 2.2 in that publication. We create equal thirds of the working 50- to 69-year-old population based on vacancy growth in their occupation,5 and compare flows out of employment into inactivity for the thirds of workers in occupations with the highest and lowest vacancy growth.
Figure 3.5. Percentage of 50- to 69-year-old workers moving into inactivity in a three-month period, by form of inactivity and growth in occupations’ vacancies since late 2019/20
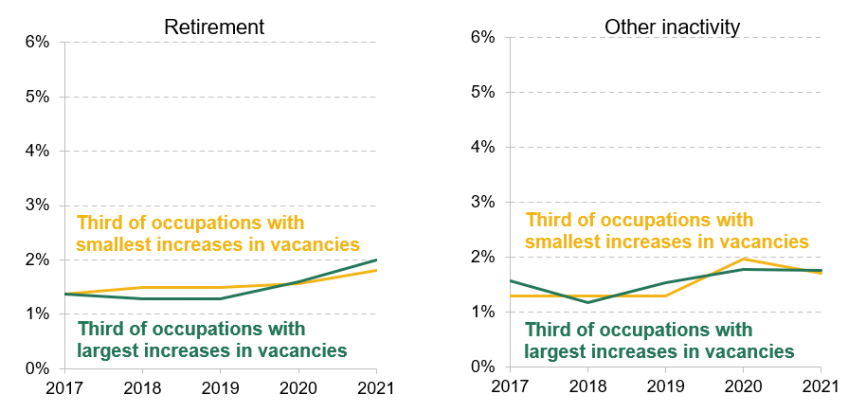
Note: Occupations (measured at the four-digit SOC level) are ranked based on the growth in the number of vacancies measures in Adzuna data, between late 2019/20 (October 2019 to February 2020) and late 2021/22 (October 2021 to February 2022) as calculated by Joyce et al. (2022), and split into equal tertiles (thirds) for 50- to 69-year-old workers. Only the thirds with highest and lowest growth in vacancies are illustrated.
Source: Authors’ calculations using the Longitudinal Labour Force Survey.
The results are presented in Figure 3.5, which shows that there is very little difference between the increased rates of moving into retirement and other forms of inactivity for people working in occupations that have seen higher and lower vacancy growth over the last two years. Given that the growth in vacancies provides guidance to occupations that are seeing relatively large or small growth in labour demand, this suggests that stronger or weaker demand for specific occupations or skills is unlikely to be playing a key role in driving the increase in economic inactivity among people in their 50s and 60s. It also suggests that higher inactivity for 50- to 69-year-olds is likely to be contributing at least partially to the labour market tightness seen in some areas.
An additional consideration is whether the increased rates of working from home could have had an impact on workers’ decisions to leave work for retirement or other forms of inactivity. Figure 3.6 provides some evidence that there is a small difference between people working in occupations where it is easier to work from home and those where it is harder to work from home. The graphs use a measure of how much each occupation (defined by a four-digit SOC code) is able to work remotely, and take people in the third of the distribution that is most able to work from home and the third of the distribution that is least able to work from home (the middle third is therefore excluded).
Figure 3.6. Percentage of 50- to 69-year-old workers moving into inactivity in a three-month period, by form of inactivity and ability to work remotely (split into thirds)
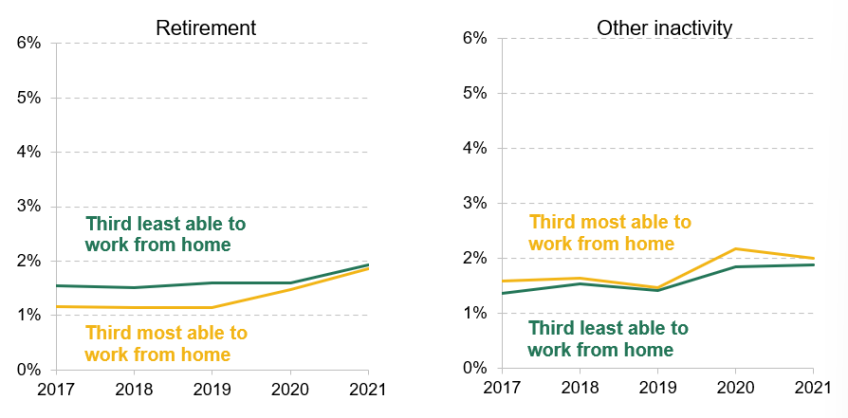
Note: The telework index is based on four-digit occupation (SOC) codes in Dingel and Neiman (2020). Only the top and bottom tertiles (thirds) of the distribution of ability to work from home are presented.
Source: Authors’ calculations using the Longitudinal Labour Force Survey.
Figure 3.6 shows that the increase since the start of the pandemic in the rate of moving from employment into retirement or other forms of inactivity is slightly higher for those who are more able to work from home than for those who are much less able to do so. This could be driven either by people who worked from home during the pandemic getting used to more time spent at home – and therefore being unwilling to return to the workplace as public health restrictions have been relaxed – or by people who worked from home actually preferring to be in the workplace, where they could have socialised with people, and not enjoying the lack of socialisation associated with remote working.
Finally, Figure 3.7 shows that those 50- to 69-year-olds workers with a long-standing health condition (lasting, or expected to last, 12 months or more) prior to the pandemic moved out of employment into retirement and other forms of inactivity at a higher rate than those without a long-standing health condition. But there does not seem to have been a larger increase in leaving work for retirement and other inactivity among those with a health condition than among those without one – the percentage point increases are similar for the two groups.
Figure 3.7. Percentage of 50- to 69-year-old workers moving into inactivity in a three-month period, by form of inactivity and presence of long-standing health condition
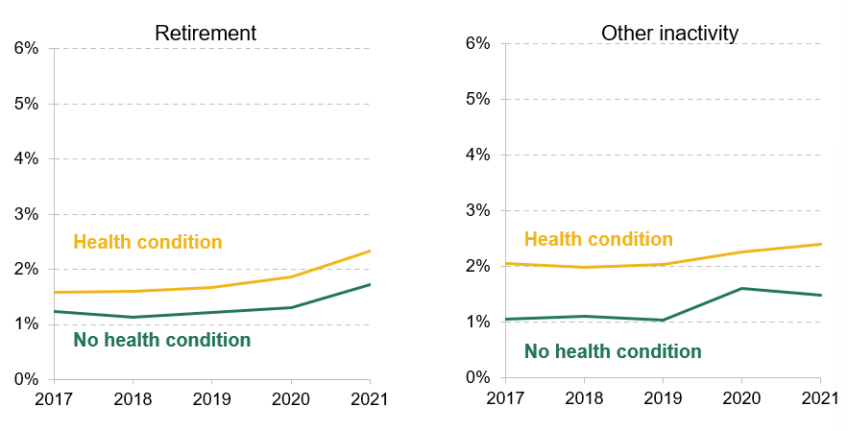
Note: ‘Health condition’ is a long-standing health condition lasting, or expected to last, at least 12 months.
Source: Authors’ calculations using Longitudinal Labour Force Survey.
In addition, it does not seem that concerns about catching COVID-19 in the workplace are likely to have driven the rise in retirement – when looking either at occupations where you are particularly likely to be working in close proximity to others or at occupations where higher fractions of workers caught the disease, we do not see higher increases in the rates of leaving work for inactivity during the pandemic than in occupations where people work less closely or which saw lower exposure to COVID-19.
Of course, there could be multiple offsetting effects taking place – while some workers with a specific health condition might be more likely to leave employment and move into retirement or other inactivity during the pandemic, due to their vulnerability to the disease, other workers with a health condition might benefit from the increasing availability of remote and flexible work, and become able to stay in employment for longer, whereas pre-pandemic they might have felt that they had little choice but to resign.
In summary, we find that three particular groups saw particularly large increases in the probabilities of moving out of employment and into retirement or other forms of inactivity during the COVID-19 pandemic: people in their 60s, self-employed workers and part-time workers. We do not find any material difference in the trends of leaving employment for inactivity between those working in occupations with high and low vacancy growth, suggesting that weaker labour demand in some occupations is unlikely to be driving the rise in inactivity. There is some evidence that people in occupations that have a greater ability to work remotely saw somewhat larger increases in the rate of leaving paid work for inactivity.
In comparison, there were fairly small differences between men and women, between people with and without degrees, between those in professional versus non-professional occupations, and between public and private sector employees. On these dimensions, therefore, the rise in inactivity has been broad based. And, potentially surprisingly, we did not see a greater increase in transitions into inactivity for those with long-standing health problems than for those who did not have such health problems.
4. Reasons for moving into inactivity
In this section, we look briefly at stated reasons for leaving work to help us understand the higher rates of 50- to 69-year-old workers leaving the labour force. Coupled with Section 3’s analysis of which types of workers are moving into inactivity at a higher rate, this can build a picture of the increase in economic inactivity over time and the potential reasons for it.
Figure 4.1. Average number of 50- to 69-year-olds moving from work into inactivity in a three-month period, with their reported reasons for leaving their previous job
Note: The figures are measured over the set of people who responded to this question.
Source: Authors’ calculations using the Longitudinal Labour Force Survey.
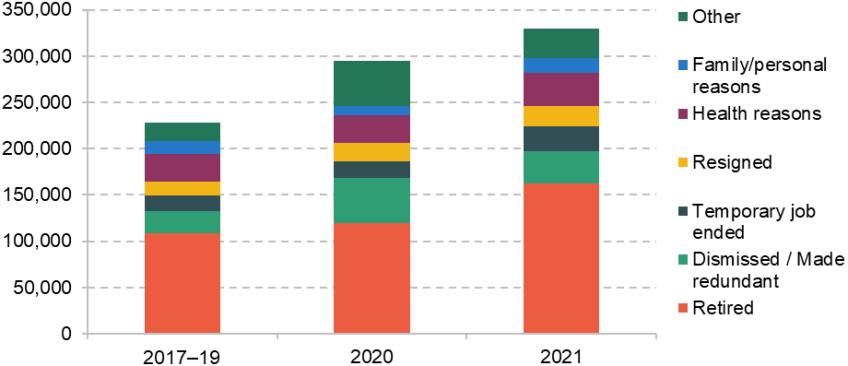
Figure 4.1 shows the average number of workers aged 50–69 moving into economic inactivity within three months, broken down by the reasons they reported for leaving their last job. These figures are shown for the pre-pandemic average (2017–19) and for 2020 and 2021 separately. Note that they only include people who make these transitions and report a reason for having left work, so they do not add up quite to the same changes seen in previous sections, but they still give a good sense of people’s stated reasons for leaving the labour force.
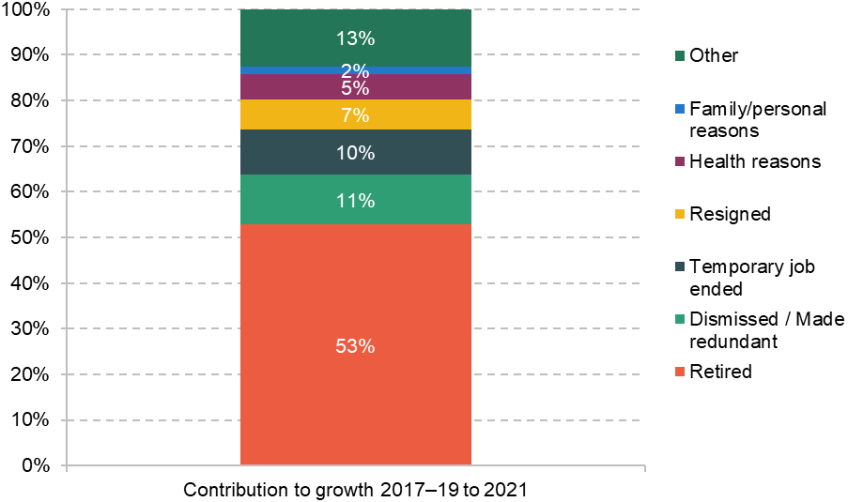
Alongside this, Figure 4.2 shows the contribution that each reason for leaving work makes to growth in the number of 50- to 69-year-olds leaving employment for inactivity. In particular, it shows that the increased number of people retiring explains 53% of the increase in the number of 50- to 69-year-olds moving from employment to inactivity between 2017–19 and 2021, consistent with the large increases in movements into retirement seen in Figure 2.6.
However, the figures also shed light on other reasons for the increase in moves from employment into inactivity. Redundancy and other job loss also played an important role, especially in 2020. The number of people moving from employment to inactivity due to redundancy or dismissal doubled from 24,000 per quarter prior to the pandemic to 49,000 per quarter. This increase made up 37% of the increase in the number of transitions from employment to inactivity between 2017–19 and 2020. However, compared with 2020, there were falls in the numbers moving into inactivity due to redundancy or dismissal in 2021 (to 35,000 per quarter). This was because redundancy rates amongst 50- to 69-year-olds fell considerably in 2021 – see Figure A.4 in the appendix – and the re-employment rates of older workers who were made redundant in 2021 returned to their pre-pandemic levels (see Figure A.5). Even so, Figure 4.2 shows that 11% of the increase in transitions from work to inactivity between 2017–19 and 2021 can be explained by increasing numbers of redundancies or dismissals.
Figure 4.2. Contribution to the increase in movements into inactivity between 2017–19 and 2021 of each reason for leaving previous job
Note: The figures are measured over the set of people who responded to this question.
Source: Authors’ calculations using the Longitudinal Labour Force Survey.
Figures 4.1 and 4.2 also show that there was an increase in a whole range of different answers (including the number that give an unspecified ‘other’ reason). These include a temporary job coming to an end; resigning (for unspecified reasons); family and personal reasons; and health reasons. It is worth highlighting that there is in fact only a small rise in the number of people who leave employment for inactivity who report that the reason they left work was health-related. This form of exit from the labour force contributed only 5% of the increase in moves from work to inactivity comparing 2017–19 and 2021.
In summary, consistent with the data on types of economic activity, looking at stated reasons for moving into inactivity shows big increases in the number of 50- to 69-year-olds who left work because they were retiring. There were a range of other responses, and the increased level of redundancies seems to have played a contributing role in 2020, but a much reduced role in 2021. In contrast, there is very little evidence of substantial increases in the number of people who left work for inactivity who said that the reason they left work was health-related. These findings are consistent with the findings in previous sections, which also suggested that low labour demand in some occupations, and poor health, were unlikely to be important drivers of the increase in economic inactivity.
5. Conclusion
This report has shed light on the recent striking changes in the labour market behaviour of older individuals. Economic inactivity among 50- to 69-year-olds, after falling consistently in the years prior to the pandemic, rose during the pandemic, and this increase was considerably larger than for other parts of the population. The rates of 50- to 69-year-old workers leaving employment for retirement or for other forms of inactivity spiked, and are higher than at any point since at least 2006, a period that of course includes the Great Recession. Other trends have also pushed up rates of economic inactivity: economically inactive people at these ages have been less likely to return to paid work, and more people have moved from unemployment into economic inactivity during the pandemic. While the increase in inactivity is large and a reversal of a long-running trend, it is also important to note that rates of economic inactivity among 50- to 69-year-olds still remain below those seen prior to 2018.
In terms of who has been most affected by the increased rates of leaving employment for inactivity, three groups stand out: part-time workers, self-employed workers, and workers in their 60s, all of whom became more likely to move out of employment and into economic inactivity during the pandemic. These are all groups that are, in a sense, closer to retirement. Particularly for part-time workers and the self-employed, these increased rates of leaving the labour force started earlier in the pandemic (2020), whereas rises in leaving work for economic inactivity amongst full-time workers and employees have both been less dramatic and occurred later in the pandemic (2021). There is also some evidence of occupations where there is greater ability to work remotely seeing larger increases in the number of people leaving work for economic inactivity, but the differences are not as large as for the other groups identified.
On a number of dimensions, the rises in inactivity look very broad based: we do not find any difference in the trends between men and women, those with and without degrees, those in professional and non-professional occupations, or those who are private and public sector employees. Nor do we find differences in the increase in rates of leaving employment for inactivity between those working in occupations that have seen particularly high, or relatively low, growth in vacancies over the last two years. This suggests that weak labour demand for particular occupations or skills is unlikely to be driving the increased rates of inactivity among people in their 50s and 60s.
Looking at stated reasons for leaving work also provides some insights into what has been driving these trends. The majority (53%) of the increase in 50- to 69-year-olds leaving employment for inactivity between 2017–19 and 2021 is due to more people reportedly leaving work in order to retire. Redundancies and dismissals were important in driving up inactivity in 2020, though much less so in 2021. Over a third (37%) of the increase in 50- to 69-year-olds leaving the labour force between pre-pandemic data (2017–19) and 2020 was driven by redundancies or dismissals, as redundancy rates spiked. But these only made up 11% of the growth between 2017–19 and 2021.
Growth in health-related reasons for leaving the labour force only accounts for 5% of the overall growth in inactivity. In addition, the fraction of 50- to 69-year-old workers moving from employment into being economically inactive due to ‘long-term sickness or disability’ has stayed relatively constant during the pandemic. Also, changes in transitions from employment to inactivity are similar between those with and without a long-standing health condition. All together, these facts suggest poor health is not a primary driver of these increases in economic inactivity rates.
Overall, therefore, the rise in economic inactivity among 50- to 69-year-olds does not look to be driven primarily either by poor health or by low labour demand leading to people being unable to find work and becoming discouraged. It looks more consistent with a lifestyle choice to retire in light of changed preferences or priorities, possibly in combination with changes in the nature of work post-pandemic (in particular more remote work) which reduces the appeal of staying in employment.
It is, of course, hard to say how much these trends will continue. Optimists might look at the latest quarter of data – from 2022Q1 – which showed a fall in inactivity among those aged 50–69. But drawing conclusions from only one quarter of data is risky at the best of times. And while some may celebrate if the trend of higher inactivity were to prove to be temporary, we should be careful. With rising inflation and spiking energy bills, older people returning to employment (or not retiring when they otherwise would) because they cannot afford to pay their gas bill would not exactly be a trend to celebrate (even though for some it might be a reasonable response to the rising cost of living).
Appendix
Figure A.1. Net flows into retirement from different sources over the course of three months, by half-year
Note: The vertical line indicates the final data point unaffected by the COVID-19 pandemic.
Source: Authors’ calculations using Longitudinal Labour Force Survey.
Figure A.2. Percentage of 50- to 69-year-old workers moving into inactivity in a three-month period, by form of inactivity: professional versus non-professional and graduate versus non-graduate
Panel A. Differences between those in professional and non-professional occupations
Panel B. Differences between workers with and without degrees
Note: Professional occupations are classified as Professionals or Associate Professionals (SOC2010 or SOC2020 one-digit codes 2 and 3).
Source: Authors’ calculations using the Longitudinal Labour Force Survey.
Figure A.3. Percentage of 50- to 69-year-old workers moving into inactivity in a three-month period, by form of inactivity and whether public or private sector

Note: Self-employed workers are excluded.
Source: Authors’ calculations using the Longitudinal Labour Force Survey.
Figure A.4. Redundancy rate among 50- to 69-year-olds, per thousand employees
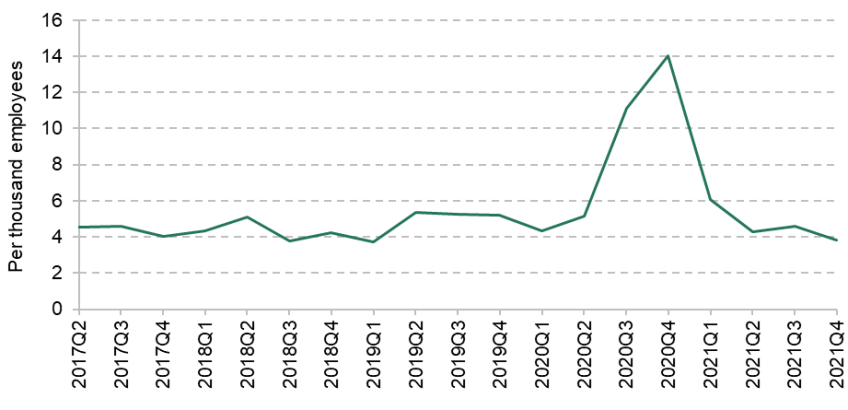
Source: Authors’ calculations using the Labour Force Survey.
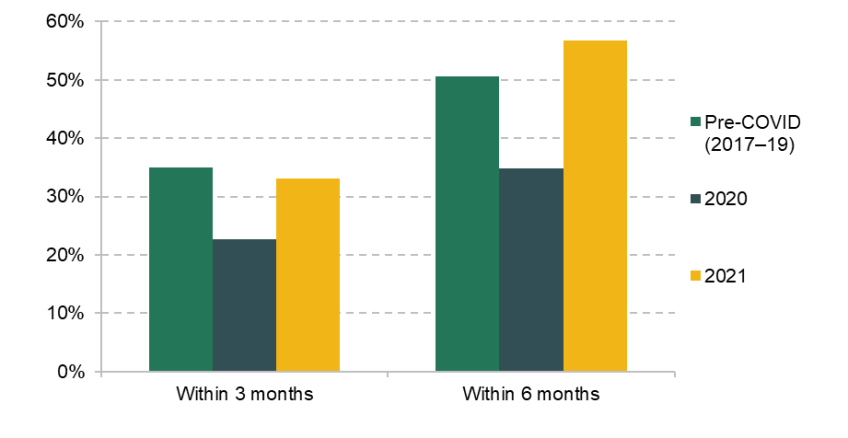
Figure A.5. Re-employment rates among 50- to 69-year-olds following redundancy, by period of non-employment
Source: Authors’ calculations using the Longitudinal Labour Force Survey.
References
Banks, J. (2016). ‘Employment and labour market transitions at older ages in England, 2002–03 to 2014–15’. In J. Banks, D. Batty, J. Nazroo and A. Steptoe (eds), The Dynamics of Ageing: Evidence from the English Longitudinal Study of Ageing 2002–15 (Wave 7), London: Institute for Fiscal Studies. Available at https://ifs.org.uk/publications/8696.
Banks, J., Emmerson, C. and Tetlow, G. (2017). ‘Health capacity to work at older ages: evidence from the United Kingdom’. In D.A. Wise (ed.), Social Security Programs and Retirement around the World: The Capacity to Work at Older Ages, Chicago: University of Chicago Press. Available at https://www.nber.org/system/files/chapters/c13748/c13748.pdf.
Banks, J., Emmerson, C. and Tetlow, G. (2019). ‘Long-run trends in the economic activity of older people in the United Kingdom’. In C.C. Coile, K. Milligan and D.A. Wise (eds), Social Security Programs and Retirement around the World: Working Longer, Chicago: University of Chicago Press. Available at https://www.nber.org/system/files/chapters/c14051/c14051.pdf.
Cribb, J. and Emmerson, C. (forthcoming). ‘Recent and future patterns of work around state pension age’. Institute for Fiscal Studies (IFS), report.
Cribb, J., Emmerson, C. and O’Brien, L. (2022). ‘The effect of increasing the state pension age to 66 on labour market activity’. Institute for Fiscal Studies (IFS), Working Paper W22/07. Available at https://ifs.org.uk/publications/15911.
Cribb, J., Miller, H. and Pope, T. (2019). ‘Who are business owners and what are they doing?’. Institute for Fiscal Studies (IFS), Report 158. Available at https://ifs.org.uk/publications/14241.
Dingel, J.I. and Neiman, B. (2020). ‘How many jobs can be done at home?’. National Bureau of Economic Research (NBER), Working Paper 26948. Available at https://www.nber.org/papers/w26948.
Institute for Employment Studies (2022). ‘Labour market statistics, February 2022’. IES Briefing. Available at https://www.employment-studies.co.uk/system/files/resources/files/IES%20briefing%20-%20Labour%20Market%20Statistics%20February%202022.pdf.
Joyce, R., Postel-Vinay, F., Spittal, P. and Xu, X. (2022). ‘Job opportunities after the pandemic’. Institute for Fiscal Studies (IFS), Briefing Note BN342. Available at https://ifs.org.uk/publications/16033.
Kanabar, R. (2013). ‘Unretirement in England: an empirical perspective’. University of York, Discussion Paper in Economics 13/25. Available at https://www.york.ac.uk/media/economics/documents/discussionpapers/2013/1325.pdf.
Office for Budget Responsibility (2020). ‘Fiscal sustainability report: July 2020’. Available at https://obr.uk//docs/OBR_FSR_July_2020-1.pdf.
Office for National Statistics (2022a). ‘Early insights from the Over 50s Lifestyle Study, Great Britain: 1 March 2022’. Available at https://www.ons.gov.uk/employmentandlabourmarket/peoplenotinwork/economicinactivity/bulletins/earlyinsightsfromtheover50slifestylestudygreatbritain/1march2022.
Office for National Statistics (2022b). ‘Movements out of work for those aged over 50 years since the start of the coronavirus pandemic’. Available at https://www.ons.gov.uk/employmentandlabourmarket/peopleinwork/employmentandemployeetypes/articles/movementsoutofworkforthoseagedover50yearssincethestartofthecoronaviruspandemic/2022-03-14.
Office for National Statistics, Social Survey Division, Northern Ireland Statistics and Research Agency (2022a). Quarterly Labour Force Survey, 2006-2012. Retrieved from https://discover.ukdataservice.ac.uk/series/?sn=2000026.
Office for National Statistics, Social Survey Division, Northern Ireland Statistics and Research Agency (2022b). Labour Force Survey Two-Quarter Longitudinal Datasets, 2006-2021. Retrieved from https://discover.ukdataservice.ac.uk/series/?sn=2000026.
Acknowledgements
We would like to thank Carl Emmerson, Paul Johnson and Robert Joyce for helpful comments. The authors gratefully acknowledge support from the Economic and Social Research Council through the UKRI Strategic Priorities Fund under grant reference ES/W010453/1 and the ESRC Centre for the Microeconomic Analysis of Public Policy (ES/T014334/1). The Labour Force Survey (LFS) data are Crown Copyright and are reproduced with the permission of the Controller of HMSO and the Queen’s Printer for Scotland. They are produced by the Office for National Statistics and accessed through the UK Data Service.
Endnotes
Authors

Bee Boileau
Bee joined the IFS in 2021 as a Research Economist and works in the Retirement, Saving and Ageing sector.

Jonathan Cribb
Jonathan joined IFS in 2011. His research areas includes: pensions, ageing and demographic change, public sector pay, housing, and inequalities.
More from IFS
Understand this issue


Policy analysis


Academic research


