
Since the beginning of the Covid-19 pandemic, there has been a fall in the employment rate in the UK, driven by a rise in the rate of economic inactivity rather than in unemployment. There has been increasing discussion about the links between worsening ill-health and rising inactivity. The Health Foundation and the Institute for Employment Studies have both argued that a key reason behind the increase in economic inactivity has been worsening health, and John Burn-Murdoch has written for the FT about worsening health in the working age population and the role chronic illness has played in driving inactivity rates higher.
These analyses, in general, have used cross-sectional Labour Force Survey (LFS) data. This dataset does show a significant rise in health-related inactivity. Indeed, inactivity due to long-term sickness or disability has been the form of inactivity that has seen the largest increase in the working-age population since the end of 2019 (see Appendix Figure 1). Increases in health-related inactivity have especially affected those aged 50-64, the age group that has contributed the most to rising rates of inactivity since the beginning of the pandemic (Institute of Employment Studies, Oct 2022). Indeed, for 50-64 year olds, the rate of inactivity due to being long-term sick or disabled rose from 9.0% in 2019Q4 to 10.1% by 2022Q2, a rise of around 160,000 people. This rise is important in its own right.
However, the rise in the number of people who are inactive due to ill-health does not necessarily imply that all these people have left the labour force as a result of ill-health. More people may be leaving the labour force for other reasons – for example, because they are taking early retirement – and, simultaneously, those already out of the labour force may be getting sicker. This explanation would imply that there are two problems for policymakers: first, the rise in movements from employment into inactivity; second, the increasing levels of sickness among inactive people.
There is, of course, some overlap between these two issues. But we present evidence in this brief comment, that health reasons do not seem to be the key reasons for older people leaving the labour force, which has been driving up economic inactivity since the start of the pandemic. Intending to clarify the issues at stake, we will focus on 50-64 year olds, since this age group are all below state pension age and have been key in driving the rise in economic inactivity.
How long have those inactive for health reasons been out of work for?
Rather than the rise in health-related inactivity being concentrated in people who have recently left work, Figure 1 shows that the rise in health-related inactivity during the Covid-19 pandemic amongst this group is concentrated amongst those who have been out of the labour force for at least five years. Of the 1.1 percentage point increase in the fraction of 50-64 year olds who are inactive for health related reasons, 0.8ppt (73%) of that rise has been amongst people who have not worked in at least five years. The figure also shows that an additional 0.7% of the 50-64 year old population is economically inactive due to being retired compared to the end of 2019. An equivalent graph to this, for all 16-64 year olds, included here as an Appendix graph, shows that the same story is true when looking at the whole working-age population.
Figure 1. Proportion of 50-64 year olds who are retired, or are inactive due to long-term sickness or disability, split by whether they have been in paid work within the last five years
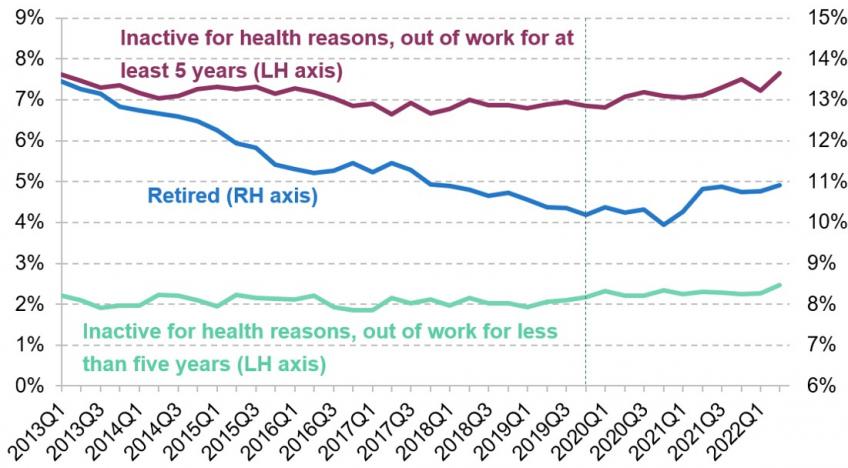
Note: Vertical line at 2019Q4 indicates the/ last quarter unaffected by the COVID-19 pandemic.
Source: IFS calculations using the Labour Force Survey.
This trend has important implications. If the rise in health-related inactivity is predominantly amongst those who have not recently left the labour force, then worsening health cannot be the key explanation for the increase in movements out of the labour force and into economic inactivity during the pandemic.
It implies, instead, that movements directly out of employment and into inactivity have been to a greater extent into other forms of inactivity, such as retirement. At the same time, it implies that there have been increasing levels of ill-health amongst those who have been out of work for an extended period of time.
Movements out of employment and into economic inactivity for older people
The results above confirm what was shown in our report published in June using longitudinal Labour Force Survey data, where a particularly large increase in flows out of employment into retirement was documented.
It could, of course, be the case that, since inactive people are getting sicker, fewer people leave inactivity for employment than was the case pre-pandemic, and this reduction in outflows from inactivity is driving the overall increase in levels of inactivity. When looking at flows in and out of inactivity, though, we can see that it seems to be moves directly from employment into inactivity which are driving the increase in the stock of inactive people, at least amongst those aged 50–64.
Figure 2 shows flows into and out of inactivity between quarters, from unemployment and employment, using the longitudinal LFS. 59% of the increase in the two years since the pandemic, compared with the six months before the pandemic, was driven by movements from employment directly into economic inactivity. A further 31% was driven by increased movements from unemployment into inactivity. While flows out of inactivity into employment have declined somewhat (represented by the blue dotted line in Figure 2), they have not been a key driver of the change in rate of economic inactivity amongst this age group.
Figure 2. Flows between employment and inactivity, and between unemployment and inactivity over the course of three months, among 50-64 year olds
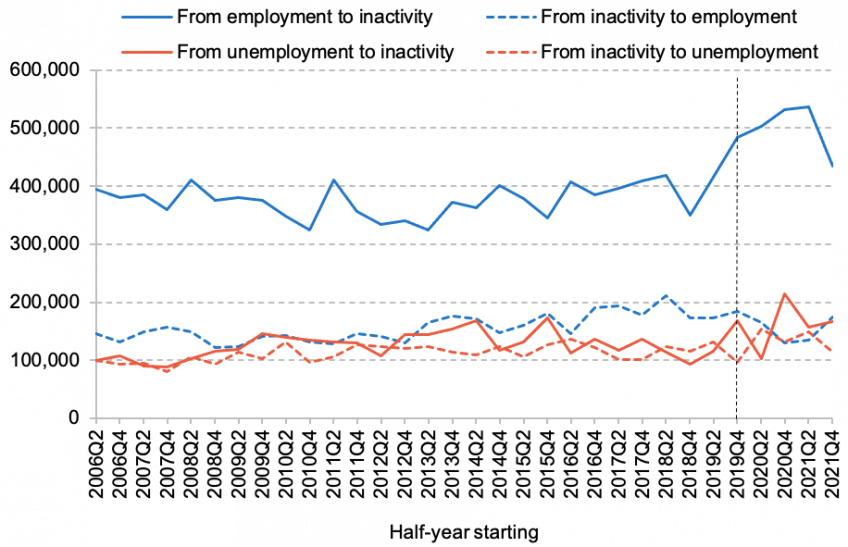
Note: The vertical line indicates the first half-year period affected by Covid-19
Source: Authors’ calculations using the longitudinal Labour Force Survey
A final piece of evidence, again using the longitudinal LFS, is that flows out of employment into health-related inactivity do not seem to have experienced a significant tick upwards during the pandemic. This backs up what Figure 1 showed using the cross-sectional LFS, in more granular detail (at the cost of a smaller sample size).
Figure 3 shows net flows out of employment to unemployment and different forms of inactivity for 50-64 year olds. It is these outflows from employment, as Figure 2 showed, that we should be most interested in when seeking to understand rising inactivity. While flows to health-related inactivity do not seem to have changed much since the start of the pandemic, flows into retirement and “other” forms of inactivity have both increased markedly during the pandemic.
Figure 3. Net flows out of employment to different sources over the course of three months, by half-year, among 50-64 year olds
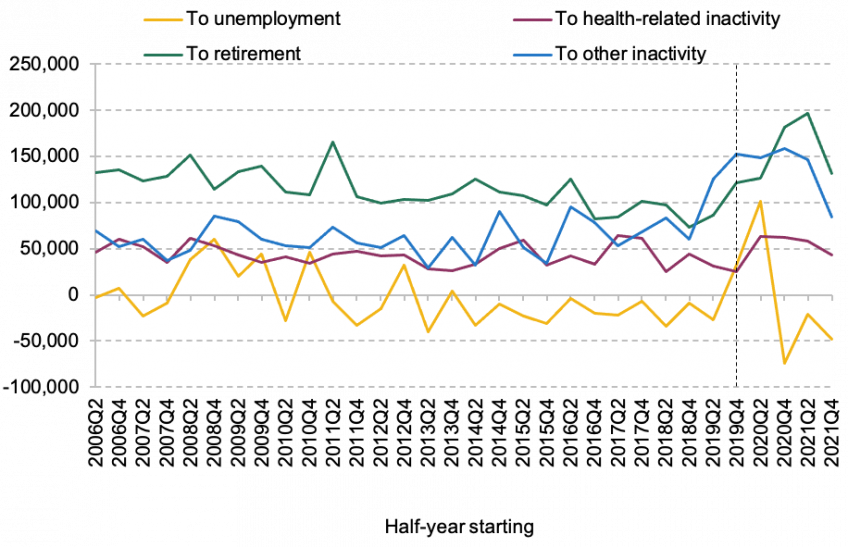
Note: The vertical line indicates the first half-year period affected by Covid-19
Source: Authors’ calculations using the longitudinal Labour Force Survey
Summary
When looking at only the cross-sectional data, it is tempting to conclude that deteriorating health amongst the older population has been the key reason for higher levels of economic inactivity and lower levels of employment. A closer look at the data suggests that in fact there seem to be two distinct issues at stake: increasing levels of ill-health amongst the older non-working population (which is concerning as an issue in its own right), and increased levels of inactivity driven in large part by people leaving work for non-health related reasons – in particular because they have decided to retire.
Appendix Figure 1. Proportion of the 16-64 population that is economically inactive for different reasons

Note: Vertical line at 2019Q4 indicates the last quarter unaffected by the COVID-19 pandemic.
Source: IFS calculations using the Labour Force Survey.
Appendix Figure 2. Proportion of 16-64 year olds who are inactive due to long-term sickness or disability, split by whether they have been in paid work within the last five years
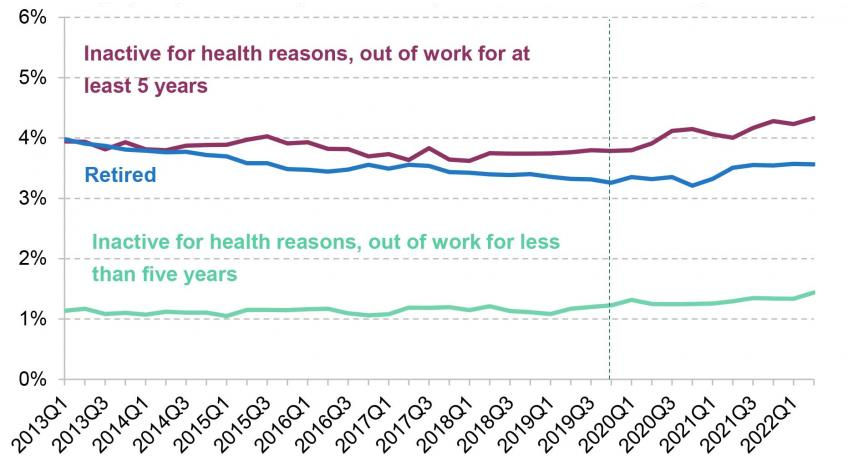
Note: Vertical line at 2019Q4 indicates the last quarter unaffected by the COVID-19 pandemic.
Source: IFS calculations using the Labour Force Survey.
This work was funded by the Fund for International Collaboration (FIC) and by ESRC on behalf of UKRI (grant reference ES/W01159X/1).
Authors

Jonathan Cribb
Jonathan is an Associate Director and Head of Retirement, Savings and Ageing sector, focusing on pensions, savings and later-life economic activity.

Bee Boileau
Bee joined the IFS in 2021 as a Research Economist and works in the Retirement, Saving and Ageing sector.
More from IFS
Understand this issue


Policy analysis


Academic research


