
Downloads

Download the report as PDF
PDF | 677.81 KB
This report was updated in October 2025 to better account for the changing nature of the UKHLS sample and to improve measurement of disability benefit receipt. This slightly changes the UKHLS datapoints in the figures. See footnote 4 for more detail.
Executive summary
Since the COVID-19 pandemic, there has been a significant rise in the number of people getting health-related benefits. In England and Wales, 4 million 16- to 64-year-olds (1 in 10) now claim either disability or incapacity benefits, up from 2.8 million in 2019 (1 in 13). One potential contributor to these trends is worsening health. In this report, we consider what we can learn from various sources about what has happened to working-age health since the pandemic, taking into account the difficulties surveys have had over the past few years.
Key findings
- More than half of the rise in 16- to 64-year-olds claiming disability benefits since the pandemic is due to more claims relating to mental health or behavioural conditions. 1.3 million people claim disability benefits primarily for mental health or behavioural conditions – 44% of all claimants. A recent DWP survey suggests 86% of incapacity and disability benefit claimants report having a mental health condition (even if it is not their primary condition).
- Mental health conditions are becoming more common amongst the working-age population. 13–15% of the working-age population reported a long-term mental or behavioural health condition in the latest data, up from 8–10% in the mid 2010s. The rise in people reporting mental health conditions holds across a wide range of surveys. In most surveys, the increase in reported mental health conditions is a continuation of the pre-pandemic trend rather than a rapid worsening following the pandemic. Worsening mental health can help explain the rise in disability benefit claims, but the nature of the trend – a consistent rise – suggests it is unlikely to be the sole explanation for observed disability benefit trends, which were relatively stable before rising rapidly post-pandemic.
- Working-age mortality rates have consistently remained above their pre-pandemic levels since 2020. Mortality rates provide another source of information on changing population health, and they help corroborate self-reported health measures from surveys. In 2024, the working-age mortality rate was 1.5% above the 2015–19 average – equal to 1,200 additional deaths after adjusting for changing population size and age. In 2023 (the latest year with data on cause of death), the mortality rate was 5.5% above the 2015–19 average – equivalent to 4,400 additional deaths. Most of the additional deaths were ‘deaths of despair’ – deaths due to alcohol, suicide or drugs. After adjusting for changing population size and ageing, there were 3,700 (24%) more working-age ‘deaths of despair’ in 2023 than the 2015–19 average. People with mental health conditions are at much higher risk of ‘deaths of despair’, so the rise in these deaths is consistent with an increase in (severe) mental health problems.
- 36% more people were in contact with mental health services in 2024 than in 2019 (based on areas of England with consistent data). Overall, 2 million people (0.6 million children and 1.4 million adults) were in contact with mental health services at the end of December 2024. This includes people waiting for care. Since 2019, there has also been a 12% increase in the number of people in England receiving antidepressants. This rise partly reflects NHS actions to improve access to mental health care but is also consistent with rising incidence of mental health problems.
- There is disagreement between surveys on how the total number of people with health conditions has changed since 2019. Some high-profile analysis has suggested that there has been no rise in the share of working-age adults with long-term health conditions. This analysis relies on surveys that do not show the sharp increase in people claiming disability benefits since 2019 – in contradiction to what we know has happened from administrative data. This raises questions around how accurately these surveys are capturing the health of the population overall. Surveys that do show the rise in people claiming disability benefits since 2019 – the Labour Force Survey and the Family Resources Survey – also show a rise in people with long-term health conditions and a rise in people with physical health conditions. However, both these sources have seen big falls in the share of people surveyed who respond since the pandemic, which suggests some caution in interpreting their results too.
- Sickness absence days per worker were 37% higher in 2022 than in 2019. Looking at changes between 2019 and 2023 for public sector workers in particular – where better-quality data are available – confirms this trend. Sickness absence rates increased by 29% for teachers, 19% in the Civil Service and 14% in the NHS over this period. Changing population health may not be the only driver of the increase in sickness absence rates, but this does provide further evidence to support the argument that population health has worsened.
1. Introduction
In the UK, there are two broad types of health-related benefits, aimed at supporting people in poor health. Incapacity benefits supplement incomes for someone whose health limits their ability to work. They are mostly means-tested (only available to adults in low-income families). Under universal credit (UC), claimants assessed to have ‘limited capability for work-related activity’ receive an additional £4,990 a year on top of the rest of their UC award and are exempted from requirements to look for a job. Those assessed as having a ‘limited capability for work’ – indicating a less severe incapacity – do not receive additional support but are exempted from some job-search requirements. Disability benefits supplement incomes for people whose disability increases their costs. The main working-age disability benefit is personal independence payment. It is not means-tested and provides support of £1,500–£9,610 a year. Eligibility and the level of support depend on an assessment of the applicant’s ability to do a range of tasks.
In 2023–24, the UK government spent £48 billion on working-age health-related benefits. This is 1.7% of GDP and £12 billion more in real terms than it spent on them in 2019–20. Official forecasts from the Office for Budget Responsibility (OBR) suggest that spending on health-related benefits will grow further in real terms to £67 billion in 2029–30.1
These recent spending increases are accounted for by a significant rise in the number of people claiming these benefits. In England and Wales, 4 million working-age adults (1 in 10) now claim either disability or incapacity benefits, up from 2.8 million in 2019 (1 in 13).2
There has been a lively debate about the underlying causes for the rising number of people claiming health-related benefits and out of work due to ill health.3 Three potential causes have been most discussed: first, a long-run worsening in health potentially partly related to the COVID-19 pandemic; second, falling real incomes due to rising energy prices in 2022; and third, the nature of the UK’s welfare state, and specifically the benefit system. In previous work, we found that the post-pandemic rise in health-related benefit claims was almost unique to the UK; nearly all similar countries have not seen a similar rise in claims. This suggests that common shocks such as the pandemic or the energy price rise are, at least on their own, unlikely to be the full explanation.
In this report, we focus on the role that changing population health might be playing in rising health-related benefit claims. We combine administrative benefits data, self-reported health in surveys, mortality and healthcare usage to explore changing population health. We pay particular attention to what we can learn from surveys given that, across the board, surveys have had significant difficulties since the pandemic.
Most of the following analysis will focus on disability (rather than incapacity) benefits in England and Wales (rather than all GB or UK). We do this for two reasons. First, the rise in disability benefits has been notably sharper than that seen for incapacity benefits. Second, the data quality is better for disability benefits than for incapacity benefits and is better in England and Wales than elsewhere in the UK. Scotland began rolling out its own disability benefits in 2022, which makes it harder to interpret changes over time there. For a detailed discussion of disability benefits in Scotland, see Ray-Chaudhuri and Waters (2024).
Given that we know from administrative benefits data that there has been a sharp rise in the number of people receiving disability benefits since the pandemic, the report begins by examining whether that rise is seen in surveys. With that in mind, we then go on to examine what those surveys tell us about the health of the population, before finally examining wider evidence on health such as mortality and healthcare usage.
2. Do surveys show the rise in disability benefits?
We want to explore what role changing population health is playing in rising disability benefit claims. We can use a range of surveys to answer this question. Before exploring what surveys say about population health, we benchmark them against the administrative data on disability benefits. For a survey to help us answer our key question, it needs to show the rise in disability benefit claims.
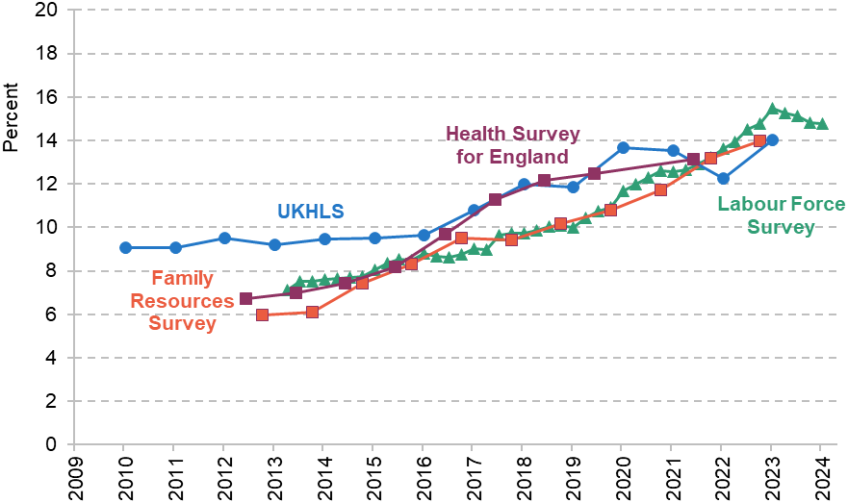
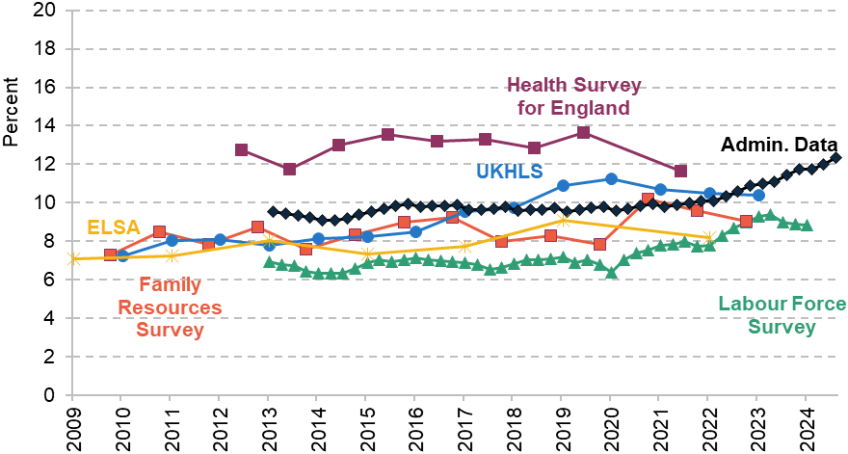
Figure 1 shows the share of 16- to 64-year-olds who claim disability benefits across different sources. The black line is the administrative data. It shows that from 2009 to 2019, the disability benefit caseload grew slightly from 4.9% to 5.4% of 16- to 64-year-olds. From 2019 to 2024, it then increased rapidly, to 7.5%. The other four lines show the equivalent figures according to four alternative surveys. The Labour Force Survey (LFS) and Family Resources Survey (FRS) broadly match the trend of the administrative data (if from a lower base level), whereas the UK Household Longitudinal Study (UKHLS)4 and the Health Survey for England (HSE) do not. The HSE does not show any significant increase in the disability benefits caseload post-pandemic (note that the HSE data measure the share of working-age individuals living in a household where someone gets a disability benefit – and hence shows a higher rate than the other surveys or administrative data). The UKHLS does show an increase in the share of population claiming disability benefits since the pandemic, but this increase is in line with the prior trend, unlike the administrative data which shows a sharp acceleration in claims from 2021 onwards. Figure A1 in the appendix shows the equivalent for 55- to 64-year-olds with data from the English Longitudinal Survey of Ageing (ELSA) added. ELSA also does not show the increase in the disability benefits caseload. It is difficult to see how one could confidently use these surveys to explain the rise in health-related benefit claims, if they do not even capture the pattern of increasing disability benefit claims.
Figure 1. Percentage of 16- to 64-year-olds claiming disability benefits in different sources
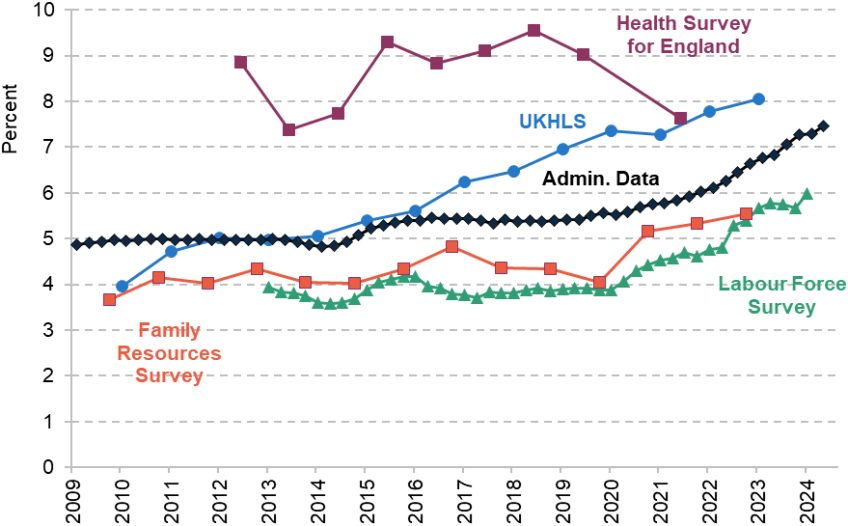
Note: Data cover England and Wales for all sources other than the Health Survey for England, which only covers England. Health Survey for England data include anyone in a household with someone claiming disability benefits, whereas other sources are just for individuals who claim disability benefits themselves.
Source: Authors’ calculations using DWP Stat-Xplore, Health Survey for England, UK Household Longitudinal Study (UKHLS), Family Resources Survey and Labour Force Survey.
While the LFS and FRS appear better calibrated to disability benefit claims, there are other concerns about both sources. The response rate – the percentage of people approached who provide a response – has fallen notably for both sources. The response rate in the LFS fell from 39% to 19% between 2019 and 2024; in the FRS, the fall (between 2019–20 and 2022–23) was from 49% to 25%. The LFS also appears to have diverged from the administrative data on overall employment (Corlett, 2024). So, while the LFS and FRS can be more credibly used to explain the rise in health-related benefit claims, there is still reason for caution around their results.
We should be particularly cautious in interpreting the magnitude of changes in the LFS and FRS. While both surveys show a similar percentage point increase in disability benefit claims to the administrative data, they do so from a lower base. This means that in percentage terms, they overstate the increase in disability benefit claims (between 2019 and 2022, the LFS and FRS suggest disability benefit claims grew by 38% and 36%, compared with 22% in administrative data). This may lead them to similarly overstating changes in population health, even if they are directionally correct.
Taken together, this leaves us – and indeed the government, as it tries to respond to this issue – in a difficult position. Three of these surveys do not capture the increase in disability benefit claims – and so, in our view, are not suitable to use in explaining the rise – and there are reasonable concerns about the other two. In the following analysis, we will compare the results from different surveys (where data are available) with due caution given each of their weaknesses. We will then also look at what we can learn from alternative data sources, such as the Census, mortality figures and healthcare usage.
3. Are more people reporting health problems?
With the previous section (and its resulting caveats) in mind, we now turn to what we can learn from surveys about the health of the working-age population.
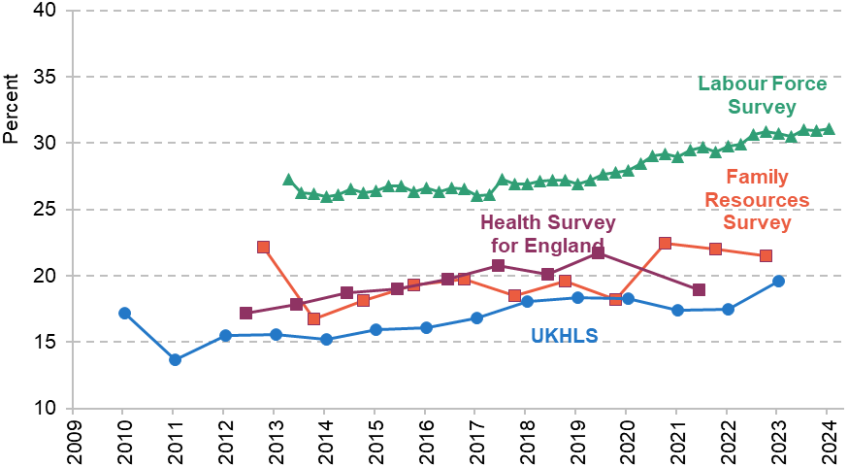
Figure 2 shows the percentage of 16- to 64-year-olds who report a health condition that has lasted 12 months or longer in four different surveys. As has been shown in previous work (Burn-Murdoch, 2024), the HSE and UKHLS show no increase in the incidence of long-term health conditions since the pandemic. However, given that these surveys do not capture the acceleration in disability benefit claims post-pandemic, we do not think that they provide a reliable source for understanding changing health amongst people claiming disability benefits.
Figure 2. Percentage of 16- to 64-year-olds with long-term health conditions
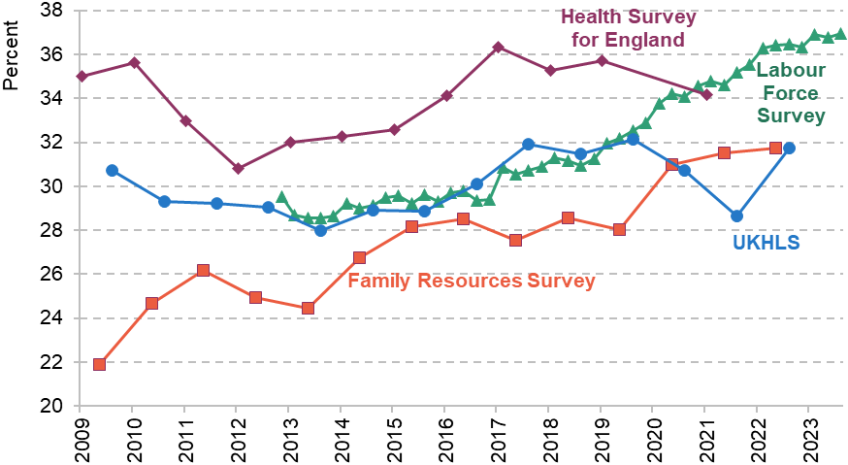
Note: Data cover England and Wales for all sources other than Health Survey for England, which only covers England.
Source: Authors’ calculations using DWP Stat-Xplore, Health Survey for England, UK Household Longitudinal Study (UKHLS), Family Resources Survey and Labour Force Survey.
In contrast, the FRS and LFS – both of which capture the rise in health-related benefit claims – show significant growth in the number of people reporting long-term health conditions since 2019 – from 28% to 32% in the FRS and from 31% to 36% in the LFS.5 We see a similar divergence between sources if we focus only on people with a long-term health condition that limits their day-to-day activities a lot (see Figures A2 and A3 in the appendix).
The Census provides an alternative source of information about population health. Importantly, it has fewer potential issues around non-response than surveys, since an estimated 97% of the population completed the 2021 Census in England and Wales. Census respondents are asked to score their health on a five-point scale from ‘very good’ to ‘very bad’. Figure 3 shows the change in population in England and Wales reporting ‘bad’ or ‘very bad’ health from 2011 to 2021 by age group. It suggests a relatively positive picture – the share of people reporting being in bad or very bad health amongst 15- to 64-year-olds declined from 4.5% to 4.3% over the period.6 There was variation across ages, with more people between 15 and 34 reporting being in bad or very bad health and fewer people over 35 reporting being in bad or very bad health. This relative shift in ill health towards young people matches the increased share of health-related benefit claims amongst young people. However, the falling number of people in bad health in the Census is harder to reconcile with the growth in people reporting health conditions in other surveys.
Figure 3. Percentage of population reporting being in bad or very bad health, 2011 and 2021, England and Wales
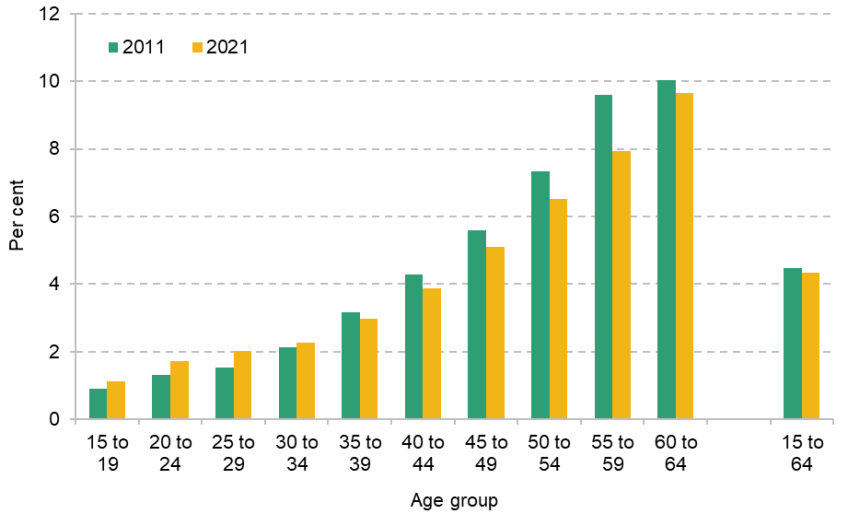
Source: Authors’ calculations using Census 2011 and Census 2021.
As with the surveys, several caveats are important to keep in mind here. First, the large rise in health-related benefit claims only occurred from late 2021 onwards, whereas the Census took place in April 2021. It is possible that any long-run impacts of the COVID-19 pandemic on health only started to become visible after the Census was collected. Second, it is possible that the pandemic caused people to report their health differently – people may have assessed their health more positively in 2021 as they were comparing themselves with people ill with COVID-19. Notably, in Scotland, where the Census was completed in 2022 rather than 2021, the share of 16- to 64-year-olds reporting being in bad health rose, from 5% in 2011 to 6% in 2022, in contrast to the 2011–21 decline in this measure in England and Wales. This could be due to underlying differences between Scotland and England & Wales but could also be due to the later survey year in Scotland relative to England and Wales. Third, the Census question we examine here simply asks ‘how is your general health?’.7 This contrasts to survey questions, which generally ask about ‘physical or mental health conditions’, or similar. It is possible that Census respondents interpret ‘health in general’ as referring primarily to physical rather than mental health. As we shall see shortly, there is much stronger evidence of worsening mental health than of declining physical health.
4. The changing nature of ill health
Alongside the rise in disability benefit claims, there has been a shift in the main condition of claimants. Figure 4 shows the share of 16- to 64-year-olds claiming disability benefits by the main condition that they give for claiming. In 2002, mental and behavioural problems were the main condition for 25% of claimants, representing 1.1% of the working-age population. This figure had risen to 40% by 2019 (or 2.2% of the working-age population). Since the pandemic, it has accelerated further; in 2024, the share of claimants with a mental or behavioural problem as their main condition had risen to 44% (or 3.3% of the working-age population), meaning that 55% of the post-pandemic rise in disability benefits can be accounted for by claims primarily for mental health. Disability benefit claimants report a range of mental health and behavioural conditions, but the most common are anxiety and depressive disorders, mood disorders, psychotic disorders, learning disabilities and autism spectrum. Since 2019, there has been particularly fast growth in new disability benefit claims for learning disability and autism spectrum claims (Latimer, Pflanz and Waters, 2024).
Figure 4. Percentage of 16- to 64-year-olds claiming disability benefits, by main condition, England and Wales
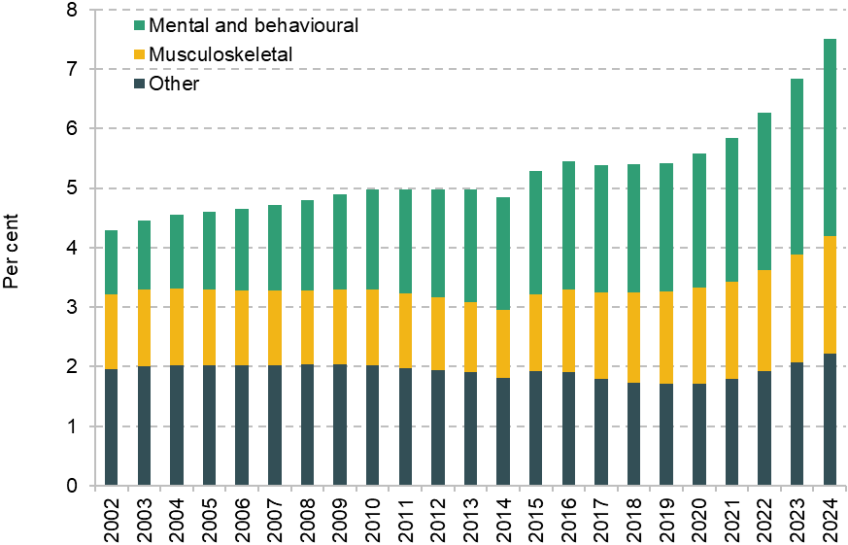
Source: Authors’ calculations using data on disability living allowance and personal independence payment from Stat-Xplore and latest ONS population estimates and projections.
Just looking at ‘main conditions’ can in fact understate the importance of mental health. A recent DWP survey found that 86% of health-related benefit claimants reported having a mental health condition even if it was not their main condition (Department for Work and Pensions, 2025).
The rising share of disability benefit claims relating to mental health mirrors the rising incidence of mental health problems in society at large. Figure 5 shows the share of people who report a mental health condition across the same four surveys discussed above. On this issue, all four surveys show a similar steady upward trend in the share of people reporting mental or behavioural health conditions – though the post-pandemic period does not look exceptional relative to earlier trends, unlike for the disability benefit caseload.
Figure 5. Percentage of 16- to 64-year-olds with a long-term mental or behavioural health condition, based on different surveys
Note: All figures are for everyone in England and Wales, other than the Health Survey for England which just covers England. UKHLS figures include anyone who reports a long-standing condition and who has a GHQ-12 caseness score of 4 or higher. (This threshold has commonly been used by researchers (Goldberg and Williams, 1988; Zixin Li and Wang, 2020) and has been used by the NHS.) Other survey measures include anyone who reports a long-standing condition that affects their mental health or learning or affects them socially and behaviourally. Note that people can report both mental health conditions and physical health conditions. For more details, see Table A1 in the appendix.
Source: Authors’ calculations using DWP Stat-Xplore, Health Survey for England, UK Household Longitudinal Study (UKHLS), Family Resources Survey and Labour Force Survey.
A natural question about survey evidence in this area is whether the rise in reported poor mental health reflects a genuine increase in prevalence or a change in stigma and attitudes that makes respondents more willing to disclose such conditions. We cannot rule that out, though it is worth noting that such changes might also lead someone with a mental health problem to be more likely to seek out support through the benefit system too. We will shortly turn to wider evidence on mental health problems.
Figure 6 examines the share of the working-age population with physical or unspecified health conditions (the latter of which accounts for the LFS having a considerably higher rate than the other surveys). Here we see disagreement in trends between the surveys returning: the LFS and FRS show more people reporting physical health conditions, whereas the HSE and UKHLS do not. Again, we caution against the use of HSE and UKHLS in trying to understand the rise in the disability benefit caseload, but also remind the reader that the LFS and FRS have their own problems too.
Figure 6. Percentage of 16- to 64-year-olds reporting a physical or unspecified health condition, in different surveys
Note: All figures are for everyone in England and Wales, other than the Health Survey for England which just covers England. UKHLS figures include anyone who reports a long-standing condition and who has a physical component score of 50 or lower in the SF-12 questionnaire. Other survey measures include anyone who reports a long-standing condition that affects them in ways other than mental and behavioural; this does include an ‘other’ category. Note that people can report both mental health conditions and physical health conditions. For more details, see Table A1 in the appendix.
Source: Authors’ calculations using DWP Stat-Xplore, Health Survey for England, UK Household Longitudinal Study (UKHLS), Family Resources Survey and Labour Force Survey.
While we get a relatively consistent picture for mental health, the survey evidence on physical health is less satisfying. With this in mind, we turn to other evidence on changing population health.
5. Other evidence on changing population health
If surveys of self-reported health do not provide a clear picture of changing population health and the role it might play in the rising health-related benefits caseload, are there other data sources that can help fill the gap?
One additional source of information on population health is mortality rates. Mortality rates are helpful as they are objective measures of health and are not subject to the issues of sampling and measurement that surveys face. Of course, one key limitation is that they only reflect the most serious health conditions and so may not capture changes to people’s health that are not serious enough to cause death.
The mortality rate for 15- to 64-year-olds has remained above the pre-pandemic average since 2020.8 Figure 7 shows the percentage change in mortality rates for different age groups relative to the 2015–19 average in different years since 2020. The mortality rate was at least 10% higher than pre-pandemic in 2020 and 2021, partly due to the deaths directly caused by COVID-19. However, since then, the mortality rate has remained heightened, despite big reductions in deaths related to COVID-19. This contrasts with overall mortality rates and mortality rates for older people, which are now below pre-pandemic levels. This suggests that either the indirect effects of the pandemic or other factors have kept mortality rates for the working-age population high.
Figure 7. Percentage change in mortality rates relative to 2015–19 average
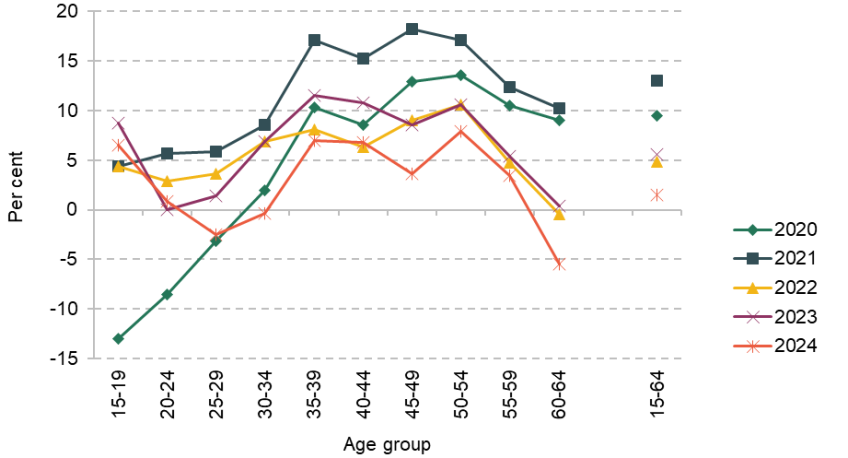
Note: Figures for England and Wales only. Figures for aggregate 15–64 group are based on an age-standardised average, which holds the share of population in each five-year age group constant.
Source: Authors’ calculations using latest ONS mortality and population data.
Figure 8 breaks down the change in mortality rate by age and cause of death, comparing 2023 (latest data available) with the 2015–19 average. It shows that most of the 5.5% rise in mortality rates for 15- to 64-year-olds is due to more deaths by alcohol, drugs and suicide, often grouped as ‘deaths of despair’.9 The figures for alcohol-specific deaths are the most striking. After adjusting for a changing population, the number of alcohol-specific deaths was 1,600 (36%) above the 2015–19 average for 15- to 64-year-olds in England and Wales.10 People with mental health conditions are at much higher risk of ‘deaths of despair’ (Moustgaard et al., 2022; van Draanen et al., 2022; Puddephat et al., 2022), and so the rise in these deaths provides some evidence of an increase in the incidence of (severe) mental health problems.
Figure 8. Change in deaths per 100,000 population in 2023 relative to 2015–19 average, by cause of death
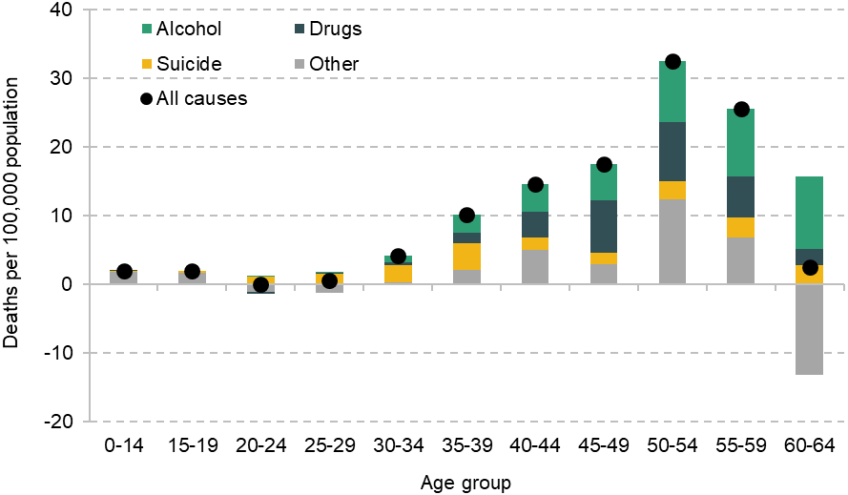
Note: Deaths are grouped on ICD-10 codes. We use the same definitions as ONS alcohol-specific deaths, drug-related deaths and suicide publications. Deaths that count as both alcohol/drugs death and suicide are allocated to suicide.
Source: Authors’ calculations using latest ONS mortality and population data.
Another potential source of data on changing population health is data on healthcare usage. One key difficulty with these data is separating the role of changing treatment practices and capacity from changing need for healthcare. Nevertheless, two key trends are worth mentioning.
First, there has been a large increase in the number of people in contact with mental health services. The latest figures suggest that there were 2 million people – 1.4 million adults and 0.6 million children – in contact with mental health services at the end of December 2024. This includes anyone with an open referral to mental health services, including those still waiting for treatment. Focusing on areas with comparable data over time, there has been a 36% increase in the number of people in contact with mental health services since 2019. There were also 8.7 million people receiving antidepressants from NHS England in 2023, up 12% from 7.8 million in 2019. While these trends will no doubt be in part driven by the NHS’s stated ambition to improve access to mental health care, they are also consistent with the rising incidence of mental health problems across the population that we observe in surveys and amongst disability benefit claimants.
Second, there has been a big rise in the number of people on hospital waiting lists since 2019 (Warner and Zaranko, 2024). This indicates that there are more people who the NHS assesses to have unmet healthcare needs, which may be playing some role in the rise in the health-related benefits caseload. Future work at IFS will examine the role of higher waiting lists and waiting times on the health-related benefits caseload in the coming months.
We can also potentially learn something about population health by looking at sickness absences from work. Figure 9 shows average sickness absence rates across different groups of workers. The latest figures for the whole economy suggest that in 2022 sickness absence rates were significantly above pre-pandemic levels. The whole economy figures rely on the LFS, though, so they should be interpreted with caution (as discussed above). Reassuringly, we see similar trends for public sector workers where administrative data are available. This gives us some confidence that sickness absences have increased since the pandemic. The NHS publishes data on specific illnesses that workers report for their sickness absences. These show that absences for physical and mental health have grown at an equal pace, pointing towards a worsening in both physical and mental health. Changing population health may not be the only driver of the increase in sickness absence rates, but this does provide some further evidence to support the argument that population health has worsened.
Figure 9. Average sickness absence rates for selected groups
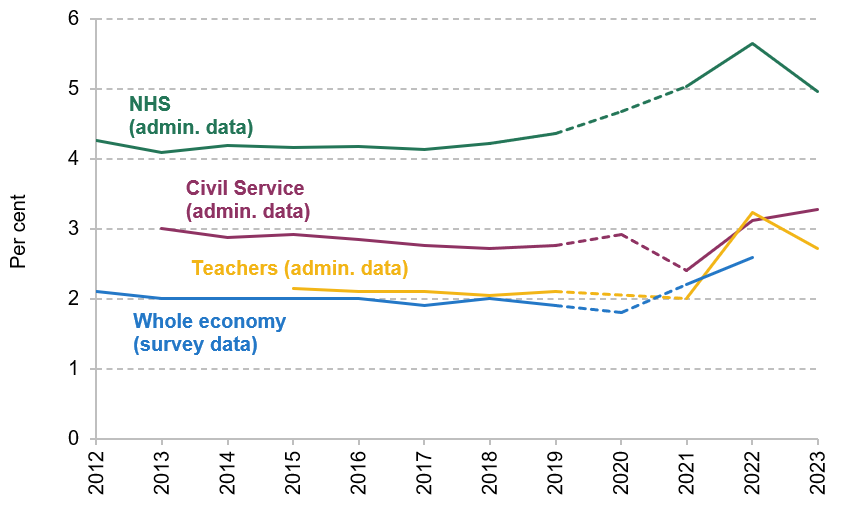
Note: Absence rates reflect average days taken off within a year divided by working days in a year. A typical year includes 254 working days for civil servants and 195 for teachers. Figures for teachers in a given year reflect the academic year ending that year. Points in 2020 and 2021 are marked with a dotted line. Caution should be used in interpreting these figures as the COVID-19 pandemic and furlough scheme both affected how sickness absences were reported.
Source: Authors’ calculations using NHS England data (https://digital.nhs.uk/data-and-information/publications/statistical/nhs-sickness-absence-rates), Department for Education data (https://explore-education-statistics.service.gov.uk/data-catalogue/data-set/dceb4f97-4c1c-45b7-aa18-0fc8a8262f50), Civil Service sickness absence report (https://www.gov.uk/government/publications/civil-service-sickness-absence-2024/civil-service-sickness-absence-2024-report) and ONS.
6. Conclusion
The rise in health-related benefit claims has perhaps been the most striking aspect of the post-pandemic welfare landscape. Nonetheless, there is little consensus on what role worsening health has played in the rise. We have systematically explored a range of surveys and other sources to try to throw light on this debate. In some areas, we have found a clearer picture; in others, the evidence is more mixed.
We have found compelling evidence that mental health has worsened since the pandemic: more people are reporting mental health conditions in a range of surveys, a growing share of disability benefit claims are for mental health, there has been an increase in ‘deaths of despair’, and more people are in contact with NHS mental health services. While none of these pieces of evidence is dispositive, they all point in the same direction, suggesting that deterioration in mental health is playing some role in the rising number of people claiming health-related benefits.
On physical health, the evidence is less clear, with the surveys giving a mixed picture. Nonetheless, those surveys whose respondents do not seem to be any more likely to claim disability benefits today than they were in 2019 cannot be relied upon to shed much light on what is behind the observed rise in caseload. At a minimum, the evidence is certainly not there to rule out deteriorating health as a contributing factor to the rise in people claiming health-related benefits.
Appendix
Figure A1. Percentage of 55- to 64-year-olds claiming disability benefits in different sources
Note: Data cover England and Wales for all sources other than the Health Survey for England and ELSA, which only cover England. Health Survey for England data include anyone in a household with someone claiming disability benefits, whereas other sources are just for individuals who claim disability benefits themselves.
Source: Authors’ calculations using DWP Stat-Xplore, Health Survey for England, UK Household Longitudinal Study (UKHLS), English Longitudinal Survey of Ageing (ELSA), Family Resources Survey and Labour Force Survey.
Figure A2. Percentage of 16- to 64-year-olds whose health condition limits their day-to-day activities a lot

Note: Data cover England and Wales.
Source: Authors’ calculations using DWP Stat-Xplore, UK Household Longitudinal Study (UKHLS), Family Resources Survey and Labour Force Survey.
Figure A3. Percentage of 55- to 64-year-olds whose health condition limits their day-to-day activities a lot

Note: Data cover England and Wales for all sources other than the Health Survey for England and ELSA, which only cover England. ELSA measure is those with ‘severe’ health problems based on an index similar to the measure used in Banks, Blundell and Emmerson (2015). This is a different measure from other measures shown here, which may explain the difference in levels, but we would expect it to change over time in similar way to other measures.
Source: Authors’ calculations using DWP Stat-Xplore, Health Survey for England, UK Household Longitudinal Study (UKHLS), English Longitudinal Survey of Ageing (ELSA), Family Resources Survey and Labour Force Survey.
Table A1. Definitions of long-term physical and mental health conditions in different sources
Source | Definition of long-term health condition | Definition of long-term mental or behavioural health condition | Definition of long-term physical or unspecified condition |
Labour Force Survey | Health condition / illness lasting 12 months or longer. | Long-term health condition included within the following list: ‘autism’; ‘mental illness or suffer from phobia, panics or other nervous disorders’; ‘depression, bad nerves or anxiety’; ‘severe or specific learning difficulties’. | Long-term health condition relating to a condition other than those included within mental or behavioural condition. Includes people who report having ‘other health problems or disabilities’. |
Family Resources Survey | Health condition / illness lasting 12 months or longer. | Long-term health condition and report one of the following difficulties relating to health condition: ‘difficulty with learning’; ‘difficulty with mental health’. | Long-term health condition and report a difficulty relating to health condition other than those included within mental or behavioural condition. Includes ‘difficulty with other aspect of life’. |
UK Household Longitudinal Study | Health condition / illness lasting 12 months or longer. | Long-term health condition and GHQ-12 caseness score of 4 or higher. A commonly used threshold to indicate mental health condition (Goldberg and Williams, 1988; Zixin Li and Wang, 2020). | Long-term health condition and physical component score from SF-12 survey of 50 or lower. Shows similar trend when using different thresholds. |
Health Survey for England | Health condition / illness lasting 12 months or longer. | Long-term health condition that affects ‘mental health’ or ‘learning or understanding or concentration’. | Long-term health condition that affects other elements of health: e.g. ‘vision’, ‘mobility’, ‘other’. |
English Longitudinal Study of Ageing | Anyone with ‘severe’ health problems, based on Boileau and Cribb (forthcoming). Differs from other measures, although expected to change in similar way over time. |
|
|
References
Banks, J., Blundell, R. and Emmerson, C., 2015. Disability benefit receipt and reform: reconciling trends in the United Kingdom. Journal of Economic Perspectives, 29(2), 173–90, https://doi.org/10.1257/jep.29.2.173.
Burn-Murdoch, J., 2024. What if the UK isn’t actually the sick man of Europe? Financial Times, 6 December, https://www.ft.com/content/1409c952-28c0-4a3f-be90-493234a949b2.
Corlett, A., 2024. Get Britain’s stats working: exploring alternatives to Labour Force Survey estimates. Resolution Foundation, https://www.resolutionfoundation.org/publications/get-britains-stats-working/.
Department for Work and Pensions, 2025. Work aspirations and support needs of health and disability customers: interim findings. https://www.gov.uk/government/publications/work-aspirations-and-support-needs-of-health-and-disability-customers.
Goldberg, D. P. and Williams, P., 1988. A User’s Guide to the General Health Questionnaire. NFER–Nelson.
Health Foundation, 2024. Towards a healthier workforce: interim report of the Commission for Healthier Working Lives. https://www.health.org.uk/reports-and-analysis/reports/towards-a-healthier-workforce.
House of Lords Economic Affairs Committee, 2025. Letter from the Chair of the Economic Affairs Committee to the Rt Hon Liz Kendall MP Secretary of State for Work and Pensions. 20 January, https://committees.parliament.uk/publications/46296/documents/232987/default/.
Judge, L. and Murphy, L., 2024. Under strain: investigating trends in working-age disability and incapacity benefits. Resolution Foundation, Briefing, https://www.resolutionfoundation.org/app/uploads/2024/06/20-Under-strain.pdf.
Latimer, E., Pflanz, F. and Waters, T., 2024. Health-related benefit claims post-pandemic: UK trends and global context. IFS Report, https://ifs.org.uk/publications/health-related-benefit-claims-post-pandemic-uk-trends-and-global-context.
Moustgaard, H., Tarkiainen, L., Oestergren, O., Korhonen, K., Zengarini, N., Costa, G. and Martikainen, P., 2022. The contribution of alcohol-related deaths to the life-expectancy gap between people with and without depression – a cross-country comparison. Drug and Alcohol Dependence, 238, 109547, https://doi.org/10.1016/j.drugalcdep.2022.109547.
Office for Budget Responsibility, 2024, Welfare trends report: October 2024. https://obr.uk/wtr/welfare-trends-report-october-2024/.
Porter, I., 2024. Unlocking benefits: tackling barriers for disabled people wanting to work. Joseph Rowntree Foundation, https://www.jrf.org.uk/work/unlocking-benefits-tackling-barriers-for-disabled-people-wanting-to-work.
Puddephatt, J. A., Irizar, P., Jones, A., Gage, S. H. and Goodwin, L., 2022. Associations of common mental disorder with alcohol use in the adult general population: a systematic review and meta-analysis. Addiction, 117, 1543–72, https://doi.org/10.1111/add.15735.
Ray-Chaudhuri, S. and Waters, T., 2024. What has happened to disability benefits in Scotland? An update. IFS Comment, https://ifs.org.uk/articles/what-has-happened-disability-benefits-scotland-update.
van Draanen, J., Tsang, C., Mitra, S., Phuong, V., Murakami, A., Karamouzian, M. and Richardson, L., 2022. Mental disorder and opioid overdose: a systematic review. Social Psychiatry and Psychiatric Epidemiology, 57, 647–71, https://doi.org/10.1007/s00127-021-02199-2.
Warner, M. and Zaranko, B., 2024. The past and future of NHS waiting lists in England. IFS Report, https://ifs.org.uk/publications/past-and-future-nhs-waiting-lists-england.
Zixin Li, L. and Wang, S., 2020. Prevalence and predictors of general psychiatric disorders and loneliness during COVID-19 in the United Kingdom. Psychiatry Research, 291, 113267, https://doi.org/10.1016/j.psychres.2020.113267.
Data
Banks, J., Batty, G. David, Breedvelt, J., Coughlin, K., Crawford, R., Marmot, M., Nazroo, J., Oldfield, Z., Steel, N., Steptoe, A., Wood, M., Zaninotto, P. (2025). English Longitudinal Study of Ageing: Waves 0-10, 1998-2023. [data collection]. 44th Edition. UK Data Service. SN: 5050, DOI: http://doi.org/10.5255/UKDA-SN-5050-31.
Department for Work and Pensions, NatCen Social Research. (2021). Family Resources Survey. [data series]. 4th Release. UK Data Service. SN: 200017, DOI: http://doi.org/10.5255/UKDA-Series-200017.
NatCen Social Research, University College London, Department of Epidemiology and Public Health. (2024). Health Survey for England. [data series]. 8th Release. UK Data Service. SN: 2000021, DOI: http://doi.org/10.5255/UKDA-Series-2000021.
Office for National Statistics. (2024). Labour Force Survey. [data series]. 11th Release. UK Data Service. SN: 2000026, DOI: http://doi.org/10.5255/UKDA-Series-2000026.
University of Essex, Institute for Social and Economic Research. (2025). Understanding Society: Waves 1-14, 2009-2023 and Harmonised BHPS: Waves 1-18, 1991-2009. [data collection]. 19th Edition. UK Data Service. SN: 6614, DOI: http://doi.org/10.5255/UKDA-SN-6614-20.
Acknowledgements
The authors gratefully acknowledge the support of the Joseph Rowntree Foundation (F240302M), the Health Foundation (FR-0006314) and the ESRC Centre for the Microeconomic Analysis of Public Policy (ES/T014334/1). The authors would like to thank David Finch, Paul Johnson and Iain Porter for providing comments on this report and Bee Boileau for additional data analysis.
Please note this report includes discussion of suicide. If you are having suicidal thoughts, support is available. You can call Samaritans any time on 116 123.
Endnotes
Authors

Eduin Latimer
Eduin is a Senior Research Economist in the Income, Work and Welfare sector. His research focuses on benefits policy and the low-paid labour market.

Sam Ray-Chaudhuri
Sam joined the IFS in 2022 and works as a research economist in the Income, Work and Welfare sector.

Tom Waters
Tom is an Associate Director at the IFS and Head of the Income, Work and Welfare sector.
More from IFS
Understand this issue


Policy analysis


Academic research


