
Downloads
Download report PDF
PDF | 1.23 MB
Foreword
This eighth annual report from the Institute for Fiscal Studies provides another authoritative picture of education spending in England at a time of significant change. While overall public spending on education remains close to historic lows as a share of national income, the demands on the system are anything but static. The government has set ambitious goals for opportunity and social mobility, but these commitments must be delivered against a backdrop of tight fiscal constraints and rising costs.
Demographic trends are reshaping pressures across the system. Falling pupil numbers in primary schools contrast with continued growth in student numbers in post-16 education and higher education, creating uneven challenges for budgets and infrastructure. These shifts present choices for policymakers. They must decide whether to use smaller numbers in some phases to make savings, or to reinvest in improving quality and reducing class sizes. At the same time, the expansion of early years entitlements represents one of the most significant policy shifts in a generation: transforming the scale of government support for childcare to enable parents to work, while raising questions about sustainability and the balance between universal and targeted provision.
Perhaps the most acute pressure lies in special educational needs and disabilities (SEND). Spending on high needs provision has almost doubled over the past decade, driven by rising numbers of pupils with Education, Health and Care Plans and shortages of places in state-funded special schools. The Office for Budget Responsibility forecasts a £6 billion gap between expected spending and funding by 2028–29. The White Paper on schools and SEND – likely to be published soon after this report – will be pivotal in determining whether reforms can slow this growth while improving provision for children with the greatest needs. Action will be essential: without it, these pressures risk crowding out resources for mainstream schools and constraining the system’s ability to deliver a broad, balanced and high-quality education for all.
Higher education faces its own set of challenges. The indexation of tuition fees and the planned reintroduction of maintenance grants will bring some relief for students, yet the long-term balance between public and private contributions remains contested. Meanwhile, further education and skills – long the relative loser in funding settlements – must adapt to new policy ambitions and rising demand.
This report, as with its predecessors, does more than track spending. It illuminates the hard choices policymakers face in aligning resources with priorities. It shows where funding growth is concentrated, where it falls short of costs, and how these patterns shape opportunities for children and young people. For those designing policy, the evidence here is indispensable. But it is also an invaluable resource for those involved in various ways in holding policymakers to account.
The Nuffield Foundation is proud to support this project as part of our overall mission to advance social well-being and create a fairer, more inclusive and more prosperous society. This requires an ambitious and well-functioning education system. These annual reports are part of a wider body of work, with regular deeper-dive reports collated on the programme’s microsite. This analysis of the funding of education provision is an important backbone for our large portfolio of research on early childhood development, school improvement, skills and transitions to adulthood. Understanding how resources are deployed is fundamental to improving outcomes.
The annual reports have a strong track record in changing the terms of public debate and informing decision-making at critical moments. This report is particularly well timed in that respect. The challenges are substantial, but so too is the opportunity to ensure that investment in education delivers for all learners, especially the most vulnerable children and young people.
Josh Hillman
Director of Education, Nuffield Foundation
Preface
This report is the eighth in a series of annual reports on education spending in England. The authors gratefully acknowledge the support of the Nuffield Foundation, which has funded this series of annual reports (grant number EDO /FR-000024394). The Nuffield Foundation is an independent charitable trust with a mission to advance social well-being. It funds and undertakes rigorous research, encourages innovation and supports the use of sound evidence to inform social and economic policy, and improve people’s lives. The Nuffield Foundation is the founder and co-funder of the Nuffield Council on Bioethics, the Ada Lovelace Institute and the Nuffield Family Justice Observatory. This project has been funded by the Nuffield Foundation, but the views expressed are those of the authors and not necessarily the Foundation. Find out more at: nuffieldfoundation.org; Bluesky: @nuffieldfoundation.org; LinkedIn: Nuffield Foundation.
The authors also thank the Economic and Social Research Council for support via the ESRC Centre for the Microeconomic Analysis of Public Policy (grant number ES/Z504634/1), which underpins much of IFS’s research.
The authors would like to thank the members of the advisory group, officials from the Department for Education and colleagues at IFS, who have commented on and greatly informed the analysis in this report.
This report uses a range of data releases from the Department for Education, its predecessors, related agencies and non-departmental bodies. These are all listed in the sources below individual figures and/or in the methods section of our microsite, which houses all our analysis of education spending (https://ifs.org.uk/education-spending). The IFS student finance model draws on National Pupil Database data linked to data from the Higher Education Statistics Agency (HESA). It also uses data from the Family Resources Survey and the University of Essex’s British Household Panel Survey. Several chapters use data from the Office for National Statistics (ONS) Quarterly Labour Force Survey. The National Pupil Database is Crown Copyright and made available by the Department for Education. HESA data are Copyright Higher Education Statistics Agency Limited. Neither the Department for Education nor Higher Education Statistics Agency Limited nor HESA Services Limited can accept responsibility for any inferences or conclusions derived by third parties from the data.
The views and analysis presented in this report are those of the authors alone. Any errors or omissions are also their responsibility.
Executive summary
This is the eighth IFS annual report on education spending in England funded by the Nuffield Foundation. It provides consistent comparisons of the level of and changes in spending per student across different stages of education. We also analyse the resource pressures and choices facing policymakers for each stage of education. Our dedicated website further provides easy access to our latest analysis, figures and methodology (https://ifs.org.uk/education-spending). All figures quoted are in 2025–26 prices and relate to England unless otherwise stated.
Looking at spending per pupil for the most recent year of data (2025–26, unless otherwise stated):
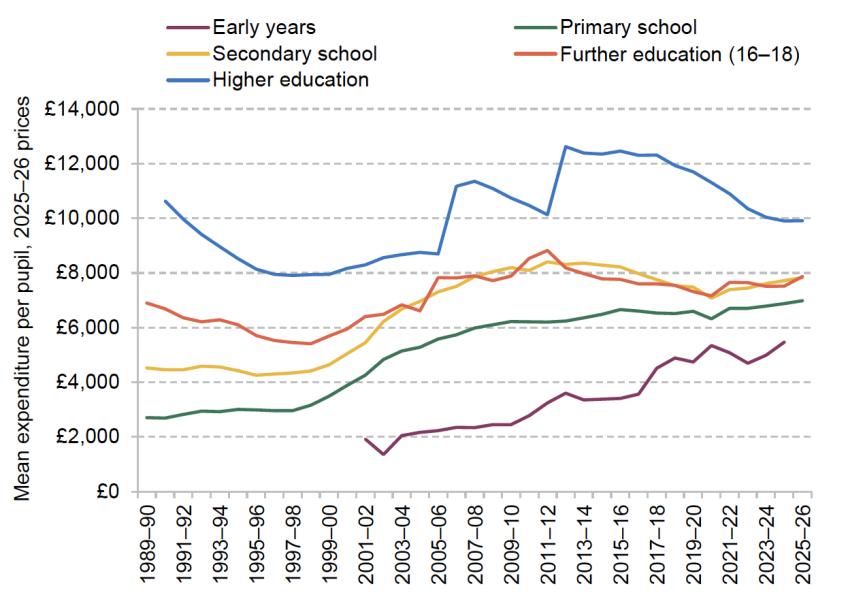
- Early years: £5,500 per child in 2024–25 (double compared with 2010–11)
- Primary schools: £7,000 per pupil (+12% since 2010–11)
- Secondary schools: £7,800 per pupil (–3% since 2010–11)
- All school spending (including wider spending): £8,400 per pupil (same as in 2010–11)
- Further education: £7,900 per student aged 16–18 (–8% since 2010–11)
- Higher education (up-front spending on teaching only): £9,900 (–5% since 2010–11)
Spending per pupil or student per year at different stages of education (2025–26 prices)
Total public spending on education
- The latest data (for 2024–25) show that total public spending on education in the UK was £122 billion (in 2025–26 prices). This represents a 10% or £14 billion fall since 2010–11, with this drop mostly reflecting a shift in the cost of higher education from the taxpayer to graduates.
- Public spending on education has also fallen as a share of national income, from about 5.6% of national income in 2010–11 down to about 4.1% in 2024–25. This equals the historic lows seen in the late 1990s, late 1980s and mid 1960s. There has been no long-run increase in the share of national income devoted to public spending on education, despite rises in post-compulsory education participation over the long run.
Early years
- Total public spending on the ‘free entitlement’ to funded childcare hours reached £8.7 billion in 2025-26 – double the total spending envelope from two years earlier. This increase in spending reflects the introduction of major new entitlements covering children under 3 in working families. This is the latest, and biggest, step change in early years policy. Spending is more than eight times as high as in the early 2000s – a significant change in the scope of the state over the last 25 years.
- Taking in all public spending on childcare support (including support through the tax and benefit systems as well as support for students), childcare spending reached £8.4 billion in 2024–25 and will be around £10.5 billion in 2025–26. After falling sharply during the late 2010s, spending through the tax and benefit systems has stabilised.
- New childcare entitlements, targeted at working families, are reshaping how early years spending is targeted. The share of spending targeted at working families has risen from 15% in 2014–15 to 48% in 2024–25, and is on track to reach 58% in 2025–26. This is in the context of a growing total budget. At the same time, tighter eligibility criteria for the disadvantaged 2-year-old offer (which in 2024–25 covered 24% of children, down from 38% in 2014) have seen spending on this group fall both as a share of the early years budget and in absolute terms. In 2024, spending of £480 million was less than half its level a decade earlier.
- While rolling out new entitlements for working parents was a significant undertaking, most early indications suggest that the system has by and large coped well. Nationwide, over 90% of parents who applied and were approved for the entitlements secured a place. However, there may be signs of additional pressure on supply in some parts of the country (notably in London).
- Take-up of the new entitlements has been significantly higher than initially expected. The 2024 budget for the new entitlements was revised upwards by 28% after take-up exceeded initial expectations by a quarter. Top-ups set out at the 2025 Spending Review will go some way to meeting this pressure in future years – but if the new entitlements continue to be as popular as they are now, the government is on track for perhaps £350 million (in today’s prices) in extra spending in 2028–29.
- The per-hour funding rates set by central government remained essentially flat in real terms between 2024–25 and 2025–26. This followed a big (34%) real-terms increase in the core funding rate for 2-year-olds in 2024, as part of a proposal to more tightly link funding to underlying costs of delivery for different age groups. But childcare providers’ costs have risen more quickly than economy-wide inflation (mostly due to upwards pressure from a rising minimum wage, employer National Insurance and pension contributions). Once these sector-specific costs are accounted for, per-hour funding for 3- and 4-year-olds is 22% lower than its peak in 2017–18 – with a 4% decline just in the last year. Effective resources per hour for 2-year-olds are 12% higher than their 2017 peak.
- In the 2025 Budget, the government committed to a review of the early years system. This is a welcome step: the system is complex and difficult to navigate. The first step in this review should be to work out the aims the government wishes to achieve with its early years investment – for example, improving children’s development, increasing parents’ ability to work, or easing cost-of-living pressures. That will allow for principled discussions about the outcomes achieved in the early years system as a whole, rather than attempting to make each individual policy achieve all of these distinct goals.
Schools
- Total school spending per pupil aged 5–18 in England fell by 10% in real terms between 2010–11 and 2019–20. Recent funding increases have reversed these cuts and mean that it is now back to 2010–11 levels.
- Between 2019–20 and 2025–26, total school spending for pupils aged 5–16 grew by £7.5 billion or 13% in real terms. This drove a 10% real-terms increase in spending per pupil aged 5–16. Over half of this increase in school funding can be explained by growth in spending on special educational needs and disabilities (SEND).
- After accounting for planned spending on SEND, we estimate that mainstream school funding per pupil aged 5–16 only grew by 5% in real terms between 2019–20 and 2025–26. In fact, mainstream school spending per pupil is currently about the same level it was in 2015–16.
- Secondary school spending per pupil in England in 2025–26 is due to be about £7,800, which is 12% higher than in primary schools (£7,000). This is down from a difference of about 30% in the 2000s and over 50% during the early 1990s. This represents a very significant reduction in the secondary:primary funding ratio over time.
- Academy trusts can hold back some funding to spend centrally, which is not included in spending by individual primary and secondary schools. This is partly to deliver services that would otherwise be provided by councils, but they can also spend money centrally on some things that would be provided by individual maintained schools, such as teachers. Central spending on academies is now £510 per pupil, more than double the level in 2016–17. This reflects a shift towards larger academy trusts and increasing central spending per pupil among academy trusts of all sizes.
- The Office for Budget Responsibility (OBR) forecasts that spending on special educational needs and disabilities will have more than doubled in real terms by 2028–29 as compared with 2015–16, including real-terms growth of 13% in 2025–26. This reflects rapid growth in the number of pupils with Education, Health and Care Plans (EHCPs), which are reserved for high-cost needs, and high growth in demand for special school places. A shortage of places in state-funded schools has forced councils to pay for high-cost places in independent special schools, with the cost of fees nearly doubling in real terms between 2018–19 and 2024–25 and now standing at over £2 billion.
- OBR forecasts imply a £6 billion gap between expected funding and spending on SEND in 2028–29. The government is due to publish a schools white paper, including SEND reforms, which may help close this gap by slowing the growth in spending. The other options to fill this gap include topping up the schools budget or reducing mainstream school budgets. To set these in context, £6 billion represents about 9% of the schools budget and about 11% of existing mainstream school budgets.
- In the 2025 Spending Review, the government set out plans to keep core school funding largely constant in real terms between 2025–26 and 2028–29. Falling pupil numbers will reduce pressure on this budget to some extent. If policymakers choose to keep per-pupil spending fixed in real terms, they could generate savings of about £1.8 billion in the total schools budget by 2028–29, which could be used to partly fill the £6 billion funding gap between SEND funding and spending.
- Only increasing mainstream funding per pupil in line with general inflation also creates a number of risks. First, in order to generate any savings, policymakers would actually need to reduce resources, such as through cutting staff numbers or closing schools. Second, in this scenario, we project that actual growth in schools’ costs would exceed funding growth by about 0.5–1 percentage points per year. This would place mainstream schools in a very tight position.
Further education and skills
- Total public spending on further education and skills – covering 16–19 education, adult skills and apprenticeships – is around £14 billion in 2025–26. In the 2025 Spending Review, the government set out plans to increase total further education and skills funding by £300 million in real terms between 2025–26 and 2028–29, but did not specify how this funding will be allocated across the system.
- Between 2010–11 and 2019–20, real-terms funding per student aged 16–18 fell by 14% in colleges and 28% in school sixth forms. Although funding has risen since 2019–20, this has only partially reversed earlier cuts. In 2025–26, funding per student in colleges is around 8% lower than in 2010–11 and around 20% lower in school sixth forms. The recent Post-16 Education and Skills White Paper implies a further 2.5% real-terms increase in spending per student in 2026–27, funded from within the Department for Education’s Spending Review settlement.
- In the 2025–26 academic year, spending per student aged 16–18 in further education colleges is £8,000, compared with £6,400 in school sixth forms and £6,000 in sixth-form colleges. Higher funding for further education colleges mostly reflects higher levels of funding for costly technical programmes and extra funding for students from more deprived areas.
- The number of 16- to 18-year-olds in England is projected to increase by around 70,000 (3%) between 2025 and 2028. Maintaining spending per student at its 2026–27 level in real terms would require total 16–18 funding to increase by a further £150 million (in today’s prices) by 2028–29.
- Total spending on adult skills and apprenticeships increased by 7% in real terms between 2019–20 and 2025–26. However, this only reverses a fraction of past cuts: total spending in 2025–26 will still be 25% below its 2010–11 level. The long-run decline has been particularly pronounced in classroom-based adult education, where falling learner numbers and sustained real-terms reductions in funding rates mean spending is projected to be around 54% below its 2010–11 level in 2025–26.
- Since 2021–22, revenues from the apprenticeship levy have consistently exceeded the funding allocated to the apprenticeship budget, with the surplus rising to almost £840 million in 2024–25. Over the same period, underspends against the apprenticeship budget have largely disappeared, meaning that most allocated funding is now being spent. This shift reflects, in part, a sharp increase in spending on higher-level apprenticeships (level 4 and above), which rose from 13% of total apprenticeship spending in 2017–18 to 39% in 2021–22.
- Looking ahead, if the government chooses to hold spending per student in 16–18 education constant in real terms, much of the increase in total further education and skills funding implied by the Spending Review would be absorbed by rising student numbers. Even allowing for the planned increase in growth and skills levy funding announced at the Autumn Budget – around £50 million in real terms by 2028–29 – public spending on adult education and skills (i.e. outside the 16–19 budget) would be broadly unchanged in real terms between 2025–26 and 2028–29.
Higher education
- Up-front spending on teaching resources per higher education student has declined steadily, standing at £9,900 per year for the 2024–25 university entry cohort. This is around £2,700 or 22% lower in real terms than for those who started courses in 2012–13, who were the first to pay much higher tuition fees, largely because of successive cash-terms freezes to the fee cap since then. The government increased the fee cap with inflation this year (to £9,535) and has committed to increase the cap in line with inflation each year. This will arrest the decline in real-terms per-student teaching resources, and provides some much-needed certainty for universities and prospective students alike.
- Since 2016–17, living cost support for students has only been provided in the form of loans. The maximum amount students are entitled to borrow has been increased each year in line with forecast inflation, but the generosity of support has still declined substantially in real terms, with some students eligible for over a third (around £2,900) less in 2025–26 in today’s prices than equivalent students in 2016–17. This has resulted partly from a long-running freeze in the household income thresholds that determine how much individual students can borrow. If this freeze continues, we estimate that by 2029–30, some students may be eligible for over £1,100 (around a sixth) less in real terms than equivalent students this academic year.
- By the end of this parliament, the government proposes to introduce maintenance grants – which do not need to be repaid – for low-income English students. Grants of between £500 and £1,000 will be provided in addition to existing loans. If they had been available in 2022–23, we estimate 47% of students may have met the means-testing criteria for the new grants, at a cost of approximately £520 million. However, only students on particular courses will be eligible for the new grants, and the government has yet to confirm which these courses will be.
- Until 2015–16, undergraduate students from England were entitled to means-tested maintenance grants whichever subjects they studied. They were worth over four times as much in real terms as the new grants proposed by the government, and were awarded to 57% of all students who received any living cost support. Low-income students from other parts of the UK still are entitled to maintenance grants regardless of subject studied, with maximum grants of £2,000 for Scottish Young Students, £3,475 for Northern Irish students and £8,100 for Welsh students living away from home, outside London this academic year.
- Unlike fees for domestic undergraduates, tuition fees paid by international students are not subject to a fee cap, and now account for more than a fifth of higher education providers’ overall income. The government plans to introduce a levy of £925 per student on these fees from 2028–29. The levy is expected to raise £445 million in its first year and to reduce provider income by around £270 million. There is no meaningful sense in which the revenues raised from this levy will ‘pay for’ the introduction of maintenance grants for domestic students, as government has claimed.
- How much graduates go on to repay towards their student loans determines how the cost of higher education is shared between the taxpayer and graduates themselves. In the 2025 Budget, the government announced that the repayment threshold for ‘Plan 2’ student loans will be frozen for three years from April 2026. As a result, we expect millions of graduates – who started courses between 2012 and 2022 – will repay £93 more towards their loan in 2027–28 and £259 more in 2029–30. Many of these graduates will also be affected by freezes to personal tax thresholds. The interest rate thresholds – which determine how much interest is added to these student loans – are also being frozen for three years. Although less appreciated, this freeze will be more important for many high-earning graduates in the long run than the freeze in the repayment threshold.
- The combined effect of the freezes announced at the Budget will be to increase expected lifetime loan repayments from those who started courses in 2022–23 by around £3,200 (6%) on average, from £52,600 to £55,800 in today’s prices. Borrowers in the third decile of lifetime earnings can expect to repay around £5,000 (14%) more over their lifetimes. We estimate that this will reduce the long-run cost to the taxpayer of financing higher education for this single cohort by £1.3 billion, with the taxpayer now set to bear only 3% of the total cost, down from 9% before the latest freezes.
1. Introduction
Education spending is the second-largest element of public service spending in the UK behind health, representing £122 billion in 2024–25 in today’s prices or about 4.1% of national income. In order for policymakers to be able to make well-informed policy choices, it is crucial to have a clear, consistent picture of how the level of spending at each phase of education has changed over time, what the expected future changes are and the factors driving these changes.
This is of particular importance given evidence showing how education investments at different ages combine to drive long-run outcomes. Evidence tends to show that earlier investments have larger effects than later ones (Cunha, Heckman and Schennach, 2010). There is also now an extensive literature on the effects of school spending. Much of this is from the US and finds that a $1,000 increase in school spending over three to four years can improve test scores by about 0.03 standard deviations (Jackson and Mackevicius, 2024). Effects tend to be larger for children from disadvantaged backgrounds and when school spending is preceded by high-quality early years provision (Johnson and Jackson, 2019).
In a series of annual reports on education spending in England funded by the Nuffield Foundation, we have sought to cast light on this subject by illustrating how spending per pupil (or student) across different stages of education has changed over time. We also publish a range of smaller outputs throughout the year to provide more timely and rapid analysis of the resource challenges facing different phases of education. This analysis is housed on a dedicated website (https://ifs.org.uk/education-spending), providing easy access to the latest figures and the underlying methodology.
The Department for Education is leading the new government’s ‘Opportunity Mission’, with overall goals to improve social mobility by improving support in the early years, narrowing inequalities in the school system and improving skills to increase economic growth.1 The government has set a specific milestone goal to increase the share of 5-year-olds demonstrating a ‘good level of development’ from its current level of 68% to 75% by 2028.
The overall funding available to the Department for Education to meet these and other objectives was largely set in the 2025 Spending Review, though these plans can be topped up and revised. Under current plans, the Department for Education is due to see a 1% per year real-terms increase in day-to-day funding for services in England (resource departmental expenditure limit or RDEL) between 2025–26 and 2028–29. This is similar to overall plans for growth in day-to-day public service spending across government as a whole.
The government has already begun to set out spending priorities across different stages of education in order to meet its objectives and the various challenges it faces. Public spending on the early years has already risen significantly in order to deliver the new extended entitlement to free early years education and childcare from the age of 9 months through to when children start school, which was gradually rolled out from April 2024 onwards. The government now faces the continuing challenge to make sure this is delivered effectively and to assess what else it can do to meet its milestone to improve school readiness, such as through new ‘Family Hubs’.
The core schools budget is set to be held constant in real terms between 2025–26 and 2028–29, plus extra funding to cover an extension to free school meals to all those on universal credit. With falling pupil numbers, this equates to a small real-terms rise in funding per pupil. However, the government faces huge pressures from ever-rising spending on special educational needs and disabilities (SEND) in schools, which has almost doubled in real terms over the past decade. This has been driven by rapid rises in numbers of pupils entitled to statutory support through Education, Health and Care Plans (EHCPs). The Office for Budget Responsibility forecasts that such pressures are likely to intensify, with a £6 billion gap between forecast spending by local authorities and funding from central government in 2028–29. The government is set to publish a White Paper with proposals to reform the SEND system early in 2026. If such proposals slow the growth in spending, this would help close the £6 billion expected funding gap. Either way, how the government seeks to reform the SEND system will be the most important factor shaping the budget pressures on all schools in England in coming years.
Over much of the last 40 years, the budget for further education and skills has tended to be a relative loser from spending changes. When there have been increases in education spending, these areas have generally seen smaller rises. When there have been cuts, they have tended to see the largest cuts. Somewhat unusually, the government is currently implementing faster rises in funding for further education colleges and sixth forms than in overall education spending in England.
The government has also published a White Paper setting out proposals for how England’s post-16 education and skills system should be organised, governed and funded (Department for Education, 2025b). This includes a headline target of two-thirds of young people participating in higher-level learning (degrees and advanced technical courses). But with no deadline for this target, it is hard to judge the significance of this. The White Paper also confirmed plans to convert the apprenticeship levy into a ‘growth and skills levy’, providing subsidies to all employers to fund a wider range of training. Our special report provides further analysis of proposals in this White Paper (Ogden and Tahir, 2025).
Following a period of uncertainty and concern for university finances, the government has recently provided more certainty by committing to index tuition fees in line with inflation, so that their real value does not, by default, decline with inflation (as happened in all but one year between 2012 and 2024). However, living cost support for university students – mainly provided in the form of maintenance loans – has become substantially less generous in real terms over the last decade. From the 2028–29 academic year, the government is planning to reintroduce maintenance grants, which students would not need to repay, although these will be smaller and available to far fewer students than was the case for the grants that were scrapped in 2016. The government also plans to introduce a new levy on tuition fees paid by international students, although it has not been clear about the economic rationale for such a levy, which would constitute a tax on an element of the UK’s exports.
Before we turn to individual areas of education, the rest of this introduction provides overall context on total spending, pupil numbers across each sector over time and the overall methods.
1.1 Total public spending on education
The total level of public spending on education in the UK rose significantly up to about 2010. As shown by the blue line in Figure 1.1, growth in official spending on education was particularly fast from the late 1990s through to the late 2000s, with real-terms growth averaging about 5% per year between 1998–99 and 2010–11. Education spending then fell as public spending cuts began to take effect from 2010 onwards. Between 2010–11 and 2019–20, official education spending fell by 16% in real terms. Since then, it has risen slightly, but in 2024–25 it remained 10% below its 2010–11 level.
Figure 1.1. UK education spending (2025–26 prices and as a share of national income)
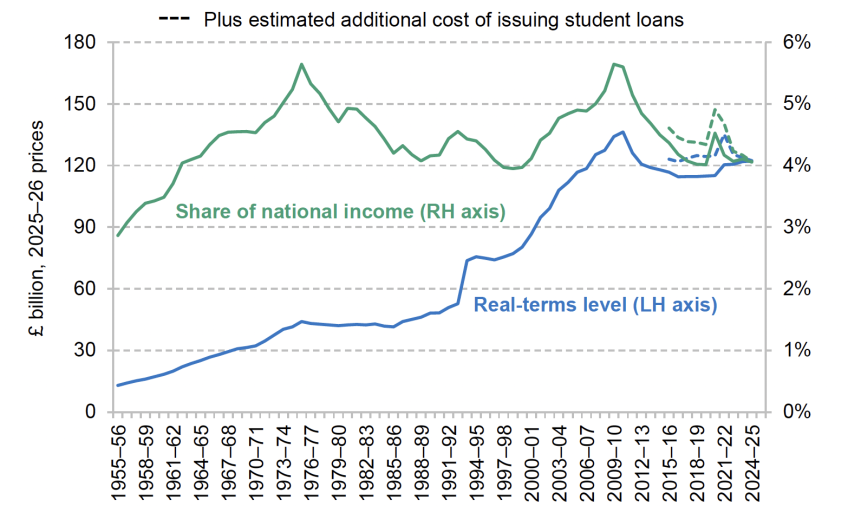
Source: HM Treasury, Public Expenditure Statistical Analyses 2025; previous PESAs; HM Treasury, GDP deflators, November 2025; Office for Budget Responsibility, Economic and Fiscal Outlook, various editions (https://obr.uk/efo/); Office for National Statistics, ‘Student loans in the public sector finances: a methodological guide’, January 2020.
Some of the decline in education spending during the 2010s reflects initially large declines in capital spending just after 2010 (Sibieta, 2023a). The declines also reflected a deliberate shift in the financing of higher education, with greater reliance on contributions from graduates repaying student loans later in life, particularly from the 2011–12 financial year onwards. Unfortunately, these official figures do not fully account for the cost to the taxpayer of issuing student loans.2 We estimate that if official measures of education spending had reflected the eventual taxpayer cost of issuing student loans, education spending would have been around £6 billion higher in 2015–16, as shown by the dashed blue line in Figure 1.1.3 We estimate it would have been £2 billion higher in 2023–24 and about £0.2 billion higher in 2024–25, with this more recent decline in spending on student loans reflecting changes to repayment terms which have increased expected graduate contributions. As a result, while for many years official figures would have been overstating cuts to education spending since 2010–11, the overall decline in education spending between 2010–11 and 2024–25 is now around 10% across both series. The decline in spending over this period mostly reflects the shifting of most of the cost of higher education from taxpayers to graduates. Accounting for this, the real-terms level of public spending on education in 2024–25 was about the same as it was just before the financial crisis of 2007 to 2008.
Irrespective of whether we adjust for the additional cost of issuing student loans, education spending represented about 4.1% of national income in 2024–25. This follows a temporary peak of 5% during the height of the COVID-19 pandemic in 2020–21, when spending was boosted and the size of the economy was depressed. The underlying picture, however, is a significant decline in education spending as a share of national income over the last 15 years. Following a significant rise over the 2000s, education spending as a share of national income reached a peak of 5.6% of national income in 2010. Since then, it has declined to its current level of 4.1% of national income. Since the early 1960s, education spending has ranged between 4% and 5.5% of GDP. Having fallen for the last 15 years, we are now back at the low end of this range, similar to what was spent between the mid 1980s and late 1990s. Indeed, it is clear that education spending as a share of national income has not seen a sustained rise since the early 1970s. This is despite large rises in participation in post-compulsory education over time, both in schools and in higher education, as well as the creation of a publicly funded early years sector.
1.2 Student numbers over time
Total spending figures can obscure the impact of changes in the number of pupils or students, which are often one of the most important factors driving changes in the total and per-pupil level of spending over time. There have also been some fairly substantial changes in recent times, which are due to continue over the next decade. Changes in pupil numbers in schools are shown in Figure 1.2a, and will largely just reflect changes in cohort size over time. Changes in numbers in early years education, further education and sixth forms, and higher education are shown in Figure 1.2b. In addition to changes in cohort size, these figures will also reflect (rising) participation levels over time. Actual figures are shown up to 2024–25, with projections for 2025–26 and beyond.
Figure 1.2. Pupil numbers in education in England (including projections from 2025 to 2030)
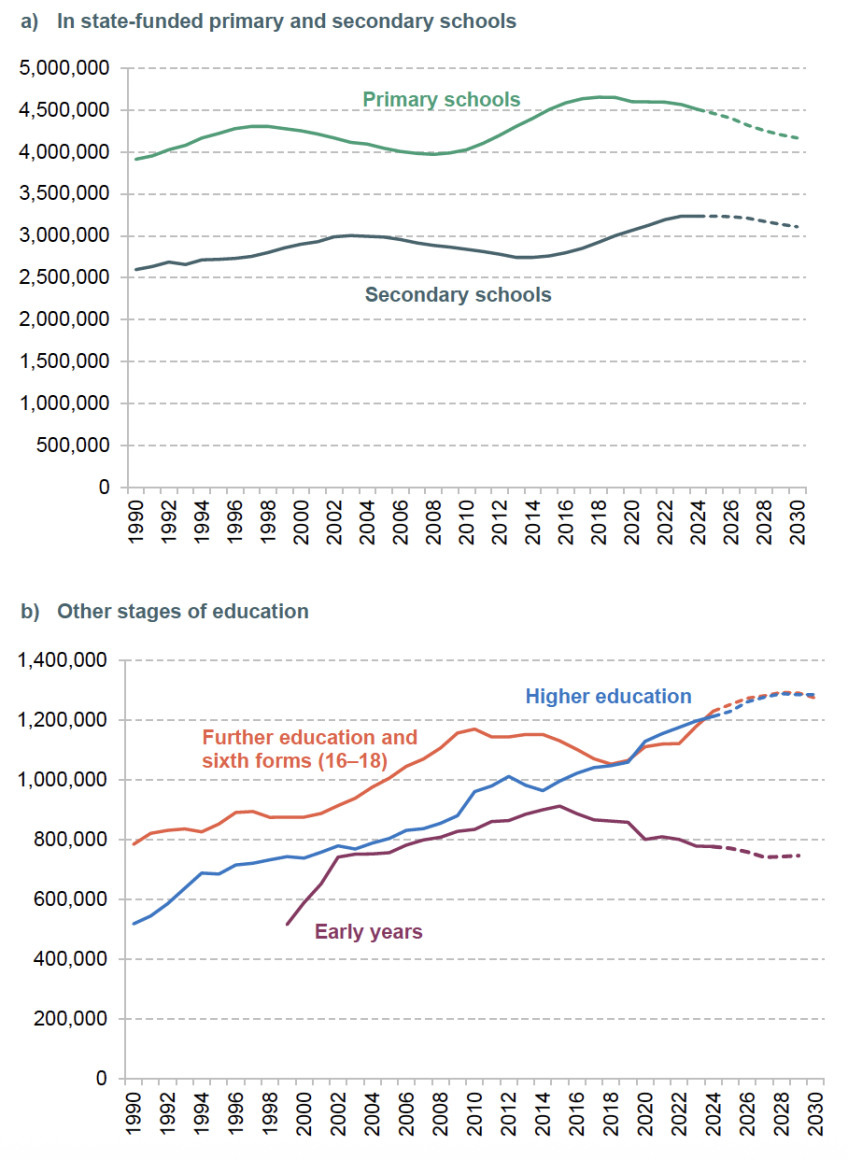
Note and source: Years refer to academic years starting from September, i.e. 2002 refers to the 2002–03 academic year. Early years numbers present the total number of children taking up any of the universal 3- and 4-year-old entitlement (excluding 4-year-olds in infant classes) and are taken from Department for Education, ‘Funded early education and childcare’ (2025) as well as predecessor series ‘Education provision: children under 5 years of age’. Primary and secondary school numbers are taken from Department for Education, ‘Schools, pupils and their characteristics’, January 2025 and earlier years, and ‘National pupil projections: July 2025’. Projections for primary and secondary school children for 2030 are based on Office for National Statistics (ONS) population projections by single year of age (https://www.nomisweb.co.uk/datasets/ppsyoala). Further education and sixth forms figures refer to 16- to 18-year-olds in state-funded schools or colleges as measured at the end of each calendar year in Department for Education, ‘Participation in education, training and employment: 2024’. Higher education figures relate to full-time England-domiciled students on first undergraduate degrees and other undergraduate courses from Higher Education Statistics Agency, ‘Who’s studying in HE?’, and also use ‘Historical statistics on the funding and development of the UK university system, 1920–2002’. Forecasts for the early years are based on ONS 2022-based forecasts for 3- and 4-year-olds, applying the average take-up rate from the post-pandemic period (2022–23 to 2024–25). Forecasts for 16–18 education are similarly based on the ONS population projections for 16- to 18-year-olds. Forecasts for higher education are based on Department for Education forecasts of entrants up to 2029 (https://explore-education-statistics.service.gov.uk/methodology/student-loan-forecasts-for-england) and then on ONS forecasts for the number of 18- and 19-year-olds.
Figure 1.2a shows the numbers of pupils in state-funded primary and secondary schools in England over time. Numbers in primary schools grew by 17% between 2009–10 and 2019–20, the equivalent of an extra 700,000 pupils – or effectively a full school year of children. With falling numbers of children being born during the 2010s, primary pupil numbers have since fallen, with a 3% or 100,000 drop between 2019–20 and 2024–25. In contrast, pupil numbers in secondary schools fell from the early 2000s through to about 2014–15. Between 2014–15 and 2024–25, they then grew by nearly 18% or 500,000.
Looking beyond 2024–25, the primary pupil population is currently expected to fall by over 300,000 more between 2024–25 and 2030–31, or about 8%. The secondary pupil population is expected to fall by about 100,000 or 4%, with these falls only starting from about 2026–27. This implies a fall in the total pupil population of only about 6% or just under 500,000 between 2024–25 and 2030–31.
As was detailed in a separate IFS report on demographic change and schools, the number of children is expected to continue to decline after 2030 (Sibieta, 2025). These falls in the number of pupils and children leave policymakers with a choice. They could use the drop in the number of pupils as an opportunity to make savings by reducing the numbers of schools and teachers in the system. Alternatively, they could choose to increase per-pupil funding and increase the overall intensity of resources, such as by reducing class or school sizes.
As Sibieta (2025) discussed in detail, policymakers facing changing pupil numbers have made different choice across time. During the 1970s and 1980s, policymakers across the UK often chose to make savings in the face of large drops in pupil numbers. In contrast, during the 2000s, there were increases in per-pupil funding and lower class sizes in response to falling pupil numbers. Over the last 10 years, rapid falls in primary school pupil numbers in London have been accompanied by falling numbers of teachers, though not much change in the number of schools, whilst there is more evidence of school closures in Wales, Scotland and Northern Ireland.
In Figure 1.2b, we show how pupil numbers have changed over time in the early years (where we focus here on the universal entitlement for 3- and 4-year-olds), further education, and higher education (where we focus on full-time English-domiciled undergraduate students).
The burgundy series in Figure 1.2b shows big increases in the number of pupils taking up at least some of the universal entitlement to an early education place at ages 3 and 4. This reflects both a rise in the take-up rate (in the earliest years) and changes in the underlying cohort size. The number of 3- and 4-year-olds peaked in 2015–16, and is projected to have fallen by over 15% by 2029–30.
There have been a range of policy reforms in the early years system that mean the number of children under 5 receiving some funded childcare – and, even more so, the number of hours of support on offer – have increased sharply, with significant extensions to the generosity of the free entitlement system in 2004, 2010, 2014, 2017 and – most recently – between 2024 and 2025. These reforms have changed the system in different ways, from increasing eligibility to entitlements to increasing the number of hours on offer. We return to these policy decisions, and their implications for education spending, in Chapter 2.
The number of students in 16–18 education (shown by the red line in Figure 1.2b) grew by almost 50% between 1990–91 and 2010–11, from about 800,000 to 1.2 million full-time-equivalent (FTE) students. After 2010–11, numbers fell by about 10% to just over a million in 2018–19, reflecting reduced cohort sizes rather than falls in participation at this stage of education. Since then, numbers have started to rise again and the number of students is 17% or 200,000 higher in the latest year of data (2024–25) than in 2018–19. Again, this mostly reflects growth in cohort sizes.
Further rises are expected over the next few years due to population growth, with numbers currently projected to rise by a further 5% between 2024 and 2029, before then starting to fall slightly. After this point, the 16–18 student population is likely to drop in the way that we are currently seeing for primary and secondary schools.
The number of full-time undergraduate students in higher education in England increased by over 130% between 1990 and 2024, to reach 1.2 million (as shown by the blue line on Figure 1.2b). The latest forecasts imply a further increase in higher education student numbers to a peak of nearly 1.3 million by 2028. The number of 18-year-olds in England is then expected to decline – by around 10% over the course of the 2030s – as the smaller cohorts currently driving declines in numbers of school pupils reach the age where they might enter higher education. However, unlike for schools, this may not necessarily translate into fewer England-domiciled undergraduate students. The potential impact of similar population declines in the early 1990s and during the 2010s on student numbers was more than outweighed by the impact of increases in the proportion of each age cohort participating in higher education. The proportion starting a first degree by age 20 increased steadily from 29% in 2006–07 to 40% amongst those aged 20 in 2017–18 and 46% amongst those aged 20 in 2022–23.4 If this upward trend continues, this would suggest undergraduate numbers may continue to increase year-on-year, albeit at a slower rate.
1.3 Methods and approach
The rest of this report mainly focuses on day-to-day (‘current’) spending on different stages of education in England. This is primarily for data availability reasons, though we have also previously undertaken analysis comparing school spending per pupil across the four nations of the UK, which indicates higher levels of school spending per pupil in Scotland in particular (Sibieta, 2023b; Sibieta and Snape, 2025a). We also briefly examine capital spending as part of Chapter 3 on schools.
For the most part, we focus on public spending on education. This is due to a lack of reliable data on total private spending on each stage of education over time. For schools, Sibieta (2023c) produced additional analysis comparing state school spending per pupil and private school fees over time, including the likely effects of removing tax exemptions from private schools. For higher education, we also consider expected graduate contributions to higher education spending through student loan contributions later in working life, although our main estimates of higher education spending consider the up-front resources available for teaching and ignore both living cost support and eventual loan repayments.
In Chapters 2–5, we examine trends in spending on the early years, schools, further education and skills, and higher education. In Chapter 6, we compare trends in spending per pupil across different stages of education over time. In each case, our methodology for calculating spending per student is detailed in full on the dedicated website (https://ifs.org.uk/education-spending/methods-and-data). In most cases, figures relate to core education spending and exclude temporary support during the pandemic, though it is not always possible to separate this out. Chapter 7 concludes.
In most cases, we calculate real-terms changes by adjusting for economy-wide inflation as captured by the GDP deflator. This is the standard practice used for analysing public spending in the UK. Across long periods of time and in stable economic environments, the GDP deflator is likely to provide a close approximation to the input costs faced by education providers. We also analyse the likely costs faced by providers. This allows us to consider how the actual funding available to providers compares with their actual cost pressures.
2. Early years
Early childhood sets the foundations for children’s later development through the education system. In view of this, the government has set itself a target for 75% of children to reach a ‘good level of development’ at the end of Reception by 2028.
In the earliest years especially, children’s development is holistic: health, emotional well-being and early skills are interrelated, and different dimensions of development build on one another. This means that the definition of ‘education’ is less clear in the early years than at other stages: programmes such as formal childcare or integrated early years services can promote children’s educational development, but may have wider goals such as supporting parents to work, increasing families’ disposable incomes or improving parents’ mental health.
In this chapter, for comparability with other stages of education, we largely focus on public support for formal childcare that happens outside the home. These ‘early childhood education and care’ settings can – though by no means always do – promote children’s development, though they also contribute directly to wider policy aims.
2.1 The scale of spending on funded childcare entitlements
Over the last 25 years, public support for early childhood education and childcare has become a major part of England’s educational system. As Figure 2.1 shows, in the early 2000s spending on the ‘free entitlement’ to a funded childcare place amounted to just over £1 billion (in today’s prices). By 2009–10, this had doubled; by 2014–15, it had doubled again; and this year, with the introduction of new childcare entitlements, spending doubled once again. Total spending on the free entitlement now stands at £8.7 billion.
Figure 2.1. Total spending on the ‘free entitlement’ to a funded childcare place
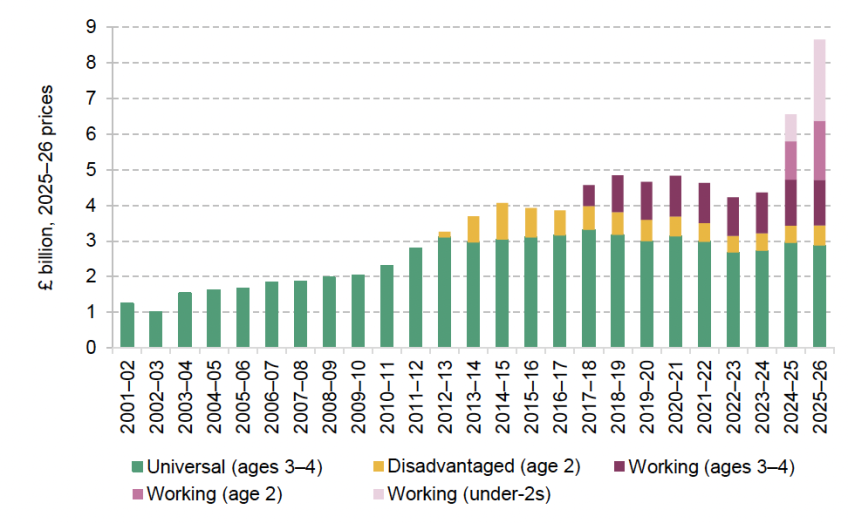
Note: Because our data on total spending do not split out the universal and extended entitlements, we allocate total spending proportional to their budgets from the Dedicated Schools Grant (DSG).
Source: See https://ifs.org.uk/education-spending/methods-and-data.
To put this in context, in 2010–11, free entitlement spending was 4% of the level of the core schools budget. This year, the free entitlement budget is 13% of core school funding. This is a transformation in the scale of government support for early years education.
The free entitlement is not one single programme; different offers are available to children of different ages, with different eligibility requirements. These include:
- a universal offer of up to 15 hours a week5 for all 3- and 4-year-olds;
- a disadvantage offer of 15 hours a week for the most disadvantaged 2-year-olds;
- an extended entitlement to up to 30 hours a week for 3- and 4-year-olds in working families (combining the 15-hour universal offer with a 15-hour top-up).
Alongside these schemes is the new ‘expanded’ entitlement announced at the March 2023 Budget by the previous government (and subsequently implemented by the current government). These expanded entitlements have been rolled out over the last two years; since September 2025, they offer up to 30 hours a week for children aged 9 months to 2 years in working families.6
As Figure 2.2 shows, eligibility for and take-up of funded childcare vary quite a lot across the different entitlement programmes. Eligibility for the universal 3- and 4-year-old entitlement is, of course, universal across this age group. Just under half of children live in families that are estimated to be eligible for the working family entitlements.7
Figure 2.2. Eligibility and take-up for different elements of the free entitlement, 2025
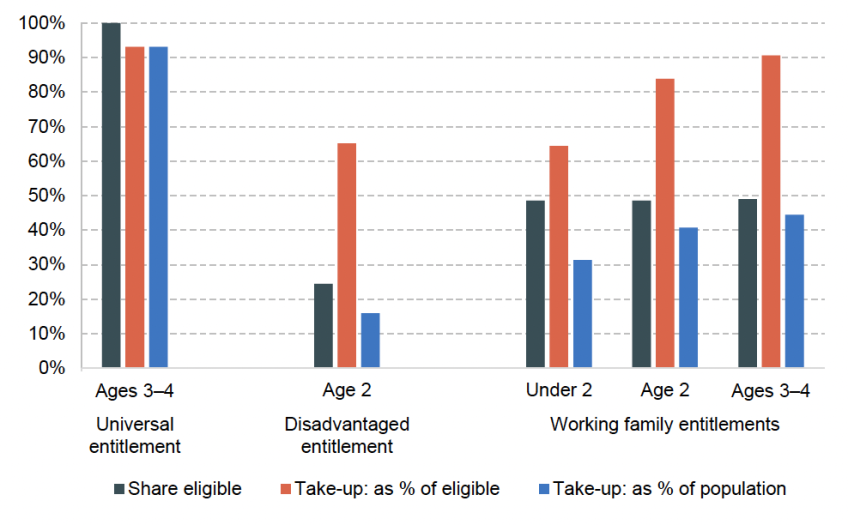
Note: Based on data as at January 2025, when under-3 working family entitlements covered part-time rather than full-time places. Data are based on headcounts (number of children using any of each entitlement) rather than part-time-equivalent places. Eligibility for working family entitlements for 3- and 4-year-olds stops when children enter Reception (or reach compulsory schooling age). This means the share of all 3- and 4-year-olds (including those in Reception) that are eligible for the working family entitlement is estimated to be 34%. For comparability across ages and entitlements, we instead present eligibility and take-up rates as a share of the population not in Reception as at January 2025. Eligibility for working family entitlements is estimated by the Department for Education using data from the Family Resources Survey. Because of small sample sizes, DfE assumes the proportion of children eligible is constant across families with a 1- to 4-year-old.
Source: Department for Education, ‘Funded early education and childcare: 2025’ (https://explore-education statistics.service.gov.uk/find-statistics/funded-early-education-and-childcare/2025). See also methodology note (https://explore-education-statistics.service.gov.uk/methodology/funded-early-education-and-childcare).
Eligibility for the disadvantaged 2-year-old offer is much lower, at just under a quarter. This is notably low: when these entitlements were introduced in their current form, in 2014–15, eligibility was close to 40%, but years of cash-terms freezes in eligibility criteria have meant that eligibility has fallen. We return to these trends, and what this means for the shape of the early years system, in Sections 2.3 and 2.4.
Among 3- and 4-year-olds that are eligible for funded childcare, take-up rates are quite high: 93% of 3- and 4-year-olds take up at least part of their universal entitlement, and 91% of eligible 3- and 4-year-olds take up at least part of their working family extended entitlement. Take-up rates are lower among younger age groups, with 84% of eligible 2-year-olds and 64% of eligible under-2s taking up the working family entitlement. Take-up amongst disadvantaged 2-year-olds is considerably lower than take-up of the 2-year-old working entitlement (65% versus 84%), though this might in part reflect issues with children who are eligible for both entitlements being recorded as using the working rather than disadvantaged offer.8
In the next section, we analyse the take-up of the new ‘under-3’ working family entitlements, which were rolled out during 2024 and 2025, as well as spending on these new programmes. We then examine how spending on and take-up of existing early years programmes have changed over time (Section 2.3). Finally, we take a step back to look at the wider landscape of public support for formal childcare, analysing what these changes mean for the overall shape of childcare support in England (Section 2.4). These questions will be particularly important over the coming year as the government embarks on a major review of the shape of England’s childcare and early years system.
Of course, funded childcare entitlements – and wider childcare subsidies through the tax and benefit system – are only part of the early years picture, though they are very much the largest part in terms of spending. In Box 2.1, we summarise some of the key policies announced in the government’s July 2025 ‘Best Start in Life’ strategy (Department for Education, 2025c), which aims to look at the wider landscape of early years services in addition to support for formal childcare.
Box 2.1. Best Start in Life strategy and the government’s missions
In July 2025, the government released its ‘Best Start in Life’ strategy, which aims to present a framework for supporting children’s development until the end of Reception year. In addition to prenatal investments in maternal physical and mental health, the strategy covered three pillars: family support, increasing access to subsidised early education and childcare, and support for quality early education (in both childcare and Reception settings).
Of all the policy reforms discussed in the strategy, by far the biggest in terms of spending implications were the commitments – inherited from the previous government – to go ahead with rolling out the expanded entitlements for children under 3 in working families. However, these new expanded entitlements will do very little to close gaps in children’s early development: there is little robust evidence that formal childcare in the very earliest years has significant benefits for children’s development. Even if there are benefits to be had, by prioritising children in working families this policy steers support away from the poorest children (who typically benefit the most from formal childcare). This reflects the fact that the new expanded entitlements are aimed much more strongly at increasing labour supply among parents – in the government’s parlance, contributing to the growth mission (rather than necessarily helping to meet its opportunity mission aim to increase good levels of development at the end of Reception).
The other strands of Best Start in Life are more clearly linked to the opportunity mission – though the funding announced, of about £500 million a year, is around a tenth of the £5 billion a year we are set to spend on the expanded childcare entitlements by 2028–29.
One important step in the strategy was a commitment to expand access to Family Hubs, which aim to bring together evidence-based services in health, education and childcare as well as additional targeted support. This model is based on the Sure Start model of the 2000s, which research at IFS has found had wide-ranging and long-lasting benefits for children’s development (Carneiro et al., 2025). But even with the top-up funding announced as part of the strategy, total spending on integrated early years services will be less than half as high as peak Sure Start spending, and is meant to cover a much wider age group.
The final pillar of the strategy looked at the early years workforce and the quality of provision in childcare and Reception. A simplified and improved training system could deliver real benefits, though it comes against a backdrop of quite high turnover amongst staff.
2.2 Spending on and take-up of the under-3 childcare entitlements
Take-up of the new entitlements
The new childcare entitlements for working families with a child under 3 represent a major change in the landscape of early years and childcare support in England. As Figure 2.2 suggests, these entitlements have proven popular, with two-thirds of eligible children under 2 and five in six eligible 2-year-olds using at least some of their entitlement.
Indeed, as we discussed in Farquharson (2025), the new entitlements have proven much more popular than initially expected. Figure 2.3 shows, for each local authority, the change in part-time-equivalent places between the first version of the 2024–25 Dedicated Schools Grant budget (issued in December 2023) and the latest estimates (issued in July 2025). Across most of England, take-up of the new entitlements turned out to be substantially higher than initially estimated: the number of part-time-equivalent places taken up under the new entitlements was revised upwards by 26% over the course of 2024–25.
Figure 2.3. Percentage change in predicted take-up of the new childcare entitlements in 2024–25, from initial estimates (December 2023) to latest estimates (July 2025)
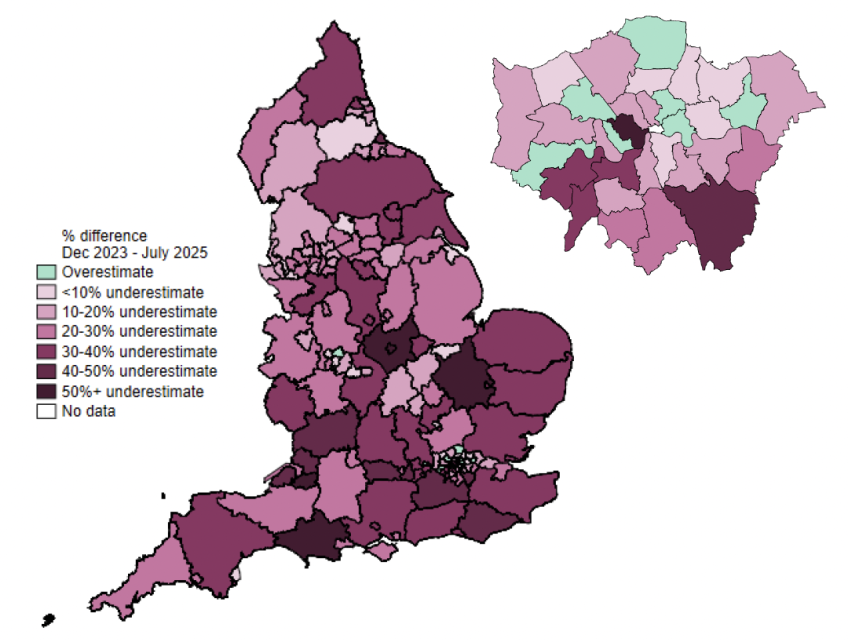
Note: Map shows the percentage change in expected take-up of the new working family entitlements for 2024–25 between the first version of the 2024–25 Dedicated Schools Grant budget (December 2023) and the final version (July 2025). Areas where expected take-up has fallen (an initial overestimate of take-up) are shown in green; other areas had an initial underestimate. Greater London is shown separately for visibility.
Source: Adapted from figure 2 of Farquharson (2025). Based on data from the December 2023 and July 2025 versions of the Dedicated Schools Grant for 2024–25.
There are good reasons why initial estimates of the take-up of these new entitlements would need to be revised. First, there is considerable uncertainty as to how many families would have been eligible even if the entitlements had had no effect on working patterns or how they organised their childcare. The best current estimates are based on data from the Family Resources Survey, but there will always be a degree of uncertainty in using survey data (especially when looking at sub-national estimates). On top of this, local-authority-specific population forecasts are uncertain and subject to change, and this might be particularly true of the youngest age groups.
Take-up rates might also have turned out to be higher than initially expected because more families changed their behaviour than initially expected. For example, if more working families switched from using informal care (such as grandparents) to formal care once they gained access to funded hours, this would drive up take-up rates. It is also possible that higher-than-expected take-up rates reflect greater-than-expected labour supply responses – that is, that more parents are moving into work or working more (and so becoming eligible for the new entitlements or increasing the amount of childcare they use). Disentangling these different drivers will be central for understanding what impact the new entitlements are having on families’ employment patterns and disposable incomes.
That said, the scale of the change – more than 75,000 more part-time-equivalent places than initially expected – is nevertheless remarkable. And that has had significant fiscal implications: total spending plans for the new entitlements in 2024–25 were revised up within the year by £440 million, or 28%. This was partly offset by underspends elsewhere in the early years budget, so overall early years funding from central government was revised upwards by £315 million. Like many other education programmes (including pupil premium, free school meals and high needs funding), childcare entitlements fall under the ‘Departmental Expenditure Limits’ set at the Spending Review. This means that, when demand outstrips expectations, it creates spending pressure on the department’s budget as a whole that must be met by either spending less elsewhere in education or having overall budgets topped up.
What this means for spending going forward is not yet clear. One area of uncertainty is what effect the September 2025 move from part-time (15-hour) to full-time (30-hour) entitlements will have. Estimates from the Office for Budget Responsibility’s March 2023 Economic and Fiscal Outlook, based on previous research at IFS (Brewer et al., 2022), suggest that impacts on parents’ labour supply will largely kick in only with the full-time offer. This might suggest that take-up rates will increase further.
Previously, we set out how total spending on the new entitlements might change based on different scenarios for take-up and per-hour funding (Farquharson, 2025). We estimated that spending in 2028–29 could reach between £4.8 billion and £5.3 billion (in current prices). On a central estimate, that is around £1 billion more than would be implied by a real-terms freeze in the allocations set out in the 2023 Budget, when these policies were first announced. A top-up announced at the Spending Review in June this year (worth £640 million in today’s prices for 2028–29) will go some way to closing this gap, but could still leave additional funding pressure if these new entitlements continue to prove popular.
Provision of the new entitlements
At the time the new entitlements were announced, one widespread concern was around the deliverability of a big expansion: would childcare providers be willing to offer the new publicly funded entitlements, and would they be able to expand to offer more places to the under-3s?
Higher-than-expected take-up rates are one sign that, across much of the country, providers are indeed offering free entitlement places. Importantly, most of the places will not be ‘new’ – based on estimates from the Office for Budget Responsibility, we estimated at the time of the 2023 Budget that perhaps five in six places funded by the new entitlements would have existed even without the expanded entitlements, with parents rather than government paying (Farquharson, 2023). And data from the Childcare and Early Years Survey found that the share of 0- to 4-year-olds using formal childcare ticked up just 1 percentage point between 2023 and 2024, from 63% to 64% – a relatively small change, and well within the margin of error.9 While there is lots of uncertainty about the precise amount of ‘new’ childcare being delivered, what is clear is that a large majority of the childcare funded by the new entitlements would have happened anyway, lessening the delivery challenge.
The government also incentivised providers to offer these new entitlements by introducing funding rates for 2-year-olds and under-2s that were much more generous than the fees that parents were paying on the private market. This was partly to ensure that funding rates more closely mirrored costs (which are much higher for younger children), a change to providers’ previous practice of charging similar amounts for all pre-school children (Drayton et al., 2025). But this also gave a clear incentive for providers offering places to under-3s to opt into the publicly funded free entitlement system.
This is not to say there are no pressures in the system. Figure 2.4 shows the share of parents of 0- to 4-year-olds reporting that there are not enough childcare places in their local area. For most of the 2010s, between 25% and 30% of families with a pre-schooler felt that there was not enough childcare availability in their local area. Following the COVID-19 pandemic, that has increased to nearly 40% in 2024. Despite this, only 4% of families with a pre-school child not in childcare cited inability to find a place as a reason for not using childcare.10
Figure 2.4. Share of parents of 0- to 4-year-olds reporting a lack of childcare availability in their local area
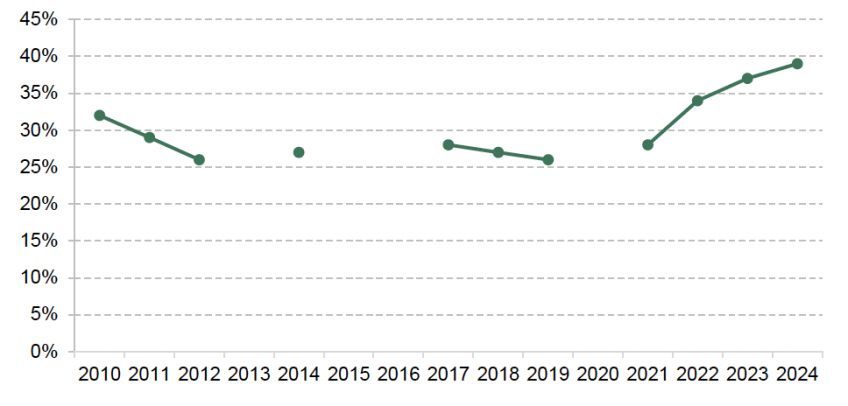
Source: Department for Education, Childcare and Early Years Survey of Parents (various years).
Local childcare markets: pressures in bigger cities?
One factor that helps to explain why some parents perceive a lack of availability in their local area is that childcare is a very local market: a surplus of places in Barnsley is no help to a family living in Birmingham (and even within Birmingham, a family living in Erdington might not benefit from additional places in Edgbaston). And there are some indications of pressure in particular parts of the country, especially London and other major urban areas.
Figure 2.3 shows that take-up of the new entitlements generally exceeded initial expectations. London (and some other urban areas) is a notable exception: in 7 out of 32 London boroughs, take-up was lower than initially expected. And while nationally 91% of parents who applied and were approved for the new entitlements had successfully found and taken up a childcare place, that validation rate was 85% in London.11
One possible contributing factor is that funding rates in London have been less generous (compared with market prices) than in other regions. Figure 2.5 shows the difference between the average hourly funding rate and the average hourly price charged to parents in each region of England in 2025. Funding rates always exceed market prices for under-2s and for 2-year-olds, while funding rates are less than market prices for 3- and 4-year-olds. This reflects a policy decision to have funding rates more closely reflect underlying costs (rather than ‘smoothing’ across ages so that parents pay a similar amount regardless of their child’s age).
Figure 2.5. Difference between average government funding rate and average parent-paid fees, by region, 2025
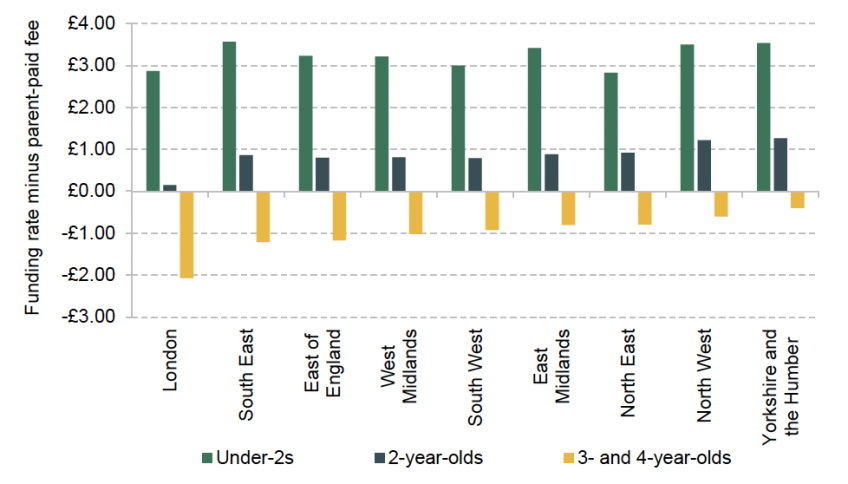
Note: Positive numbers indicate that average hourly funding in the region is greater than the price charged to parents; negative numbers indicate that prices are higher than funding rates.
Source: Department for Education, Childcare and Early Years Provider Survey, 2025, https://explore-education-statistics.service.gov.uk/find-statistics/childcare-and-early-years-provider-survey/2025.
But in London, the gap between funding and fees is smaller for the younger children, while the shortfall between fees and funding for 3- and 4-year-olds is larger. This suggests that funding rates in London are less generous compared with market prices than in other regions of the country.
2.3 Trends in take-up of and spending on existing free entitlement programmes
While much of the policy and delivery focus has been on the new expanded entitlements for working families with children under 3, as Figure 2.1 shows, these account for a little less than half of total free entitlement spending in 2025–26. In this section, we therefore examine changes in the take-up of and eligibility for other childcare entitlements, as well as effects on the wider market.
Figure 2.6 shows the take-up (as a share of the eligible population) of the different childcare entitlements over time. Take-up of the universal entitlement (shown in green) has been very high since the early 2000s. After a dip during the COVID-19 years, take-up has largely recovered, with 93% of 3- and 4-year-olds taking up at least some of their free hours in 2024–25 (equal to the pre-pandemic take-up rate).
Figure 2.6. Take-up of funded childcare entitlements (as a share of eligible population)
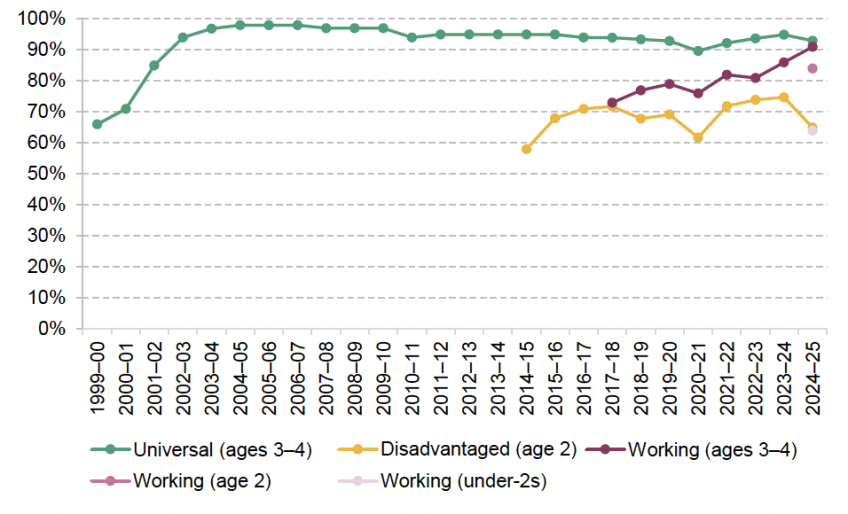
Note: Take-up reflects headcounts as a share of the relevant eligible population.
Source: Department for Education, ‘Funded early education and childcare’, 2025 (https://explore-educationstatistics.service.gov.uk/find-statistics/funded-early-education-and-childcare/2025) and its predecessors.
Take-up rates of the working family entitlement for 3- and 4-year-olds (shown in burgundy) have been rising fairly steadily. When the offer was introduced in 2017, just over 70% of eligible families took up at least some of their extended hours. Before the pandemic, take-up rates were around 80%. In the last two years, take-up rates have jumped up again and by 2024–25 stood at 91% – just 2 percentage points shy of the take-up rate for the universal entitlement. This growth in take-up could reflect the policy ‘bedding in’ (with take-up rates rising as parents become more familiar with it and some of the operational challenges are resolved). It could also reflect the greater value of these new entitlements: as childcare prices have risen (relative to economy-wide inflation), it becomes more expensive for families to purchase their own care, so the incentives to use free entitlement places are greater. Regardless of the drivers, rising take-up rates among this age group suggest that families with 3- and 4-year-olds are not being ‘crowded out’ of the childcare market by new publicly funded hours for the under-3s.
By contrast, take-up rates for the 2-year-old disadvantage offer (shown in yellow on Figure 2.6) had been slowly rising before 2024–25 (outside of the COVID-19 pandemic). But in 2024–25, take-up rates fell by 10 percentage points, from 75% to 65%. Partly, this will reflect some changes in data collection: perhaps around 5% of 2-year-olds are eligible for both the disadvantaged and the working family entitlements (Farquharson, 2024). While the guidance from central government was that a child eligible for both entitlements should be registered as claiming the disadvantage entitlement, this guidance was not universally followed. So there will be some disadvantaged children who are still receiving publicly funded childcare, but are registered as claiming a working family entitlement – contributing to lower take-up rates of the disadvantaged offer.
Even so, a 10 percentage point fall in take-up in one year is large, and probably too large to be fully explained by changing coding. One concern is that providers could be opting to offer places to 2-year-olds in working families, making it more difficult for those in disadvantaged families to find an early years place. The core funding rate for 2-year-olds is the same for both offers, worth on average £4,930 per year for a child taking up the full 570 hours a year in 2024–25 (though low-income families accessing either scheme also attract £570 a year in top-up funding from the early years pupil premium, which was extended to cover 2-year-olds in 2024–25). This means that if 2-year-olds in working families are more attractive to providers for other reasons (e.g. if these families are more likely to take up full-year places with parents paying the difference), then providers may be incentivised to offer places first to these working families.
Another possible – though longer-running – explanation is that the characteristics of families who are eligible for the 2-year-old disadvantaged entitlement have changed. The eligibility criteria for the 2-year-old disadvantaged offer have remained essentially the same since the programme was introduced in its current form in 2014–15. For families who are eligible because they claim certain means-tested benefits, the income cap (above which they lose eligibility) has also remained frozen in cash terms over this period.12 This means that the eligibility criteria have become more stringent over time, as the income cap does not keep pace with rising prices or earnings – meaning that eligible children are now, on average, more disadvantaged than they were a decade ago.
This is evident in Figure 2.7, which shows the shares of 2-year-olds who are eligible for and taking up the disadvantage offer in each year. When the entitlements were introduced in their current form in 2014–15, 38% of children were eligible for this offer. This had fallen to 31% by 2021–22. With rapid inflation following the pandemic pushing up (cash-terms) earnings, eligibility has fallen by 7 percentage points in the last three years, and now 24% of 2-year-olds are eligible for the entitlement.
Figure 2.7. Share of 2-year-olds eligible for and using the 2-year-old disadvantage offer
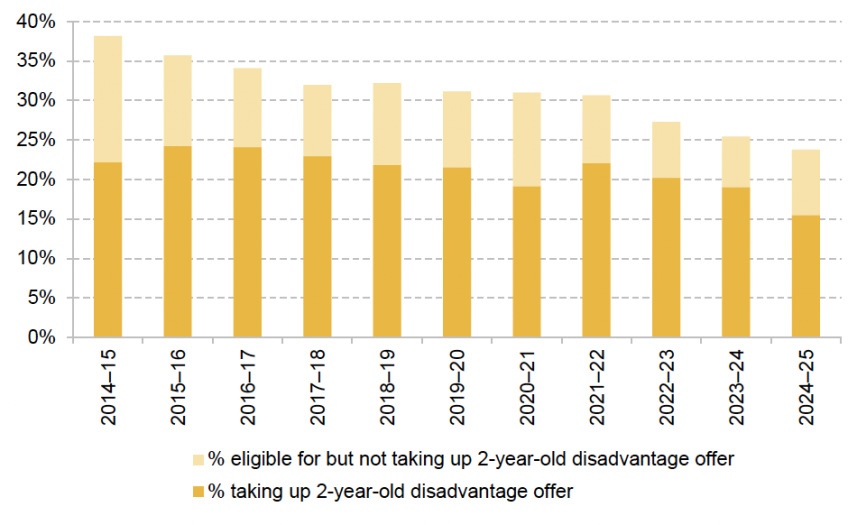
Source: Department for Education, ‘Funded early education and childcare’, 2025 (https://explore-education-statistics.service.gov.uk/find-statistics/funded-early-education-and-childcare/2025) and its predecessors.
Spending on existing childcare entitlements
For childcare providers delivering the free entitlement, the key input into their financial picture is the core per-hour funding rate. Core funding per hour has been set by the Department for Education through the Dedicated Schools Grant. It governs the amount of funding received by each local authority. Every individual local authority then allocates its total early years budget through its own Early Years Single Funding Formula; we discuss this process in more depth in Drayton et al. (2025). Core funding per hour differs from the spending measures used earlier in this chapter, which capture spending through other elements of the funding formula (such as targeted uplifts) as well as any wider spending done by local authorities.
In cash terms, core funding per hour has increased by 36% in the last decade for 3- and 4-year-olds (from £4.50 in 2016–17 to £6.14 in 2025–26). For 2-year-olds, cash-terms funding has increased twice as quickly, from £5.03 in 2016–17 to £8.65 in 2025–26. The difference in growth rates was largely down to a big adjustment to 2-year-old funding rates announced in the 2023 Budget, alongside the announcement of the new entitlements: funding rates for 2-year-olds rose by nearly 40% in cash terms between 2023 and 2024. In addition, from April 2024, 2-year-olds (claiming either the disadvantaged or the working family entitlements) became eligible for the early years pupil premium (EYPP), worth 68p per hour that year. This will have increased effective funding rates for providers delivering the disadvantaged 2-year-old offer, since most children receiving that entitlement will attract EYPP.
Of course, cash-terms increases are not the best measure of the resources providers have to deliver these entitlements: costs have risen over this period, too. And this is particularly true of childcare providers’ costs. Relative to the economy as a whole, a higher proportion of childcare providers’ costs comes from staffing (75% of total costs), with rent and premises costs (7%), food (3%) and energy (3%) making up most of the remainder.13 Many of these costs have been rising more quickly than economy-wide inflation. There have been particularly big rises in the costs of employing staff on low wages, as the national living wage for adults aged 25 and up rose by 70% between April 2016 and April 2025 (and lower rates for younger workers are increasingly being removed). The increase in employer National Insurance contributions – which, for the childcare sector, were not offset by a more generous employment allowance – have also pushed up costs significantly this year.
Figure 2.8 therefore shows how core funding per hour has changed after adjusting for two measures of inflation: economy-wide inflation (as measured by the GDP deflator) and childcare-provider-specific cost increases (based on our index of childcare providers’ costs).14 Since 2016–17, economy-wide inflation has increased costs by 35%. On our measure, childcare providers have instead seen their costs rise by 55% over the same period. This puts considerable additional pressure on hourly funding rates.
Figure 2.8. Core funding per hour for 2-year-old and 3- and 4-year-old entitlements, compared with economy-wide inflation and provider costs
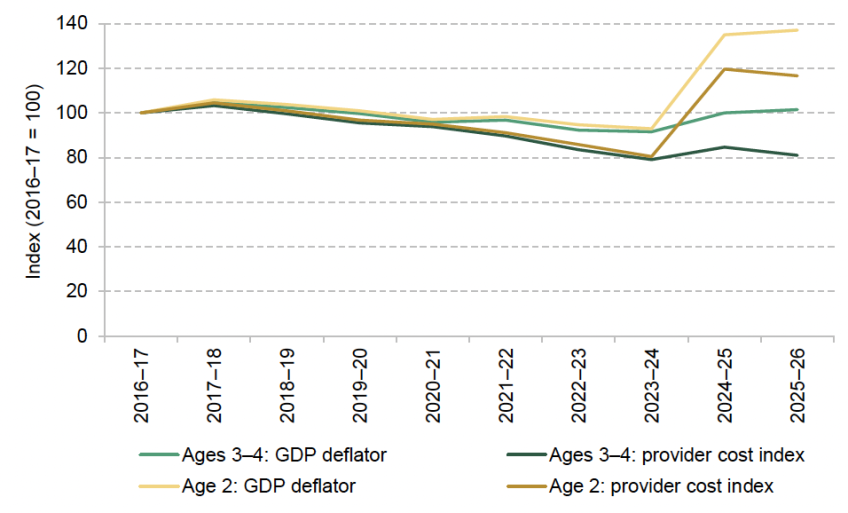
Note: Childcare provider cost index captures growth in labour costs (employer cost of workers on full-time minimum wage and on average earnings); rent and energy costs; food costs; and other costs (proxied by economy-wide inflation). We follow the methodology in Drayton and Farquharson (2022), updating the labour costs elements to account for employer costs (employer National Insurance and pension contributions) in addition to gross earnings. Weights are determined by provider cost shares as reported in the 2019 Survey of Childcare and Early Years Providers.
Source: National Living Wage for workers aged 25+; Office for National Statistics, Average Weekly Earnings (EARN01), whole economy adjusted for seasonality. Costs for food and property costs come from relevant sub-series of the Consumer Prices Index. ‘Other’ costs are proxied by the GDP deflator (November 2025).
Taking economy-wide inflation into account, core funding per hour for 3- and 4-year-olds has recovered its real-terms value and now sits at about the same level as in 2016–17; it is still about 3% below its peak in 2017–18. But taking childcare-provider-specific costs into account, core funding rates for 3- and 4-year-olds remain 19% lower than a decade ago. Effective resources per hour fell by 4% just in the last year, largely due to big increases in employer costs.
By contrast, the big cash-terms increases in core funding per hour for 2-year-old entitlements have translated into substantial increases in resources per hour. Even after accounting for childcare providers’ rising costs, funding per hour is 17% higher than it was a decade ago. This largely reflects a policy decision to see childcare funding more closely reflect underlying costs at different ages. Prior to 2024–25, funding rates for 2-year-olds were around 13% higher than rates for 3- and 4-year-olds. But costs are much higher for younger children: the maximum staff-to-child ratio for 2-year-olds was 1:4 for most of this period (since increased to 1:5), while for 3- and 4-year-olds the ratio can be 1:8 or 1:13 depending on the staff’s qualifications.
2.4 The shape of England’s childcare system
New childcare entitlements for working families with children under 3 represent the latest, and biggest, step in the transformation of England’s early years system. But England’s system of support for childcare encompasses an even wider range of programmes, stretching across three government departments. In addition to the various free entitlement policies, the Department for Education also runs a programme to subsidise childcare expenses for full-time English students (with family incomes below a cap) – see Box 2.2. There are subsidies for childcare costs for working families receiving benefits (managed by the Department for Work and Pensions), and a wider set of policies offering subsidies to working families higher up the income distribution (run by HM Revenue and Customs).
Box 2.2. Childcare grants for students
An additional channel of public spending on childcare comes through subsidies for students. This applies to full-time student parents in higher education, through a system of childcare grants. Student parents in further education can also receive support with childcare costs through the ‘Care to Learn’ scheme; this is a much smaller programme (just £5 million of spending in 2021–22a), so below we focus on childcare grants for university students. Parents are eligible for the grant if:
- they are taking out (or are eligible for) undergraduate ‘student finance’ such as tuition fee loans for full-time English university courses;
- they are not taking out a postgraduate loan;
- they have children under 15 (or under 17, if the children have special educational needs); and
- they have a household income below a minimum threshold (currently around £20,100 for parents applying for one child and £28,900 for parents applying for multiple children).
The grant targets a separate group of recipients from other programmes: student parents are ineligible for the grant if they are receiving subsidised childcare through the tax or benefit system, and they are unlikely to qualify for programmes targeting working families. The grant funds up to 85% of childcare costs, above any hours covered by the free entitlement, and is administered by the Student Loans Company.
Figure 2.9 shows the trajectory of spending on the student childcare grant in England over the last 17 years.b Overall spending reached £300 million last year – more than five times as high as it was in 2008–09 and more than double what it was in 2019–20. This means that student childcare grants are becoming an important element of England’s childcare subsidy landscape, with spending last year equivalent to 5% of total free entitlement spending (and 11% of spending on the universal free entitlement).
Figure 2.9. Real spending, number of recipients and average spending per recipient of the student childcare grant in England
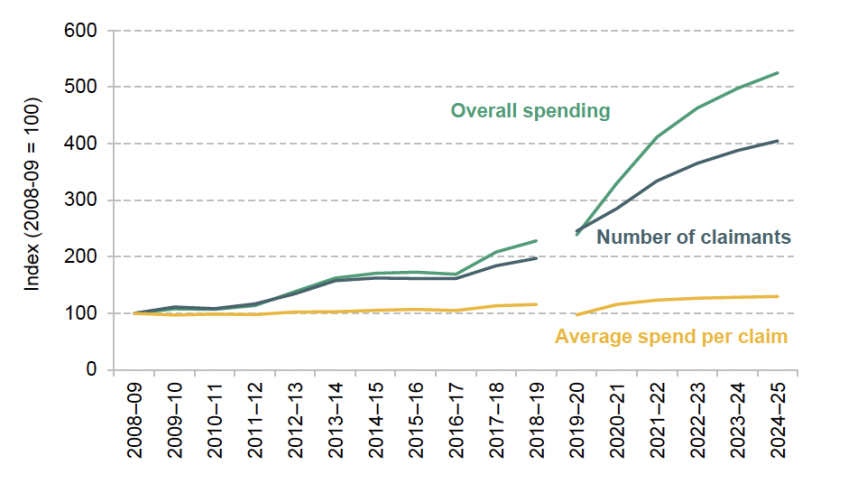
Note: Prior to 2019–20, the Student Loans Company calculated spending based on childcare grant ‘awards’, rather than actual payments made, leading to a break in the series. Some students do not claim the full amount awarded – if they drop out mid-year, for example – so ‘awards’ may overestimate actual spending (https://www.gov.uk/government/statistics/student-support-for-higher-education-in-england-2025/student-support-for-higher-education-in-england-2025).
Source: Student Loans Company, ‘Student support for higher education in England’, 2025 (https://www.gov.uk/government/statistics/student-support-for-higher-education-in-england-2025) and its predecessors.
The increase in spending is largely driven by a big rise in the number of recipients: from 11,000 claimants in 2008–09, to 21,000 in 2018–19 and 43,000 in 2024–25. The reasons for this increase are not fully clear, though it may be linked to large increases in the number of mature students in their 30s and 40s entering full-time study in England, which has doubled over the last decade.c Simultaneously, the average grant per recipient has risen gradually in real terms and is 30% higher than it was in 2008–09.
a. https://questions-statements.parliament.uk/written-questions/detail/2023-09-14/199570.
b. Prior to 2019–20, the series captures childcare grants awarded – which may overestimate actual grant take-up. From 2019–20, the series reflects actual spending.
c. Calculated from HESA statistics on HE student enrolment in English universities by age.
Figure 2.10 summarises spending through each of these strands of public support for formal childcare. Childcare subsidies through the working-age benefit system peaked in 2009–10 at £2.1 billion (in today’s prices) before falling to £700 million in 2020–21. Spending has since increased a little, to £800 million in 2024–25 – though spending might fall further in future years as the new working family entitlements reduce low-income families’ out-of-pocket childcare spending.
Figure 2.10. Total public childcare spending by funding system
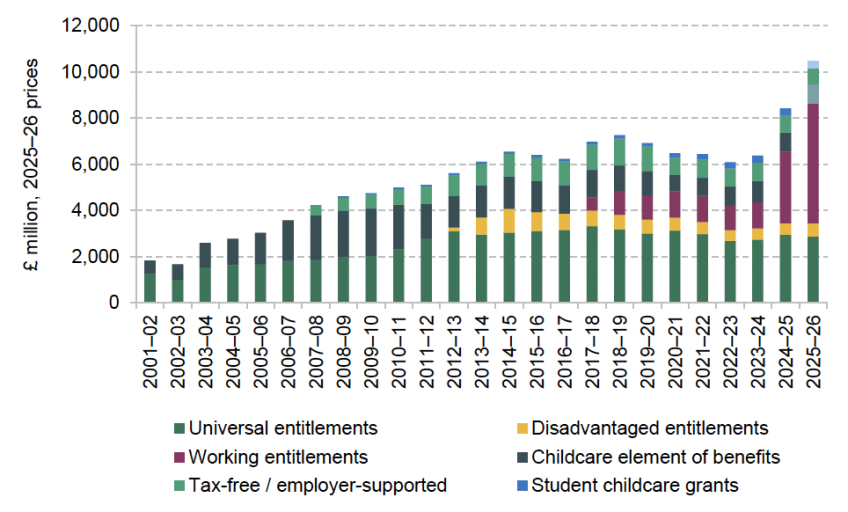
Note: Student childcare grants were introduced in 2001–02, but data on spending are only available from 2008–09 (so spending on student grants in earlier years is excluded from the chart). Data on spending through the benefit and student childcare support systems are only available to 2024–25. We assume spending on these elements remains flat in real terms in 2025–26. Between 2016–17 and 2020–21, statistics on the childcare element of benefits specifically through the universal credit system are not available. We estimate this component of benefit spending using TAXBEN (the IFS tax and benefit microsimulation model).
Source: Sources for free entitlement programmes – see Figure 2.1. Sources for student childcare grants – see Figure 2.9. Sources for benefit spending through legacy benefit systems – Stewart and Obolenskaya (2015); and HMRC statistics on child and working tax credits, December 2024 and its predecessors. Sources for benefit spending through the universal credit system – Department for Work and Pensions statistics on the childcare element of universal credit and estimates from TAXBEN (see note above) where the previous series is incomplete. Sources for tax-free childcare – Office for Budget Responsibility’s Economic and Fiscal Outlook, November 2025 and its predecessors. Sources for employer-supported childcare – Stewart and Obolenskaya (2015); HMRC statistics on non-structural tax reliefs, December 2024 and its predecessors.
Spending through the tax system (which includes both tax-free childcare and the legacy programme of employer-sponsored childcare vouchers) rose steadily to peak at £1.2 billion in 2018–19. It has fallen sharply since then, reaching £700 million in 2024–25. Much of this fall predates the introduction of the new entitlements, so it seems likely that there are other drivers, such as changing working patterns after the COVID-19 pandemic.
Taken together, these trends mean that total public spending on childcare support had been falling in real terms between 2018–19 (£7.3 billion) and 2022–23 (£6.1 billion), before ticking up slightly in 2023–24 (£6.4 billion). The introduction of the new working family entitlements mean that this trend has reversed. Total spending stood at £8.4 billion in 2024–25, and is set to be around £10.5 billion in 2025–26.
Targeting in England’s early years system
Given the range of programmes on offer to subsidise childcare – each with its own eligibility criteria, generosity and history of reform – we have previously argued that England’s childcare system is ‘complicated, costly and constantly changing’ (Farquharson, 2021). Last year, the government announced that it would carry out a review of the childcare system during 2026, with the aim of ‘simplify[ing] the system for providers and families, making it easier to access childcare and increasing the overall impact of the government’s offer’ (HM Treasury, 2025). This presents a real opportunity to reconsider how best to spend what has become quite a large funding envelope.
But the first task of the review will be to articulate who England’s childcare system seeks to support and how. While policymaking at other stages of education usually has children and young people’s development as the clear main aim, the policy aims are much more contested in the early years. Indeed, the explicit aim for the new expanded entitlements when they were introduced in Budget 2023 was to increase the share of parents in paid work (and the number of hours worked), with a view to boosting economic growth. A government concerned with bringing down the cost of living and increasing household disposable incomes also looks to childcare policy to help young families through what can be quite an expensive stage of life.
These are all worthy aims, but each implies something slightly different for who early years policy supports and how. For example, a robust international evidence base suggests that formal childcare is most effective at supporting the development of disadvantaged children. But if the aim is instead to support working parents, that implies targeting childcare support to families where parents are in paid work – and so who are not at the very bottom of the income distribution.
To get a sense of how England’s system of childcare support has navigated these questions in the past, Figure 2.11 shows the share of total childcare subsidy support targeted at different groups: all children (based only on age criteria); those in working families; those in disadvantaged families; and those in low-income working families.
Figure 2.11. Shares of early education and childcare subsidies targeted at different groups
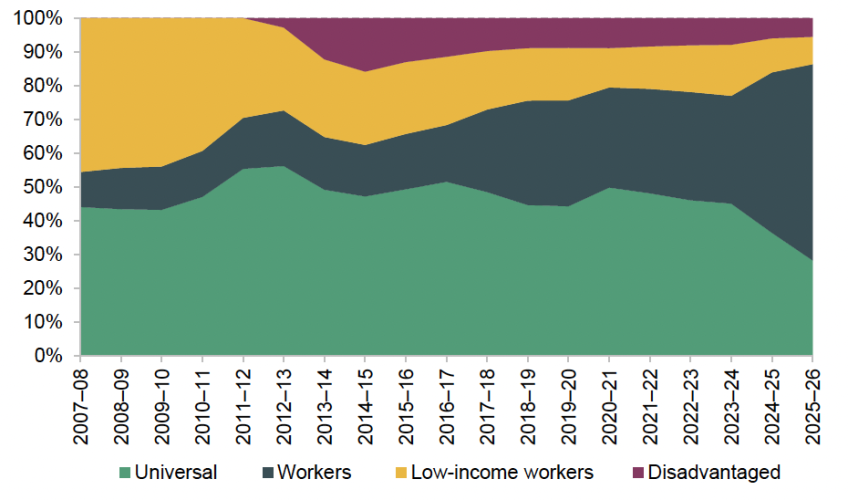
Note: Spending through the benefit system (targeted at low-income workers) is assumed to remain flat in real terms between 2024–25 and 2025–26. Support targeted at students is excluded from the chart.
Source: Department for Education, Childcare and Early Years Provider Survey, 2025 (https://explore-education-statistics.service.gov.uk/find-statistics/childcare-and-early-years-provider-survey/2025) and its predecessors.
To do this, we consider not just the free entitlement, but also state spending on childcare through the benefit system (including the up to 85% childcare subsidy received by families on universal credit, as well as analogous programmes for legacy benefits) and through the tax system (including the top-ups received by families saving into tax-free childcare accounts, as well as spending on legacy childcare voucher programmes). The state also publicly funds childcare through the student grant system (see Box 2.2), though we do not consider this here. We categorise programmes as follows:
- Universal: the 3- and 4-year-old universal entitlement.
- Targeted at working families: the 3- and 4-year-old extended entitlement; the new working family entitlements for children under 3; tax-free childcare; and childcare vouchers.
- Targeted at low-income working families: childcare subsidies via universal credit and legacy benefits.
- Targeted at disadvantaged families: the 2-year-old disadvantage offer in the free entitlement system.
Figure 2.11 focuses on the share of total early years spending allocated to each of these different groups. Importantly, in the context of growing budgets, a declining share does not mean that overall spending is falling.
Still, Figure 2.11 shows that there have been substantial changes in who England’s early years system prioritises. In 2009–10, for example, spending on the universal entitlement was roughly equal to spending on childcare subsidies through the working-age benefit system (43% and 44% respectively), with spending targeted at working families making up the rest. Cuts to the generosity of childcare subsidies in the benefit system saw spending (and thus the share of spending) fall sharply over the early 2010s, with the share of total spending falling by half (to 22%) by 2014–15.
The full introduction of the 2-year-old disadvantage offer in 2014–15 meant that around a sixth of childcare spending was explicitly targeted at low-income families. Since then (as discussed in Section 2.3), a combination of falling population, falling eligibility and lower take-up has seen total spending on the 2-year-old disadvantage offer fall by almost half, from about £1 billion in 2014–15 to £570 million in 2025–26.
The group that has seen its share of total spending grow the most has been working families (whether low-income or not). The share of spending targeted at this group more than doubled over the 2010s, reaching 32% in 2023–24. The introduction of the new entitlements for children under 3 in working families will accelerate these shifts. Between 2023–24 and 2024–25 (when the first phases of the new entitlement roll-out occurred), the share of spending targeted at working families rose from 32% to 48%. In 2025–26, the share rose to 58%. Taking all programmes targeted at working families (low-income and not) into account, the share of spending requiring families to be in paid work has risen by 19 percentage points (from 47% to 66%) in just two years.
2.5 Summary
England’s early years system has undergone a series of transformations over the last 25 years. Public spending on the free entitlement rose from £1.2 billion in 2001–02 to £2.0 billion in 2009–10. But the real growth has happened since then, with the introduction of new entitlements for disadvantaged 2-year-olds, 3- and 4-year-olds in working families, and now children under 3 in working families as well. These new entitlements mean that total spending is £8.7 billion in 2025–26, with a further increase expected in 2026–27 (the first full financial year after the roll-out of the new entitlements). In a context of pressures in many other areas of public services since 2009, the early years system stands out as an area where successive governments have chosen to genuinely increase the scale of what the state delivers.
This rapid growth in spending raises the stakes for good policy design. Unlike other stages of education, spending in the early years has at least three potential direct aims: supporting children’s development by providing high-quality early education; encouraging parents (especially mothers) to work by ensuring a supply of accessible and affordable childcare places; and reducing the amount that families spend on what can be a very expensive service. This trio of objectives maps onto the current government’s opportunity mission, growth mission and cost of living ‘milestone’.
With a policy area that touches on so many core objectives of the government, there is a big opportunity to be had from getting the design of the early years system right. But this also makes policymaking much more difficult. There are real tensions and trade-offs between policies aimed at supporting children’s development or helping families into work – the types of families targeted, the level and design of the subsidy rate, and the emphasis on quality and flexibility will all differ.
Rather than telling policymakers to choose just one objective, the key insight here is to think about whether the early years system as a whole is delivering on these different aims. A well-functioning early years system could have some policies that target labour supply while others focus on child development and the disadvantage gap. Instead trying to ensure that every policy ticks every box risks developing a set of programmes that fail to achieve their potential in each dimension.
3. Schools
In 2025–26, the government is set to provide about £65 billion for school funding in England. This covers day-to-day spending on pupils aged 5–16 in state-funded schools. As such, it represents the single largest element of day-to-day education spending in England. The vast majority of this is provided to schools via the National Funding Formula, which was introduced in 2018. This comprises three blocks: the schools block; the high needs block; and the central school services block. In addition, schools receive extra funding via the pupil premium, with fixed amounts per pupil from disadvantaged backgrounds.
By far the largest of these funding streams is the schools block of the National Funding Formula, which totalled about £49 billion in 2025–26. This covers core day-to-day provision in mainstream primary and secondary schools. The Department for Education uses a central formula, the most important elements of which are pupil numbers (with higher amounts for older pupils), extra funding for schools around London that need to pay higher salaries, higher funding for schools with more deprived pupils, and higher funding for small schools and those in sparsely populated areas, as well as a series of other factors, such as low prior attainment and whether pupils speak English as an additional language. This formula is used to calculate total funding across local authorities, which can then tweak the national formula for schools in their area, but cannot make big or complicated changes. Academies and free schools are essentially treated in an identical way to local-authority-maintained schools in the same local authority.
The second-largest element is the high needs block, which is the main measure of funding for special educational needs and disabilities (SEND) and is paid to local authorities to cover provision across all pupils in their area. This covers the cost of places in special schools and alternative provision, as well as top-ups to mainstream schools if the expected costs of extra provision for individual pupils go above £6,000 per year (which mainly just applies to pupils with Education, Health and Care Plans). The first £6,000 per year is expected to be covered from schools’ core budgets.
Over the last decade, spending on SEND through the high needs block has nearly doubled in real terms, and can account for over half of the increase in total school funding over the period. This has been driven by rapid rises in numbers of pupils entitled to statutory support through Education, Health and Care Plans and rising costs as supply-side capacity fails to keep pace with demand, such as a lack of places in state-funded special schools. The Office for Budget Responsibility (OBR) forecasts that such pressures are likely to intensify, with a £6 billion gap between forecast spending by schools and funding from central government in 2028–29. The high needs block is meant to be ring-fenced and to fully cover schools’ costs above £6,000 per year for each pupil. In reality, local authorities have been forced to spend more, which has led them to build up multi-billion-pound deficits each year, which the OBR forecasts will equate to a total debt of £14 billion by 2027–28. There is also large geographical variation, with the largest deficits seen in Hampshire, Norfolk, and Bournemouth, Christchurch and Poole (Farquharson et al., 2025). The government is set to publish a White Paper with proposals to reform the SEND system early in 2026. If such proposals slow the growth in spending, this would help close the £6 billion expected funding gap. Either way, how the government seeks to reform the SEND system will be the most important factor shaping the budget pressures on all schools in England in coming years.
On top of these main factors, there is also a much smaller block of funding for central school services (close to £500 million per year) to cover the costs of local authority statutory duties and central administration. In addition, secondary schools receive about £3 billion per year in funding for school sixth forms, which represents a crucial component of their budgets. Local authorities then spend about £4 billion from their general funding on services that benefit pupils and schools, such as SEND assessments and transport.
Historically, early years funding has also been part of school funding allocations, particularly nursery classes in primary schools. In our previous annual reports and past analysis of school funding, we have included early years funding as part of school funding to ensure consistency. However, rapid growth in early years funding has made this a problematic assumption and we have therefore improved our methods to exclude early years funding from this year onwards.
In the rest of this chapter, we present trends in total public spending on schools in Section 3.1 and analyse measures of school spending per pupil in Section 3.2. We then undertake new analysis of central spending by academy trusts and local authorities in Section 3.3. We analyse the specific pressures on SEND spending in Section 3.4. We then consider the likely future pressures on school budgets over the period covered by the Spending Review, up to 2028–29. Lastly, we consider capital spending on school buildings and maintenance in Section 3.6. All analysis relates to public spending on schools in England. For further details on the methods used to analyse school spending, please see https://ifs.org.uk/education-spending/methods-and-data.
3.1 Total public spending on schools
In 2025–26, the total core schools budget is set to be about £65 billion in England. This represents the total amount of funding provided by central government to local authorities, academy trusts and schools to fund day-to-day spending on state schools for pupils aged 5–16 (from Reception through to Year 11). This is the main measure of school funding used by the government and is generally set during spending reviews, with further top-ups to this budget provided as and when deemed necessary.
Figure 3.1 shows the total levels of school funding and spending under various definitions. As shown by the green line, the total core schools budget has risen between 2019–20 and 2025–26 by about 16% in real terms or by £9 billion in 2025–26 prices. It has also risen by about 25% or £13 billion in real terms since 2010–11. As we shall see, most of the rise in funding over time can be accounted for by a combination of rising pupil numbers over the 2010s and, more recently, rapid increases in spending on special educational needs and disabilities, as well as compensation to cover the costs of increased employer pension and National Insurance contributions.
Figure 3.1. Various measures of total school spending and funding, actual up to 2025–26 and projected up to 2028–29
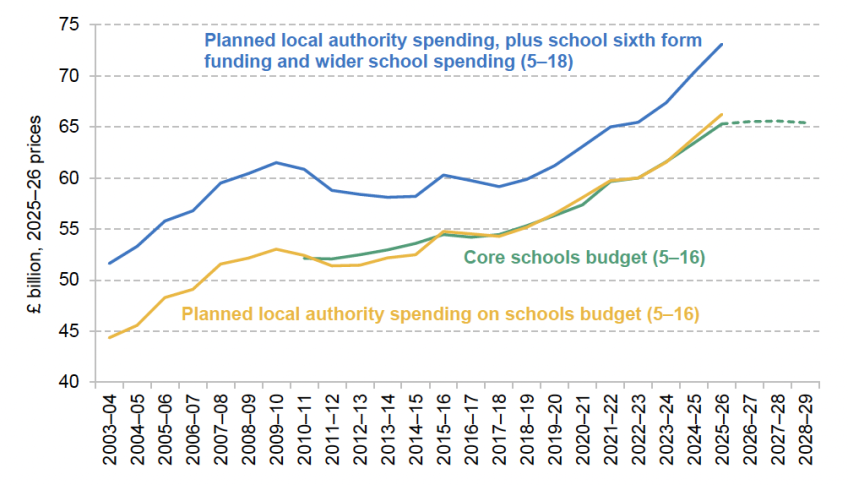
Note and source: Core schools budget taken from Department for Education, ‘School funding statistics’ and HM Treasury, Spending Review 2025. See https://ifs.org.uk/education-spending/methods-and-data for a detailed description of the calculation of local authority (LA) spending on schools. This relates to the ‘schools budget’ only and excludes all spending on the early years. School sixth form funding is based on figures calculated for Figure 4.1. Wider LA spending on schools covers schools-related items in the LA central budget, such as school transport and school improvement services. Department for Education, ‘National pupil projections’. HM Treasury, GDP deflators, November 2025.
In previous annual reports on education spending in England, our main measure of school spending has related to total spending on schools for pupils aged 3–18. This includes funding for both school sixth forms (a crucial part of many secondary schools’ budgets), additional local authority spending outside the formal schools budget (such as SEND transport and assessments) and early years funding (as primary school budgets often included early years funding in historical data).
However, rising levels of early years funding have made it increasingly difficult to interpret trends in this measure of school spending, and made it hard to compare against other official measures of public spending, such as spending totals produced at the time of fiscal events and official statistics on school funding produced by the Department for Education.15 We have therefore adjusted our methods to remove early years funding over time and focus on pupils aged 5 and over.
This has the benefit of allowing us to directly compare our measures with government statistics and proposals, and to show how adding different components of spending can affect aggregate trends over time. The main disadvantage is that we are likely to be overstating the level of spending up to 2009–10 because it is not possible to separate out spending on nursery classes in primary schools before then. We therefore focus on 2010–11 as a crucial year of comparison. This does not affect perceptions of trends over time in spending per pupil as our previous analysis showed almost no real-terms difference between spending per pupil in 2009–10 and 2010–11.
The yellow line in Figure 3.1 shows our estimated level of school spending for pupils aged 5–16. This is directly comparable to the core schools budget so that we can then add other elements of funding outside the core schools budget. Reassuringly, the two series show very similar levels and trends over time. There are two main sources of difference. First, there is a slight discrepancy between 2011–12 and 2014–15, when we are likely to be missing the complex set of grants provided to academies to cover some aspects of local authority spending they did not benefit from. Second, planned spending on schools has exceeded the core schools budget by about £500 million in 2024–25 and by about £900 million in 2025–26. This almost certainly relates to overspending on high needs by local authorities, which we describe in more detail below.
Figure 3.1 then shows (in the blue series) the level of school spending if we add school sixth form funding and wider local authority spending on school services. We generally refer to this as our measure of total school spending, and we estimate that it is likely to total about £73 billion in 2025–26. This measure of school spending was largely constant in real terms between 2010–11 and 2019–20, with small growth in school spending for pupils aged 5–16 offset by large falls in school sixth form funding and wider local authority spending. Since 2019–20, total school spending has risen by 19% in real terms or £12 billion in 2025–26 prices. This is slightly faster than the 17% growth we saw in school spending for pupils aged 5–16. This mainly reflects growth in wider local authority spending, particularly on transport to and from school for children with special educational needs and disabilities.
Figure 3.2 breaks total public spending on schools down into its various components. As shown in Figure 3.1, total spending on schools for ages 5–16 grew by £10 billion or 17% in real terms between 2019–20 and 2025–26. However, about £2.3 billion of this growth can be accounted for by additional grants to compensate schools for higher employer pension and National Insurance contributions. From the perspective of a school, this is extra money to directly pay for extra outgoings, with no change in real resources. If we exclude these grants, total spending grew by about 13% or £7.5 billion between 2019–20 and 2025–26.
Figure 3.2. Components of local authority spending on schools, 2015–16 to 2025–26
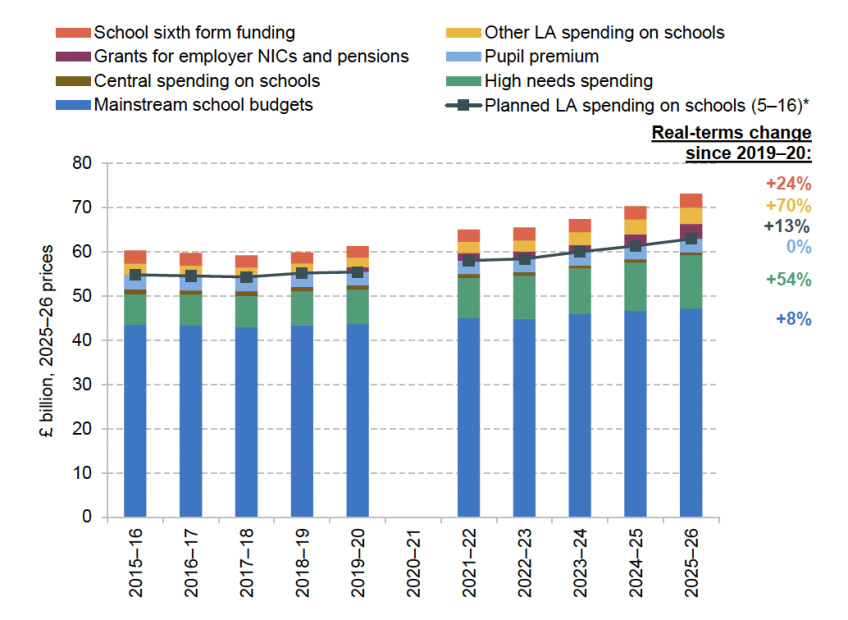
* Planned LA spending for ages 5–16 excludes grants for changes to employer pension contributions and employer National Insurance contributions.
Note and source: See https://ifs.org.uk/education-spending/methods-and-data for a detailed description of the calculation of local authority (LA) spending on schools. Wider LA spending on schools covers schools-related items in the LA central budget, such as school transport and school improvement services. Department for Education, ‘National pupil projections’. HM Treasury, GDP deflators, November 2025.
Total spending on schools for pupils aged 5–16 (excluding pension and National Insurance grants) can then be broken down into four main components, which are very different in terms of their levels and growth over time:
- Mainstream school budgets. The single largest element of school spending is funding for mainstream state schools, which totalled about £47 billion in 2025–26. This is funding provided direct to primary and secondary schools to spend on core provision. It is allocated using the ‘schools block’ of the National Funding Formula. Central government sets the national formula, with important factors including pupil numbers, levels of deprivation and London weighting. This fully determines the amount local authorities receive. However, local authorities can tweak the formula for schools in their area, which determines the amount maintained schools and academies receive via the ‘schools block’. Spending on mainstream school budgets has risen by 8% in real terms since 2019–20, significantly below the overall growth in spending.
- High needs spending. This is the main element of spending on special educational needs and disabilities. It covers funding for special schools and alternative provision, as well as top-ups provided to mainstream schools where the costs of required provision exceed what schools are expected to deliver from their core budgets. Spending on high needs has risen substantially over time: planned spending on high needs (excluding the early years) has risen by 54% in real terms since 2019–20. As we discuss further in Section 3.4, this is highly likely to be an underestimate of actual spending by local authorities.
- Central spending. This mostly relates to core and statutory duties that local authorities are required to deliver, such as school admissions and place planning. It can also cover central administration spending, such as HR and finance services for schools. This is a small element of overall spending, and fell from about £1 billion in 2019–20 to about £0.7 billion in 2025–26. Funding is provided as part of the ‘central school services block’.
- Pupil premium. The fourth component is the ‘pupil premium’, which is a direct payment to schools based on the number of disadvantaged pupils. The main elements are the deprivation factors, with £1,515 per year for primary school pupils who have been eligible for free school meals in the last six years and £1,075 per year for such pupils in secondary schools. These pupil premium rates were frozen in cash terms between 2015–16 and 2021–22. Rates then increased in cash terms from 2022–23 onwards, but did not always keep pace with overall inflation. As a result, pupil premium rates in 2025–26 are over 16% lower in real terms in 2025–26 than they were a decade earlier in 2015–16. Offsetting this, total pupil premium funding has been pushed up by growth in the numbers of pupils eligible for free school meals in recent years as part of transitional protections as universal credit has been rolled out. As a result, total pupil premium funding in 2025–26 is about 8% lower in real terms than in 2015–16 (as compared with 16% lower rates) and about the same level in real terms as in 2019–20. The government has recently indicated that it is intending to consult about changing the measure of deprivation used in the pupil premium and other school deprivation funding, such as by using more detailed family income measures linked to individual pupils. This would be a welcome change as eligibility for free school meals is a relatively blunt measure of deprivation.
As is clear, growth in high needs spending has far outpaced growth in all the other elements of spending on pupils aged 5–16. Indeed, growth in high needs spending can explain over half of the increase in overall funding since 2019–20, despite only representing about a sixth of overall spending. This has led to a significant squeeze on mainstream school budgets, which we will return to, in terms of both past and likely future trends.
In addition to high needs spending shown in green in Figure 3.2, local authorities also spend nearly £4 billion per year on other services that mostly or largely benefit schools and pupils, such as SEND assessments and transport (this is shown by the yellow bars). This spending fell significantly in real terms over the 2010s, with a 12% real-terms drop between 2015–16 and 2019–20. Since then, spending has grown by £1.5 billion or 70% in real terms. This is mostly explained by SEND transport and assessment spending, which has grown by £1.1 billion or more than doubled in real terms since 2019–20.
Secondary schools also receive around £3 billion annually in funding for school sixth forms (the red bars in Figure 3.2). This fell by about 16% in real terms between 2015–16 and 2019–20, reflecting the sustained declines in sixth form funding per pupil and reduced numbers of sixth form pupils. Since 2019–20, this funding has gone up by about 24% in real terms, exceeding the overall growth in school spending for pupils aged 5–16. This reflects rising numbers of sixth form pupils and increases to funding rates (see Chapter 4 for further details).
3.2 State school spending per pupil
In this section, we examine trends in state school spending per pupil. We start by examining total spending per pupil, using the measures of spending discussed in the previous section. We then consider levels of spending per pupil in state primary and secondary schools, covering only the actual levels of spending by primary and secondary schools (rather than by local authorities).
Total school spending per pupil
In Figure 3.3, we present a range of measures of total school spending per pupil, reflecting the different spending definitions we used in Section 3.1. We also show how spending per pupil has changed since 2010–11.
Figure 3.3. Total school spending per pupil, actual up to 2025–26 and projected up to 2028–29
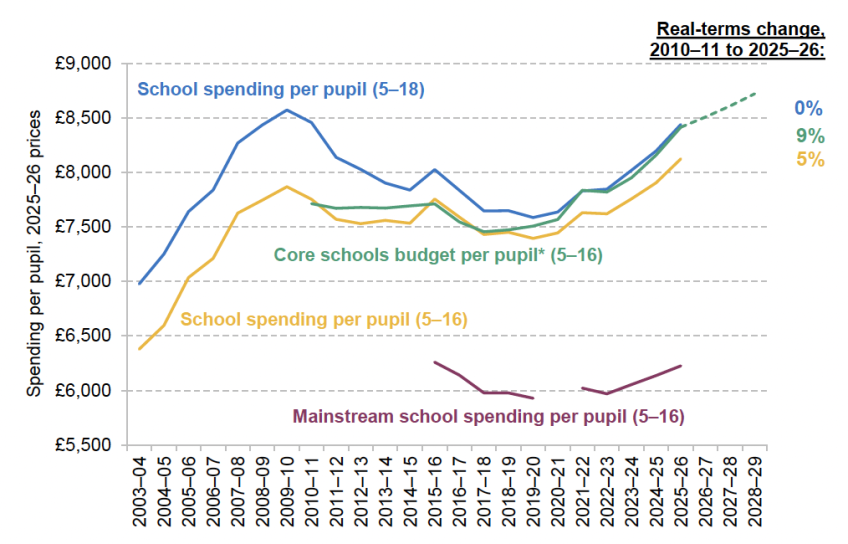
* Core schools budget per pupil includes grants for changes to employer pension contributions and employer National Insurance contributions.
Note and source: See https://ifs.org.uk/education-spending/methods-and-data. HM Treasury, GDP deflators, November 2025. No data are available for 2020–21, so this is imputed based on a constant real-terms growth rate between 2019–20 and 2021–22.
First, we examine trends in the core schools budget per pupil aged 5–16. This is the main measure of spending used by the Department for Education in its school funding statistics, and includes grants to compensate schools for increased employer pension and National Insurance contributions. This measure of spending per pupil fell by 3% in real terms between 2010–11 and 2019–20, before rising by 12% since 2019–20, and it is now about 9% higher than in 2010–11.
As shown in Figure 3.3, our separate measure of planned school spending for pupils aged 5–16 shows identical trends to the core schools budget. To further understanding, the series in yellow shows planned school spending for pupils aged 5–16, excluding grants for increases to employer pension and National Insurance contributions. If we exclude these grants, spending per pupil fell by 5% between 2010–11 and 2019–20 and has since risen by 10% in real terms. This leaves spending per pupil about 5% higher than in 2010–11.
In the blue line, we add school sixth form funding and wider local authority spending on school services. Under this measure, total school spending per pupil aged 5–18 fell by 10% in real terms between 2010–11 and 2019–20. This is higher than the much-cited 9% fall that we have found in past analysis. This change reflects two main factors: the exclusion of early years funding (which rose over this period) and historical revisions to economy-wide inflation. Since 2019–20, this measure of spending per pupil has risen by 11% in real terms, largely in line with spending on pupils aged 5–16. As a result, spending per pupil aged 5–18 is now about the same level as it was in 2010–11.
Our final series (in burgundy) shows mainstream school spending per pupil back to 2015–16 (this excludes high needs spending from the spending total and excludes pupils in special schools and alternative provision from the pupil count). Mainstream school spending per pupil has risen by 5% in real terms since 2019–20, about half of the overall rise in school spending per pupil over this period. Furthermore, there has been almost no net real-terms change in mainstream school spending compared with 2015–16. This emphasises just how much trends in overall school spending can be explained by rapid rises in high needs spending, and the resultant squeeze on mainstream school budgets.
In our view, the measure of total school spending per pupil aged 5–18 (the blue series on Figure 3.3) represents the most comprehensive and consistent measure of the real-terms changes in school spending per pupil. It includes all spending, including the important effects of falling school sixth form funding on secondary school budgets and change to local authority spending that directly affects pupils and schools. However, showing multiple measures allows us to provide a richer perspective by illustrating the real-terms changes in the specific budgets for pupils aged 5–16 and how rising high needs spending is squeezing mainstream school budgets.
Looking to the future, we have already seen that the core schools budget is due to be frozen in real terms between 2025–26 and 2028–29. After accounting for the expected fall in pupil numbers, this equates to a 4% rise in real-terms spending per pupil. The likely future path of our other measures of school spending will be determined by school sixth form funding (see Chapter 4) and actual levels of spending on high needs (we consider this directly in Section 3.4).
Average spending by primary and secondary schools
Figure 3.4 shows our estimates for the level of primary and secondary school spending per pupil in England from the late 1970s through to 2023–24 (in 2025–26 prices), together with projections up to 2025–26. Actual figures up to 2023–24 are based on spending levels by individual schools. This includes spending on school sixth forms, but excludes central spending by local authorities and multi-academy trusts.16 We consider this spending directly in the next section.
Figure 3.4. Primary and secondary per-pupil spending by schools, actual up to 2023–24 and projected up to 2025–26
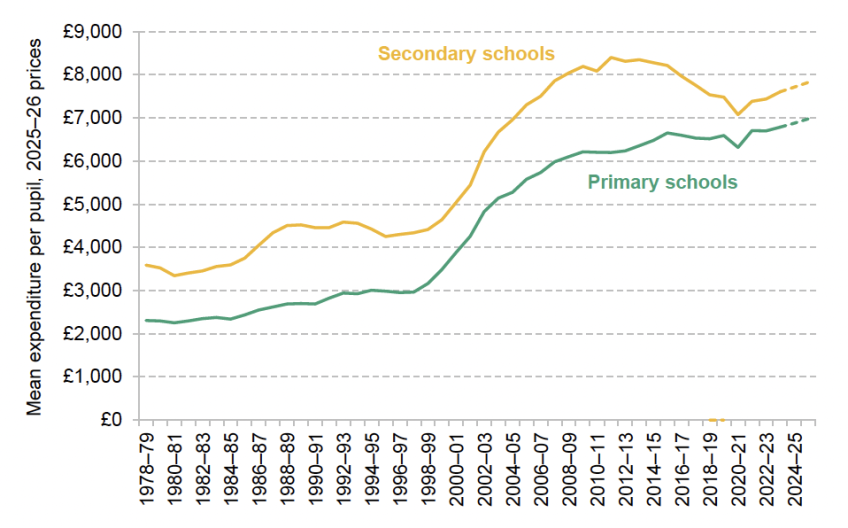
Note and source: Dashed lines are projections based on mainstream school spending per pupil in Figure 3.3. See https://ifs.org.uk/education-spending/methods-and-data. HM Treasury, GDP deflators, November 2025.
We see that spending per pupil has evolved in a number of distinct phases:
- Modest growth over the 1980s and 1990s. Over the period of Conservative government between 1979 and 1997, real-terms spending per pupil rose by about 1.4% per year in primary schools and by about 1.0% per year in secondary schools.
- Rapid growth over the 2000s. From 1999 onwards, spending per pupil grew rapidly. During the period of Labour government between 1997 and 2010, spending per pupil grew by about 5.9% per year in primary schools and by about 5.1% in secondary schools.
- Spending squeeze over the 2010s. There was a squeeze on funding between 2010 and 2019. Secondary school spending per pupil fell by about 0.9% per year over this period, whilst primary school spending per pupil rose by 0.5% per year. This averages out to a small real-terms cut in spending per pupil over the decade. Secondary schools saw a worse picture mainly due to big reductions in school sixth form funding.
- Recovery in spending since 2019. Since 2019, we have seen a recovery in spending per pupil, with 1% per year real-terms growth in primary and secondary school spending per pupil expected between 2019–20 and 2025–26. However, this is still below the historical rates of growth. Over the long run, real-terms spending per pupil has grown by about 2.4% per year in primary schools and by 1.7% in secondary schools.
The gap between secondary and primary school spending has decreased significantly over time. In the 1980s, secondary school spending per pupil was about 56% higher than primary school spending per pupil. This narrowed to 49% in the 1990s and then to 30% in the 2000s. This narrowing continued through the 2010s, and the secondary:primary school funding difference is due to be only 12% in 2025–26. This more recent narrowing will partly reflect the large reductions in school sixth form funding. This is a significant long-term relative shift in funding and resources from secondary to primary schools.
In the ‘Methods and data’ section of the dedicated website,17 we compare spending per pupil in academies and local authority maintained schools. For the most recent year of data, we see that spending per pupil is about £400 or 6% higher in local authority maintained schools than in academies amongst primary schools, and about £300 or 4% higher amongst secondary schools. Some of these differences will reflect the composition of each group. However, they will also reflect the fact that multi-academy trusts can hold back some funding to spend centrally across all their schools, which is known as ‘top-slicing’. This covers central services that local authorities would normally provide for maintained schools, but it can also cover some aspects of core provision. As we describe in the next section, this phenomenon tends to be increasing over time, with multi-academy trusts currently spending about £500 per pupil centrally (more than double the amount in 2016–17).
3.3 Central school spending
While most school spending is the responsibility of individual schools, around £3.2 billion of total school spending in 2023–24 was ‘central spending’. What this relates to differs by school type: for local authority maintained schools it is money spent directly by the local authority (not including high needs spending), while for academies it is money spent by the academy trust, although academies will also receive some amount of local authority central spending. Notably, the amount per pupil that has been ‘top-sliced’ from school budgets by academy trusts is much higher than per-pupil local authority central spending. Furthermore, it has increased significantly in recent years, now making up 6.5% of academy spending. As a result, we focus on central spending by academy trusts here.
Since 2016–17, the amount per pupil spent centrally by academy trusts has more than doubled, from £240 to £510 (Figure 3.5), which compares with a slight decline from £230 to £180 in the amount spent centrally by local authorities. This roughly mirrors the growing gap between academies and maintained schools in per-pupil school spending since 2016–17 that can be seen in the ‘Data and methods’ section of the website. This suggests an increasing tendency for functions to be centralised by academy trusts. This reflects two underlying trends. First, academy trusts have on average become larger over this period, and central spending is higher in bigger trusts. Second, even within trusts of a given size, central spending has risen (see https://ifs.org.uk/education-spending/methods-and-data).
Figure 3.5. Central school spending by academy trusts and local authorities, £ per pupil
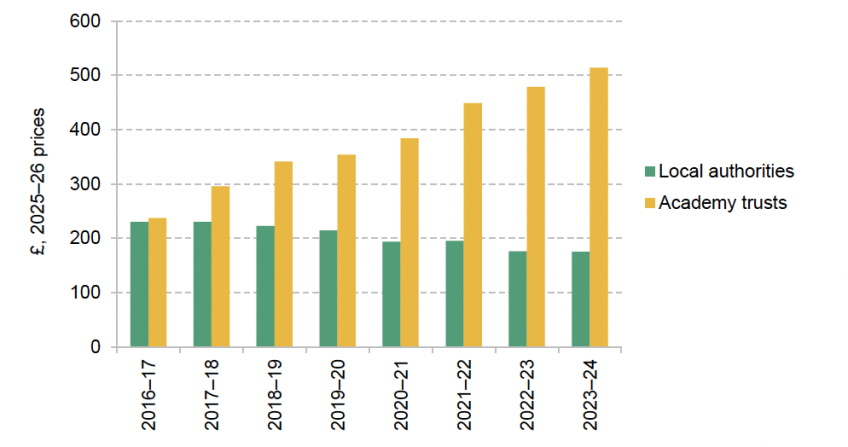
Source: Central spending for maintained schools is taken from Department for Education, LA and school expenditure, and includes sections 1.1, 1.4 and 1.6. Central spending for academies is taken from the ‘central services’ data in Department for Education, Financial Benchmarking and Insights Tool. HM Treasury, GDP deflators, November 2025.
Central spending by academy trusts can cover a range of things. For instance, often functions that typically were the responsibility of individual schools can be centralised by trusts, such as administrative duties. Such centralisation may offer economies of scale and therefore reduce overall costs. Figure 3.6 shows the amount spent centrally per pupil by academy trusts on different elements of spending. The largest elements relate to the direct employment of administrative and educational staff by the academy trust, spending which typically would have been the responsibility of individual schools but has increasingly been centralised by academy trusts.
Figure 3.6. Total academy central spending by category, £ per pupil, 2023–24
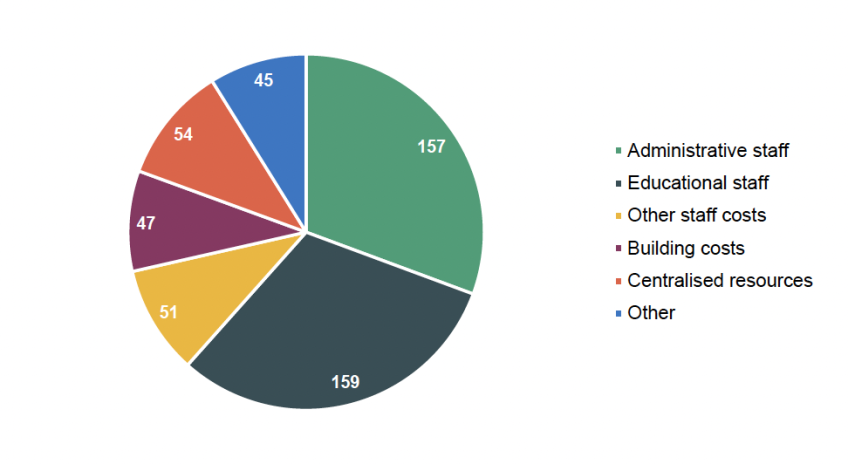
Note and source: ‘Central services’ data in Department for Education, Financial Benchmarking and Insights Tool. Categories have been amalgamated for clarity. 2025–26 prices. HM Treasury, GDP deflators, November 2025.
3.4 Spending on special educational needs and disabilities
Local authority spending on pupils with special educational needs and disabilities (SEND) has risen significantly in recent years (Figure 3.7). This has been driven by the sharp increase in the number of pupils with Education, Health and Care Plans (EHCPs), documents intended for those with the most complex additional needs and which set out the provision that they are legally bound to receive. Historically, the share of pupils with EHCPs or their earlier equivalent hovered just below 3%; today this share is 5.3%. The exact mix of factors behind this is complex (see Latimer, Sibieta and Snape (2025) for an overview), but crucially the trend towards more children with EHCPs shows no sign of slowing. As a result, high needs spending has risen from £7.8 billion in 2015–16 to £11.8 billion in 2023–24. The Office for Budget Responsibility has forecast that this will rise to over £18 billion in real terms by 2028–29, with £1.7 billion (13%) real-terms growth in spending in 2025–26 alone.
Figure 3.7. Actual and forecast high needs spending and funding, 2015–16 to 2028–29

Note and source: Cumulative deficits begin in 2019–20 as this is when the statutory override began; see below for more information. High needs spending and funding figures taken from Office for Budget Responsibility, Economic and Fiscal Outlook: November 2025. High needs spending relates to spending allowable from the high needs block of the Dedicated Schools Grant; this funds the high needs costs that local authorities bear, i.e. all spending on pupils in special schools and high needs spending above £6,000 per pupil in mainstream schools. Figures in 2025–26 prices as adjusted by HM Treasury, GDP deflators, November 2025.
Funding has not kept pace with spending, resulting in growing in-year deficits. As a result of funding consistently undershooting what local authorities are legally required to spend, the government has suspended the high needs funding formula for 2026–27 and plans to review high needs funding as part of wider upcoming reforms to the SEND system (Department for Education, 2025a).
Figure 3.8 shows the breakdown of high-needs spending by category in 2024–25 and 2018–19 (when we can first reliably observe this breakdown). There has been a rise in spending across every category, with particularly fast growth in top-up funding to pupils in independent schools. Placements in independent special schools cost on average over £60,000 a year (National Audit Office, 2024) and as a result account for over £2 billion of high needs spending despite only 6% of pupils with EHCPs attending them.18 This rise in spending on high needs pupils in independent schools may partly be driven by capacity constraints in the state special sector, where placements are lower-cost.
Figure 3.8. High needs spending by category, 2024–25 versus 2018–19
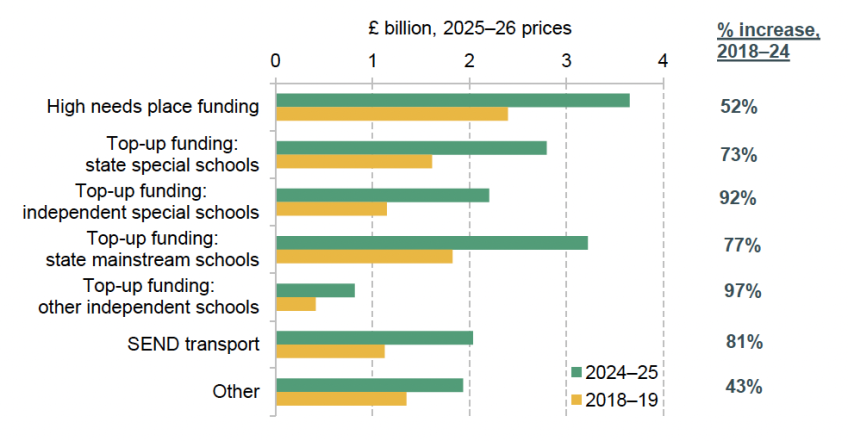
Note and source: See Sibieta and Snape (2024) for spending calculation methodology. Figures in 2025–26 prices as adjusted by HM Treasury, GDP deflators, November 2025. Some elements of spending not funded from the high needs budget and therefore not typically what we consider ‘local authority high needs spending’ have been included here (line 2.1.2 and those relating to SEND transport in section 2 of Section 251 returns).
Crucially, however, all parts of this system have seen substantial growth in spending, indicating that reform across all areas would be needed to reduce overall spending pressures. Indeed, the area that has seen the largest absolute growth in spending is top-up funding to state-funded mainstream schools, which has grown by £1.4 billion in real terms since 2018–19. This is primarily due to the fact that, partially because of capacity constraints in special schools, the vast majority of ‘new’ pupils with EHCPs are in mainstream schools. Therefore, although placements in mainstream schools tend to be much less expensive per pupil, the sheer number of pupils with EHCPs now in mainstream schools has prompted a large rise in spending. This indicates that, even if reforms encourage ‘inclusion’ of SEND pupils in mainstream schools, if the rise in numbers with EHCPs continues then spending will still see a significant increase.
In the 2025 Budget, the government announced that, from 2028–29, high needs spending would be managed within central government spending. It is not clear at all what this means in practice. It could imply central government taking direct responsibility for SEND provision, in place of local authorities, which would be a very significant change. It could also imply no change to the system as high needs spending is already meant to be managed within funding provided by central government.
There are also a number of other significant questions, the first being how the government is planning to address the historic deficits that local authorities have been running in their high needs budget due to the cost of the high needs provision they are required to provide consistently outstripping the funding provided. These deficits have been allowed to build up since 2019 due to an accounting fudge known as the ‘statutory override’, which is due to end in 2028. By that year, the Office for Budget Responsibility forecasts that cumulative high needs deficits (the total debt) will have reached £14 billion in real terms. The government has indicated that local authorities will be expected to meet some but not all of these costs, but the exact shape of any support is yet to be specified (Ministry of Housing, Communities and Local Government, 2025).
The other significant question that remains is how central government will deal with high needs spending that is forecast to be £6 billion higher than forecast funding for 2028–29. There are essentially three options for how it could choose to deal with this gap: reducing high needs spending; topping up high needs funding from within the Department for Education’s existing budget; or topping up high needs funding from other sources.
On the first option, the government has committed to introducing reforms to the SEND system in the upcoming schools White Paper, expected to be published early in 2026. Such reforms might be able to slow the growth in spending and thereby reduce this anticipated funding gap. As mentioned above, spending on fees in independent special schools has grown particularly fast, and so reforms that improve the capacity of mainstream or state-funded special schools to accommodate high needs pupils could ease pressures somewhat. However, placements in these settings are still typically high-cost, and so continued growth in numbers with EHCPs would still likely mean a rise in overall spending.
Instead, reforms that reduce demand for EHCPs, or the cost of providing the support they set out, would likely be needed to meaningfully slow high needs spending growth. For example, this would likely involve increasing the baseline ability of mainstream schools to support students with high needs, for instance through additional training of teachers and pooling of expertise with special schools (see Sibieta and Snape (2025b) for further discussion). Crucially, these measures would likely require up-front investment to support schools and the savings would likely take time to materialise. With high needs spending forecast to rise (in real terms) by 13% just this year, and given that reform has been delayed for so long, it will be challenging for reforms to significantly reduce the funding gap by 2028–29.
Given these challenges, it is reasonable to assume there will still be some funding gap in 2028–29. As a result, high needs funding would have to be topped up from other sources. To put this into context, the £6 billion funding gap that is forecast is 9% of the total schools budget for 2028–29 and 11% of mainstream school spending. Meeting this pressure from within the Department for Education’s existing budget would therefore imply large cuts to per-pupil spending. Topping up its budget to prevent or limit such changes to other school spending instead would imply lower spending elsewhere, higher taxes or higher borrowing.
3.5 Future school cost pressures
Looking to the future, we showed in Section 3.1 that the core schools budget is expected to be essentially flat in real terms between 2025–26 and 2028–29. After accounting for an additional £400 million in funding to expand eligibility for free school meals and an expected drop in pupil numbers, this amounts to a 3% rise in real-terms spending per pupil over the three years. However, the key pressures on school budgets will largely depend on what happens with SEND spending, staff pay recommendations and how the system responds to falling pupil numbers.
Figure 3.9 compares trends in school funding per pupil with trends in costs. For 2024–25 and 2025–26, this reflects actual or estimated figures, whilst we show projections for 2026–27 and beyond. Figures are presented in cash terms so that we can directly compare funding and cost growth over time.
Figure 3.9. Estimated and projected cash-terms growth in school costs and funding over time, actual up to 2025–26 and projected thereafter
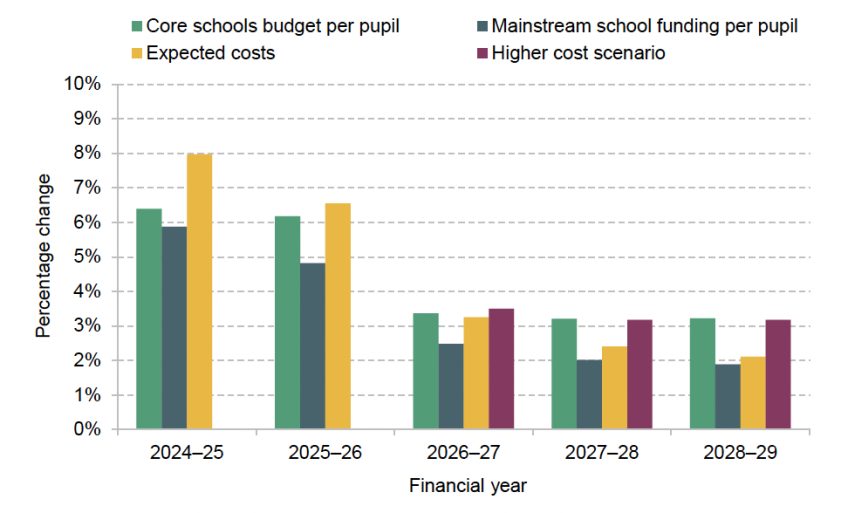
Note and source: See Figure 3.1 for sources for cash-terms growth in funding. School costs are calculated as a weighted average of actual and projected growth in teacher paybill, other staff paybill and non-staff costs. The higher cost scenario increases projected future staff pay rises to 3% per year and adds 0.25% per year for growth in the costs of SEND provision. Further details can be found at https://ifs.org.uk/education-spending/methods-and-data.
For 2024–25 and 2025–26, mainstream school funding per pupil (the core schools budget less high needs spending) has been growing by less than overall funding per pupil. This reflects the rapid rises in SEND spending. Partly as a result, mainstream school funding per pupil grew by 2 percentage points less than school costs. This will have put school budgets under pressure. Indeed, if we look at the whole period since 2019, spending on SEND has absorbed over half of the overall increase in school funding.
Looking forwards, the core schools budget is due to grow by about 3% per year in cash terms between 2025–26 and 2028–29. However, with huge pressures on SEND spending, it seems highly likely that the government will allocate a large share of the rising schools budget to cover increased costs of SEND provision. For instance, the government could seek to freeze real-terms mainstream school spending per pupil. This would match the trends seen since 2015–16. Under this scenario, the government could release about £1.8 billion in funding that could be used towards filling the £6 billion SEND funding gap expected for 2028–29, though that still leaves about £4 billion to be filled through other means.
Under a real-terms freeze in mainstream school spending per pupil, cash-terms funding per pupil for primary and secondary schools would grow by about 2% per year. This is already starting to happen, with growth of 2.1% in main factor values in the National Funding Formula confirmed for 2026–27.19 This is clearly a tight picture, with a number of risks and uncertainties.
First, there is uncertainty on the actual path of schools’ costs. Over 80% of schools’ costs are staff costs. Annual staff pay awards will be determined by the government after receiving recommendations from the independent pay review bodies for teachers (School Teachers’ Review Body, STRB) and schools support staff (the new School Support Staff Negotiating Body, SSSNB). With regards to teachers, the government has sought multi-year recommendations for 2026–27, 2027–28 and 2028–29 (with the last being indicative). If we assume that recommendations for all staff are in line with forecasts for average earnings (around 3% for 2026–27 and about 2% thereafter), then the picture looks tight for schools, with funding per pupil growth lagging costs by about 0.5% per year (compare grey and yellow bars in Figure 3.9). In its evidence to the STRB, the government proposed a total pay offer of 6.5% covering the three years. This would be slightly below the current forecast growth in average earnings (7.6%) and, if implemented, may slightly ease the pressure on school budgets, but may make it harder for the government to achieve its goals on teacher recruitment and retention.
However, if average earnings growth (and pay awards) were closer to 3% per year (the average for the period between 2010–11 and 2024–25) and the costs of SEND provision also added 0.25% to cost growth (as has occurred in recent years), then schools’ costs would lag mainstream funding growth by about 1% per year over the next three years (compare grey and burgundy bars).
Second, falling pupil numbers imply falling total school budgets. Indeed, the government would only be able to realise the £1.8 billion in savings if policymakers and schools are able to cut resources, such as through staff reductions or reducing the number of schools in the system. Historical experience suggests this is possible, but does require careful planning to minimise any impacts on pupil attainment.
3.6 Capital spending
Lastly, we consider capital spending on school buildings and maintenance. Figure 3.10 shows the historical trends in education capital spending in England back to 2002–03, including plans up to 2028–29. As the government has yet to fully determine spending across different programmes, we focus on aggregate spending. The vast majority of education capital spending relates to schools, though some will relate to further education colleges in recent years, which we highlight below.
Figure 3.10. Education capital spending in England over time, actual and plans in 2025–26 prices
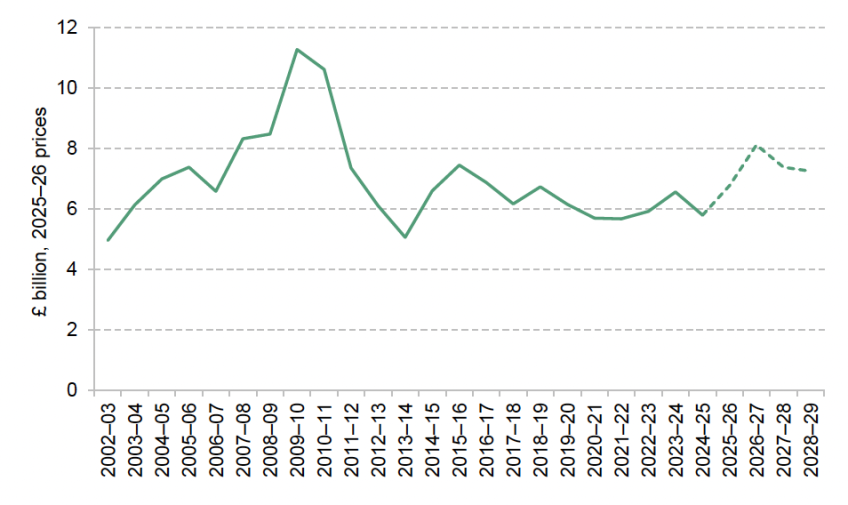
Note: Public Expenditure Statistical Analyses 2025, 2023, 2020, 2019, 2014, 2013, 2010 (https://www.gov.uk/government/collections/public-expenditure-statistical-analyses-pesa) and 2008 (https://www.gov.uk/government/statistics/public-expenditure-statistical-analyses-2008). Plans for 2026–27 to 2028–29 taken from HM Treasury, Spending Review 2025; HM Treasury, GDP deflators, November 2025.
As can be seen, capital spending tends to be lumpy over time. There was a large increase in spending in the late 2000s, with spending increasing from nearly £7 billion in the mid 2000s to around £11 billion in 2009–10 and 2010–11 (all in today’s prices). The large increase reflects the last Labour government’s Building Schools for the Future programme, with delays in this programme leading to the big upticks in spending in 2009–10 and 2010–11. There was then a large decline up to 2013–14. Since then, overall capital spending has oscillated around £6–7 billion per year in today’s prices. Plans for 2025–26 remain well within this range and thus not significantly different from experience over the last decade.
Looking to the future, the government is planning to increase education capital spending up to £8 billion in 2026–27, before it then falls back to just over £7 billion in 2027–28 and 2028–29 (all in today’s prices). This pattern is likely to reflect delays in the school rebuilding programme, which has pushed much planned expenditure into 2026–27 from earlier years. The planned level of £7.2 billion for 2028–29 would leave capital spending about the same level as in the mid 2010s and mid 2000s.
To get a sense of the government’s priorities for education capital spending, we can examine how the capital budget for 2025–26 is due to be allocated. Out of the £6.8 billion in planned education capital spending for 2025–26, the government currently expects to spend:20
- £2.1 billion on school maintenance and repairs;
- £1.4 billion on the school rebuilding programme;
- £740 million on improvements to high needs provision, including greater provision in mainstream schools;
- £670 million for new free schools;
- £520 million for local authorities to provide new school places;
- about £300 million for other smaller schools capital programmes, including £160 million to remedy schools affected by RAAC;
- nearly £1 billion in capital spending on further education colleges.
3.7 Summary
Following a 10% real-terms reduction in school spending per pupil between 2010–11 and 2019–20, there has been a recovery in school spending that has brought spending per pupil approximately back to 2010 levels. On the face of it, there has been a £7.5 billion or 13% increase in school funding since 2019–20. However, over half of the overall increase in school funding over this period has been absorbed by the growing cost of SEND provision. As a result, there has been much less growth in mainstream school spending per pupil, which has barely increased in real terms since 2015–16.
The Office for Budget Responsibility currently forecasts that spending on SEND will be about £18 billion in 2028–29 (in today’s prices), almost double the level in real terms in 2015–16. This is about £6 billion more than forecast funding in 2028–29. To fill this gap, the government essentially has three options: slow the growth in spending; top up the schools budget; or reduce mainstream school funding. Slowing the growth in spending and providing better-quality provision is likely to be a big focus of the upcoming schools White Paper. Providing additional funding is likely to be challenging. For context, the £6 billion funding gap forecast for 2028–29 represents about 9% of total school funding and about 11% of mainstream school funding.
Looking forwards, the government has effectively frozen the core schools budget in real terms between 2025–26 and 2028–29, with extra funding on top to expand eligibility for free school meals. This settlement implies a 3% real-terms rise in overall funding per pupil as pupil numbers are expected to fall for the next few years. To help find extra funding for SEND, the government could seek to freeze mainstream school funding per pupil over the next three years. This would likely release about £1.8 billion by 2028–29. However, this would likely be a tight picture for schools, with funding per pupil growing by about 0.5–1 percentage points less than our projections for school costs. Furthermore, the government can only make savings from falling pupil numbers if it actually delivers reductions in resources, such as through reducing staff numbers or closing schools.
4. Further education and skills
Further education and skills cover a large and diverse part of England’s post-16 education system. They include non-university academic and technical provision for young people beyond compulsory schooling, as well as training and education for adults at different stages of their working lives. Public spending on further education therefore supports a wide range of learners and objectives, spanning initial post-16 study, reskilling and retraining, and the provision of vocational and technical courses. In this chapter, we distinguish between two broad parts of the further education and skills system – 16–18 further education, and adult education and skills – and examine how spending has evolved over time in each.
Among all areas of education, further education saw the largest reductions in spending the decade following 2010. This reflects a long-standing pattern in education funding (Drayton et al., 2023): when overall spending increases, further education typically receives smaller increases than other parts of the system, while periods of budgetary restraint tend to be associated with relatively larger reductions than in other areas. Although there has been additional funding for the sector since 2019, the increases have fallen short of reversing the substantial real-terms cuts experienced since 2010.
At the 2025 Spending Review, the government announced an increase in day-to-day funding for further education and skills that implies a real-terms rise of just over £300 million between 2025–26 and 2028–29. This settlement covers the main components of the further education and skills budget – 16–19 education, adult skills and apprenticeships – which together account for around £14 billion of public spending in 2025–26. However, the Spending Review did not set out how this additional funding will be allocated across the different parts of the further education and skills system, leaving scope for it to be distributed in different ways.
There were also a number of policy and institutional changes in 2025 with implications for spending on further education and skills. Responsibility for adult education and apprenticeships was transferred from the Department for Education to the Department for Work and Pensions. The government also published the long-awaited Post-16 Education and Skills White Paper setting out proposals for the organisation, governance and funding of the post-16 system (Department for Education, 2025b). As discussed in Ogden and Tahir (2025), the proposed reforms in the White Paper vary considerably in their level of development: some are policies that have previously been announced, while others are genuinely new policies at a much earlier stage and require substantial further design. Although the White Paper set out a broad range of policies, there was limited detail on how different strands are intended to fit together or how key trade-offs within the skills system would be addressed.
In this context, the remainder of this chapter sets out trends in spending across further education and skills. Section 4.1 examines spending per student in 16–18 education and Section 4.2 analyses overall spending on adult education and skills. Sections 4.3 to 4.5 then consider key components of adult education and skills spending in turn – classroom-based provision, apprenticeships and further education loans – before Section 4.6 assesses the financial position of further education colleges and the pressures they are likely to face in the coming years. Further details on the data and methods used in this chapter are provided at https://ifs.org.uk/education-spending/methods-and-data.
4.1 Spending on 16–18 education
There are around 1.7 million young people aged 16–18 in further education and training in England.21 In this report, we use the term 16–18 education to refer to post-16 study undertaken by young people at further education providers, including school sixth forms, sixth-form colleges and further education colleges. This includes students taking A levels, technical qualifications and, in some cases, lower-level courses such as GCSE resits. Together, there are just over 2,800 further education providers with around 2,400 school sixth forms (including academies) and around 400 further education and sixth-form colleges.
Funding arrangements differ across these provider types. School sixth forms are funded through the 16–19 funding system, though schools with sixth form provision also receive funding for younger pupils through the school funding system. Further education and sixth-form colleges receive funding specifically for post-16 education, including both 16–18 provision and adult skills funding. For colleges, public funding for 16–18 education represents a major component of overall resources, accounting for nearly 60% of the total income of further education colleges in England (Moura and Tahir, 2024). In the analysis that follows, we focus on allocations made through the 16–19 funding system, which finances education for 16- to 18-year-olds (and a small number of 19-year-olds), and use these allocations to calculate funding per student.
Figure 4.1 illustrates funding per student aged 16–18 in school sixth forms, further education colleges and sixth-form colleges across academic years starting from 2013–14 (the earliest year available in the data). The figures are based on annual funding allocations published by the Department for Education, which set out the total public funding allocated to each provider for the education of 16- to 19-year-olds. These allocations are determined centrally using a national funding formula, with key factors including lagged student numbers, the types of programmes studied, area cost uplifts and measures of disadvantage.
Figure 4.1. Funding per student in further education colleges, sixth-form colleges and school sixth forms
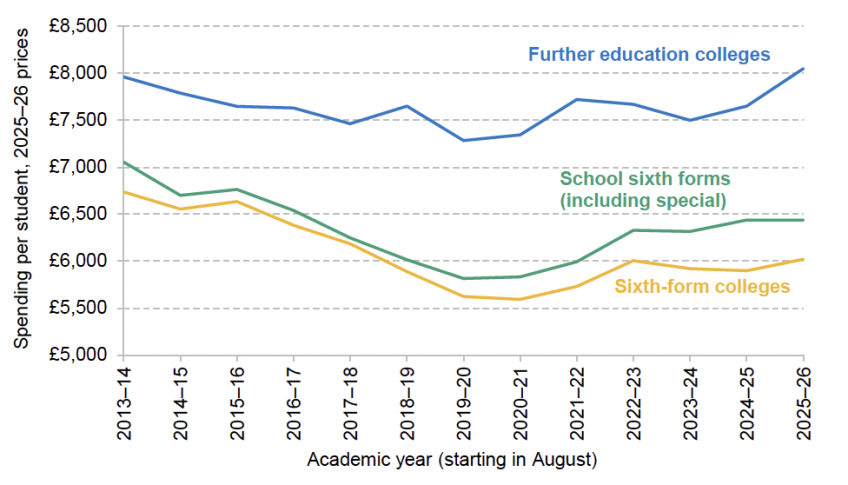
Note and source: See https://ifs.org.uk/education-spending/methods-and-data. HM Treasury, GDP deflators, November 2025.
Throughout this section, we focus on funding allocated per student aged 16–18 rather than the actual expenditures. Actual spending can differ depending on how schools and colleges distribute their budgets across different stages of education and other activities.
Funding per student aged 16–18 has consistently been higher in further education colleges than in school sixth forms and sixth-form colleges. This is because further education college students are more likely to pursue technical qualifications and often come from more disadvantaged backgrounds, both of which attract higher funding levels. In the 2025–26 academic year, funding per student in further education colleges is approximately £8,000, compared with £6,400 in school sixth forms and £6,000 in sixth-form colleges. Between 2013–14 and 2019–20, real-terms funding cuts affected school sixth forms and sixth-form colleges similarly, with a decrease in the range 16–18%. Further education colleges experienced smaller cuts of 8% over the same period. This difference is partly due to the higher prevalence of vocational qualifications in further education colleges, which have benefited from targeted funding initiatives such as the Capacity and Delivery Fund (CDF). Another factor is the decline in part-time study at further education colleges: the share of part-time students aged 16–18 dropped from 17% in 2013 to just 10% by the end of the decade. This shift has contributed to an increase in funding per student.
Since 2019, additional funding has been allocated to further education. However, rising student numbers and inflation have limited the extent to which this has translated into increases in funding per student. Growth in student numbers has been particularly pronounced in further education colleges in recent years. Between 2023–24 and 2025–26, student numbers in further education colleges rose by around 7% per year, compared with average annual increases of around 1% in school sixth forms and 2% in sixth-form colleges. This growth has been driven in large part by a sharp rise in enrolments on level 2 courses (GCSEs or equivalent). The number of 16- to 17-year-olds studying at this level increased by around 50,000 (34%) between 2022 and 2024.22 This increase likely reflects a combination of factors, including lower GCSE attainment following the pandemic, underlying demographic changes and a shift towards vocational study at level 2. As a result, increases in total funding have been spread across a larger student population, dampening growth in funding per student.
For the current academic year (2025–26), real-terms funding per student is about 7% higher in sixth-form colleges and about 11% higher in school sixth forms and further education colleges than in 2019–20. Looking further back, this means that funding for students in school sixth forms is 9% lower, and in sixth-form colleges 11% lower, than in 2013–14. A larger real-terms increase in funding this year means that further education college spending per student is 1% higher than in 2013–14.
To examine trends in spending over a longer period, we draw on different data sources that allow funding allocations to be tracked back further in time but uses slightly different definitions. In this dataset, spending for further education colleges and sixth-form colleges is combined, and we refer to these institutions together as 16–18 colleges. In addition, spending is recorded by financial year rather than academic year.
Figure 4.2 provides a picture of how per-student spending in school sixth forms and colleges has changed over a longer period, starting from 1989–90 for colleges and from 2002–03 for school sixth forms, with projections for 2026–27.
Figure 4.2. Spending per student in 16–18 colleges and school sixth forms (projected for 2026–27)
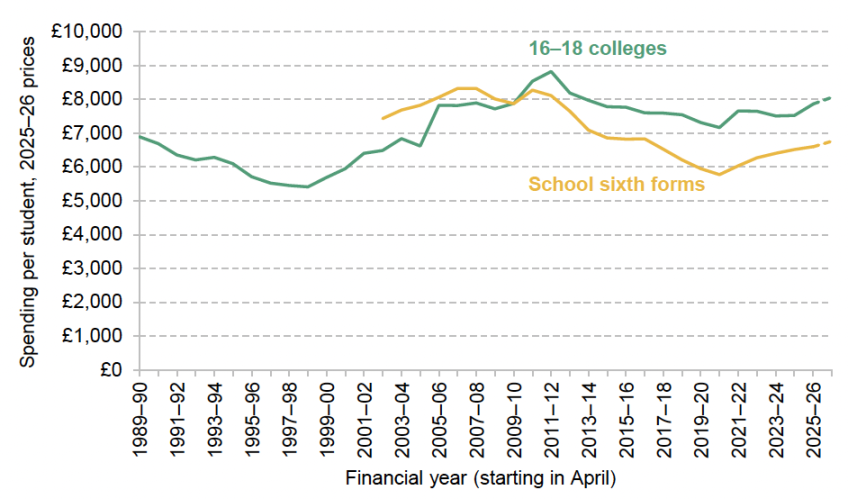
Note and source: See https://ifs.org.uk/education-spending/methods-and-data. HM Treasury, GDP deflators, November 2025.
Since the start of public spending cuts in the 2010–11 financial year, spending per student has declined across colleges and school sixth forms. Between 2010–11 and 2019–20, college spending per student dropped by 14%, while school sixth forms saw a much sharper decline of 28%. For colleges, this reduction brought per-student spending back to roughly the same level as in 2004–05. School sixth-form funding had reached its lowest level in the data series to date, which extends back to 2002.
Overall, spending per student in 16–18 education across all institutions has increased by 9% in real terms between 2019–20 and 2025–26. Yet even with additional funding, levels remain significantly below those of 2010–11. In 2025–26, funding for colleges, encompassing both further education and sixth-form colleges, is around 8% lower per student than it was in 2010–11, while spending in school sixth forms is 20% below 2010–11 levels. Thus, the increased funding from this government and the previous government only partially offsets the cuts of the decade from 2010–11.
The Post-16 Education and Skills White Paper set out further detail on future funding levels. It confirmed a real-terms increase of around £450 million in the 16–19 budget between 2025–26 and 2026–27, funded from within the Spending Review settlement. As shown in Figure 4.2, this would lead to a 2.5% real-terms increase in spending per student aged 16–19 over this period. This would return funding per student in colleges to around its 2012–13 level and funding in school sixth forms to levels last seen in the mid 2010s. However, even after these increases, college funding per student would remain around 6% below its 2010–11 level, while school sixth-form funding would remain around 18% lower. Overall, recent funding increases reverse some, but not all, of the real-terms decline experienced during the 2010s, and comes at a time of growing demand for 16–18 education.
The White Paper also indicated a desire to at least hold spending per student constant in real terms. With the size of the 16–18 population currently increasing, this would require further real-terms increases in total funding beyond those already announced. The number of 16- to 18-year-olds in England has been rising since 2017 and is expected to continue increasing in the coming years. Between 2018 and 2025, the size of this age group grew by around 300,000, or 16%. Population projections suggest a further increase of around 70,000 (3%) by 2028, when the number of 16- to 18-year-olds is expected to peak. Based on these population projections, maintaining spending per student at its 2026–27 level in real terms would require total funding to increase by a further £150 million (in today’s prices) by 2028–29.
4.2 Total spending on adult education and skills
We next turn to spending on adult education and skills. This part of the further education system encompasses a wide range of courses and learners, spanning different levels, modes of delivery and policy objectives. Unlike for 16–18 education, it is therefore not meaningful to analyse spending on a per-learner basis, given the diversity of provision and the variation in course length, intensity and funding arrangements. Instead, we show trends in total public spending, which we group into three broad categories:
- classroom-based learning, including basic skills and qualifications at multiple levels;
- subsidies for work-based learning, such as apprenticeships;
- loans for further education courses, known as advanced learner loans.
Figure 4.3 shows public spending across these three categories from the early 2000s to the present, alongside projections for 2025–26. Overall public funding for adult education and skills has declined substantially since its peak in the early 2000s. In 2024–25, spending stood at around £4.7 billion, around 30% below its inflation-adjusted high of £6.8 billion in 2003–04. This decline has been driven primarily by large reductions in classroom-based learning, where expenditure has fallen by around two-thirds, from £5.3 billion in the early 2000s to £1.8 billion in 2024–25. By contrast, public funding for work-based learning has risen markedly over the same period, reaching around £2.8 billion today and now consisting almost entirely of subsidies for apprenticeships.
Figure 4.3. Public spending on adult education and skills (projected for 2025–26)
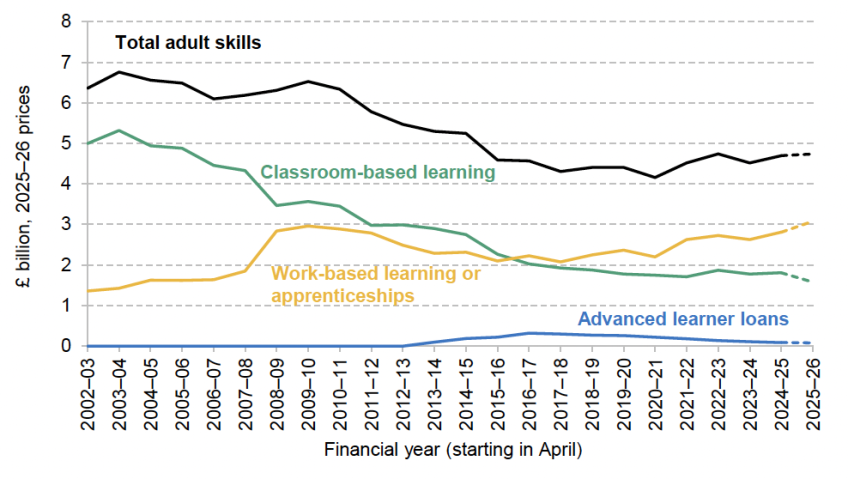
Note: ‘Total adult skills’ is the sum of classroom-based learning, work-based learning or apprenticeships and advanced learner loans. The projection of spending on classroom-based learning in 2025–26 is based on applying a 6% reduction to the non-devolved budget in 2024–25 as stated in Department for Education guidance, and for devolved budget it is based on the Adult skills fund: devolved grant determination letters 2025. The projection of work-based learning or apprenticeships in 2025–26 is based on HM Treasury Main Supply Estimates 2025 to 2026. Advanced learner loan expenditure in 2025–26 is based on the assumption that the outlay remains constant in cash terms between 2024–25 and 2025–26.
Source: Classroom-based learning from 2019–20 to now is based on Education and Skills Funding Agency annual accounts and ‘Adult skills fund: devolved grant determination letters’. For the latest year (2024–25), see ESFA annual report and accounts 2024 to 2025 and Adult skills fund: devolved grant determination letters 2025. For previous years, see source for figure 6.4 in Drayton et al. (2022). Work-based learning or apprenticeships from 2023–24 to now is based on Department for Education annual accounts. For the latest year (2024–25), see Department for Education Consolidated annual report and accounts 2024 to 2025. For previous years, see source for figure 6.4 in Drayton et al. (2022). Amount lent through advanced learner loans from Student Loans Company, Student loans for further and higher education – England. For the latest year (2024–25), see Student Loans Company, Student loans in England: 2024 to 2025. HM Treasury GDP deflators, November 2025.
These trends reflect both a long-running retrenchment in entitlements to low-level classroom-based learning and a gradual reorientation of adult skills funding towards work-based provision. During the 2000s, some of the reductions in classroom-based funding were offset by increased support for work-based learning, leaving overall spending relatively stable. Expenditure on work-based learning reached a peak of around £3 billion in 2009–10 following the introduction of the Train to Gain programme.23 In the 2010s, spending on work-based learning settled at just over £2 billion annually (in today’s prices) as funding for classroom-based learning continued to decline. Since 2020, public spending on apprenticeships has risen again, reaching around £2.8 billion in 2024–25 and projected to increase to £3 billion in 2025–26. Advanced learner loans, introduced in 2013–14, have consistently accounted for only a small share of total adult skills funding. By 2024–25, approximately £90 million was issued through these loans, making up just 2% of the overall skills budget.
Looking ahead, the Spending Review implies a real-terms increase of just over £300 million in total funding for further education and skills between 2025–26 and 2028–29, but leaves open how this funding will be distributed across the system. If the government chooses to maintain spending per student in 16–18 education at its 2026–27 level in real terms, much of this additional funding would be absorbed by rising student numbers, limiting the scope for increases in spending elsewhere. Alongside this, the Autumn Budget announced £725 million in additional cash-terms funding for the growth and skills levy over the Spending Review period. While the precise timing of this extra funding has not been set out, an even profile would imply a real-terms increase of around £50 million in the total apprenticeship budget in 2028–29 relative to 2025–26. Taken together, if the government maintains real-terms spending per student in 16–18 education at its 2026–27 level and the additional growth and skills levy funding is spread evenly over the Spending Review period, public spending on adult education and skills in 2028–29 would be broadly flat in real terms compared with 2025–26.
4.3 Classroom-based adult education
There have been large and sustained reductions in public spending on classroom-based adult learning over time driven by two main factors. The first is a sharp decline in participation. As shown in Figure 4.4, the number of publicly funded classroom-based further education courses taken by adults in England fell from 5.4 million in 2004–05 to just 1.7 million in 2024–25, a reduction of around 70%. While participation has declined across all course levels, the largest falls occurred at the lowest levels (below level 2, which corresponds to study below GCSE level), particularly during the 2000s. Declining participation has had direct implications for funding for colleges and other providers, since funding is largely determined by the number of courses delivered.
Figure 4.4. Participation in classroom-based further education courses by adults (19+) in England
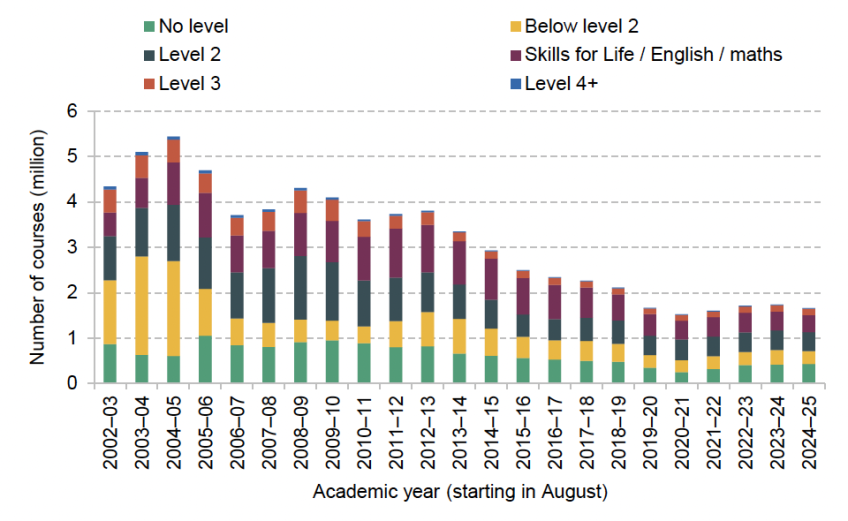
Note: Level 2 courses correspond to GCSE or equivalent. Skills for Life encompasses everyday literacy and numeracy courses. Level 3 corresponds to A level or equivalent qualifications. Level 4+ corresponds to higher-level qualifications such as Higher National Certificates or Higher National Diplomas.
Source: Learner numbers from 2002–03 to 2018–19 from figure 2.2 in Sibieta, Tahir and Waltmann (2021). Learner numbers for 2019–20 to 2024–25 calculated from ‘Headline - Full year - Participation, Achievement by Provision type’ from ‘Further education and skills’.
The fall in the number of classroom-based learners reflects a series of policy decisions over time, including the withdrawal of public funding for some low-level qualifications in the 2000s, a shift in emphasis towards apprenticeship-based training, and tighter eligibility criteria for funding entitlements introduced during the 2010s. The implications of this decline depend on which types of courses have been reduced. Evidence suggests that labour market returns vary substantially across further education qualifications, with many low-level classroom-based courses associated with relatively limited earnings gains (Tahir, 2023).
A second driver of the decline in public spending on classroom-based adult learning has been a substantial reduction in funding rates in real terms. Funding for adult education delivered by further education providers is allocated through a formula that incorporates a course funding rate, a disadvantage uplift and an area cost uplift, reflecting differences in learner characteristics and regional cost pressures. Since 2013–14, the Education and Skills Funding Agency has used the following formula to allocate funding through the Adult Skills Fund:
Funding received for teaching a learner
= Course funding rate × Disadvantage uplift × Area cost uplift
The course funding rate – based on the number of guided learning hours and the subject area – is the most important component of this formula. Since at least 2013–14, funding rates for most adult education courses have largely been held constant in cash terms. Although there have been uplifts to formula-funded provision under the Adult Skills Fund in recent years, this has not offset the cumulative effect of the prolonged cash-terms freeze.
Figure 4.5 illustrates how funding rates for a selection of the most commonly taken classroom-based courses have changed in real terms since 2013–14. The government increased the funding rate for GCSE English and maths in 2015–16, after which providers received a fixed cash-terms payment of £811 per student for teaching these courses between 2015–16 and 2023–24. The funding rates for functional skills courses, which are courses in basic English and maths often taken by adults without GCSE passes, have not changed in cash terms in the last decade. As a result, rising inflation has substantially eroded the real value of funding. Between 2013–14 and 2025–26, the real-terms value of programme funding fell by around 15% for GCSE English and maths courses and by around 29% for functional skills courses.
Figure 4.5. Programme funding rates for selected classroom-based courses
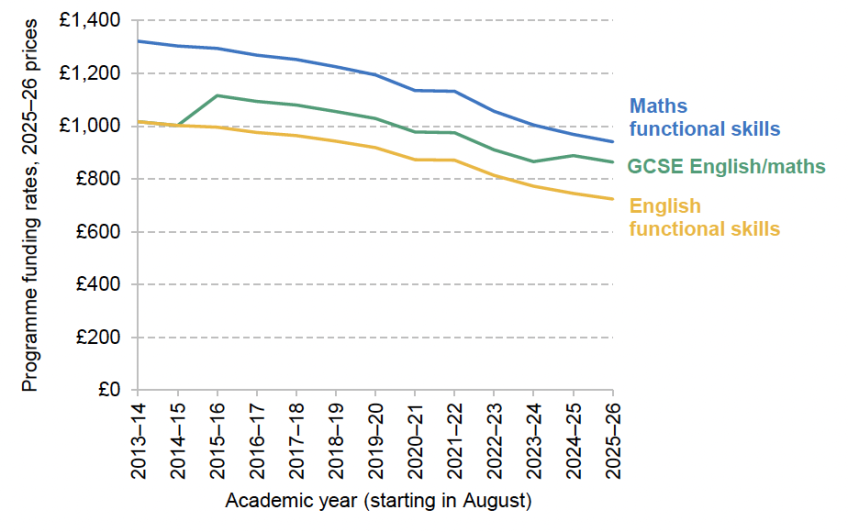
Source: Programme funding rates obtained from Department for Education adult skills fund guidance; for latest year (2025–26), see https://www.gov.uk/government/publications/adult-skills-fund-funding-rates-and-formula/dfe-funded-adult-skills-fund-funding-rates-and-formula-2025-to-2026. HM Treasury, GDP deflators, November 2025.
Funding rates for classroom-based adult education have been held constant in cash terms for a prolonged period. Using cash-terms freezes as the primary mechanism for setting funding levels is unlikely to be good policy, as it offers little assurance that funding remains aligned with delivery costs as these evolve over time. With responsibility for this area of spending now transferred to the Department for Work and Pensions, future funding trends will depend on whether and how funding rates are reviewed under these new arrangements.
4.4 Apprenticeships
Alongside classroom-based adult education, apprenticeships account for a substantial share of public spending on adult skills, but are funded through a distinct institutional and financial framework – the apprenticeship levy. The levy has been a central feature of England’s skills system since its introduction in 2017. Large employers – those with annual paybills above £3 million – pay a tax of 0.5% on their paybill above this threshold. In England, the funds from this levy can be used by all employers (both those that pay the levy and those that do not) to subsidise the training and assessment costs of apprentices.
Despite the name, the apprenticeship levy is not a hypothecated tax where the revenue collected goes directly into a separate fund dedicated solely to apprenticeships. Instead, the Treasury sets an apprenticeship budget in England. While the revenue from the levy is an important factor in setting the apprenticeship budget, other considerations such as broader policy objectives can also play a part. The devolved governments of Scotland, Wales and Northern Ireland receive a corresponding amount via the Barnett formula. The level of allocated funding can be, and has been, different from the amount of money raised through the apprenticeship levy.
Figure 4.6 shows the revenue generated by the apprenticeship levy, the funds allocated to England’s apprenticeship budget and the amount allocated to devolved nations, as well as the actual expenditure from England’s apprenticeship budget.
Figure 4.6. Funds raised by, allocated to and spent from the apprenticeship levy
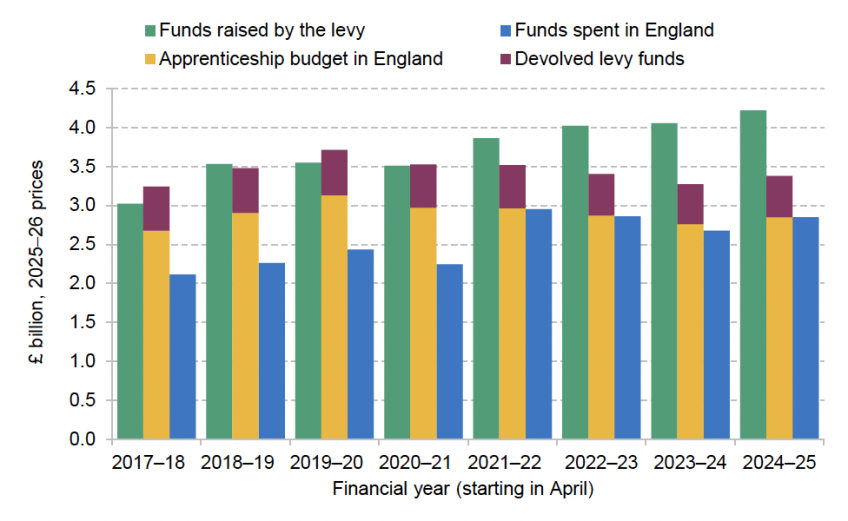
Source: Funds raised by the levy from the Office for Budget Responsibility’s Economic and Fiscal Outlook; for latest year (2024–25), see ‘November 2025 Economic and fiscal outlook – charts and tables: Annex A’ at https://obr.uk/efo/economic-and-fiscal-outlook-november-2025/. Funds spent in England and apprenticeship budget in England from Freedom of Information request. Funds allocated to devolved nations between 2017–18 and 2019–20 from HM Treasury (2016) and calculated using Barnett formula for remaining years.
In the early years of the apprenticeship levy, levy receipts were broadly in line with the funding allocated for apprenticeships (the sum of the apprenticeship budget in England and transfers to the devolved nations). Since 2021–22, however, levy revenues have grown faster than the apprenticeship budget, with the surplus rising from around £345 million in 2021–22 to almost £840 million in 2024–25. At the same time, the gap between the apprenticeship budget in England and funds spent in England has narrowed. In the first four years of the levy, only around 75–80% of the allocated budget was spent each year. More recently, spending has been close to the budget, with the spending and the allocated budget almost identical in the latest year. As a result, while the gap between levy revenues and the apprenticeship budget has widened, the earlier pattern of underspends against the budget has largely disappeared.
The basic structure of the levy has remained unchanged since 2017, but successive governments have made incremental adjustments, and suggestions have been raised about whether the system should allow employers to subsidise a broader set of training options (Tahir, 2023). Prior to the election, the Labour Party set out proposals to broaden the levy into a ‘growth and skills levy’, enabling employers to use up to 50% of their contributions to fund approved non-apprenticeship training (Farquharson, Sibieta and Tahir, 2024). The intention was to address underinvestment in training that is not currently eligible for support. But widening the scope of subsidised training also brings challenges, including the risk of deadweight – funding activity that would have taken place anyway – and the need for quality assurance across a more diverse set of courses.
Since taking office, the government has begun to make changes to the levy system, though the steps taken up until now have focused on controlling costs rather than widening flexibility. Shortly after the election, the Department for Education announced that levy funds could no longer be used to support level 7 (equivalent to master’s level) apprenticeships for adults aged 22 and over.24 This change reflects mounting pressure on the apprenticeship budget. Figure 4.7 shows that spending on higher-level apprenticeships (level 4 and above) has risen from 13% of total spending in 2017–18 to 42% in 2023–24, and level 7 programmes alone increased from 1% to nearly 10% over the same period. These apprenticeships are predominantly taken up by adults who already hold degrees, with 74% of higher-level (level 4 and above) starts in 2024–25 by individuals aged 25 and over. This shift has placed a growing strain on the apprenticeship budget, particularly because higher-level apprenticeships tend to be longer and more expensive.
Figure 4.7. Share of apprenticeship budget spent in England on each apprenticeship level
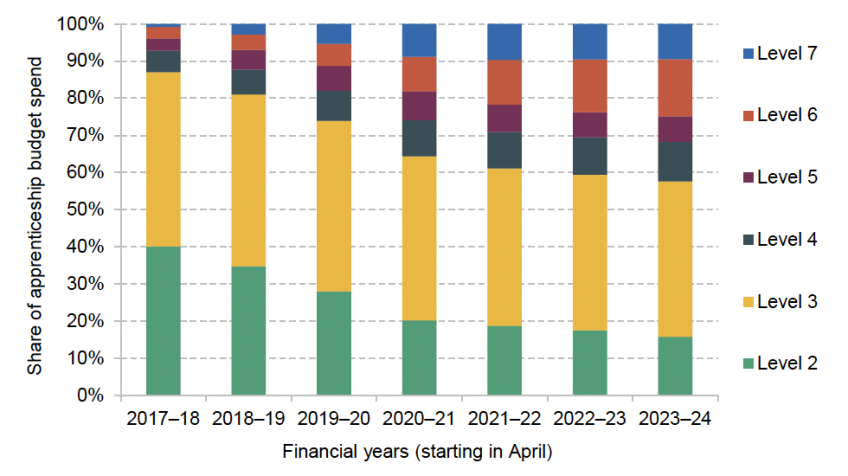
Source: Freedom of Information request.
The recent Post-16 Education and Skills White Paper provided some indication of how the apprenticeship levy is intended to evolve into a growth and skills levy. From April 2026, employers will ‘be able to use the levy on short, flexible training courses’. These courses will take the form of ‘apprenticeship units’ and will be available in a set of designated critical skills areas. However, significant details on how apprenticeship units will be defined, approved or delivered remain unclear, which is concerning given that the planned introduction date is extremely close.
In addition, by restricting eligibility to courses in designated critical skills areas, the government appears to be moving towards a narrower model than the broader flexibility proposed prior to the election. There are clear rationales for targeting public subsidy towards regulated, high-quality provision in areas of identified labour market need. However, many employers also invest in training that falls outside these categories, and tighter eligibility may limit the extent to which the levy supports wider workforce development. The challenge for the government will be to balance flexibility, cost control and the targeting of public funds towards training with demonstrable economic value.
4.5 Further education loans
Alongside grant-based funding for classroom-based provision and levy-funded apprenticeships, the government also supports adult participation in further education through income-contingent loans. These are provided through advanced learner loans, which fund tuition costs for eligible further education courses (between level 3 and level 6). Spending on further education loans is small relative to other parts of the post-18 finance system. In the 2024–25 financial year, the amount lent through advanced learner loans (£80 million in cash terms) accounted for 0.4% of the total value of higher education loans issued (£20.6 billion).25
Despite their relatively modest scale, further education loans play a distinct role within the adult skills system and have been subject to a number of policy changes over time. The system is now set to be reformed through the introduction of the Lifelong Learning Entitlement (LLE), which represents a significant change in how post-18 education is financed. First announced in 2020, the first LLE-funded courses are expected to open for applications in September 2026.
The Lifelong Learning Entitlement can be viewed as a package of three closely related reforms to the post-18 loan system (Tahir, 2023). First, it will integrate the two existing loan schemes – higher education student loans and advanced learner loans – into a single system, replacing what is currently a fragmented set of arrangements. Second, it will remove the ‘equivalent or lower qualification’ (ELQ) restriction, allowing adults to access loan funding for courses at the same level as or lower than a qualification they already hold. Third, it will introduce modular funding, enabling learners to take out loans for individual modules or short courses rather than only for full qualifications. Eligible learners will have access to their full entitlement from age 18, while existing adult learners will transition onto the new system with a residual entitlement reflecting previous loan use. At least initially, however, modular funding will be available only for subject areas aligned with priority skills needs under the government’s Industrial Strategy.
In principle, removing ELQ restrictions and extending loan funding to modular study at levels 4–6 could make it easier for adults to retrain or update their skills. Whether this occurs in practice will depend on both learner demand and provider participation. On the demand side, there is considerable uncertainty about the extent of unmet demand for modular learning and the degree to which access to loan funding represents a binding constraint. Evidence from the Learning and Work Institute’s Adult Participation in Learning Survey shows that the share of adults citing cost as a barrier to learning rose from 8% in 2019 to 24% in 2025 (Phipps et al., 2025). However, adults also report a range of non-financial barriers, including time constraints, work or caring responsibilities, low confidence, feeling ‘too old’ or difficulty identifying suitable courses. Expanding loan eligibility alone is unlikely to address these wider constraints on participation.
Access to loans may also be insufficient if learners lack clear information about the likely returns to modular study. While there is extensive evidence on the labour market returns to full qualifications – particularly degrees – there is very limited evidence on the value of short courses or ‘micro-credentials’. A recent OECD review concludes that there is ‘very limited evidence’ on the value of such courses ‘to learners and the wider society’ (OECD, 2021, p. 31). In the absence of clear information on returns, some learners may be reluctant to take on debt for modular provision. Early evidence from the Office for Students’s short-course trial in 2022–23 illustrates this challenge: although around 2,000 enrolments were expected, only 125 learners ultimately enrolled (Office for Students, 2024). This suggests that achieving meaningful scale under the Lifelong Learning Entitlement will require effective communication and promotion, alongside the availability of suitable provision.
The incentives facing providers are also uncertain. Even where modular courses could be derived from existing degree programmes, delivering them as standalone units can be costly. Providers may need to invest in new systems for credit accumulation and transfer, additional quality assurance processes, and redesigned curricula originally structured around longer programmes. These requirements mean that the supply of modular provision may expand only gradually, potentially limiting learner choice in the early years of the Lifelong Learning Entitlement. The take-up and delivery of modular provision as the Lifelong Learning Entitlement is introduced will therefore be an important area for close attention over the coming years.
4.6 Further education college finances and future cost pressures
Further education colleges are the main providers of further education and training in England, with 211 colleges currently operating across England.26 Since 2022, these colleges have been classified as part of the public sector. They rely heavily on public funding with around 80% of their income coming from 16–19 education funding and the various channels of adult education and skills funding (Moura and Tahir, 2024). As this chapter has shown, these funding streams have experienced substantial real-terms reductions during the 2010s, which has contributed to a deterioration in the financial position of the college sector.
Figure 4.8 shows the distribution of operating surpluses and deficits across further education colleges in England, a commonly used indicator of financial health. On this measure, the sector’s financial position worsened markedly in the early 2010s. In 2010–11, just 16% of colleges (weighted by income) were operating in deficit. By 2015–16, this figure had more than tripled to 54%, with almost one in five colleges reporting deficits exceeding 5% of their income. Financial performance has improved since 2017. Despite this improvement, in 2023–24 (the latest year for which data are available), 28% of colleges were operating in deficit. While a single year of deficit does not necessarily indicate acute financial distress, 16% of those colleges reporting deficits in 2023–24 had been in deficit for at least three consecutive years
Figure 4.8. Distribution of deficits and surpluses across English colleges
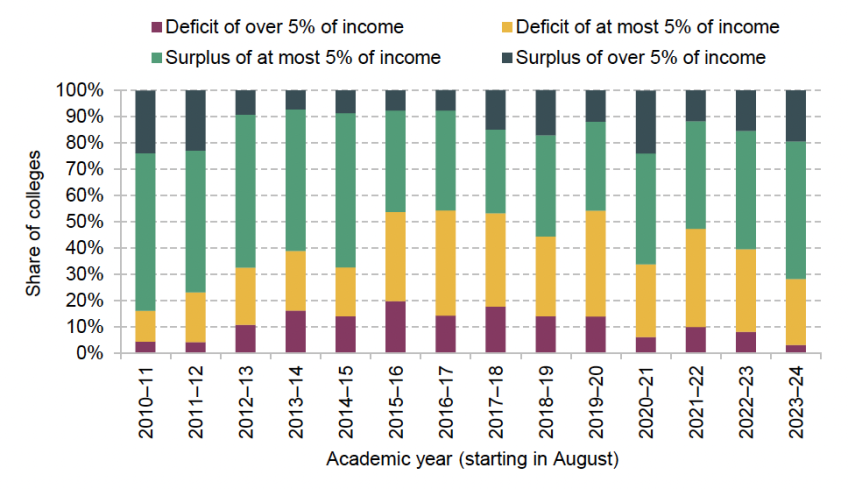
Note: Share of providers is weighted by provider income.
Source: Authors’ calculations using Department for Education college accounts data.
Before further education colleges were reclassified as public sector bodies in 2022, colleges in deficit had some scope to manage short-term cash-flow pressures through borrowing from commercial lenders. Reclassification in 2022 was accompanied by the immediate introduction of public sector borrowing controls, with colleges mandated to borrow directly from the Department for Education and also typically having to provide strict financial assurances. As a result, colleges facing financial difficulties now have more limited and more tightly regulated options for managing deficits and debt.
These persistent deficits help to frame the cost pressures colleges are likely to face in the coming years. Colleges have limited scope to absorb these pressures through adjustments to their largest area of spending, staff costs. Staff expenditure accounts for around 70% of total spending in further education colleges in England (Moura and Tahir, 2024), meaning that changes in pay have particularly significant implications for financial sustainability. College staff have experienced substantial real-terms pay cuts since 2010, with particularly sharp declines during recent years of high inflation. These trends appear to be reflected in high exit rates among college teachers, with almost half leaving the profession within three years of entry (Sibieta and Tahir, 2023). With recruitment and retention challenges evident, colleges are likely to have limited scope to reduce staff costs further without risking additional strain on staffing capacity and provision.
Further cost pressures are also likely to arise from the continuing process of reform affecting further education. Many of the reforms announced in the Post-16 Education and Skills White Paper are likely to have direct implications for further education colleges. These include changes to post-16 qualifications, such as the replacement of existing vocational qualifications with new programmes such as V levels, which will require colleges to redesign curricula and adapt delivery models. New entitlements for young people, including the Youth Guarantee, are also likely to increase expectations on colleges to expand provision and support a wider group of learners. Alongside this, proposals for new professional development pathways for further education teachers may add to staffing and training costs. The measures set out in the White Paper also come on top of a series of earlier reforms to funding rules, accountability arrangements and qualification structures, adding to the cumulative burden on providers.
4.7 Summary
The combination of historical funding cuts – only partially reversed in previous years – and new pressures will present significant challenges over the next few years. While the share of colleges operating in deficit has fallen since the mid 2010s, deficits remain persistent for a substantial minority of institutions, and reclassification as public sector bodies has limited colleges’ ability to manage pressures through commercial borrowing or short-term financial adjustments. Looking ahead, providers face a mix of rising demand driven in part by growth in the 16–18 population, continued pressures on staff pay and retention, and the cumulative costs associated with successive reforms to qualifications, entitlements and workforce expectations. With responsibility for further education funding now shared between the Department for Education and the Department for Work and Pensions, how these two departments decide to prioritise and allocate resources will be central to the ability of colleges and the broader further education sector to respond to these pressures.
5. Higher education
Under the current higher education funding system in England, the government pays around £22 billion up front to fund the education of each cohort of around 490,000 England-domiciled full-time undergraduate students studying anywhere in the UK. This covers spending on students at higher education institutions or at alternative providers that are eligible to charge full tuition fees. In particular, it includes:
- £11.2 billion of student loans for tuition fees;
- £9.6 billion of loans for students’ living costs while they are at university (‘maintenance’);
- £1.3 billion of direct grant funding paid to universities, for the teaching of particular high-cost courses, and some premiums for student disadvantage.27
In the long run, the government gets back the vast majority of this initial outlay as graduates make repayments on their student loans. This means the up-front spending is likely to substantially overstate eventual public spending on higher education, which will consist of direct grants and any portion of student loans that is not repaid (i.e. those that are ‘written off’).
In this chapter, we start by considering changes in spending on higher education teaching, particularly recent government announcements on the tuition fee cap and direct grants paid to universities, and proposals for a new levy on tuition fees paid by international students. We then turn to spending on living cost support for students, how this has changed over time and proposals for new maintenance grants, which will not need to be repaid. We then look at changes in student loan terms for existing borrowers that were announced at the Autumn Budget and which will see earlier cohorts of graduates repaying more towards their existing loans – and substantially more than they might have expected when they applied to university.
5.1 Funding for teaching
By far the most important source of funding for universities teaching England-domiciled undergraduates is tuition fees paid by students, which are subject to a cap set by government. Since the fee cap was increased to £9,000 from 2012–13, repeated cash-terms freezes had seen the real-terms value of the cap eroded in real terms. As shown by the yellow dotted line in Figure 5.1, this real-terms decline was particularly steep after 2021–22 as a result of higher inflation. By 2024–25, the fee cap was worth around a quarter less than it had been in 2012–13. Largely as a result, a growing share of higher education providers are facing financial challenges, with 45% forecasting an in-year deficit in 2024–25 (Office for Students, 2025a).
Figure 5.1. Tuition fee cap for full-time undergraduate courses, per year
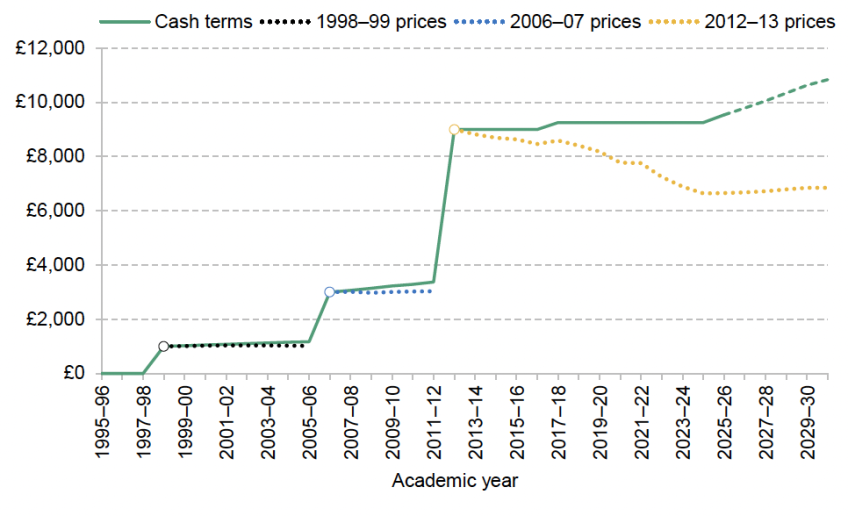
Note: Maximum tuition fees that UK universities can charge for home fee students starting or continuing full-time courses. Dashed lines are projections reflecting planned increases to 2027–28, and thereafter assume increases in line with the Office for Budget Responsibility’s November 2025 forecasts for RPIX in the first quarter of each academic year. Dotted lines show evolution of fees in real terms since the rises in 1998–99, 2006–07 and 2012–13, using the financial year GDP deflator applying for the first half of the relevant academic year.
Source: Historical fee levels taken from relevant secondary legislation. Department for Education, 2025d. Office for Budget Responsibility’s Economic and Fiscal Outlook, November 2025. HM Treasury’s GDP deflators, November 2025.
In 2024, the government announced that it would increase the fee cap in line with inflation for the 2025–26 academic year, from £9,250 to £9,535. It has now confirmed that the cap will increase in each of the next two academic years (to £9,790 and £10,050). It then plans to legislate to make increases in line with inflation automatic in subsequent years, at least for providers meeting particular quality thresholds.28 Annual increases of a few percent were standard prior to 2012–13, such that the value of fees was roughly maintained in real terms in the years following major rises (in 1998–99 and 2006–07). While scheduling future rises is no guarantee that they will actually happen, making them the policy default may make them less politically costly for the government. It also provides some welcome certainty to universities attempting to plan.
The vast majority of eligible students take out government-backed student loans for the cost of tuition, and the amount these students will be able to borrow for tuition will increase with the fee cap. This means that those taking out these loans will not pay more up front as a result of the cash-terms increase in fees, compared with a further freeze, but will instead graduate with higher loan balances. The fee rises will also not affect monthly loan repayments as, under the current system, monthly loan repayments only depend on a borrower’s earnings and not on their outstanding loan balance. Around 1 in 5 borrowers, who would never clear their loans even if fees had been frozen again, will never repay any more as a result of the fee rises. For the majority of borrowers who can expect to repay their loans in full before they are written off (40 years after graduation for most affected), the tuition fee rises will mean they continue making loan repayments for a few more months than they otherwise would have, typically in their late 30s or 40s.
The other main source of funding for teaching England-domiciled undergraduates is direct grants paid to universities for teaching particular high-cost courses. Partly offsetting the tuition fee rise in 2025–26, there was an £87 million (8.3%) cash-terms cut in this funding in the same academic year.
For the finances of the sector as a whole, the indexation of tuition fees is far more consequential: remaining high-cost subject funding (£956 million in 2025–26) is worth less than a tenth of tuition fee income from domestic students. Even if cuts of a similar scale were to be made to grant funding in future years, the indexation of the tuition fee cap would see real-terms per-student teaching resources roughly maintained in real terms. As shown in Figure 6.1 in the next chapter, up-front spending on teaching resources per higher education student had declined steadily, standing at £9,900 per year for the 2024–25 university entry cohort. This was around £2,700 or 22% lower in real terms than in 2012–13, largely because of cash-terms freezes to the fee cap, which were not offset by above-inflation rises in teaching grants. As a result of the indexation of fees, we now expect further real-terms cuts to per-student funding to be avoided.
However, changes in the method by which the remaining grants are allocated could still be consequential for the provision of particular subjects. For the current academic year, the government instructed the Office for Students to reprioritise funding away from courses such as media studies and towards lab-based courses (Office for Students, 2025b). The government has since committed to reviewing grant funding for universities to ensure funding is aligned with future skills needs and targeted towards ‘high priority courses that address the needs of the national economy’.29 This is likely to involve further reallocations of grants between subject areas, in an attempt to change providers’ incentives to deliver particular courses.
International student levy
Tuition fees paid by international students, which were worth £10.9 billion across England in 2023–24, constitute another major source of income for universities. Such fees accounted for 23% of all higher education providers’ income that year, up from 17% in 2017–18. Providers reported that they generated a substantial surplus on the teaching of international students in 2023–24, with tuition fees paid by these students exceeding the costs of teaching them by around 43% on average.30 Recruiting rising numbers of international students has supported the financial position of many providers in recent years.
The government proposes to introduce a new levy on international student fees from August 2028, and provided more technical detail of the design of the levy in a consultation published alongside the Autumn Budget (Department for Education, 2025e). Such a levy would be likely to lead both to an increase in the levy-inclusive tuition fee (price) charged to international students and to a fall in numbers (quantity).31 In its impact analysis, the government estimates that there will be around 14,000 fewer international students enrolled in the first year, but that the levy will raise £445 million in the first year in relation to those international students who do enrol (Department for Education, 2025f). The incidence of the levy is expected to be partially on international students – who will pay higher total fees, even accounting for the fall in enrolments – and partly on universities, which are expected to lose income of £270 million in 2028–29. The impact on the sector’s overall surplus will be slightly smaller than this, to the extent that universities face lower costs as a result of needing to teach fewer international students.
On the design of the levy, the government has proposed a flat fee of £925 per international student per year of study, which will not be charged for the first 220 students registered at each provider. This is likely to take many smaller providers – including specialist providers such as Courtauld Institute of Art, Leeds Conservatoire and the Northern School of Contemporary Dance – out of scope of the levy entirely. Amongst those that would be expected to pay the levy based on their student numbers, there was large variation in average tuition fee income per full-time international student per year in 2023–24 – from more than £30,000 at some of the most prestigious universities (Imperial College London and the Universities of Oxford and Cambridge) to less than £10,000 at York St John University, Edge Hill University and Liverpool Hope University, for example (Ogden and Tahir, 2025). This means the proposed flat levy would have been equivalent to less than 3% of international fee income at some of those with the highest fee income per student, but to more than 10% at a handful of providers with particularly low fees in 2023–24.32
The government has claimed that the levy – and the use of the levy revenues elsewhere in the skills system, including to fund new maintenance grants (discussed in Section 5.2) – will ensure that some of the ‘financial benefit’ provided by international students accrues to disadvantaged domestic students. This implies that the levy revenues will be ‘hypothecated’, earmarked for a specific purpose. However, there is no reason to believe that optimal spending on the government’s policies for the skills sector would be likely to match – or evolve over time in the same way as – levy revenues. If the amount raised from the levy does not affect spending on skills, and the aim of the levy is purely to raise revenues, the government should make the case for why such a levy is the best way to raise additional revenues on its own merits.
In practice, the introduction of an international student levy may be an imperfect way of the government meeting two potential policy aims: reducing the number of particular types of international students without directly restricting immigration; and capturing part of the surpluses providers are making from international student fees. It is not clear that the government could straightforwardly achieve the latter aim through reprioritising existing government grants, given the relatively small role now for direct grants in the funding of higher education. Indeed, at 16 providers, the potential revenues from a levy had one been implemented in 2023–24 would exceed the total value of grant funding the provider received from the Office for Students in the same year.33 This is particularly stark in the case of the London School of Economics, where levy revenues could exceed £7 million per year, but which receives relatively little direct grant funding (£466,000 in 2023–24 and less than £184,000 in 2025–26) as a result of its subject mix and relatively low share of domestic students.
5.2 Living cost support
As is the case for tuition fees, government support for students’ living costs is currently in the form of maintenance loans. Most undergraduates are entitled to borrow an amount each year which reflects their living situation (whether they live at home and whether they study in London) and their household income. The government has committed to increasing maximum maintenance loan entitlements each year in line with forecast inflation, specifically forecast RPIX – as has been long-standing government policy. Based on the latest inflation forecasts, maximum loan entitlements for those living away from home and studying outside of London are set to increase from £10,544 in 2025–26 to £10,830 in 2026–27 and £11,120 in 2027–28.
As discussed in Ogden and Tahir (2025), the real-terms generosity of student maintenance support has still declined substantially over the last decade, despite this policy of indexation. This has resulted from two features of how entitlements are determined:
- Increases in loan entitlements are set based on forecasts for inflation and, in recent years, higher-than-expected inflation has led to a real-terms loss of value in the maximum amount the poorest students can borrow.
- The household income thresholds that determine how much of the maximum each student is eligible for have been frozen in cash terms for many years. The threshold below which students are entitled to the maximum means-tested support has been at £25,000 since 2008, despite average nominal earnings growth of more than 60% over the same period. This has meant equivalently well-off students have been eligible for less of the maximum each year.
Together, these factors have substantially reshaped the way in which students are provided with living cost support since 2016–17, when the current system for living cost support was introduced. As shown in Figure 5.2, the amount students with equivalent household incomes have been entitled to borrow has declined between 2016–17 (blue line) and 2025–26 (green line), with the largest declines of more than 37% (around £2,900) for those around the current threshold for receiving the minimum support (£62,377).
Figure 5.2. Maintenance loan entitlements per year, by household income
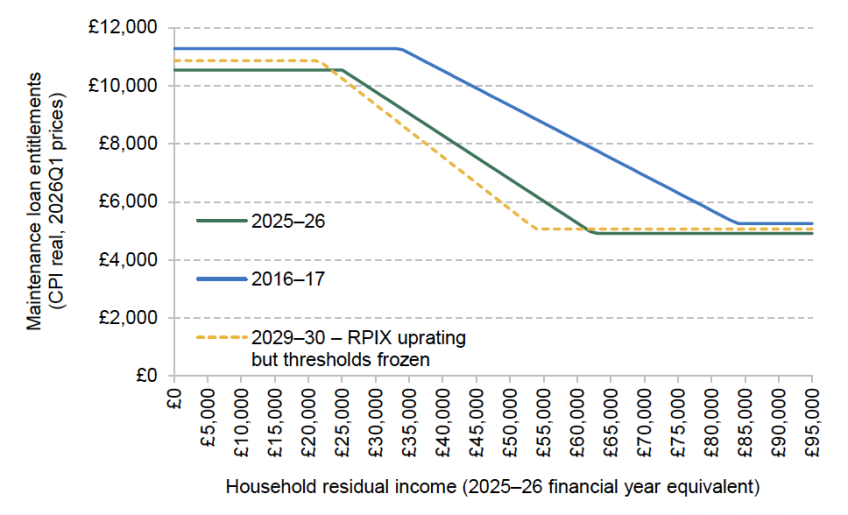
Note: For England-domiciled students living away from home and studying outside London. Entitlements for students starting courses each academic year in CPI real terms (2026Q1 prices). Household residual income thresholds are expressed in 2025–26 financial year prices, and changes over time reflect growth in average earnings between the relevant financial years upon which entitlements are based (e.g. 2023–24 tax year for entitlements in the 2025–26 academic year).
Source: Authors’ calculations using student finance guides (Student Finance England, 2016; Student Loans Company, 2025) and Office for Budget Responsibility’s Economic and Fiscal Outlook, November 2025.
The government has not indicated that it plans to apply any indexation to these income thresholds in future years. If maximum entitlements continue to be increased each year in line with the same measure of forecast inflation, but income thresholds remain frozen in cash terms, then by 2029–30 we expect the schedule of support to be as described by the yellow dashed line. Support for the lowest-income students may have increased slightly, as a result of indexation by RPIX, which is forecast to be higher than the measure of inflation (CPI) we use to compare the real-terms value of support over time. However, we estimate that some students – those with household residual incomes of between £23,400 and £61,400 – may be able to borrow less in real terms than they would be entitled to this academic year, with the largest falls of over £1,100 (around a sixth) for those with household incomes of around £53,000.34
Maintenance grants
While maintenance loans will continue to account for the vast majority of living cost support, the government has committed to introducing maintenance grants in the 2028–29 academic year, and set out more detail as to the design of the new grants in a policy paper alongside the Autumn Budget (Department for Education, 2025g). They will only be available to students who are studying particular eligible courses.
One important aim of the policy is to provide additional living cost support for disadvantaged students, to increase their disposable income in the short run and potentially increase their ability to participate and succeed in higher education (e.g. through supporting them to undertake fewer hours of paid work). To this end, the policy paper confirmed that these grants will be provided in addition to existing loan entitlements, and so will increase the up-front living cost support available to those students on eligible courses.
As shown in Figure 5.3, those with household incomes up to the threshold that entitles them to the maximum maintenance loan – currently £25,000 – will be entitled to the maximum grant of £1,000 per year. The amount of grant received will be tapered down gradually to £500 per year for those with household incomes £5,000 above this threshold (currently £30,000), with no grant available to students just above this threshold. By 2028–29, students living away from home, studying outside London, might expect to be eligible for a maximum maintenance loan of £11,438, and so a £1,000 grant would be equivalent to an 8.7% increase in support.35
Figure 5.3. Maintenance entitlements for students on eligible courses in 2028–29, by household income
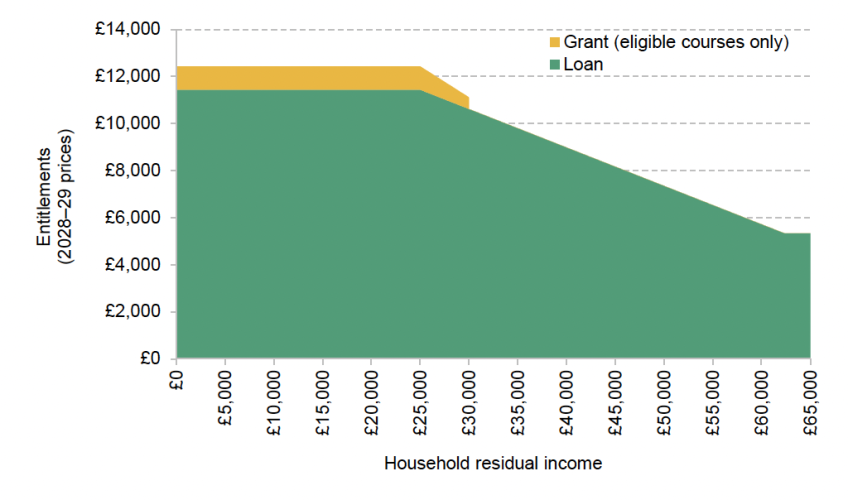
Note: For England-domiciled students living away from home and studying outside London. 2028–29 loan entitlements assume maximum entitlements are increased in line with RPIX and income thresholds are frozen in cash terms. Grant entitlements are as in the first and second year of study.
Source: Authors’ calculations using Department for Education (2025g); Office for Budget Responsibility’s Economic and Fiscal Outlook, November 2025.
This design introduces an undesirable cliff-edge into the English student support system, which will see students in almost-identical circumstances awarded very different levels of support. If this is anticipated by households, it also risks disincentivising some close to the income threshold from work as they could lose out on a substantial amount of support (£500) if their income increased just slightly. This risk could have been reduced and the design improved by tapering the grant down to zero, or at least to a lower level before it is withdrawn.
The government has also confirmed that the grants will be available both to new students and to those in later years of their courses. This will reduce the incentive for low-income students to defer entry to 2028–29 in order to benefit from the grant: under the current policy, they will lose one year of grant if they instead start their course in 2027–28, rather than grant for all years of study. In the case of the 2012–13 reforms, which increased the fee cap to £9,000 for new students, participation increased sharply in 2011–12 as students who might otherwise have deferred entry to take a gap year were induced to start courses before the reforms came in. While the financial stakes in that case were much higher, this suggests that when to start their course is a potential margin of adjustment for some students, and so designing the policy to reduce the incentive for some students to defer starting their studies is sensible.
Crucially, as well as means-testing criteria, the new grants will be restricted to students who are studying particular eligible courses: those that ‘support the government’s missions and the Industrial Strategy’. Government has not yet specified which courses will be eligible for the new maintenance grants, although it has committed to ‘explor[ing] alignment’ with the subject lists for Lifelong Learning Entitlement funding. In Ogden and Tahir (2025), we estimated that around 390,000 full-time England-domiciled undergraduates (30% of the total) in 2023–24 were enrolled in the subject areas that would be eligible for modular funding through the Lifelong Learning Entitlement.36 Of these, we estimated that around 124,000 (10% of all English undergraduate students) had a household income of between zero and £25,000.37
It is reasonable for government to confirm the list of eligible subjects based on the ‘most up-to-date evidence on skills needs’ closer to the time. However, if another aim of the policy is to encourage more students to study priority subjects, it is likely to have a greater impact if students are aware of the conditions under which they would be eligible for it when making choices of GCSE and A-level subjects.
The government has not yet published any estimates of planned spending on the new grants. If eligibility was not restricted to specific courses, around 530,000 undergraduate students may have been eligible for the full grant had it been in place in 2022–23, and a further 40,000 for a partial grant. We estimate that this would see around 47% of undergraduates taking out a student loan also receiving at least some maintenance grant, at a cost of approximately £520 million per year.38 Of course, restricting eligibility to particular subjects would mean fewer students and lower spending than this.
The idea of providing low-income students with maintenance grants, which do not need to be repaid, is not new – although these grants have typically been much larger and more widely available than the grants now proposed by the government. Low-income students from other parts of the UK are entitled to maintenance grants regardless of subject studied, with maximum grants of £2,000 for Scottish Young Students in 2025–26 and £3,475 for students from Northern Ireland. Students from Wales are entitled to a grant of at least £1,000 per year regardless of their household income, with maximum grants of up to £8,100 for those living away from home, outside London.
Until 2015–16, undergraduate students from England were entitled to means-tested maintenance grants, although these were not restricted to particular subjects. They reached further up the income distribution, with 57% of those eligible for any living cost support awarded at least some maintenance grant. The grants were also much larger, with average awards equivalent to £4,192 per year in today’s prices. Awarding similarly generous grants to the same proportion of today’s undergraduates would require spending around £2.9 billion on maintenance grants per year.39
5.3 Student loans
As described above, loans are central to how higher education is funded for England-domiciled students, and how much graduates go on to repay will determine how much of the cost of higher education will eventually be borne by taxpayers or by graduates themselves. The terms applying to a particular loan – including the repayment threshold, how interest is added and the repayment period – vary depending on when that loan was taken out. There are important differences between Plan 2 student loans, which were issued to students who started courses between 2012 and 2022, and the Plan 5 terms which apply to those starting courses from 2023 onwards. In particular:
- Graduates make no repayments if they earn below a specific repayment threshold, and repay 9% of their earnings above that threshold. This repayment threshold is currently £28,470 for Plan 2 loans and £25,000 for Plan 5 loans.
- For Plan 2 loans, interest is normally added to the loan balance at a rate between the rate of RPI inflation and RPI inflation plus 3%, depending on a graduate’s earnings. The interest rate for Plan 5 loans is the rate of RPI inflation.
- Any outstanding balance is written off at the end of the repayment period with no adverse consequences for graduates. This repayment period is 30 years after graduation for Plan 2 loans and 40 years for Plan 5 loans.
As shown in Figure 5.4, the vast majority of outstanding student loan balances are of Plan 2 student loans, which were issued to the 11 cohorts of students who started courses between 2012 and 2022. These amounted to £213 billion at the end of the 2024–25 financial year. These loans also accounted for a majority of loan repayments made that year, exceeding repayments made towards older Plan 1 loans for only the second year. Slightly less than half of new loan outlay in 2024–25 was of Plan 2 loans, with a rising share of loans issued under the new Plan 5 terms which are available to new England-domiciled undergraduate students.40 The Department for Education forecasts that three-quarters of new lending in 2025–26 and 90% in 2026–27 will be of Plan 5 loans.
Figure 5.4. Share of higher education student loans by plan type in financial year 2024–25
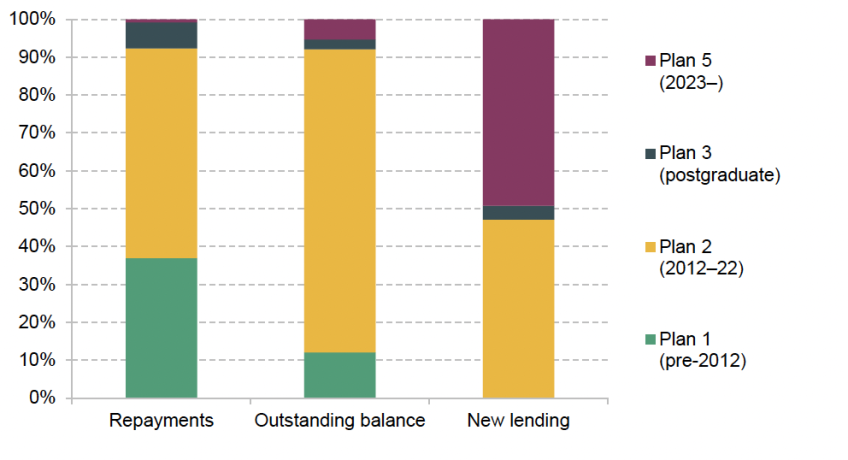
Note: Authors’ calculations based on table 1A of https://www.gov.uk/government/statistics/student-loans-in-england-2024-to-2025/. Reflects borrowing by England-domiciled students studying in the UK and EU-domiciled students studying in England who had home fee status. Outstanding balance is as at the end of the financial year.
At the Budget, the government announced that the repayment threshold for Plan 2 loans will be frozen at its April 2026 level (£29,385) for three years. This threshold has been subject to repeated freezes in the past, as described in Box 5.1. This latest freeze will see any borrower with an outstanding Plan 2 loan earning above £30,416 repaying an extra £93 in 2027–28 compared with what they otherwise would have expected to pay. In the 2029–30 tax year – when the threshold would have been expected to reach around £32,265 without the freeze – affected borrowers can expect to repay £259 more. They will also repay more in every subsequent tax year, at least until their loan is fully repaid or they reach the end of the write-off period (30 years after graduation for these loans).
Box 5.1. Plan 2 repayment over time
The history of the Plan 2 repayment threshold is a complicated one. In 2017, the government froze the repayment threshold at £21,000 instead of uprating it in line with average earnings as had previously been planned. That freeze was originally meant to go on until 2021, but this proved so unpopular that Theresa May’s government more than reversed the impact of the freeze by increasing the threshold to £25,000 in 2018 and putting in place regulations that would see the threshold indexed to average earnings again. Another freeze was instituted in 2022, when the threshold was frozen at £27,295 instead of being raised to £28,550 (Waltmann, 2022a). Initially intended to last for one year, in its response to the Augar Review the government extended this freeze for two further years and, even more significantly, changed the default indexation from average earnings to RPI. The threshold was increased to £28,470 in April 2025 and is set to increase to £29,385 from April 2026. Under current policy, announced at the Budget, the loan threshold will be frozen at its April 2026 level for three years from April 2027, as shown in Figure 5.5. It will again increase annually with inflation from April 2030 onwards.
Figure 5.5. Plan 2 student loan repayment threshold, under current policy and without announced freezes
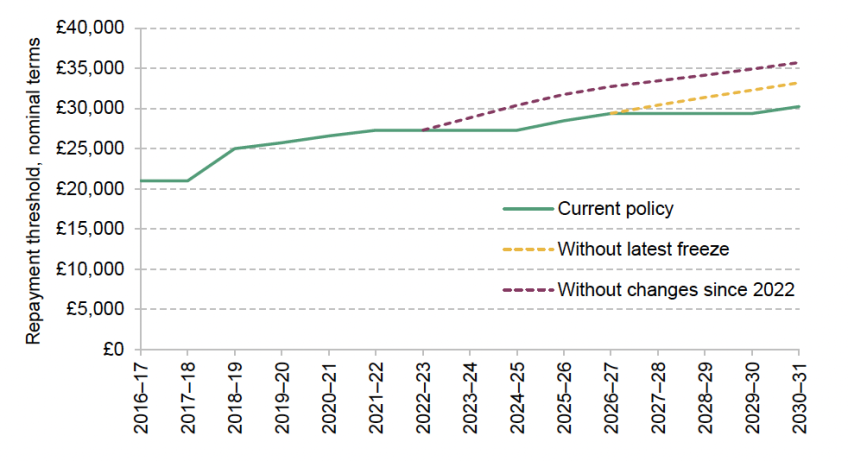
Note: ’Without latest freeze’ shows projection assuming repayment threshold was increased each financial year in line with the Office for Budget Responsibility’s November 2025 forecast for RPI. ‘Without changes since 2022’ shows threshold if it had increased in line with average earnings since 2022, as was government policy until January 2022.
Source: Authors’ calculations using https://www.gov.uk/guidance/previous-annual-repayment-thresholds and Office for Budget Responsibility’s Economic and Fiscal Outlook, November 2025.
In addition to the repayment threshold, there are two other thresholds important to the Plan 2 student loan system: the lower and higher interest rate thresholds. The interest added to an individual’s balance depends on their income, with interest added at the rate of RPI for those with income up to the lower interest rate threshold, at RPI+3% for those with income above the higher interest rate threshold, and at a variable rate in between.
These interest rate thresholds are also now set to be frozen for three years, at their April 2026 levels of £29,385 and £52,885. This specific policy change was not mentioned explicitly in the Budget documents published by HM Treasury, although it does appear to have been included in the Office for Budget Responsibility’s costings, and has been subsequently confirmed to us.41 The freeze in the interest rate thresholds will increase the interest rate applying to loans for those earning between the two thresholds, increasing the interest accrued and meaning many borrowers can expect to make repayments for longer. While this will not affect monthly loan repayments in the short term, it will have nearly as substantial an impact on lifetime loan repayments as the repayment threshold freeze, and will affect a different set of borrowers.
As shown in Figure 5.6, the freeze to the repayment threshold (green bars) will have a particularly large impact on lifetime repayments from lower-earning graduates. For those who are not expected to fully repay their loans, the freeze effectively constitutes a tax rise as, for this group, higher repayments today are not offset by lower expected repayments at some future date. The freeze in the interest rate thresholds (yellow bars) will not typically increase expected lifetime loan repayments from the lowest-earning graduates, but will instead add to the amount of unpaid interest that will eventually be written off in relation to their loans.42
Figure 5.6. Average change in expected lifetime student loan repayments of the 2022–23 starting cohort as a result of Budget 2025 freezes, by decile of lifetime earnings
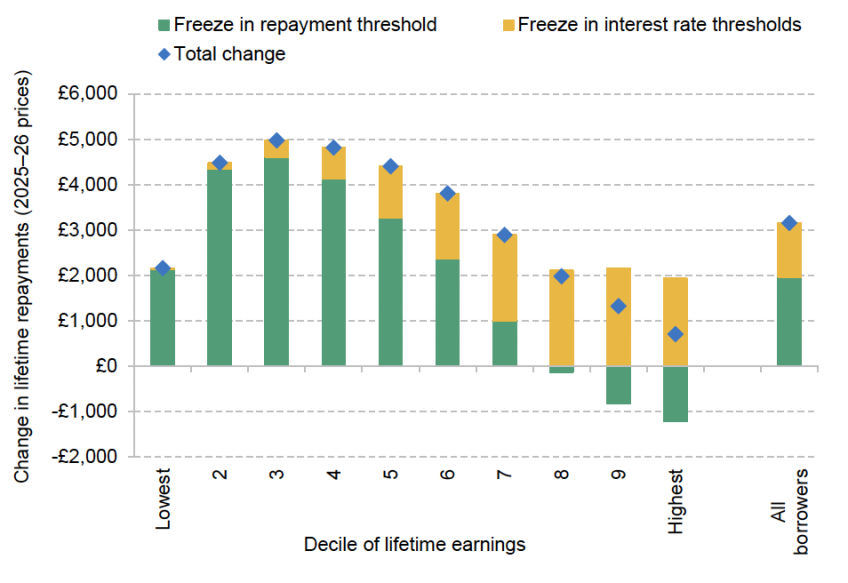
Note: Loan repayments and lifetime earnings are in CPI real terms, in 2025–26 prices, and are otherwise undiscounted. Assumes no borrowers make voluntary early repayments.
Source: Authors’ analysis using https://ifs.org.uk/student-finance-calculator.
For those in higher deciles of lifetime earnings, who can generally expect to pay off their loans in full with or without the freeze, making larger repayments earlier in life as a result of the repayment threshold freeze will mean that they pay off their loans more quickly. If this were the only change, the highest-earning graduates may repay less overall, as they would accrue less interest before having fully repaid their loans. However, the interest rate threshold freezes (yellow bars) are particularly important for this group, as they can expect to earn between the lower and upper interest rate thresholds for much of their careers and to eventually repay any additional interest accrued.
Despite having received less attention in the wake of the Budget, for the 2022–23 cohort, the freeze in the interest rate thresholds accounts for over a third of the overall impact of the freezes on average lifetime repayments. For graduates in the upper three deciles of lifetime earnings, average expected lifetime loan repayments would have been reduced if the only policy change had been the repayment threshold freeze, but this effect is more than outweighed by the interest rate threshold freezes.
Together, we estimate that the freezes will increase average lifetime student loan repayments from the 2022–23 starting cohort by around £3,200 (6.0%) on average, from £52,600 to £55,800 in today’s prices. Borrowers in the third decile of lifetime earnings can expect the largest lifetime loss as a result of the combined freezes, repaying around £5,000 (14.4%) more on average in total over the next 30 years. As shown in Figure 5.7, higher average repayments are expected from borrowers in all earnings deciles now (yellow) than without the recently announced freezes (green).
Figure 5.7. Average expected lifetime student loan repayments of the 2022–23 starting cohort under different loan terms, by decile of lifetime earnings
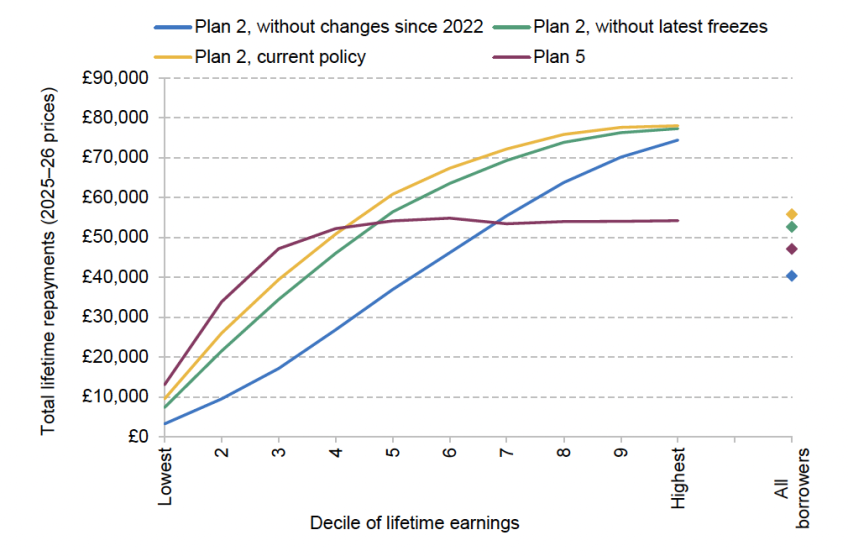
Note: Loan repayments and lifetime earnings are in CPI real terms, in 2025–26 prices, and are otherwise undiscounted. Assumes no borrowers make voluntary early repayments. Latest Plan 2 freezes refer to those announced in the Autumn Budget 2025. ‘Plan 2, without changes since 2022’ assumes the repayment and interest rate thresholds had increased in line with actual average earnings from 2022.
Source: Authors’ analysis using https://ifs.org.uk/student-finance-calculator.
The freezes have also made the differences in lifetime repayments of Plan 2 and Plan 5 loans even more stark. The 2022–23 starting cohort can now expect to repay substantially more –around £8,700 (18%) on average – than if they had been subject to the same loan terms as similar students who started their courses a year later. Those in the top half of graduate earners, who would particularly benefit from the lower interest rate applied to new loans, can now expect to repay on average around £20,100 (37%) more in today’s prices than if they had Plan 5 loans. The new terms are still more favourable in terms of lower expected total lifetime repayments than under Plan 5 loans for those in the bottom four earnings deciles, although the freezes have narrowed this margin substantially.
It is also helpful to consider expected repayments if thresholds had increased with average earnings since 2022, which was stated government policy when most of this cohort would have applied to university.43 In that case, graduates would have been expected to repay substantially less – £40,400 on average (blue on Figure 5.7), compared with £55,800 under current policy. Lifetime losses for middle-earning graduates as a result of changes to how thresholds have been increased since they applied to university now amount to around £22,500.44
In total, we now estimate that under current policy, the long-run cost of issuing loans to the 2022–23 starting cohort will be negative (–£0.8 billion), with graduates repaying more than they borrowed, when future repayments are adjusted for inflation.45 Of the total cost of financing higher education for this cohort, including direct grants to universities, we estimate only £0.7 billion (3%) will be met by the taxpayer, and £23.1 billion (97%) will ultimately be met by students themselves in the form of loan repayments.
As shown in Figure 5.8, without the latest freezes, we estimate the taxpayer cost of providing student loans to this cohort would have been £0.5 billion (around £1.3 billion higher), with the taxpayer meeting 9% of the total cost of financing higher education for this cohort. If thresholds had followed stated government policy when most of this cohort applied to university, we estimate the long-run cost of loans to government would have been around £5.6 billion. Taxpayers would have met 30% of the total long-run cost of financing higher education for this cohort, rather than 3%.
Figure 5.8. Cost of financing higher education for the 2022–23 starting cohort, under different policies
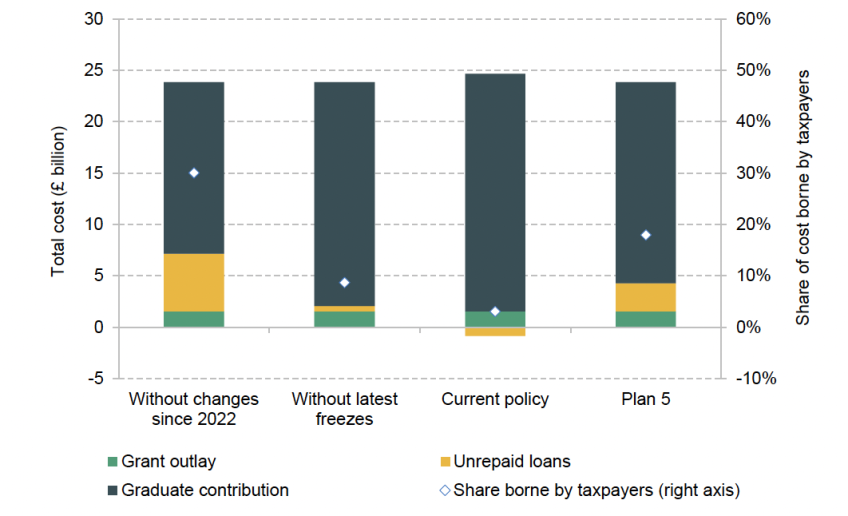
Note: All figures are given in 2025–26 prices, in net-present-value terms using a discount rate of RPI inflation. Grant outlay reflects recurrent grants to universities from the Office for Students. Assumes no voluntary early repayment. The graduate contribution consists of student loan repayments and does not include maintenance costs that are paid privately. ‘Without changes since 2022’ assumes the repayment and interest rate thresholds had increased in line with actual average earnings from 2022.
Source: Authors’ analysis using https://ifs.org.uk/student-finance-calculator.
A different measure of the long-run cost of loans is used in the public finances – the total accounting write-off. We estimate that the latest freezes would have reduced this measure for the 2022–23 cohort by £650 million.46 The impacts on repayments from 10 earlier cohorts of students – all those who started courses between 2012–13 and 2021–22 – are likely to be similar or slightly smaller. Given the way student loans are reflected in the public finances, the main fiscal impact of this policy measure at the Budget was a one-off reduction of £5.6 billion in capital spending in 2026–27, reflecting an increase in the value of the stock of existing loans.47
Crucially, these estimates assume that after the three-year freeze announced at the Budget expires, the Plan 2 repayment and interest rate thresholds will again increase with RPI each year. However, extending these freezes even further may become a politically expedient way to raise more money from graduates – as in the case of the 2022 freeze, which had initially been intended to last for one year but was extended to three (see Box 5.1). The freeze in the repayment threshold also comes at the same time as freezes to personal tax thresholds, where government has found it similarly expedient to increase revenues by freezing thresholds in cash terms for many years. There will be substantial overlap in the groups who are affected by both tax and student loan threshold freezes, who will make both higher tax payments and higher student loan repayments in the coming years than they might have expected.
5.4 Summary
The greatest shift in direction on how higher education is funded under this government has been the move to increase the cap on tuition fees in line with forecast inflation – and a commitment to making these increases the default in future. If the government follows through, then further real-terms cuts to per-student funding are likely to be avoided.
On living cost support for students, a government commitment to continue to increase maximum loan entitlements with forecast inflation would also be expected to avoid further real-terms cuts to the generosity of support for those from the poorest families. However, if a long-running freeze in the household income thresholds continues, then by 2029–30 some students may be able to borrow over £1,100 less in real terms than equivalent students this academic year. The introduction of means-tested maintenance grants of between £500 and £1,000 from 2028–29 will boost support for the poorest students, but these grants will be substantially smaller than those available to students elsewhere in the UK. The reach of the policy will depend on which ‘eligible courses’ qualify students for the new grants – something the government has not yet confirmed.
The government has provided more detail on a new levy on tuition fees paid by international students, which will also be introduced from 2028–29. This is expected to raise £445 million in its first year, but there is no meaningful sense in which these revenues will ‘pay for’ the introduction of maintenance grants for some domestic students.
The design of the student loan system determines how much of the cost of financing higher education will ultimately be borne by taxpayers, as opposed to by graduates themselves. Changes to the terms of these loans mean the division of these costs can change, even many years after the relevant students have graduated. Recent freezes in the Plan 2 loan system will mean we now estimate that those who started courses in 2022–23 will repay around £3,200 more over their lifetimes. These latest freezes mean that in the long run, we now expect the taxpayer will pick up almost none of the bill for financing the higher education of this cohort.
6. Comparisons
In this chapter, we compare the level of spending per pupil across the different stages of education. Figure 6.1 compares the trends in public spending per student on various stages of education over time in England, whilst Figure 6.2 shows the levels relative to primary school spending per pupil. For the early years, schools and further education colleges, we base these on the figures presented in Chapters 2–4, with projections up to 2025–26. For higher education, we focus on total up-front public resources provided for teaching. This is effectively tuition fees (minus any fee discounts) plus teaching grants. Whilst this includes up-front funding that will eventually be repaid via graduate contributions later in life, we feel this gives a better measure of the public resources available for teaching.
Figure 6.1. Spending per pupil or student per year at different stages of education (2025–26 prices)
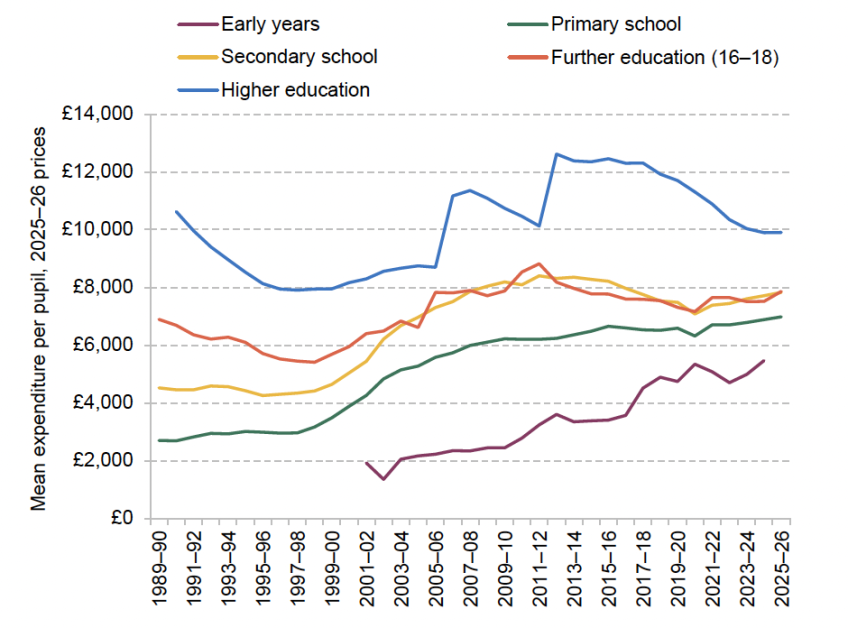
Note and source: Early years figures are spending per part-time-equivalent child for 3- and 4-year-olds taking up a place. Secondary school spending per pupil includes spending on school sixth forms. Further education figures represent spending per student aged 16–18 in further education and sixth-form colleges. Higher education figures are cohort-based numbers divided by 3 – an approximate course length. HM Treasury, GDP deflators, November 2025.
Figure 6.2. Relative spending per pupil or student per year at different stages of education (primary school spending per pupil = 1)
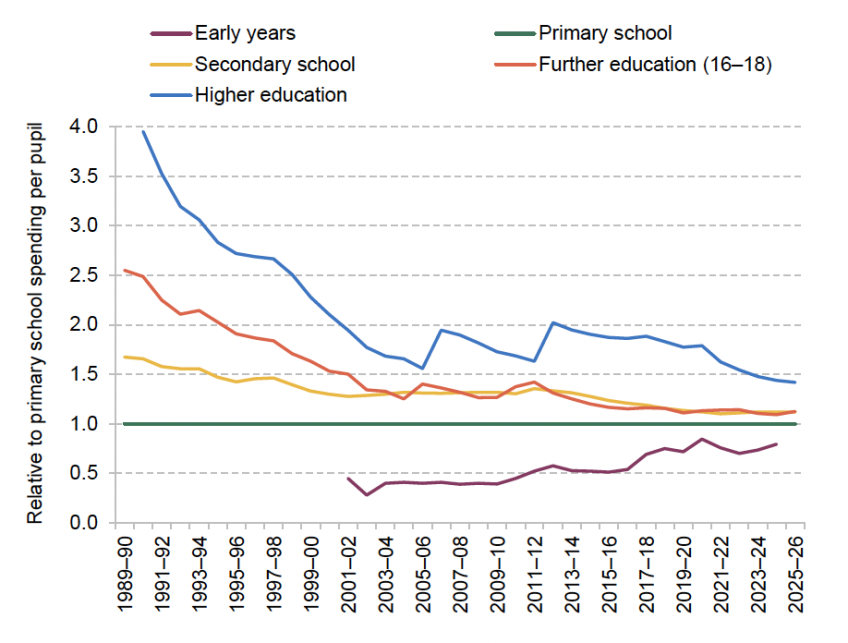
Source: See Figure 6.1.
The shape of public spending on education has changed significantly since the early 1990s. In 1990–91, there was a very clear gradient across education stages: the older the pupils being taught, the higher the level of public spending (or resources) per pupil per year. Although this broadly remains true, the relative differences are much, much smaller.
At the start of the period in 1990–91, higher education spending was nearly £10,600 per student per year (this and all figures here are in 2025–26 prices), about 4 times the level of primary school spending per pupil, and it all came directly from government spending. Further education spending was about £6,700 per student and 2.5 times the level of primary school spending (and 1.5 times the level of secondary school spending) per pupil. Secondary school spending was £4,500 per pupil, about 1.6–1.7 times the level of primary school spending per pupil (£2,700). Early years spending was very low (less than £100 million in total, with no centralised national programmes for early education) and is not shown on these graphs as a result.
Over the next 30 years, there were then significant changes in this balance of spending, with four distinct phases of change: falls in spending (1990–91 to 1997–98); rapid growth (1997–98 to 2010–11); differential protections from spending cuts (2010–11 to 2019–20); and some recovery in spending levels from 2019–20 onwards.
In the period of falling spending during the 1990s, higher education spending per student fell by 26% in real terms and further education spending per student aged 16–18 fell by 19% in real terms between 1990–91 and 1997–98. These cuts largely reflected total spending not keeping pace with rapid rises in student numbers. Secondary school spending per student fell by 3% over this period, whilst primary school spending per student rose by about 10% in real terms. These trends significantly narrowed the differences in spending per student between schools and further and higher education.
Spending per student then rose significantly across all stages of education between 1997–98 and 2010–11, though at different rates and for different reasons. The first early years entitlement was introduced in the late 1990s, initially representing about £1,900 per child, and rose to about £2,800 in 2010–11 or 45% of the spending per pupil in primary schools. Turning to schools, spending per pupil rose by about 6% per year in real terms in primary schools and 5% per year in secondary schools. This narrowed the ratio between secondary and primary school spending per pupil from 1.5 in 1997–98 to 1.3 in 2010–11.
Further education spending per student also rose, but at the slower rate of about 4% per year in real terms. This narrowed the difference between further education and school spending per student.
Following the big decline during the 1990s, higher education spending per student increased by about 2% per year, on average, in real terms between 1997–98 and 2010–11. These increases largely reflected the introduction of tuition fees in 1998 and their increase to £3,000 in 2006. By 2006–07, spending per student in higher education was back above its level in 1990. However, cash-terms freezes in fees up to 2010 led to real-terms declines in spending per student, taking it back to below 1990 levels again. This narrowed the difference between higher education spending per student and spending per student across all other stages of education.
Since 2010, most areas of education spending have seen real-terms cuts in some form or another. Early years has been the main exception. As discussed in Chapter 2, this mostly (though not entirely) reflects extensions to the generosity of entitlements, both within age groups and by expanding to younger children. Among 3- and 4-year-olds, spending per child was almost twice as high in real terms in 2024–25 as in 2010–11. Because we consider spending per 3- or 4-year-old accessing the free entitlement, this growth mainly reflects the introduction of the 30-hour working parent extended entitlement in 2017. However, this is not the only factor explaining the big rise: spending per hour grew by 22% in real terms between 2010 and 2023 (and has likely grown by more since then).
As we saw in Chapter 3, total school spending per pupil fell by 10% in real terms between 2010–11 and 2019–20. This was felt differently by individual primary and secondary schools, partly because of a transfer of funding and responsibilities from local authorities giving an artificial boost to individual schools’ budgets. Primary school spending per pupil actually rose by 6% in real terms between 2010–11 and 2019–20, reflecting the transfer of responsibilities and funding. Secondary schools saw a worse picture, with a 7% real-terms cut over the same period. This worse picture for secondary schools largely reflects the 28% drop in school sixth form funding per pupil over the same period. The cuts to school spending per pupil are now being reversed and spending per pupil had largely gone back to at least 2010 levels by 2025. However, the ratio between secondary and primary school spending per pupil is set to be much lower.
Further education spending per student aged 16–18 fell by 14% in real terms between 2010–11 and 2019–20, the largest cut across all areas of education spending for young people. This has also been partially reversed, with further education spending per student due to be about 8% lower in real terms in 2025–26 than in 2010–11.
The 2012 reforms to higher education led to a significant boost in spending per student of about 25% in real terms. This pushed spending per student up to £12,600, well above its level in 1990. However, in a repeat of recent history, there were real-terms falls in spending per student as fees were frozen in cash terms across most years. In 2024–25, spending per student was around 22% lower in real terms than for 2012–13 entrants, largely because the cap on tuition fees was 26% lower in real terms than it was in 2012–13. Notably, more than two-thirds of the decline was due to real-terms cuts over the four years between 2019 and 2024. Spending per student is then due to remain constant in real terms in 2025–26 as a result of the decision to increase fees in line with inflation from September 2025. This still leaves spending per student at about the same level in real terms as in 2011–12, just before the increase in tuition fees to £9,000, and about the same level as more than 30 years ago in 1990. However, the new commitment to index fees in line with inflation will prevent further real-terms decreases over time.
This differential pattern of cuts has further narrowed differences in education spending per student by age. In 2024–25, early years spending per pupil represented almost 80% of the value of primary school spending per pupil, having been a tiny element of public funding in the early 1990s. Secondary school spending per pupil will be about 12% greater than primary school spending, having been about 66% greater in 1990. Further education spending per student aged 16–18 is now about the same level as secondary school spending per pupil and only 9% greater than in primary schools, having been more than two times greater in the early 1990s. Higher education spending per student is still higher than spending across other stages, but is now back to the 1990s level and is due to be only 44% greater than primary school spending per pupil, having been almost four times greater in the early 1990s.
References
Belfield, C. and Sibieta, L., 2016. Long-run trends in school spending in England. IFS Report, https://ifs.org.uk/publications/long-run-trends-school-spending-england.
Brewer, M., Cattan, S., Crawford, C. and Rabe, B., 2022. Does more free childcare help parents work more? Labour Economics, 74, 102100, https://doi.org/10.1016/j.labeco.2021.102100.
Britton, J., Dearden, L., Waltmann, B. and van der Erve, L., 2020. The impact of undergraduate degrees on lifetime earnings. IFS Report, https://ifs.org.uk/publications/impact-undergraduate-degrees-lifetime-earnings.
Carneiro, P., Cattan, S., Conti, G., Crawford, C., Farquharson, C. and Ridpath, N., 2025. The short- and medium-term effects of Sure Start on children’s outcomes. IFS Report, https://ifs.org.uk/publications/short-and-medium-term-effects-sure-start-childrens-outcomes.
Cunha, F., Heckman, J. J. and Schennach, S. M., 2010. Estimating the technology of cognitive and noncognitive skill formation. Econometrica, 78, 883–931, https://doi.org/10.3982/ECTA6551.
Department for Education, 2025a. National funding formula for schools and high needs from 2025. https://www.gov.uk/government/publications/national-funding-formula-for-schools-and-high-needs-from-2025.
Department for Education, 2025b. Post-16 Education and Skills White Paper. https://www.gov.uk/government/publications/post-16-education-and-skills-white-paper.
Department for Education, 2025c. Giving every child the best start in life. https://www.gov.uk/government/publications/giving-every-child-the-best-start-in-life/giving-every-child-the-best-start-in-life.
Department for Education, 2025d. Changes to tuition fees: 2026 to 2027 academic year and 2027 to 2028 academic year. https://www.gov.uk/government/publications/tuition-fees-and-student-support-2026-to-2027-academic-year/changes-to-tuition-fees-2026-to-2027-academic-year-and-2027-to-2028-academic-year.
Department for Education, 2025e. International student levy: government technical consultation. https://consult.education.gov.uk/international-student-levy-unit/international-student-levy/supporting_documents/isl-technical-consultationpdf.
Department for Education, 2025f. International student levy – impact analysis: methodology and impact analysis. https://consult.education.gov.uk/international-student-levy-unit/international-student-levy/supporting_documents/international-student-levy-impact-analysispdf.
Department for Education, 2025g. Maintenance grant amounts and eligibility criteria. https://www.gov.uk/government/publications/maintenance-grants-for-higher-education-students/maintenance-grant-amounts-and-eligibility-criteria.
Department for Education, 2025h. Lifelong Learning Entitlement: what it is and how it will work. https://www.gov.uk/government/publications/lifelong-learning-entitlement-lle-overview/lifelong-learning-entitlement-overview.
Drayton, E. and Farquharson, C., 2022. Early years spending update: the impact of inflation. IFS Report, https://ifs.org.uk/publications/early-years-spending-update-impact-inflation.
Drayton, E., Farquharson, C., Ogden, K., Sibieta, L., Snape, D. and Tahir, I., 2025. Annual report on education spending in England: 2024–25. IFS Report, https://ifs.org.uk/publications/annual-report-education-spending-england-2024-25.
Drayton, E., Farquharson, C., Ogden, K., Sibieta, L., Tahir, I. and Waltmann, B., 2022. Annual report on education spending in England: 2022. IFS Report, https://ifs.org.uk/publications/annual-report-education-spending-england-2022.
Drayton, E., Farquharson, C., Ogden, K., Sibieta, L., Tahir, I. and Waltmann, B., 2023. Annual report on education spending in England: 2023. IFS Report, https://ifs.org.uk/publications/annual-report-education-spending-england-2023.
Farquharson, C., 2021. Complicated, costly and constantly changing: the childcare system in England. IFS Comment, https://ifs.org.uk/articles/complicated-costly-and-constantly-changing-childcare-system-england.
Farquharson, C., 2023. Changes and challenges in childcare. IFS presentation, Spring Budget 2023, https://ifs.org.uk/events/spring-budget-2023-ifs-analysis.
Farquharson, C., 2024. What you need to know about the new childcare entitlements. IFS Comment, https://ifs.org.uk/articles/what-you-need-know-about-new-childcare-entitlements.
Farquharson, C., 2025. Popularity of new childcare entitlements could leave spending much higher than initially forecast. IFS Comment, https://ifs.org.uk/articles/popularity-new-childcare-entitlements-could-leave-spending-much-higher-initially-forecast.
Farquharson, C., Ogden, K., Phillips, D., Sibieta, L. and Snape, D., 2025. The hardest questions for SEND are still to be answered. IFS Comment, https://ifs.org.uk/articles/hardest-questions-send-are-still-be-answered.
Farquharson, C., Sibieta, L. and Tahir, I., 2024. Labour’s ‘Growth and Skills’ levy would give more flexibility to firms – but employers would still need to get on board. IFS Comment, https://ifs.org.uk/articles/labours-growth-and-skills-levy-would-give-more-flexibility-firms-employers-would-still.
HM Treasury, 2016. UK government agrees apprenticeship levy funding deal with devolved administrations. Press Release, https://www.gov.uk/government/news/uk-government-agrees-apprenticeship-levy-funding-deal-with-devolved-administrations.
HM Treasury, 2025. Budget 2025 document. https://www.gov.uk/government/publications/budget-2025-document.
Jackson, C. K. and Mackevicius, C. L., 2024. What impacts can we expect from school spending policy? Evidence from evaluations in the United States. American Economic Journal: Applied Economics, 16(1), 412–46, https://doi.org/10.1257/app.20220279.
Johnson, R. C. and Jackson, C. K., 2019. Reducing inequality through dynamic complementarity: evidence from Head Start and public school spending. American Economic Journal: Economic Policy, 11, 310–49, https://doi.org/10.1257/pol.20180510.
Latimer, E., Sibieta, L. and Snape, D., 2025. Support for children with disabilities and special educational needs. IFS Report, https://ifs.org.uk/publications/support-children-disabilities-and-special-educational-needs.
Ministry of Housing, Communities and Local Government, 2025. National funding formula for schools and high needs from 2025. https://www.gov.uk/government/publications/national-funding-formula-for-schools-and-high-needs-from-2025.
Moura, B. and Tahir, I., 2024. The state of college finances in England. IFS Report, https://ifs.org.uk/publications/state-college-finances-england.
National Audit Office, 2024. Support for children and young people with special educational needs. NAO Report, https://www.nao.org.uk/reports/support-for-children-and-young-people-with-special-educational-needs/#downloads.
OECD, 2021. Micro-credential innovations in higher education: who, what and why? OECD Education Policy Perspectives 39, https://doi.org/10.1787/f14ef041-en.
Office for Students, 2024. Evaluation of the Higher Education Short Course trial. https://www.officeforstudents.org.uk/media/nlhjy3pm/evaluation-of-the-higher-education-short-course-trial.pdf.
Office for Students, 2025a. Financial sustainability of higher education providers in England: 2025. https://www.officeforstudents.org.uk/publications/financial-sustainability-of-higher-education-providers-in-england-2025/.
Office for Students, 2025b. Funding for 2025-26: decisions and allocations. https://www.officeforstudents.org.uk/publications/funding-for-2025-26-decisions-and-allocations/.
Office for Students, 2025c. Annual TRAC 2023-24: sector summary and analysis by TRAC peer group. https://www.officeforstudents.org.uk/publications/annual-trac-2023-24/.
Ogden, K. and Tahir, I., 2025. Funding, finance and reform: an analysis of the Post-16 Education and Skills White Paper. IFS Report, https://ifs.org.uk/publications/funding-finance-and-reform-analysis-post-16-education-and-skills-white-paper.
Ogden, K. and Waltmann, B., 2022. Cost-of-living crisis to hit students harder than expected. IFS Comment, https://ifs.org.uk/news/cost-living-crisis-hit-students-harder-expected.
Phipps, B., Nermond, O., Revel, A., Egglestone, C., Jones, E. and Evans, S., 2025. The workforce learning slowdown? Adult Participation in Learning Survey 2025. Learning and Work Institute, https://learningandwork.org.uk/resources/research-and-reports/adult-participation-in-learning-survey-2025/.
Sibieta, L., 2023a. The decline in spending on school buildings. IFS Comment, https://ifs.org.uk/articles/decline-spending-school-buildings.
Sibieta, L., 2023b. How does school spending per pupil differ across the UK? IFS Report, https://ifs.org.uk/publications/how-does-school-spending-pupil-differ-across-uk.
Sibieta, L., 2023c. Tax, private school fees and state school spending. IFS Report, https://ifs.org.uk/publications/tax-private-school-fees-and-state-school-spending.
Sibieta, L., 2025. Demographic change and schools across the UK: lessons from history. IFS Report, https://ifs.org.uk/publications/demographic-change-and-schools-across-uk-lessons-history.
Sibieta, L. and Snape, D., 2024. Spending on special educational needs in England: something has to change. IFS Report, https://ifs.org.uk/publications/spending-special-educational-needs-england-something-has-change.
Sibieta, L. and Snape, D., 2025a. Scottish school spending, teachers and pupil numbers. IFS Report, https://ifs.org.uk/publications/scottish-school-spending-teachers-and-pupil-numbers
Sibieta, L. and Snape, D., 2025b. England’s SEND crisis: costs, challenges and the case for reform. IFS Comment, https://ifs.org.uk/articles/englands-send-crisis-costs-challenges-and-case-reform.
Sibieta, L. and Tahir, I. 2023. What has happened to college teacher pay in England? IFS Comment, https://ifs.org.uk/publications/what-has-happened-college-teacher-pay-england.
Sibieta, L., Tahir, I. and Waltmann, B., 2021. Big changes ahead for adult education funding? Definitely maybe. IFS Report, https://ifs.org.uk/publications/big-changes-ahead-adult-education-funding-definitely-maybe.
Stewart, K. and Obolenskaya, P., 2015. The coalition’s record on the under fives: policy, spending and outcomes 2010-2015. LSE, Centre for Analysis of Social Exclusion, Social Policy in a Cold Climate, Working Paper 12, https://sticerd.lse.ac.uk/dps/case/spcc/WP12.pdf.
Student Finance England, 2016. Student finance – how you’re assessed and paid, 2016/17. https://www.practitioners.slc.co.uk/media/1282/sfe_how_you_are_assessed_guide_1617_d.pdf.
Student Loans Company, 2025. Student finance: how you’re assessed and paid 2025 to 2026. https://www.gov.uk/government/publications/student-finance-how-youre-assessed-and-paid/student-finance-how-youre-assessed-and-paid-2025-to-2026.
Tahir, I., 2023. Investment in training and skills. IFS Green Budget 2023, https://ifs.org.uk/publications/investment-training-and-skills.
Waltmann, B., 2022a. Government uses high inflation as cover for hitting students, graduates and universities. IFS Comment, https://ifs.org.uk/articles/government-uses-high-inflation-cover-hitting-students-graduates-and-universities.
Waltmann, B., 2022b. Student loans reform is a leap into the unknown. IFS Report, https://ifs.org.uk/publications/student-loans-reform-leap-unknown.
Data
Department for Work and Pensions, National Centre for Social Research, Office for National Statistics. Social and Vital Statistics Division. Family Resources Survey. [data collection]. Retrieved from https://discover.ukdataservice.ac.uk/series/?sn=200017
Office for National Statistics. Social Survey Division, Northern Ireland Statistics and Research Agency. Central Survey Unit. Quarterly Labour Force Survey. [data collection]. Retrieved from https://discover.ukdataservice.ac.uk/series/?sn=2000026
Office of Population Censuses and Surveys. Social Survey Division. Labour Force Survey. [data collection]. UK Data Service. Retrieved from https://discover.ukdataservice.ac.uk/series/?sn=2000026
University of Essex. Institute for Social and Economic Research. British Household Panel Survey. [data collection]. UK Data Service. https://discover.ukdataservice.ac.uk/series/?sn=200005
University of Essex. Institute for Social and Economic Research. Understanding Society. [data collection]. UK Data Service. https://discover.ukdataservice.ac.uk/series/?sn=2000053
Endnotes
Authors

Christine Farquharson
Christine's research examines inequalities in children's education and health, especially in the early education and childcare sector.

Kate Ogden
Kate joined the IFS in 2020 and works on local government finance and higher education.

Natan Ornadel
Natan works in the Education and Skills sector. His current research covers early years and higher education.

Nick Ridpath
Nick joined the IFS in 2023 and works in the Education and Skills sector, focusing on the long-run impacts of education policy.

Luke Sibieta
Luke is a Research Fellow at the IFS and his general research interests include education policy, political economy and poverty and inequality.

Darcey Snape
Darcey joined the IFS in 2024 as a research economist in the Education and Skills sector.

Imran Tahir
Imran joined the IFS in 2019 and works in the Education and Skills sector.
More from IFS
Understand this issue


Policy analysis


Academic research


