
Methods and data
Early years
There are a number of data sources for spending on the early years, each covering a slightly different set of spending and each available for a different period of time. As with any exercise to construct a historical series of spending, there will inevitably be limitations in the data quality and consistency from year to year. We have prioritised building a consistent series as far as possible, including using imputation where warranted.
Spending on the free entitlement
In constructing a series for spending on early education, we combine information from several data sources. We use budget data from the Section 251 summary budget tables, which we cross-check against the Dedicated Schools Grant (DSG). We also use data on spending (out-turns) from the Department for Education’s LA and school expenditure series and related official statistics. Finally, in the earliest years of the free entitlement (1997–98 and 1998–99), we use data on reported central government spending on nursery vouchers through the Nursery Education Grant.
Spending per hour and the hourly funding rate
Our focus is on constructing a measure of spending that is consistent over time and accurately reflects the amount of resource that the public sector puts into the free entitlement. This is clearly influenced by the core hourly funding rate (used in the DSG since 2012–13), but the two are not the same.
In the Early Years National Funding Formula, the core funding rate reflects the minimum amount that central government allocates per hour of care. Around 95% of this is passed on to providers by local authorities (this pass-through rate has risen over time in response to policy changes).
Our wider measure of spending also includes spending on a range of uplifts and supplements, such as the Early Years Pupil Premium, the high needs supplement, the maintained nursery supplement, and any additional spending that local authorities choose to take on to support their early years sector.
Detailed methodology
The budget data are based on the Individual Schools Budget for nursery schools (2001–02 to 2009–10) and for early years (2010–11 to 2019–20 and 2022–23). From 2012–13 onwards, they net out spending on the 2-year-old free entitlement as well as some elements of health-related and central spending.
Section 251 out-turn data are calculated as net current spend from nursery schools and private, voluntary and independent (PVI) providers plus net current central spend on nursery schools.
We believe that the data series has the following limitations:
• Budget data between 2001–02 and 2009–10 likely exclude spending on nursery classes.
• Spending figures from the Section 251 returns do not explicitly include spending on free entitlement hours delivered by PVI providers from 2013–14 onwards.
Since we do not believe that spending was overstated in any of these years, we use the most complete measure of spending available in each period up to 2012–13 to provide the most accurate figures possible. Since 2012–13, the trends in the budget and SFR52 spending data have tracked each other closely (and, since 2015–16, the free entitlement block in the DSG has tracked both of these series as well). We have preferred the budget measures for these years to avoid another break in the data series. This means that our figures do the following:
• 1997–98 to 1998–99 – Use spending on the Nursery Education Grant.
• 1999–2000 to 2000–01 – There are no spending data in 1999–2000, and spending data in 2000–01 are incomplete. We do not report spending figures for these years.
• 2001–02 to 2009–10 – Use the Section 251 spending data as they explicitly include spending on PVI provision of the free entitlement (while the budget data are likely to exclude spending on nursery classes).
• 2010–11 to 2012–13 – Use the budget data (which now relate to all early years spending) as they are likely to be more comprehensive.
• 2013–14 to 2019–20 and 2022–23 – Continue to use the budget data to provide a more consistent series. (Budget and SFR52 spending data track each other closely.)
Changes during the COVID-19 pandemic
To ease the pressure on the education sector during the COVID-19 pandemic, local authorities were exempted from completing their regular Section 251 reporting in 2020–21. To arrive at an estimate of spending in this year, we therefore use information from the DSG (which was available for 2020–21).
To make the estimate more consistent with our wider series of education spending, we use statistical models to assess the relationship between the DSG and our preferred Section 251 series in previous years. Taking into account both trends in both series over time and changing population, we use this historical relationship to adjust the 2020–21 DSG numbers to more closely match our existing series.
Spending in the tax and benefits systems
We also consider wider measures of support for early education and childcare, namely through spending on childcare subsidies delivered through the tax and benefits systems such as employer-supported childcare vouchers, tax-free childcare, and the childcare element of working tax credit and universal credit.
Relief through the tax system
As for the free entitlement, we have pieced together a historical record of spending based on data from a number of sources. In the tax system, data on forgone tax and National Insurance revenues are first available from 2007–08 (although employer-supported childcare vouchers were first introduced in 2005). We combine data from table 2 of Stewart and Obolenskaya (2015) and from HMRC’s Ready Reckoner, which shows the costs of various tax reliefs. In the one year where the two data sources overlap, there is a considerable difference between them; however, the figures from HMRC for 2012–13 are more consistent with the rapid growth in spending from previous years, so we prefer the official government source in that year. We also avoid analysing spending around the point where the data source changes.
One complication is that, since these are national policies, spending figures are reported for the whole of the UK. In order to be consistent with the rest of our data on early years spending, which focus on England, we attribute a portion of these UK-wide costs to spending in England based on the English share of the under-15 population in the UK.
In more recent years, tax-free childcare has become increasingly important as the intended replacement to vouchers. To the best of our knowledge, there is only one data source for the cost of tax relief on tax-free childcare: the Office for Budget Responsibility’s Economic and Fiscal Outlook.
Subsidies through the benefits system
On the benefits side, we again rely on Stewart and Obolenskaya (2015) for historical data. For more recent years, we use HMRC’s statistics on awards through working tax credit (finalised where available). As with the tax system, we use population shares to attribute a portion of UK-wide spending to England.
In the period where Stewart and Obolenskaya’s figures overlap with data from HMRC’s working tax credit statistics, there is a very close correspondence between the two series; discrepancies are likely the result of rounding. We therefore prefer to use data from HMRC to be as consistent as possible with later figures, so we follow Stewart and Obolenskaya from 1997–98 through 2007–08 and the HMRC statistics thereafter.
In the last few years, working tax credit has become less important in the system as new and existing claimants are brought into universal credit (UC). Unfortunately, there is no consistent information available on spending on the childcare element of UC over time.
There is, however, information on expenditure on cost subsidies via UC in one year, 2021–22 (Department for Work and Pensions, 2022). We combine information on the average payment for the childcare component with the actual number of families receiving some support for childcare expenses (published monthly by the Department for Work and Pensions via the interactive Stat-Xplore tool) to estimate the total cost in 2021–22.
For other years, we assume the average payment is the same in real terms as in 2021–22 – the only year data are available – and combine with the published statistics on the number of families claiming.
While this approach has limitations (for instance, if the average payment has changed over time), it is the most sensible estimate we can make with the very limited data available.
Measuring changes in childcare providers’ cost
Typically, we adjust cash-terms spending over time for rises in the general price level (i.e. inflation) using the GDP deflator. This measures economy-wide inflation, including goods and services purchased by the government, and is the standard metric for converting spending by government into real terms.
However, early years providers’ costs are different from those faced by the government as a whole. We might expect this to matter more at a time of historically high inflation; therefore we also present real-terms funding as adjusted by an index of prices facing childcare providers.
To construct the childcare providers’ price index, we take a weighted average of the prices of the main components of provider expenditure (namely, staff costs, materials, rent and utilities), with weights reflecting each component’s share of providers’ overall costs (sourced from the Childcare and Early Years Providers Survey in 2019). Table 1 provides an overview of the measures and weights used.
The path of future inflation is still highly uncertain. Our index provides an illustration of how the prices faced by childcare providers might change over the coming years.
Table 1. Components and weighting of the index of prices facing childcare providers
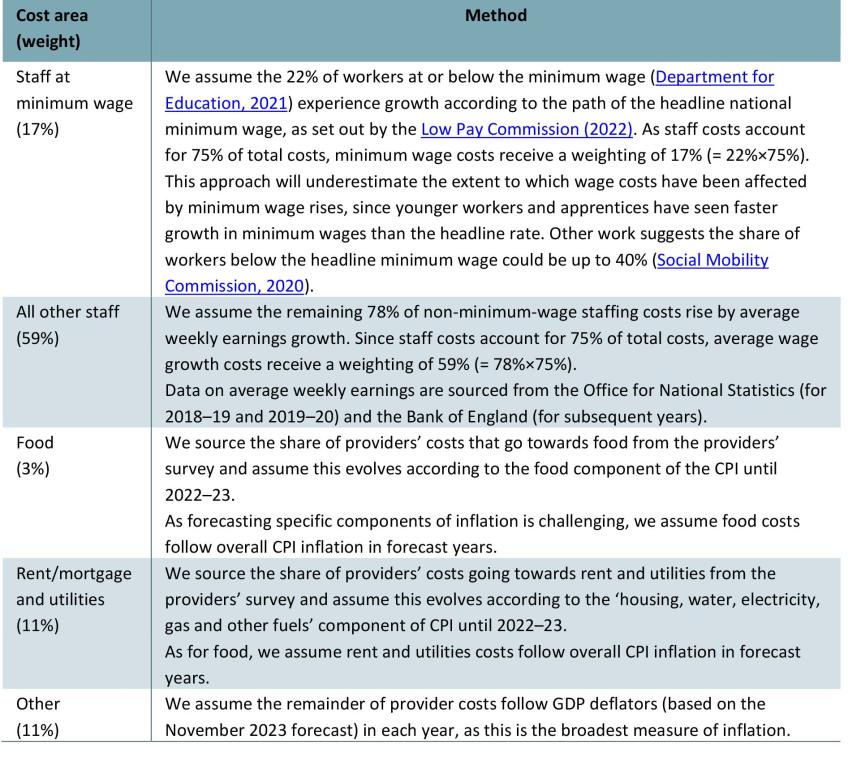
Note: Adapted from table 2 in Drayton and Farquharson (2022). ‘The providers’ survey’ refers to the Childcare and Early Years Providers Survey in 2019. All providers’ cost shares are sourced from this survey. Weights do not sum to 100% because of rounding.
Source: The share of workers affected by the national minimum wage is sourced from Early years funded entitlement cost changes forecasts, England: spending round 2021 to 2022.
Historical national minimum wage rises are sourced from National Minimum Wage and National Living Wage rates; forecasts come from Low Pay Commission (2022).
Past average wage growth is taken from Office for National Statistics, Average weekly earnings time series and Bank of England, Monetary Policy Report – August 2023; forecasts of average wage growth come from the same Bank of England report.
Headline CPI and individual components of CPI come from Office for National Statistics, Inflation and price indices; forecasts of CPI are sourced from Bank of England, Monetary Policy Report – August 2023.
GDP deflator historical data and Office for Budget Responsibility forecasts are taken from GDP deflators at market prices, and money GDP November 2023.
Forecasting free entitlement funding
To forecast spending out to 2027–28 (the final year of the forecast horizon for the March 2023 Budget), we combine information from the Budget with ONS population projections, historical data on the take-up of different entitlements, and data on funding allocations from the Dedicated Schools Grant.
The Budget set out the total amount of additional funding for the free entitlement until 2027–28, covering both uplifts to the funding of existing entitlements and spending on the new programmes. This lets us analyse how total funding for the free entitlement is set to change.
In order to analyse what the Budget means for existing entitlements, it is also useful to model how the total free entitlement budget might be allocated across the different programmes. This is an indicative rather than an exact process, but it helps to illustrate what the Budget promises could mean for providers.
First, we need to allocate the Budget uplift across existing and new entitlements. The Chancellor promised a funding uplift worth £202 million in 2023–24, rising to £288 million the following year. This money will raise the funding rate for existing entitlements.
• For 2023–24, the government has announced (Department for Education, 2023) that the uplift will raise average funding rates for 3- and 4-year-olds to £5.62 an hour from September, and for 2-year-olds to £7.95.
• For 2024–25, we know that the rate for 2-year-olds is set to rise to £8.28 in cash terms. Using our forecast for part-time-equivalent places, we work out how much of the uplift this will use up and calculate what the rate for 3- and 4-year-olds could be based on the remainder.
• We then assume that these hourly funding rates are protected in real terms going forward. Coupled with projections for part-time-equivalent places in each entitlement, this allows us to calculate the total budget.
• We then subtract the amount of additional funding implied by these plans from the total funding set out in the Budget scorecard, and assume that the difference will all be used to fund the new Budget entitlements. This leaves just under £4 billion for the new entitlements in 2025–26, the year roll-out is completed.
Here we detail how we constructed our series for spending per student in further education colleges (including sixth-form colleges) and school sixth forms (academies and maintained schools). Table 1 gives details of the numbers and sources.
2003–04 to 2023–24
From 2003–04 to 2023–24, we are able to calculate both sets of figures by first calculating total reported allocations to further education and sixth-form colleges and to school sixth forms. This includes spending on learners with learning difficulties or disabilities between 2005–06 and 2014–15 (no spending is reported outside of these years) and high-needs top-up payments from local authorities to 16–18 providers between 2013–14 and 2023–24. For colleges, we are able to calculate these directly as top-up payments to post-school providers. For school sixth forms, we impute them as 0.125 of the total top-up payments to state-funded secondary schools (0.125 being the approximate share of pupils at state-funded secondary schools who are aged 16–19).
For years between 2003–04 and 2015–16, we can then simply divide these allocations by the reported numbers of students by institution type. This includes pupils aged 16–18 who are participating in further education at higher education institutions.
From 2017, sixth-form colleges had the opportunity to convert to academy status. This creates a problem for our analysis as the funding shifts from being classified at 16–18 colleges towards academies with school sixth forms. The students also move from being classified as in sixth-form colleges towards academies. Unfortunately, the student and funding data are reported at different times of the years and are highly likely to be inconsistent with one another. Using the raw data would lead to a misleading conclusion. We therefore employ the following steps from 2016–17:
- We manually recode academy sixth-form colleges back to sixth-form colleges. There are fewer than 20 of these in academic year 2017–18, though closer to 30 by 2023–24.
- We calculate total funding (excluding student support and 19+ funding) allocated to school sixth forms and colleges.
- We divide by student numbers at school sixth forms and colleges as reported in national statistics for academic years 2015–16 and 2016–17 (i.e. using end of calendar year 2016 for 2016–17).
- For academic years 2017–18 to 2023–24, we calculate student numbers for school sixth forms and sixth-form colleges in a different way. We first use the national statistics to obtain the total number of students across school sixth forms and sixth-form colleges, and we use the institutional allocations to obtain the percentages of students in school sixth forms and in sixth-form colleges. We multiply the total number of students across school sixth forms and sixth-form colleges by these two shares to get the numbers of students in school sixth forms and in sixth-form colleges. We adjust these figures by the share of part-time students in each institution to get an estimate of the total full-time-equivalent (FTE) numbers. For 2024–25, student numbers are forecast based on Office for National Statistics (ONS) projections for 16- to 18-year-olds in England.
- This gives a series by academic years. We then take averages between years to give a series in financial years (e.g. FY 2017–18 = 4/12 × AY 2016–17 + 8/12 × AY 2017–18).
Before 2004–05
Before 2004–05, figures for spending per student in further education are available from various departmental and ONS publications. These give slightly different levels for spending per student in 2003–04 from the more recent source. We therefore take the more reliable 2003–04 figure and back-cast imputed figures based on past changes in spending per student in further education. Figures for spending per student in school sixth forms are not readily available before 2002–03.
Split by three institutional types from 2013–14 onwards
From 2013–14 onwards, we are able to split spending per student by all three main institutional types: school sixth forms; sixth-form colleges; and further education colleges. These figures are based on reported allocations to providers, with total spending measured as total programme funding for individuals aged 16–18, plus high-needs funding, funding adjustments for young people who have not achieved C grades in English and maths GCSEs, Capacity and Delivery Funding and the Advanced Maths Premium Funding. We adjust student and institution numbers in the same way as above to account for conversions of sixth-form colleges to academy status. However, in contrast to our main figures, we leave these figures in academic rather than financial years, given this is how the data are presented.
We use the same methods and approach to examine how spending per student varies across areas. The only difference is that we use headcounts by institution as recorded within the funding allocations. This is because there are currently no publicly available data on the number of full-time-equivalent students by institution and local authority.
Table 1. Spending on and numbers of students in further education and school sixth forms (spending figures in 2023–24 prices)
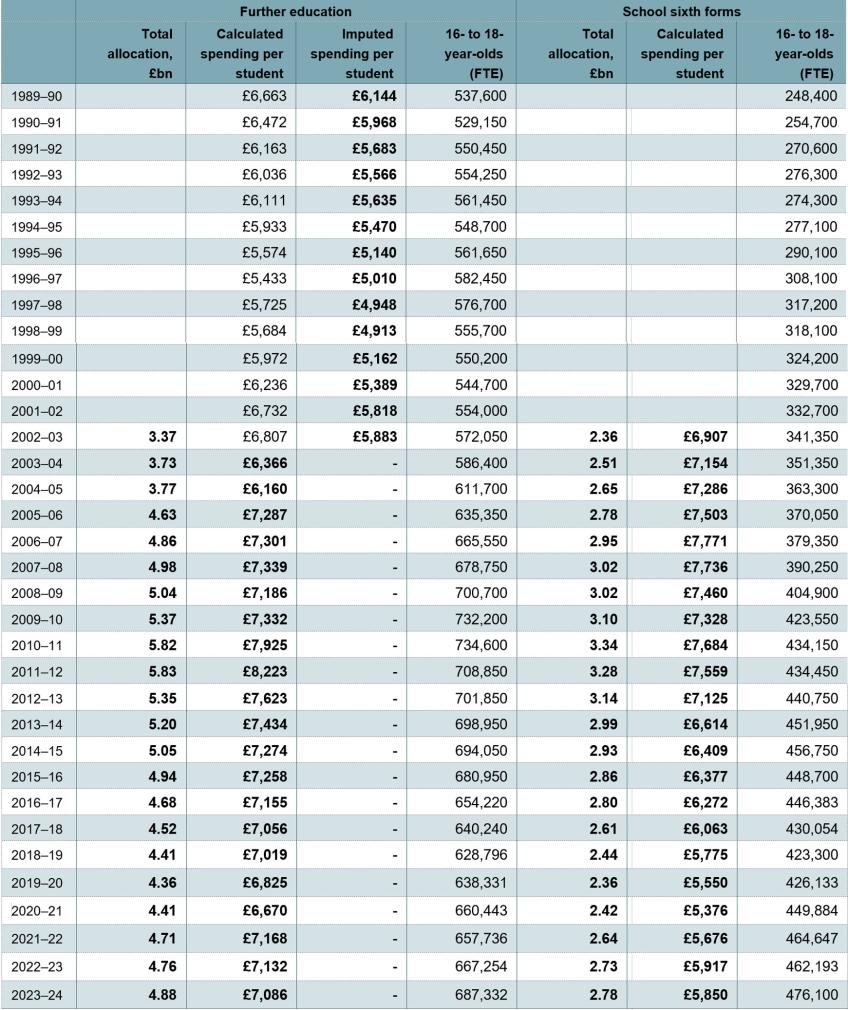
Note and source: Number of full-time-equivalent (FTE) students calculated as number of full-time students plus 0.5 times number of part-time students. Spending per student from 2016–17 to 2023–24 calculated based on total funding allocations in annual 16–19 funding allocations (https://www.gov.uk/guidance/16-to-19-education-funding-allocations) divided by the number of FTE students aged 16–18 in further education colleges and school sixth forms. Number of students taken from Department for Education, ‘Participation in education, training and employment: 2022’ (https://explore-education-statistics.service.gov.uk/find-statistics/participation-in-education-and-training-and-employment/2022). For 2017–18 to 2023–24, these figures are adjusted based on the number of students reported in the aforementioned 16–19 institutional funding allocations. Spending per student for 2003–04 to 2015–16 calculated as spending on further education for 16- to 19-year-olds, sixth-form spending (maintained schools and academies) and spending on learners with learning difficulties or disabilities as reported in Education Funding Agency annual report and accounts for 2012–13 to 2015–16 (https://www.gov.uk/government/publications/efa-annual-report-and-accounts-for-the-year-ended-31-march-2016, https://www.gov.uk/government/publications/efa-annual-report-and-accounts-for-the-year-ended-31-march-2015, https://www.gov.uk/government/publications/efa-annual-report-and-accounts-1-april-2013-to-31-march-2014, https://www.gov.uk/government/publications/efa-annual-report-and-financial-statements-for-april-2012-to-march-2013), Young People’s Learning Agency annual report and accounts for 2011–12 (https://www.gov.uk/government/publications/the-young-peoples-learning-agencys-annual-report-and-accounts-for-2011-to-2012) and Learning and Skills Council annual report and accounts for 2004–05 to 2009–10 (https://www.gov.uk/government/publications/the-learning-and-skills-councils-annual-report-2009-to-2010, https://www.gov.uk/government/publications/the-learning-and-skills-councils-annual-report-and-accounts-for-2008-to-2009, https://www.gov.uk/government/publications/the-learning-and-skills-councils-annual-report-and-accounts-for-2007-to-2008, https://www.gov.uk/government/publications/the-learning-and-skills-councils-annual-report-and-accounts-2006-to-2007, https://www.gov.uk/government/publications/the-learning-and-skills-councils-annual-report-and-accounts-for-2005-to-2006, https://www.gov.uk/government/publications/learning-and-skills-councils-annual-report-and-accounts-for-2004-to-2005) and divided by number of FTE students aged 16–18 in further education colleges and school sixth forms. Number of students taken from Department for Education, ‘Participation in education, training and employment: 2018’ (https://www.gov.uk/government/statistics/participation-in-education-training-and-employment-2018). For years between 2013–14 and 2018–19, we also include local authority top-ups for high-needs pupils calculated from local authority spending plans (https://www.gov.uk/government/collections/statistics-local-authority-school-finance-data). Figures for spending per student in further education from 1989–90 to 2003–04 taken from Department for Children, Schools and Families departmental report for 2009 (http://webarchive.nationalarchives.gov.uk/20130401151715/http://www.education.gov.uk/publications/eOrderingDownload/DCSF-Annual%20Report%202009-BKMK.PDF) and Department for Education and Employment, ‘Education and training expenditure since 1989–90’, Statistical Bulletin 10/99 (http://dera.ioe.ac.uk/13586/1/Education_and_training_expenditure_since_1989-90_%28Statistics_Bulletin_10_99%29.pdf). Imputed figures are calculated by back-rating the calculated figure in 2003–04 by the real-terms growth in the calculated series (figures for overlapping years are not shown here). HM Treasury GDP deflators, November 2023 (https://www.gov.uk/government/statistics/gdp-deflators-at-market-prices-and-money-gdp-november-2023-autumn-statement).