
Downloads
Download the report as a PDF
PDF | 650.22 KB
Executive summary
The number of children in the UK is expected to decline by about 7% or 800,000 between 2025 and 2035. Policymakers could use this as an opportunity to make savings in the education budget, or they could use existing resources more intensively over a smaller population, through smaller class sizes for example. This is not the first time that policymakers in the UK have faced these trade-offs. Following the post-war baby boom, fertility levels started to fall significantly from the 1960s onwards. This led to a significant decline in the school population during the 1970s and 1980s. There was then a further decline during the 2000s. Looking at how policymakers navigated these past changes can provide valuable lessons for policymakers today by showing what is possible.
Key findings
- The number of children aged 0–15 in the UK is forecast to fall over the next decade. The Office for National Statistics forecasts that these falls will be fastest for Northern Ireland (15%) and Wales (10%), with slightly smaller declines forecast in Scotland (8%) and England (6%) between 2025 and 2035. This comes on top of significant falls that have already happened. As a result, the number of children is forecast to be 44% lower in Scotland in 2035 than in 1971, 34% lower in Northern Ireland and 30% lower in Wales. Because of smaller long-term falls, the child population in England is forecast to be only about 16% below its level in 1971.
- Falling numbers of children mainly reflect reduced fertility levels. The total fertility rate (TFR) has fallen from 1.9 in 2010 to 1.4 by 2024, well below the replacement rate of around 2.1. The Office for National Statistics currently expects fertility to stabilise at about 1.4–1.5 in the future. But previous forecasts over the course of the last 10 years have also predicted stabilisation in the TFR and yet fertility has continued to decline. It therefore seems reasonable to consider it likely that the number of children may decline faster than current forecasts suggest.
- Teacher numbers fell during the last big drop in pupil numbers over the 1970s and 1980s. There was some smoothing of teacher numbers for primary schools, with teacher numbers falling by about half the rate of pupil numbers between 1973 and 1985. For example, in England, primary school pupil numbers fell by 25%, whilst teacher numbers only fell by 14%. We also see falls in teacher numbers for Wales and Scotland.
- When pupil numbers fell during the 2000s, teacher numbers actually rose or stayed steady. This can be seen across England, Wales and Scotland. It partly reflected policy objectives to reduce class sizes and was facilitated by a period of buoyant growth in school spending per pupil.
- Over the past decade in England, reductions in primary school pupil numbers have been highly correlated with falls in teacher numbers across local authorities, but there has been barely any reduction in the number of schools. Between 2016 and 2025, the number of primary school pupils fell by 9% in London. This resulted in an 11% decline in the number of teachers and a 4% fall in the number of classes. The number of schools only fell by 2%.
- In Scotland and Wales, changes in numbers of both schools and teachers across local authorities do appear strongly related to changes in the number of pupils between 2016 and 2025. In Wales, the absolute number of primary schools fell by 87, which was significantly more than the drop across England (35). This is despite the fact that the absolute drop in the pupil population was about six times larger in England than in Wales (60,000 compared with 10,000).
- Planning for school places should be coherent and led by evidence. Councils are mainly responsible for school place planning in Scotland and Wales, whilst a single national authority takes responsibility in Northern Ireland. In England, the system is confused, with fragmented responsibilities across councils, academies and central government. This process should be simplified to give clear responsibility to either councils or regional bodies. In all cases, there is a need for better local population forecasts. School place planning should also be focused on high-quality provision, such as maintaining high-quality, popular schools, whilst closing other schools.
1. Introduction
The number of children in the UK is expected to decline by about 7% or 800,000 between 2025 and 2035.1 Adapting to fewer children is set to be one of the biggest challenges facing the education sector over next decade and beyond. Early years and primary schools have already seen declines in pupil numbers, which will gradually feed through to secondary schools, sixth forms, colleges and universities.
A smaller number of children means less demand for education inputs and spending. In principle, this creates opportunities for savings if policymakers are able to reduce the number of schools, teachers, wider staff or other inputs. Alternatively, existing inputs could be used more intensively and spread out over fewer children, such as through smaller class sizes.
These are trade-offs that policymakers will increasingly need to navigate over the coming years. The desirability and feasibility of different choices will also vary over time and around the country. It is clearly harder to reduce staffing levels and the number of schools in the short run, but it may be necessary over the long run. It may also be harder to reduce school and staff numbers in rural areas, given the impact of school closures on local communities.
In this report, we describe the expected trends in pupil numbers over the next decade across the UK, the choices facing policymakers, and how past declines in pupil numbers have translated into the numbers of schools and teachers. We look across the four nations of the UK to learn more from the different demographic and policy contexts in each nation.
Section 2 examines the expected trends in child and pupil numbers across the UK. Section 3 details the choices and trade-offs facing policymakers, and how they have navigated these choices over the long run. This focuses on the last big drops in pupil numbers during the late 1970s and 1980s and during the 2000s. Section 3 also examines more recent trends and choices across local areas since pupil numbers started to fall about a decade ago. We conclude by discussing how policymakers should navigate these choices and the priorities for future research to best inform these choices.
2. What is happening to the number of children?
Whilst forecasts imply a large overall decline in the number of children in the UK over the next decade, these declines will differ across different parts of the country, they will occur at different points in time for different parts of the education system and there is significant uncertainty about the size of the overall decline. With this in mind, this section discusses how declines in the child population are forecast to differ across the UK, the historical and international context, and the factors driving these declines. In order to forecast the child population, one needs to forecast expected levels of fertility and migration, amongst other factors, which are clearly subject to high levels of uncertainty. In the next section, we examine the policy and resource choices facing policymakers, and how they have navigated these choices over the long run.
Figure 1 shows that declines in the number of children (aged 0–15) over the next decade (2025 to 2035) are currently forecast to be fastest for Northern Ireland (15%) and Wales (10%), with slightly smaller declines forecast in Scotland (8%) and England (6%). For Scotland, Wales and Northern Ireland, such falls continue historical declines in the number of children. For England, this is the first significant fall in the child population since the 1980s.
Figure 1. Actual and projected number of children aged 0–15 across the four nations of the UK over time, relative to level in 2010
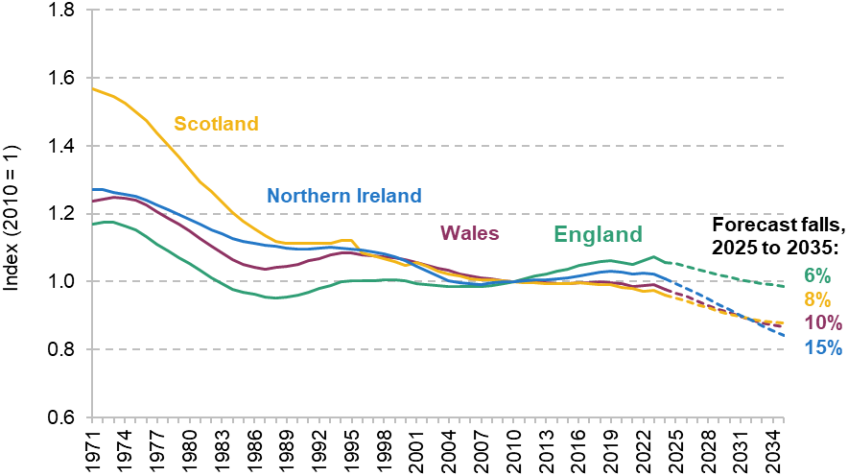
Source: Office for National Statistics, National population projections: 2022-based (https://www.nomisweb.co.uk/datasets/ppsyoa), Population estimates (https://www.nomisweb.co.uk/datasets/pestsyoala) and historical data (https://www.ons.gov.uk/peoplepopulationandcommunity/populationandmigration/populationestimates/datasets/populationestimatesforukenglandandwalesscotlandandnorthernireland).
During the 1970s and 1980s, all four nations of the UK saw large declines in the child population, with a fall of 12% in Northern Ireland, 16% in Wales and 18% in England between 1971 and 1986. Scotland saw an even larger decline of 26% over the same period. From the 1990s onwards, the child population continued to decline across Wales, Scotland and Northern Ireland, though at a slower rate (and with exceptions of brief rises in Wales in the early 1990s and Northern Ireland in the 2010s). Combined with expected future declines, the number of children is forecast to be significantly lower in 2035 than in 1971 in Wales (30% below its 1971 level), Northern Ireland (34% below its 1971 level) and Scotland (44% below its 1971 level).
In England, by contrast, the number of children has risen over the last 20–30 years, with a gradual rise over the 1990s and a 7% rise between 2010 and 2023. This is likely to reflect higher fertility levels and migration in England than in the rest of the UK. If current forecasts are accurate, the expected decline in the size of the child population in England will leave it about the same level as it was during the early 1990s, though still about 16% below its level in 1971.
There may be a bounce-back in the size of the child population when children born during the mini baby boom of the 2000s in turn have their children, particularly in England. However, this all depends on actual levels of fertility, which has proven difficult to forecast (see Figure 3 later).
As a result of these expected declines, children are likely to represent a declining share of the overall population. As shown in Figure 2, children aged 0–15 represented about 25% of the population in the early 1970s in England, Scotland and Wales. This share has since declined significantly, with current forecasts implying that children will represent about 15% of the population by 2035 in England, Scotland and Wales. In Northern Ireland, children have represented a larger share of the population, though this has declined rapidly from about 32% in the early 1970s to about 20% today and then down to about 16% by 2035 (if current forecasts are accurate).
Figure 2. Shares of the population aged under 16 and over 65 over time across the UK (actual up to 2024 and forecast up to 2035)
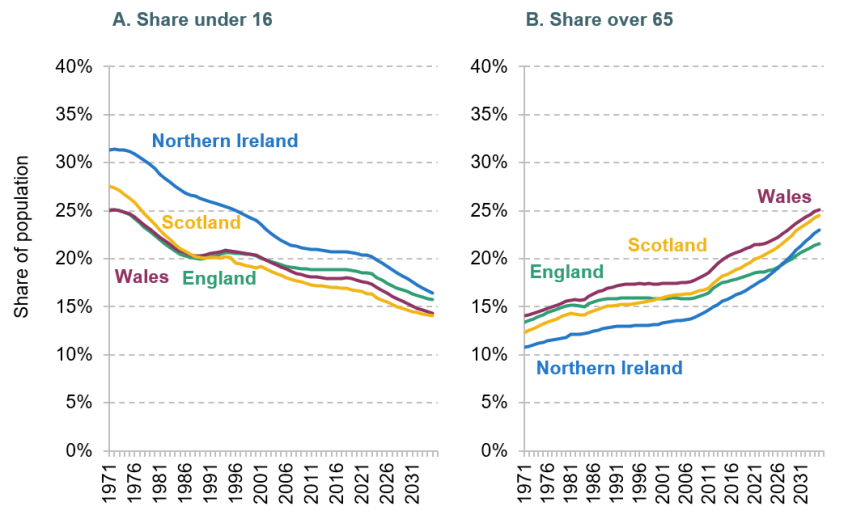
Source: Office for National Statistics, National population projections: 2022-based (https://www.nomisweb.co.uk/datasets/ppsyoa), Population estimates (https://www.nomisweb.co.uk/datasets/pestsyoala) and historical data (https://www.ons.gov.uk/peoplepopulationandcommunity/populationandmigration/populationestimates/datasets/populationestimatesforukenglandandwalesscotlandandnorthernireland).
At the same time, the share of the population that is aged over 65 is continuing to increase rapidly. In the early 1970s, people over 65 represented about 11% of the population in Northern Ireland up to about 14% in Wales. This is forecast to rise to about 22% of the population in England in 2035, 23% in Northern Ireland and 25% in both Scotland and Wales.
There is significant discussion and research about the fiscal consequences of an ageing population, with the Office for Budget Responsibility (2025) undertaking significant analysis about the fiscal impact of an ageing population due to rising demands for health and pensions spending. There is also work on the effects of reduced fertility on labour market activity. There is currently much less work examining the fiscal consequences and choices from a falling number and share of young people, with some notable exceptions (London Councils, 2025; National Foundation for Educational Research, 2025).
Falling numbers of children also place schooling in a relatively unusual position compared with other public services. Overall population growth means that most public services have seen rising demand for services over time. An ageing population further accentuates the demands on health and pensions spending. Schools, by contrast, are seeing reduced demand for services.
The main factor driving declines in the number of children is falling fertility levels. Figure 3 shows the total fertility rate over time, which captures the total number of children that women would be expected to have over their lifetime if the age-specific fertility rates observed in a given year were to remain constant throughout her lifetime. During the 1990s, the fertility rate declined from about 1.8 to just over 1.6 by 2000. Over the 2000s, fertility rose to about 1.9 children per woman by 2010. Since then, the total fertility rate has declined rapidly to just over 1.4. Current forecasts imply that fertility will stabilise around this level and then rise very slightly, though remaining at a historically low level and well below replacement levels.
Figure 3. Total fertility rate in the UK under current and historical forecasts
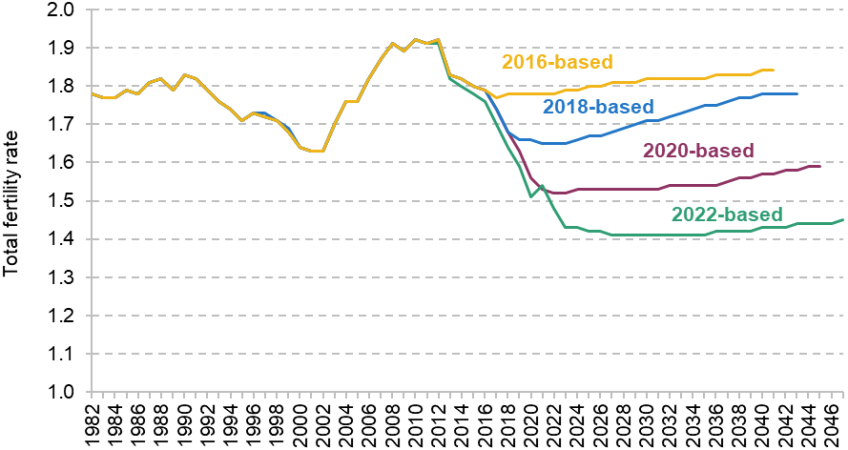
Source: Office for National Statistics, National population projections, fertility assumptions: 2022-based (https://www.ons.gov.uk/peoplepopulationandcommunity/populationandmigration/populationprojections/methodologies/nationalpopulationprojectionsfertilityassumptions2022based).
Interestingly, Figure 3 also shows that past forecasts have made some similar assumptions since about 2016 which have been persistently and systematically wrong. Each forecast since 2016 has projected that fertility would first stabilise and then start to rise. In reality, it has continued to decline. It is therefore important to consider the possibility that fertility may continue to decline and that the number of children may fall faster than official forecasts suggest.
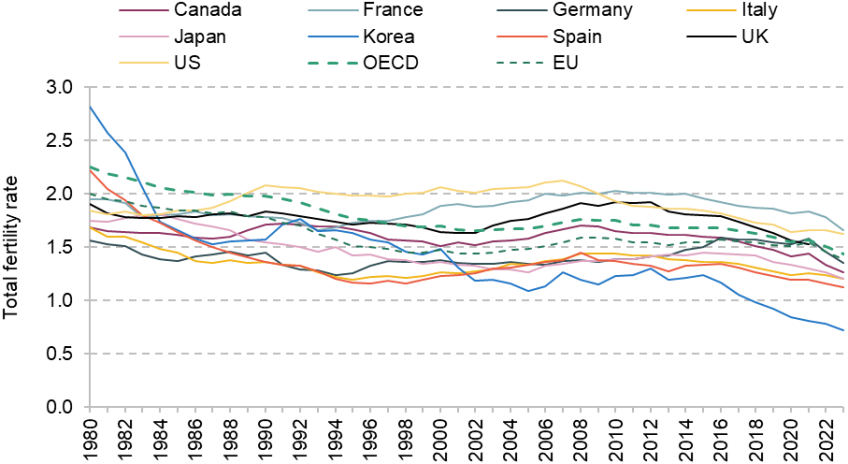
Figure 4 sets this analysis in an international context by showing the total fertility rate across selected high-income countries over time. The decline in fertility rates in the UK can be seen across a range of high-income countries. Indeed, current fertility rates in the UK are actually very slightly above the EU and OECD averages, though lower than in countries such as the US and France. Declines in fertility have been larger in many Southern European countries, such as Italy and Spain, and even more so in many East Asian countries such as Japan and Korea, where fertility rates are now 1.2 and 0.7, respectively.
Figure 4. Total fertility rates across selected countries over time
Source: OECD Family Database (https://www.oecd.org/en/data/datasets/oecd-family-database.html).
There is a significant body of work across multiple disciplines examining the causes of long-run declines in fertility. Improvements in medicine and contraception have allowed for better family planning (Aitken, 2024). Rising income levels and higher female labour force participation have tended to reduce fertility (Hotz, Klerman and Willis, 1997; Jones and Schoonbroodt, 2011). Linked to these trends, many parents have decided to have children later in life, leading to many families having fewer children and sometimes fewer than they would like (Beaujouan, Zeman and Nathan, 2023). Another key consideration is the ‘quantity–quality trade-off’ between the number of children and the quality of investments in individual children (Becker, 1960). Changes in technology and the importance of education may have increased the desirability of investing in a smaller number of children over the long run (Bloom, Kuhn and Prettner, 2024).
More recently, research has suggested that the link between income levels, female labour force participation and fertility has become less clear-cut (Doepke et al., 2023). In this review article, the authors argue that policies and norms that improve the compatibility of women’s careers and family goals can increase fertility, such as the availability of free/subsidised childcare, greater cooperation of fathers and flexible working arrangements. Kearney and Levine (2025) point to a reordering of adult priorities, with parenting becoming a diminished priority over time, relative to career opportunities and other activities.
Focusing on the UK, the declines in the number of pupils and students are being seen at different points for each stage of education. This is a natural consequence of declining fertility levels. As Figure 5 shows, recent declines in the number of children were first seen in primary schools in England, with secondary school pupil numbers only starting to decline from about 2026 onwards. In contrast, the number of students in further and higher education is forecast to carry on increasing through to the end of the 2020s, before beginning to decline. Trends in further and higher education will, however, naturally depend on levels of participation over time too. These different time trends mean that different stages of education are facing different resource choices and trade-offs at any one point in time.
Figure 5. Projected changes in pupil numbers across different stages of education in England relative to 2024
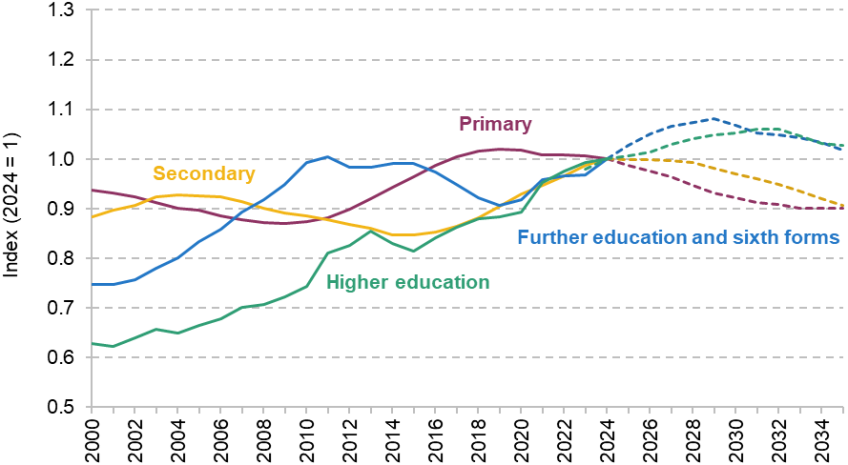
Source: Department for Education, National pupil projections 2025 (https://explore-education-statistics.service.gov.uk/find-statistics/national-pupil-projections/2025); Office for National Statistics, National population projections: 2022-based (https://www.nomisweb.co.uk/datasets/ppsyoa); Drayton et al. (2025).
For the rest of this report, we focus on schools as these are the largest element of education spending and will see the most acute pressures over the next 5–10 years. It could also be argued that the larger size of further and higher education institutions means that they are better placed to expand and contract as the number of students changes over time.
Declines in the number of children are also happening at different rates in different local areas across the country. To illustrate this, Figure 6 maps the actual percentage change in primary school pupil numbers across local authorities in England, Scotland and Wales between 2015–16 and 2024–25. The size of each local authority is shown in proportion to its population. These changes will reflect a combination of mechanisms, including changes in fertility, changes in where people choose to live in the UK and the level of immigration.
Figure 6. Change in primary school pupil numbers by local authority across Great Britain between 2015–16 and 2024–25

Source: Department for Education, Schools, pupils and their characteristics: 2025 (https://www.gov.uk/government/collections/statistics-school-and-pupil-numbers); StatsWales, Pupil Level Annual School Census: Schools by type and Pupils by local authority; Scottish Government, Summary statistics for schools in Scotland 2024 (https://www.gov.scot/publications/summary-statistics-for-schools-in-scotland-2024/).
As can be seen, declines in the pupil population in primary schools have not been uniform across the country. The largest declines are clearly in Inner London, at 15% or more in Camden, Hackney, Hammersmith and Fulham, Islington, Lambeth, Southwark and Westminster. Declines of 5–15% are common in most of the rest of London. We also see declines of 5–10% in Birmingham, West Yorkshire and Teesside.
In Wales, there appear to be declines in the primary school pupil population across almost all local authorities, with Newport being the only exception. The largest declines were in North Wales, with falls of 9–10% in Wrexham, Flintshire and Gwynedd.
In Scotland, there is a lot more variation across local authorities. In many central and southern local authorities, we see large declines, such as falls of over 10% in Argyll and Bute, Clackmannanshire, Dumfries and Galloway, North Ayrshire and West Dunbartonshire. Similar sized falls can also be seen in the Highlands and Islands. However, we also see large rises in the pupil population in the city of Aberdeen and in Midlothian.
Summary
Current projections imply large falls in the number of children in the UK over the next decade. These falls are expected to be larger in Scotland, Wales and Northern Ireland than in England. However, the falls in England represent an abrupt change, as they represent the first significant drop in the number of children in England since the 1980s. These falls in the pupil population mainly reflect lower fertility levels, which have been dropping across many high-income countries. However, we are also seeing larger falls in the pupil population in Inner London in particular, which may be more reflective of choices on where people live within the country and the high cost of housing in London.
3. Trade-offs and policy choices
Falling pupil numbers equate to falling demand for school services and for inputs into the production of those services, such as schools, teachers and other staff. In response, policymakers and schools face a range of trade-offs and choices. Broadly speaking, they could choose to maintain existing inputs in state-funded schools, such as by maintaining teacher numbers. This would lead to a greater intensity of inputs per pupil, such as smaller schools or class sizes. Alternatively, they could choose to reduce inputs in response to demand, which would generate savings.
These choices are made by a range of different actors across the school system. Decisions on the numbers of schools and the numbers of places available at each school are mostly made by central and/or local government, as well as multi-academy trusts (MATs) in England. Individual schools then make decisions on staffing levels and other input choices within their school, sometimes in collaboration with local councils. These are not entirely separate, however. The number of available places at a school will clearly heavily shape decisions on the number of teachers.
The choices also overlap with decisions on funding levels. Most school funding is allocated through pupil-led funding systems, with some limited funding provided on a school basis (such as lump sums to account for fixed costs). The default path with falling pupil numbers is therefore for pupil-led funding systems to generate savings for local and central government by allocating less funding to individual schools. This default path passes on much of the responsibility for delivering savings to individual schools, which are not well placed to make system-wide decisions on the number of schools or the number of classes per school. This default path also creates a risk of some schools becoming financially unsustainable over time. It is therefore important for local and central government to consider all the available choices in a strategic and long-term manner.
If policymakers prefer to maintain existing inputs, such as through smaller schools or smaller class sizes, they will also need to make active decisions to increase per-pupil funding levels or allocate more funding on a school basis. However, this clearly has a cost. It may be hard to justify when there is significant fiscal pressure and when demographic change at the other end of the age spectrum is pushing up spending on health and pensions. It may therefore be natural for policymakers to try to reduce spending at younger ages as the number of children falls.
With these issues in mind, we can consider these different choices in turn, including the factors shaping their relative desirability.
- Number of schools – Reducing the number of schools would likely generate savings as there are some fixed costs in running a school, such as building and management costs. It also becomes harder and more expensive to deliver a high-quality education with very small schools. It may therefore become necessary or desirable to close some schools. Such considerations may particularly apply in rural areas, where schools are already smaller on average. However, school closures represent a large change that could have negative effects and increase travel times for small communities. They are also hard and expensive to reverse if the population bounces back, which may be likely in some areas. Whilst local and central government are not responsible for private schools, falling numbers of children could lead to some private schools closing. Councils would need to be prepared to respond to such shocks.
- Number of classes within each school – Reducing the number of classes within a school is less dramatic than school closures and relatively easier to reverse; if pupil numbers rise again, old classrooms could be re-opened and new teachers and other staff re-employed. This option could include reducing the number of primary school forms within a school or reducing the number of classes per subject in secondary schools. As such, this would seem like the most natural choice for schools in the short run, where it is possible. This is harder in single-form-entry schools or small, rural primary schools that already combine age groups.
- Number of teachers – To some extent, reducing the number of teachers is a natural choice that would follow on from reducing the number of schools or classes. An alternative option would be for policymakers to still choose to maintain the size of the teaching workforce and allow teachers more working outside the classroom. This has been a focus for policymakers in Scotland, with the Scottish Government committing to reduce the number of contact hours for teachers from 22.5 to 21 hours per week as part of efforts to reduce teacher workload and improve well-being.
- Class sizes – Policymakers could also allow class sizes to fall as the number of pupils falls. However, this clearly reduces the scope for any savings and probably requires increases in per-pupil funding to make the system financially sustainable. The academic literature also only finds relatively weak impacts of reduced class sizes on pupil outcomes (Britton and Vignoles, 2021).
- Number of other staff – Policymakers and schools could also choose to reduce the number of other staff, such as teaching assistants or other support staff. This may be easier for schools if such staff are on more flexible contracts. However, it might be hard to reduce some types of staff in proportion to pupil numbers – for example, a school business manager or receptionist. Some staff might also be covered by statutory arrangements, such as teaching assistants employed to cover provision set out in Education, Health and Care Plans.
The relative desirability and feasibility of these choices will also differ across time and space. In the short run, many costs might be fixed or covered by contracts, limiting options to make savings. In the long run, there might be greater ability to adjust staffing or change the number of schools in a given area. A greater share of costs are likely to be fixed in smaller or rural schools, making it harder to generate savings without closing schools, which could itself have large implications for individual communities. This emphasises the importance of good long-term planning.
Given the importance of school closure and place planning, it is important to consider how these decisions are made. Below, we summarise the key differences across England, Wales, Scotland and Northern Ireland, particularly with respect to school openings and closures.
- England – Formally, local authorities are responsible for school place planning in their area. However, currently, they can only determine school place numbers at local authority maintained schools. Place numbers in academies are determined by academy trusts in collaboration with Regional Directors working across a range of councils and the Department for Education. Local authorities and academy trusts are required to collaborate to meet local demands, but this can be complicated in practice. Councils can decide to close local authority maintained schools. However, proposals to close academies must come from academy trusts or the Department for Education. This complicated situation is a motivation behind the provisions in the current Children’s Wellbeing and Schools Bill to give local authorities the powers to set place numbers at all state-funded schools in their area.
- Wales – Local authorities represent the key decision-maker as they are responsible for school place planning in each area. However, major decisions, such as opening or closing schools, have to be approved by the Welsh Government.
- Scotland – The situation is similar to Wales, with local authorities responsible for school place planning. Scottish local authorities must also operate within statutory frameworks set out by the Scottish Government, such as statutory consultation requirements.
- Northern Ireland – The Education Authority (an arm’s-length body responsible for schooling across Northern Ireland) is responsible for place planning across schools, but works in partnership with sectoral councils, such as the Council for Catholic Maintained Schools, Controlled Schools’ Support Council and other sector bodies. The Department of Education sets the strategic framework and must approve any big changes, such as school closures.
As such, there is a clear, formal role for local authorities across England, Wales and Scotland. However, central government is heavily involved in the process in some way across all four nations. In England, this is primarily through decisions on academies; school closures must be approved by central government in Wales and Northern Ireland; and the Scottish Government sets the statutory consultation requirements for closing schools.
Long-run changes in inputs
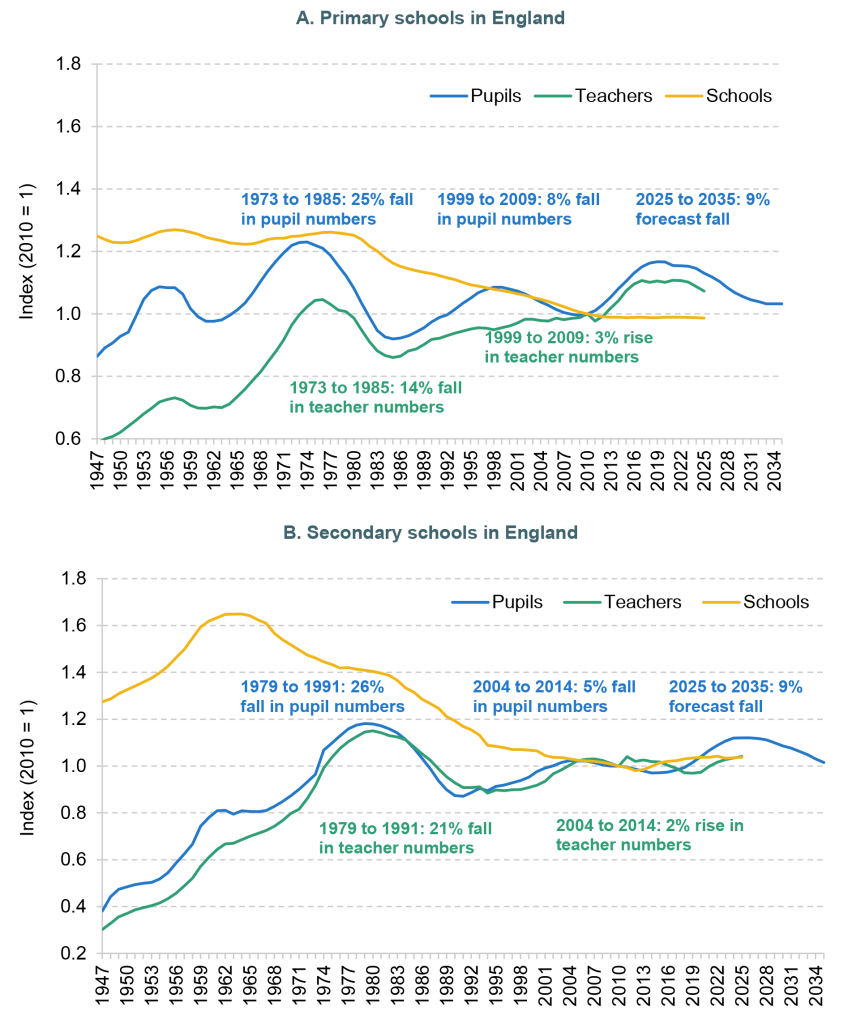
In order to understand the trade-offs facing policymakers and schools today, it is informative to consider how past policymakers have navigated these choices when faced with declines in the number of school children. With this in mind, Figure 7 shows how the numbers of pupils, schools and teachers in England have changed from 1947 through to 2025, together with forecasts for pupil numbers up to 2035. All figures are indexed to be equal to 1 in 2010 in order to focus on the relative changes over time. Figures 8 and 9 repeat this analysis for Wales and Scotland.
Figure 7. School, pupil and teacher numbers for England: 1947 to 2035, indexed to 1.0 in 2010
Source: Department for Children, Schools and Families (https://webarchive.nationalarchives.gov.uk/20100520035316/http:/www.dcsf.gov.uk/rsgateway/DB/SBU/b000384/b01-2003.pdf); Department for Education, Schools, pupils and their characteristics: 2025 and 2017 (https://www.gov.uk/government/collections/statistics-school-and-pupil-numbers); Department for Education, School workforce in England, 2024 and 2011 (https://www.gov.uk/government/collections/statistics-school-workforce); Department for Education, National pupil projections: July 2025 (https://www.gov.uk/government/statistics/national-pupil-projections-july-2025); Office for National Statistics, Population projections by single year of age (https://www.nomisweb.co.uk/datasets/ppsyoala).
These figures cover a long period, with different governments, challenges and policy priorities. However, a number of key conclusions emerge on the way the numbers of pupils, teachers and schools move over time. First, the numbers of pupils and teachers tend to move together over time. However, there is some smoothing in teacher numbers, with smaller rises when pupil numbers are increasing, and smaller falls when pupil numbers are declining. This smoothing appears more evident for primary schools than for secondary schools.
Second, the change in teacher numbers looks very different across the most recent two periods when pupil numbers fell significantly. From 1973 to 1985, the number of primary school pupils in England fell by 25%. Over the same period, the number of teachers fell by the lower amount of 14%. When this trend progressed to secondary schools, secondary school pupil numbers fell by 26% between 1979 and 1991 and teacher numbers fell by 21%. This neatly illustrates the greater smoothing of teacher numbers in primary schools.
Between 1999 and 2009, primary school pupil numbers in England fell by 8%. However, teacher numbers actually rose by 3% as the then Labour government sought to reduce class sizes. We see a similar picture for secondary schools, with pupil numbers falling by 5% from 2004 to 2014 and teacher numbers increasing by 2%.
Third, recent increases in pupil numbers have not coincided with big increases in teacher numbers in England. For example, primary school pupil numbers grew by 17% between 2010 and 2020, whilst teacher numbers only grew by 10%. A similar picture emerges when this trend progressed to secondary schools, with a 15% rise in secondary school pupil numbers from 2015 to 2025, but only a 2% rise in teacher numbers. This suggests that some of the declines in school spending per pupil over the 2010s were delivered through larger class sizes. This may also limit the ability of schools to make savings as pupil numbers now fall again.
Lastly, the number of schools shows a different pattern, with a gradual and steady decline in the number of primary and secondary schools. Between 1947 and 2010, the number of primary and secondary schools fell by over 20%, with a 4,500 fall in the number of primary schools and 1,000 fewer secondary schools. With no net increase in pupil numbers, the average size of schools has increased over time. Since 2010, however, the number of primary and secondary schools has been remarkably steady. We return to this point when we consider changes in primary school pupil numbers since 2016 in more detail below.
Figure 8 shows the same figures for pupils, schools and teachers in Wales. This is very similar to the patterns for England. Primary school pupil and teacher numbers tend to move together, though not perfectly, with some smoothing in teacher numbers as pupil numbers fluctuate over time. Secondary school pupil and teacher numbers tend to move together more closely.
Figure 8. School, pupil and teacher numbers for Wales: 1947 to 2035, indexed to 1.0 in 2010

Source: StatsWales – Pupil Level Annual School Census (https://statswales.gov.wales/Catalogue/Education-and-Skills/Schools-and-Teachers/Schools-Census/Pupil-Level-Annual-School-Census), School Census 1974 to 2005 (https://statswales.gov.wales/Catalogue/Education-and-Skills/Schools-and-Teachers/Schools-Census/1974-to-2005), Schools and teachers pre-1974 (https://statswales.gov.wales/Catalogue/Education-and-Skills/Schools-and-Teachers/Pre-1974) and Pupil projections (https://statswales.gov.wales/Catalogue/Education-and-Skills/Schools-and-Teachers/Schools-Census/Pupil-Projections).
The main contrast with England is that the pupil population in Wales seems to be in long-run decline, reflecting the gradual decline in the child population we saw earlier. The number of primary school pupils is currently about 15% below the level in the 1950s, and due to fall further. The number of secondary school pupils is nearly 10% lower than in 2010 and is forecast to be similar in 2035 to that seen in the 1960s, despite rapid rises in participation in secondary education after ages 15 and 16.
The number of schools is also in long-run decline, more so than in England. The number of primary schools in Wales is currently about half the number seen in the 1950s, with the number declining by about 1,200 over the last 70 years. This reflects the gradual decline in the population, the closure of many small rural schools due to urbanisation, and the amalgamation of many separate infant and junior schools. The number of secondary schools initially expanded and then quickly contracted during the 1950s and 1960s, as separate secondary modern and grammar schools were created and then combined into comprehensive schools. However, since the mid 1970s, the number of secondary schools has gradually declined by about 20% up to present day. In contrast to England, these falls continued throughout the 2010s too.
Figure 9 presents trends for Scotland, though data are only available back to 1968. This shows some similarities with England and Wales, but also key differences. During the large drop in pupil numbers in the 1970s and 1980s, we see evidence of smoothing, with the falls in primary and secondary school teacher numbers lower than the falls in pupil numbers. During the 2000s, this pattern continued for secondary schools, with a smaller fall in teacher numbers than in pupil numbers.
Figure 9. School, pupil and teacher numbers for Scotland: 1968 to 2035, indexed to 1.0 in 2010
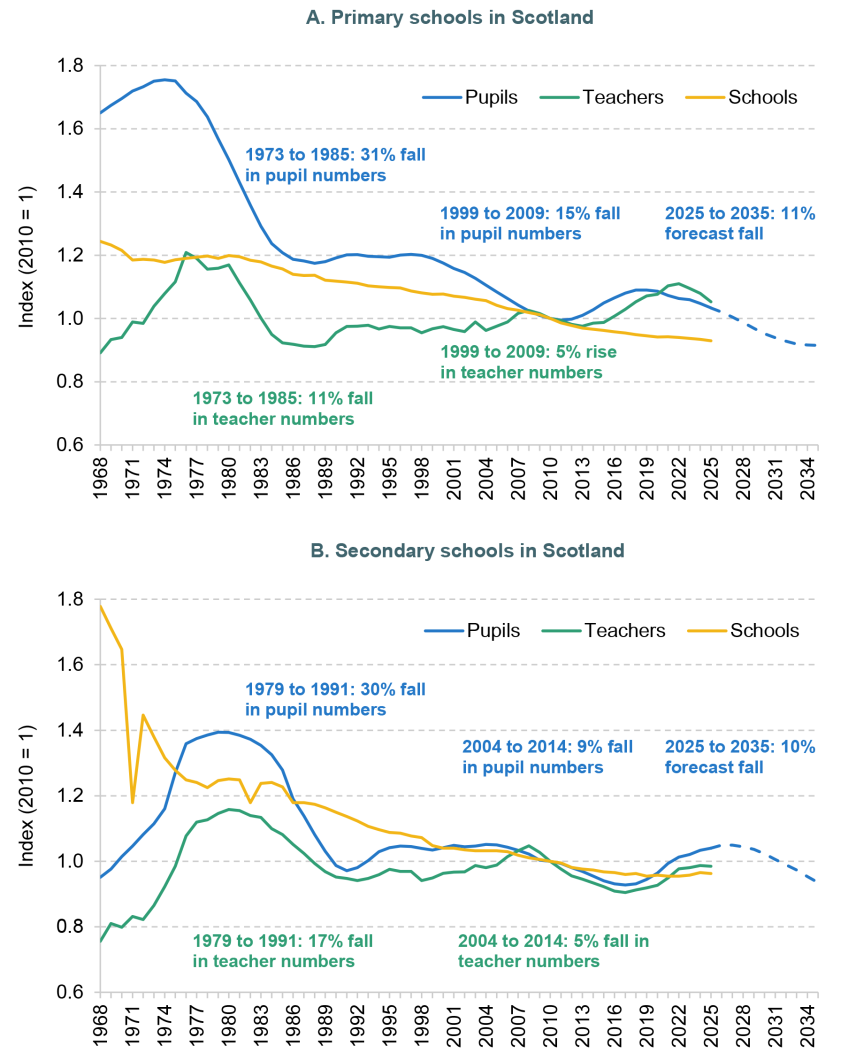
Source: Scottish Government, Summary statistics for schools in Scotland 2024 (https://www.gov.scot/publications/summary-statistics-for-schools-in-scotland-2024/) and School pupil, school and teacher historical time series (https://www.gov.scot/publications/school-statistics-historical-pupil-school-and-teacher-numbers/). Projections taken from Sibieta and Snape (2025).
However, when primary school pupil numbers fell by 15% during the 2000s, teacher numbers rose by 5%. Over the 2010s, teacher and pupil numbers both rose by about 8–9%. This partly reflects recent policy priorities to increase teacher numbers and reduce teachers’ class contact time. The long-run picture is a significant increase in teacher numbers relative to pupil numbers in primary schools in Scotland, which is likely to be a major explanation for why class sizes are lower in Scotland than in the rest of the UK (Sibieta and Snape, 2025).
Just as with Wales, we see a long-run decline in the number of schools, which continues through the periods of increases and decreases in pupil numbers. The number of primary and secondary schools in Scotland has declined by about 25% since the mid 1970s, and has continued to decline throughout the 2010s.
In summary, we generally see large and steady falls in the number of primary and secondary schools over time, though less so in England since 2010. Teacher and pupil numbers tend to move together as pupil numbers rise and fall, particularly in secondary schools. In the case of primary schools, there appears to be more smoothing in teacher numbers over time, and a policy focus on increasing the number of primary school teachers in order to reduce class sizes, particularly during the 2000s and in Scotland in more recent years.
Recent declines in primary school pupil numbers
In this section, we focus in more detail on recent declines in primary school pupil numbers. Figure 10 compares the change in the number of primary school pupils, schools, teachers and classes across the four nations of the UK between January 2016 and January 2025. We also show trends for London in particular, given this is where we observe the biggest falls in pupil numbers over recent years (see Figure 6 above).
Figure 10. Changes in primary school pupil, school, teacher and class numbers across the UK: January 2016 to January 2025

Source: Department for Education, Schools, pupils and their characteristics: 2025 (https://www.gov.uk/government/collections/statistics-school-and-pupil-numbers); StatsWales, Pupil Level Annual School Census: Schools by type, Pupils by local authority, Teachers by local authority and Classes by local authority; Scottish Government, Summary statistics for schools in Scotland 2024 (https://www.gov.scot/publications/summary-statistics-for-schools-in-scotland-2024/); Northern Ireland, Department of Education, Schools and pupils in Northern Ireland (https://www.education-ni.gov.uk/publications/school-enrolments-northern-ireland-summary-data) and Education workforce statistics 2024/25 (https://www.education-ni.gov.uk/articles/education-workforce).
For England as a whole, the changes were relatively small. However, if we focus on London, we observe a 9% reduction in primary school pupil numbers between 2016 and 2025. This coincided with an 11% drop in teacher numbers and a 4% drop in classes. The drop in the number of schools was only about 2%. The drop in pupil numbers thus appears to have been mostly accommodated through fewer teachers and fewer classes within existing schools, such as by reducing the number of forms of entry in primary schools. This matches analysis from NFER showing that declines in pupil numbers in London so far have mostly been delivered through reductions to the number of classes within schools and in teacher numbers (National Foundation for Educational Research, 2025), rather than the number of schools or class sizes.
NFER also finds evidence of larger falls in pupil numbers in maintained schools than in academies. This may reflect the complex process for setting pupil numbers in academies. There is also evidence of larger falls amongst schools with lower Ofsted ratings and smaller falls amongst those with higher ratings. This is likely to reflect parental demand, with greater choice available to parents when there is a smaller overall pupil population.
The picture for Wales is quite different. We observe a smaller drop in pupil numbers (4%) than in London. However, this appears to have resulted in fewer schools (7% drop) and fewer classes (4% drop), with only a small fall in the number of teachers. This is more consistent with the closure of smaller schools. Interestingly, the decrease in the number of primary schools in Wales (87) was significantly more than that across England (35). This is despite the fact that the absolute drop in the pupil population was about six times larger in England than in Wales (60,000 compared with about 10,000).
The pictures for Scotland and Northern Ireland are very different again. In Scotland, there appears to have been similar drops in the numbers of pupils, schools and classes (about 2–3%). However, the number of teachers has actually risen by 4%. This will reflect policy objectives to increase the number of teachers and reduce class contact time for existing teachers.
In Northern Ireland, the declines in pupil numbers have been relatively small in net terms since 2016. However, there has been a 6% decline in the number of schools and a small 2% net rise in the number of teachers. Data on the number of classes are not available for Northern Ireland.
Figures 11–13 go into further detail for England, Wales and Scotland by plotting the change in school and teacher numbers on the vertical axis against the change in the number of pupils on the horizontal axis. Each dot represents a local authority. The pictures that emerge for England, Wales and Scotland are very different.
If we focus on England (Figure 11), we see that there is a strong relationship between changes in teacher numbers and changes in pupil numbers. Indeed, the line of best fit suggests almost a one-for-one relationship between the two. However, there appears to be a very weak relationship, if any, between changes in pupil numbers and changes in school numbers. Local areas in England with the largest falls in pupil numbers do not appear to have seen significant reductions in school numbers.
Figure 11. Changes in primary school pupil, teacher and school numbers across local authorities in England: January 2016 to January 2025
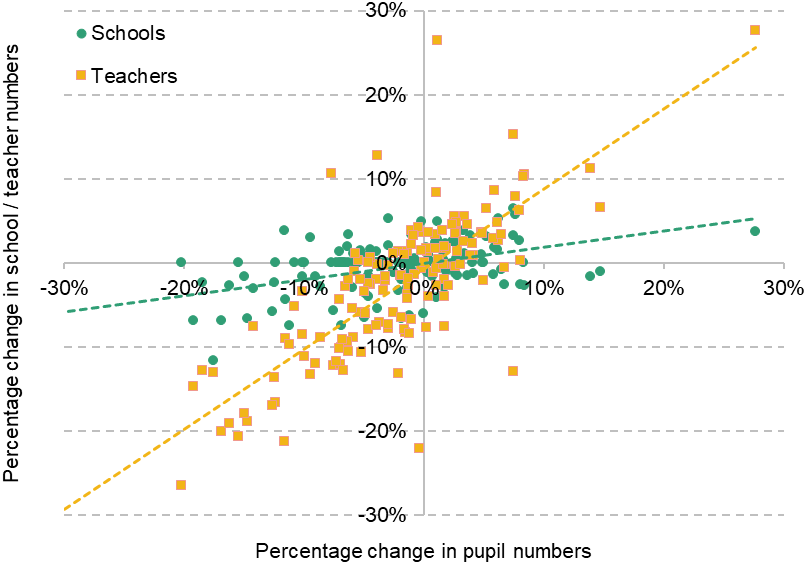
Note: Each square or circle represents a local authority in England.
Source: Department for Education, Schools, pupils and their characteristics: 2025 (https://www.gov.uk/government/collections/statistics-school-and-pupil-numbers).
Figure 12. Changes in primary school pupil, teacher and school numbers across local authorities in Wales: January 2016 to January 2025
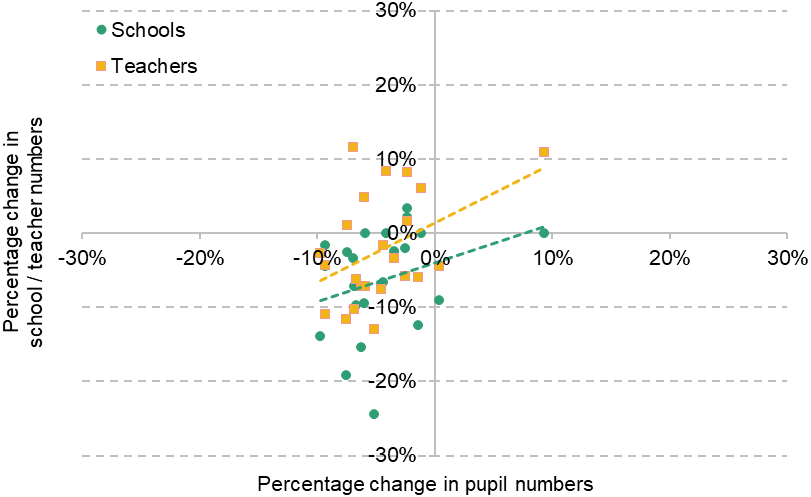
Note: Each square or circle represents a local authority in Wales.
Source: StatsWales, Pupil Level Annual School Census: Schools by type, Pupils by local authority, Teachers by local authority and Classes by local authority.
Figure 13. Changes in primary school pupil, teacher and school numbers across local authorities in Scotland: January 2016 to January 2025
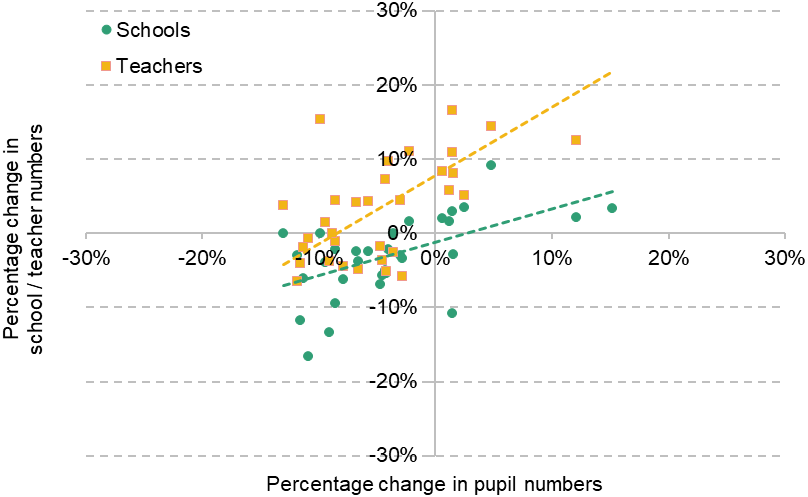
Note: Each square or circle represents a local authority in Scotland.
Source: Scottish Government, Summary statistics for schools in Scotland 2024 (https://www.gov.scot/publications/summary-statistics-for-schools-in-scotland-2024/).
For Wales and Scotland, there are fewer local authorities and less variation. However, we do see a clear relationship between changes in pupil numbers and changes in school numbers, as well as a clear relationship between changes in pupil numbers and changes in teacher numbers. Areas with the biggest falls in pupil numbers have generally seen bigger falls in school numbers in both Wales and Scotland. For Wales, there tend to be bigger falls in teacher numbers with larger falls in pupil numbers. For Scotland, there is also a clear relationship between pupil and teacher numbers. The exception is that most local authorities have seen an increase in teacher numbers, even if they have seen falls in pupil numbers.
Finally, Figures 14 and 15 show differences in key features of primary school systems across regions of England, Scotland and Wales, which may help determine the scope for further reductions in the number of schools and classes per school. Figure 14 shows average primary school size, whilst Figure 15 shows the average number of classes per school. Here, primary schools encompass full primary schools, as well as separate infant and junior schools. As such, differences across regions could reflect the extent to which schools are split into infant and junior schools.
Figure 14. Average primary school size across England (and its regions), Scotland and Wales, January 2016 and January 2025
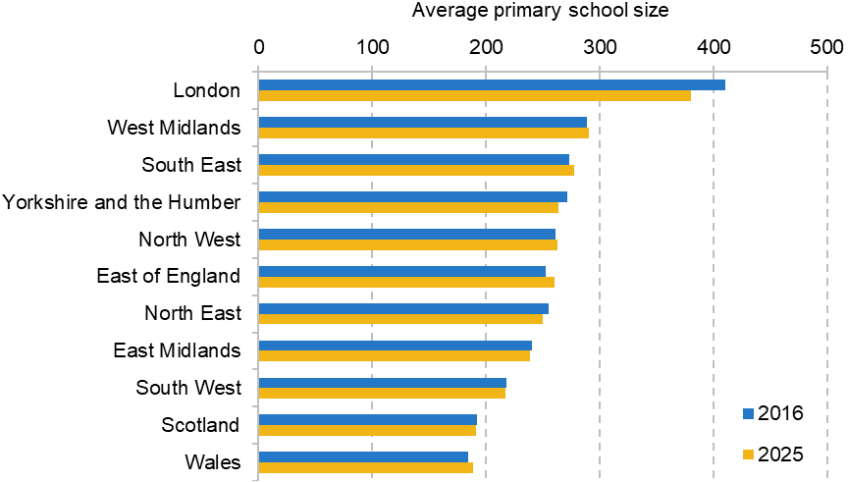
Source: Author’s calculations; Department for Education, Schools, pupils and their characteristics: 2025 (https://www.gov.uk/government/collections/statistics-school-and-pupil-numbers); StatsWales, Pupil Level Annual School Census: Schools by type, Pupils by local authority, Teachers by local authority and Classes by local authority. Scottish Government, Summary statistics for schools in Scotland 2024 (https://www.gov.scot/publications/summary-statistics-for-schools-in-scotland-2024/).
Figure 15. Average number of primary classes per school across England (and its regions), Scotland and Wales, January 2016 and January 2025
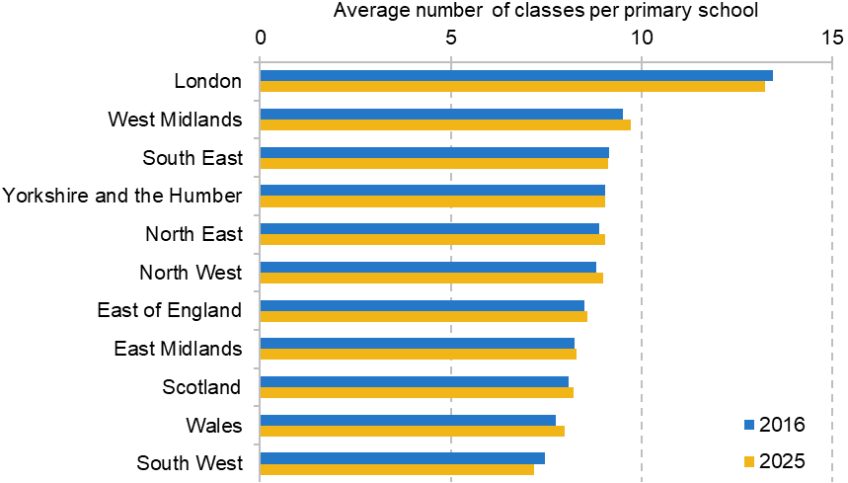
Source: Author’s calculations; Department for Education, Schools, pupils and their characteristics: 2025 (https://www.gov.uk/government/collections/statistics-school-and-pupil-numbers); StatsWales, Pupil Level Annual School Census: Schools by type, Pupils by local authority, Teachers by local authority and Classes by local authority. Scottish Government, Summary statistics for schools in Scotland 2024 (https://www.gov.scot/publications/summary-statistics-for-schools-in-scotland-2024/).
As can be seen, average primary school size is significantly higher in London at about 380 pupils per school in January 2025, though this is about 7% down from 410 in 2016. Across most of the rest of England, average primary school sizes are quite similar, varying from about 240 to 290 pupils per school. It is then notably lower in the South West at 220 pupils per school. It is even lower at about 190 pupils per school in Scotland and Wales. These differences are likely to reflect differences in population density and the greater number of small, rural schools in the South West of England, Wales and Scotland.
We see a similar picture for the number of classes per school, with around 13 classes per school in London down to about 7 classes per school in the South West of England. This is equivalent to the average primary school in London being close to two-form entry, and about one-form entry in the South West.
Looking at both figures suggests that there may be greater scope to reduce the number of classes per school in London in response to falling pupil numbers. There is less scope in the rest of England, and in Scotland and Wales, given that the average primary school is close to single-form entry.
In summary, policymakers across the UK seem to have responded differently to recent reductions in pupil numbers. In London, we see greater evidence of reductions in teacher numbers and the number of classes, with smaller reductions in school numbers to date. In contrast, we see bigger reductions in the number of schools in Wales, Scotland and Northern Ireland, with smaller reductions (and even increases) in teacher numbers. Indeed, when we look across local authorities, we see that changes in teacher and school numbers appear to be strongly correlated to falling pupil numbers in Scotland and Wales. In England, there is a strong correlation between changes in pupil and teacher numbers, but not school numbers.
In earlier analysis, we saw consistent and long-term falls in school numbers in England, Wales and Scotland up to about 2010, with the falls generally larger in Wales and Scotland. From 2010, these came to an end in England, but continued in Wales and Scotland. Some of this is to be expected given the rise in pupil numbers after 2010 in England, but there appears to have been little change even when primary school pupil numbers were falling after about 2019. This may reflect the more complex process for determining school places and closing schools in England, for academies in particular.
4. Discussion and policy implications
In the face of large expected falls in the number of children across the UK, policymakers and schools face some clear choices and trade-offs. They could choose to use this reduced demand for schooling as an opportunity to save money. This process would provide some savings to the exchequer caused by demographic change which could, at least very partially, offset the increases in demand for public services and spending that are caused by demographic change resulting from an older population. If they take this option, policymakers will also need to decide how to save money, such as whether to reduce the number of teachers, classes or schools. Alternatively, policymakers could choose to spread existing resources over a smaller population and thus increase the intensity of resources per child, such as by reducing class sizes. This would likely require an increase in per-pupil funding levels to make the system financially sustainable.
In essence, there is a ‘quantity–quality’ trade-off on education inputs. It has an interesting parallel with the ‘quantity–quality’ trade-off discussed in the fertility literature. This posits that parents have effectively chosen to have fewer children in order to increase investments per child, partly because of the importance of education investments for future life chances. Policymakers effectively face the same choice when making decisions on public spending on education. In reality, policymakers always face this choice, but reductions in pupil numbers and other pressures will likely make this trade-off more salient.
Actual choices will depend on policy priorities and fiscal pressures. Here we see that policymakers have made different choices in the past. During the large fall in pupil numbers in the 1970s and 1980s, teacher numbers fell significantly, with larger falls in secondary schools. In contrast, teacher numbers rose or held steady when pupil numbers fell over the 2000s.
It is almost certainly no coincidence that the fall in teacher numbers happened over a period of significant national economic and fiscal challenge in the UK during the late 1970s and early 1980s, whilst the rises in teacher numbers during the 2000s occurred during a period of significant increases in public spending. Indeed, if we look at the long-run picture for school spending per pupil in England (Drayton et al., 2025), we see that primary and secondary school spending per pupil were growing by less than 1% per year in real terms during the early 1980s, with a return to faster growth by the end of the 1980s. In contrast, during the 2000s, spending per pupil was growing by more than 5% per year in real terms.
The current and projected falls in pupil numbers are occurring during a period of major fiscal and economic challenges. At the 2025 Spending Review, the government set out public spending plans that would imply 1% per year real-terms growth in school spending per pupil (Sibieta, 2025), well below the historical average of around 2% per year since the 1970s (Drayton et al., 2025). As a result, one might anticipate that policymakers in central, devolved and local governments across the UK will be more focused on making savings, rather than increasing resources per child. However, this remains a choice facing policymakers.
We also see that policymakers have been making different choices across the UK. In Scotland, there has been a focus on increasing teacher numbers in primary schools, even as pupil numbers have been falling. We also see less evidence of school closures in England after primary school pupil numbers started falling from 2019, with more school closures in the rest of the UK.
We have not discussed funding or finances in detail because our focus has been on actual inputs into delivering education in state-funded schools, such as numbers of teachers, classes and schools, and how policymakers and schools have navigated these choices. However, all school systems across the UK are predominantly based on pupil-led funding. This means that reduced pupil numbers will, by default, equate to reduced total funding. In this context, schools will face hard choices on how to deliver savings within their budgets. Policymakers will also need to make tough decisions on which schools are financially sustainable given tight overall budgets. National policymakers could choose to increase per pupil funding levels more than planned in order to maintain resources, but this is challenging within the very tight set of public finances.
Most importantly, such resource decisions should represent deliberate long-term choices based on high-quality data and evidence, and undertaken as part of a coherent process to maximise educational outcomes, given overall budgets. Decisions on funding should then follow on from those long-term resource plans.
There is a good body of evidence on the impact of class sizes. This generally finds modest effects, though there tend to be larger effects for pupils from disadvantaged backgrounds (Britton and Vignoles, 2021). However, policymakers need better data on likely changes in pupil numbers. Population forecasts at the national level have been consistently wrong in the same direction, underestimating the falls in fertility. More focus is also needed to produce reliable forecasts for local areas, given the differences in actual changes to date.
A further important evidence gap is the impact of school closures. There is currently little evidence on the impact of closing schools on educational outcomes and wider communities. Closing schools could improve educational attainment if this provides more educational opportunities than could be provided in small schools. It could reduce attainment if smaller class sizes at small schools were able to boost attainment. We also know little about what factors could mitigate such impacts, such as the quality of transport links and other public services. More research is needed on the impact of closing schools.
A coherent process is also needed for making decisions on school closures and school places planning. The current system in England is highly complicated, given the fragmentation of responsibilities across councils, academy trusts and the Department for Education. The system is more coherent in the rest of the UK, with councils taking the main responsibilities in Wales and Scotland, and central government taking most of the responsibility in Northern Ireland. Given the overall size of England, it would be challenging for these decisions to be made centrally. It would be more natural for such decisions and responsibilities to reside with councils, as is the case in Wales and Scotland. The current Children’s Wellbeing and Schools Bill going through the UK parliament will give councils more powers to set admissions numbers at all state-funded schools in their area, which seems likely to improve the process. However, this could leave councils with a conflict of interest to favour maintained schools rather than academies. It is important that decisions on school places and closures are made with respect to the best ways to maximise educational outcomes, rather than specific types of school. It may therefore be necessary to carefully regulate the process and evidence used by councils to make these decisions.
Decisions on school closures and place planning will clearly need to reflect available budgets, as well as ways to maximise educational outcomes over the long run. It may therefore be important for councils to respond to changes in parental demand for schools. If schools become too small to offer a high-quality education, dwindling pupil numbers may make it necessary and desirable to close such schools. Furthermore, falling pupil numbers will give more choice to parents and we already see evidence of smaller falls in pupil numbers at highly rated schools in England (National Foundation for Educational Research, 2025). It may therefore become necessary to focus provision in schools with high levels of parental demand and where there is clear evidence of high-quality provision.
References
Aitken, R. J., 2024. Population decline: where demography, social science, and biology intersect. Reproduction, 168(1), e240070, https://doi.org/10.1530/REP-24-0070.
Beaujouan, E., Zeman, K. and Nathan, M., 2023. Delayed first births and completed fertility across the 1940–1969 birth cohorts. Demographic Research, 48, 387–420, https://doi.org/10.4054/DemRes.2023.48.15.
Becker, G. S., 1960. An economic analysis of fertility. In Universities–National Bureau Committee for Economic Research, Demographic and Economic Change in Developed Countries, Columbia University Press. https://www.nber.org/system/files/chapters/c2387/c2387.pdf.
Bloom, D. E., Kuhn, M. and Prettner, K., 2024. Fertility in highincome countries: trends, patterns, determinants, and consequences. Annual Review of Economics, 16, 159–84, https://doi.org/10.1146/annurev-economics-081523-013750.
Britton, J. and Vignoles, A., 2017. Education production functions. In G. Johnes, J. Johnes, T. Agasisti and L. López-Torres (eds), Handbook of Contemporary Education Economics, Edward Elgar Publishing.
Doepke, M., Hannusch, A., Kindermann, F. and Tertilt, M., 2023. The economics of fertility: a new era. In S. Lundberg and A. Voena (eds), Handbook of the Economics of the Family, https://doi.org/10.1016/bs.hefam.2023.01.003.
Drayton, E., Farquharson, C., Ogden, K., Sibieta, L. and Snape, D., 2025. Annual report on education spending in England: 2024–25. Institute for Fiscal Studies, report, https://ifs.org.uk/publications/annual-report-education-spending-england-2024-25.
Hotz, V. J., Klerman, J. A. and Willis, R. J., 1997. The economics of fertility in developed countries. In M. R. Rosenzweig and O. Stark (eds), Handbook of Population and Family Economics, vol. 1, part A, Elsevier. https://doi.org/10.1016/S1574-003X(97)80024-4.
Jones, L. E. and Schoonbroodt, A., 2011. Fertility theories: can they explain the negative fertility–income relationship? In J. B. Shoven (ed.), Demography and the Economy, Chicago Scholarship Online, University of Chicago Press. https://doi.org/10.7208/chicago/9780226754758.003.0003.
Kearney, M. S. and Levine, P. B., 2025. Why is fertility so low in high income countries? National Bureau of Economic Research, Working Paper 33989, https://doi.org/10.3386/w33989.
London Councils, 2025. Managing school places and admissions in London – report. https://www.londoncouncils.gov.uk/news-and-press-releases/2025/managing-school-places-and-admissions-london-report.
National Foundation for Educational Research, 2025. Pupil numbers and school finances: what do we know about how demographic change is impacting on schools? NFER blog, 23 October, https://www.nfer.ac.uk/blogs/pupil-numbers-and-school-finances-what-do-we-know-about-how-demographic-change-is-impacting-on-schools.
Office for Budget Responsibility, 2025. Fiscal risks and sustainability – July 2025. https://obr.uk/frs/fiscal-risks-and-sustainability-july-2025/.
Sibieta, L., 2025. What the Spending Review really means for schools. Schools Week, 12 June, https://schoolsweek.co.uk/what-the-spending-review-really-means-for-schools/.
Sibieta, L. and Snape, D., 2025. Scottish school spending, teachers and pupil numbers. Institute for Fiscal Studies, report, https://ifs.org.uk/publications/scottish-school-spending-teachers-and-pupil-numbers.
Acknowledgements
The author gratefully acknowledges the support of the Nuffield Foundation (grant number EDO /FR-000024394) and the Economic and Social Research Council via the ESRC Centre for the Microeconomic Analysis of Public Policy (grant number ES/Z504634/1). The Nuffield Foundation is an independent charitable trust with a mission to advance social well-being. It funds and undertakes rigorous research, encourages innovation and supports the use of sound evidence to inform social and economic policy, and improve people’s lives. The Nuffield Foundation is the founder and co-funder of the Nuffield Council on Bioethics, the Ada Lovelace Institute and the Nuffield Family Justice Observatory. This project has been funded by the Nuffield Foundation, but the views expressed are those of the authors and not necessarily the Foundation. Find out more at www.nuffieldfoundation.org.
The author would like to thank Jonathan Cribb, Christine Farquharson, Ruth Maisey, Helen Miller, Kate Ogden, Darcey Snape and Imran Tahir for their assistance and feedback. The author would also like to thank participants at a round table held at the Nuffield Foundation in July 2025 on the topic of demographic change and education funding for their insightful comments and thoughts.
Endnotes
Authors

Luke Sibieta
Luke is a Research Fellow at the IFS and his general research interests include education policy, political economy and poverty and inequality.
More from IFS
Understand this issue


Policy analysis


Academic research


