
Downloads
Download the report as PDF
PDF | 551.59 KB
At just under £8 billion, spending on schools and childcare is the second-largest area of public service spending in Scotland, behind spending on health. While councils rather than the Scottish Government itself determine how much to spend on schools, they do so in the context of a funding and policy environment shaped by the Scottish Budget.
Policymakers in Scotland face a number of major challenges. As a result of demographic change, the number of pupils is declining over the long run, which might make some schools uneconomical in the future. These trends appear even more challenging in rural and island areas. Recently, the Scottish Government has been seeking to maintain teacher numbers. In the long run, however, it might become increasingly expensive, and even unsustainable, to maintain teacher and school numbers as they are. Scotland’s performance on international PISA tests has also been in decline, particularly in maths and science, and this has been ascribed to the introduction of the Curriculum for Excellence from 2010 onwards (Paterson, 2023).
With this context in mind, this chapter starts in Section 4.1 by describing trends in spending and spending per pupil, including comparisons with England. It then details trends in teacher and pupil numbers in Section 4.2. Section 4.3 describes the overall challenges and trade-offs facing policymakers in Scotland over the next few years, including for this and future Budget cycles. Section 4.4 provides a brief conclusion.
Key findings
- Total spending on schools and early years education in Scotland increased by £1.7 billion or 27% in real terms between 2015–16 and 2023–24. Current plans for 2024–25 imply an effective real-terms freeze in total spending of just over £7.8 billion.
- Spending per pupil in Scotland is about £10,100 in 2024–25, which is about 20% higher than the £8,400 per pupil level seen in England. This gap has widened from a difference of about 4% in 2009–10. Partly as a result of this higher spending, class sizes tend to be smaller in Scotland, with a pupil–teacher ratio of about 13 in 2024 compared with 17–19 in the rest of the UK.
- Whilst spending per pupil has risen much faster in Scotland (21%) than in England (5%) since 2009–10, the real-terms growth in total schools and early years spending has been remarkably similar at 20–21%. All of the faster growth in spending per pupil in Scotland reflects slower growth in pupil numbers (1%) compared with England (13%).
- The Scottish Government has set out the goal of increasing teacher numbers by 3,500 to 57,100 by the end of this parliament. In reality, teacher numbers have fallen very slightly and the Scottish Government is currently 3,700 short of this goal. More recently, it has instead emphasised the importance of restoring teacher numbers to 2023 levels after they fell further in 2024.
- Pupil numbers have fallen in recent years and are projected to fall by a further 12.5% from 2024 to 2040. As a result, pupil–teacher ratios have remained stable despite recent cuts to teacher numbers. If policymakers chose to freeze teacher numbers over the long run, then the pupil–teacher ratio in mainstream schools would fall from 14 to 12 by 2040, lower than at any point in recent history.
- Alternatively, the fall in pupil numbers could offer councils a chance to make savings. If policymakers chose to freeze pupil–teacher ratios at 2024 levels, then teacher numbers could drop by 1,000, which would generate in-year savings of about
£65–120 million by 2027. Cutting teacher numbers can be challenging in practical terms, however, as it requires reducing the number of classes or schools.
4.1 Schools spending
Spending on schools in Scotland is predominantly the responsibility of local councils. Indeed, it is the largest single area of council spending, comprising nearly half of net revenue expenditure by councils in Scotland. Councils also have a large amount of control over both the level and allocation of education budgets, with about one-third of expenditure centrally managed by councils and two-thirds devolved to individual schools. This contrasts with England, where over 90% of funding is devolved to schools, and Wales, where about 84% is devolved to schools (Jerrim and Sibieta, 2021).
Total spending
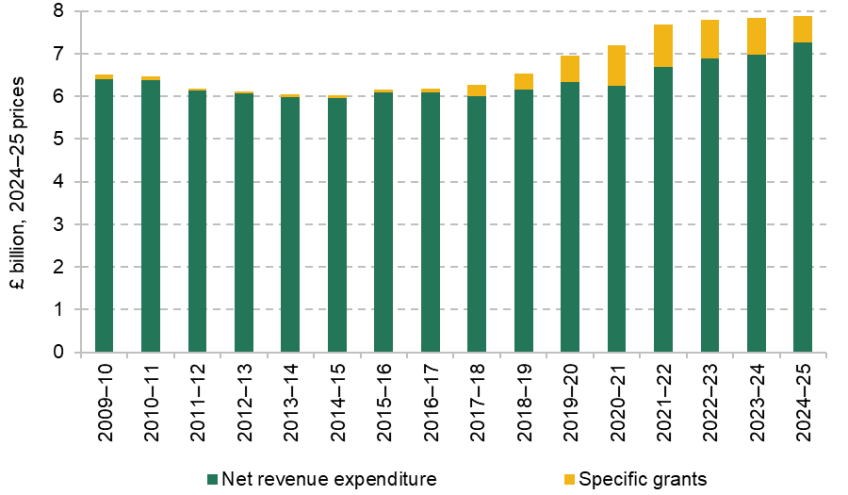
Figure 4.1 shows total school spending in Scotland between 2009–10 and 2024–25, including early learning and childcare to ensure consistency over time. Data for 2024–25 relate to planned spending, which could be changed before the end of the year. Spending is broken down into general spending by councils (net revenue expenditure) and specific grants. Between 2009–10 and 2015–16, total spending fell by 6% in real terms or by about £360 million. Over this period, specific grants represented a tiny share of total spending (about 1%).
Figure 4.1. Total spending on schools in Scotland (2024–25 planned)
Source: Total school spending for Scotland is based on net revenue spending on early learning and childcare, schools and all education-related specific grants from central government (specific grant figures relate to schools in 2009–10 and 2010–11, but also include the relatively small number of non-schools education specific grants from 2011–12 onwards). These figures were kindly supplied by the Scottish Government on a consistent basis from the underlying data for the Scottish ‘Local government finance statistics’ for 2009–10 to 2019–20. Figures for net revenue expenditure on schools and education specific grants for later years were taken from ‘Scottish local government finance statistics’ for 2020–21, 2021–22, 2022–23 and 2023–24. Net revenue expenditure on schools in 2024–25 is taken from ‘Local government 2023-24 provisional outturn and 2024-25 budget estimates’. Ring-fenced specific grants for 2024–25 are based on ‘Local government finance circular no. 2/2024: settlement for 2024–2025’. We calculate school-related reconciliation revenue grants for 2024–25 from ‘Local government finance circular 10/2024: settlement for 2025 to 2026’. We also assume a cash-terms freeze in other central government grants for 2024–25. HM Treasury GDP deflators, January 2025.
Between 2015–16 and 2023–24, spending grew by 27% in real terms or by £1.7 billion. Most of this growth occurred between 2017–18 and 2021–22, during which time spending grew by 22% in real terms. A large part of this growth reflects large increases in teacher pay, with 7% increases in teacher salaries agreed in 2019, 2022 and 2023. Specific grants also grew substantially, from about £60 million in 2015–16 up to over £850 million in 2023–24. This included about £530 million for the expansion of early learning and childcare, with all 3- and 4-year-olds (and eligible 2-year-olds) now entitled to the equivalent of 30 hours a week free early learning and childcare during term time. (This only applies for working parents in England and Wales. Provision in England also now extends to parents of younger children.) This spending has now been rolled into net revenue expenditure. Specific grants also include £130 million for Pupil Equity Funding, which is a specific grant aimed at improving attainment amongst pupils from poorer backgrounds (much like the Pupil Premium in England).
Plans for 2024–25 imply a real-terms increase of just over 0.5%. These spending plans could be topped up before the end of the year. Notably, they include £145.5 million in funding for councils to maintain teacher numbers, which was initially the subject of a stand-off between the Scottish Government and councils, but which has now been agreed.1 We discuss commitments and trends in teacher numbers in more detail in Section 4.2. Spending plans for 2024–25 notably also include £86 million to cover the cost of higher employer teacher pension contributions. Without this funding, there would be a small real-terms fall in planned spending.
Per-pupil spending
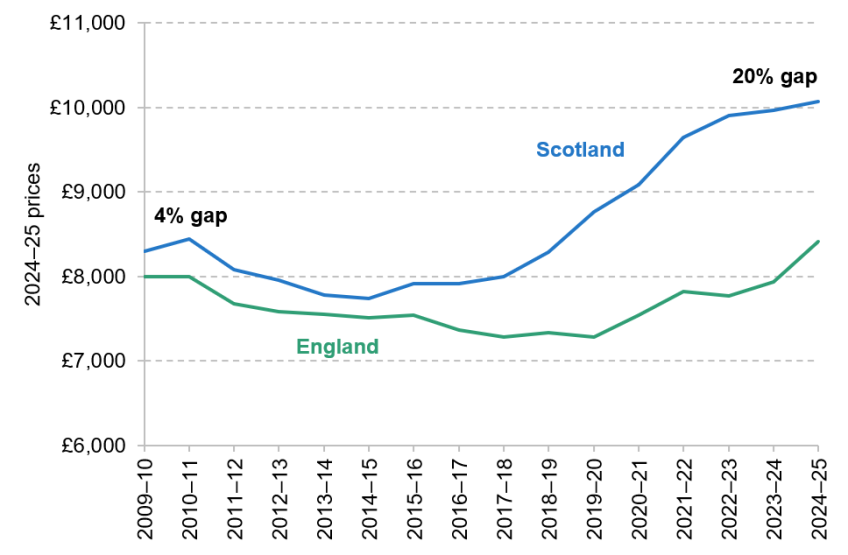
Figure 4.2 compares the level of spending per pupil in Scotland with that seen in England. To ensure comparability and consistency, we take a comprehensive measure of spending on schools and the early years, which includes COVID-related spending, grants to cover higher employer pension contributions and sixth form funding. Between 2009–10 and 2015–16, there were similar cuts in spending per pupil across both nations, with a real-terms fall of 5% in Scotland and a 6% fall in England.
Figure 4.2. Schools and early years spending per pupil for Scotland and England (2024–25 planned)
Source: Spending on schools in Scotland taken from Figure 4.1. Full-time-equivalent pupil numbers in Scotland calculated as the sum of pupils in state-funded schools and early education centres (https://www.gov.scot/collections/school-education-statistics/). Spending per pupil in England is taken from Drayton et al. (2025). For consistency with figures for Scotland, we include grants to cover higher employer contributions to teachers’ pensions in England and COVID-related grants for 2020, 2021 and 2022. COVID-related spending for England is taken from ‘Department for Education consolidated annual report and accounts 2021 to 2022’ and ‘School funding statistics’ for 2022–23. HM Treasury GDP deflators, January 2025.
After 2015–16, spending per pupil in Scotland began to increase, with a particularly large real-terms increase of 25% between 2015–16 and 2022–23. Since then, spending plans imply a smaller real-terms rise of about 2% in total between 2022–23 and 2024–25. In England, by contrast, spending per pupil continued to fall in real terms up to 2019–20. This has been followed by a 16% real-terms rise in spending per pupil between 2019–20 and 2024–25.
Considering the full 15-year period, we observe a 21% real-terms rise in spending per pupil in Scotland and a 5% rise in England between 2009–10 and 2024–25. As a result, the gap in spending per pupil between Scotland and England has grown significantly. In 2009–10, spending per pupil in Scotland was around £8,300 in today’s prices, which is about 4% higher than the £8,000 seen in England at the time. By 2024–25, spending per pupil is expected to be £10,100 in Scotland, approximately 20% higher than in England (£8,400 per pupil).
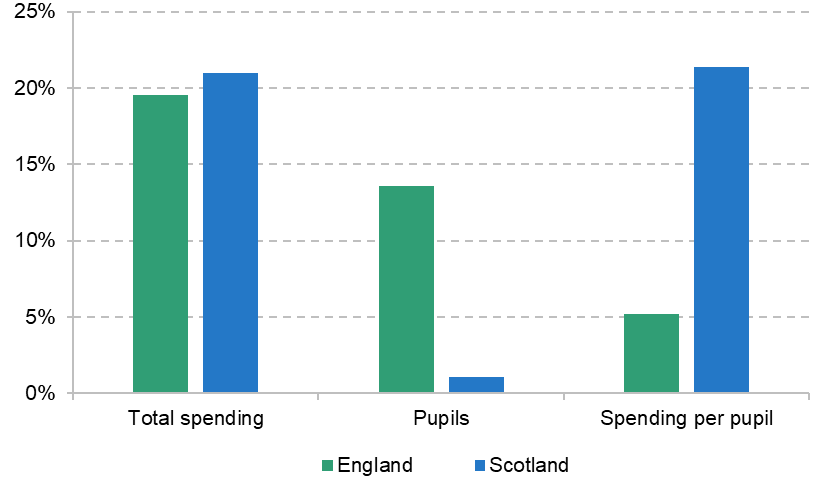
Interestingly, this differing picture on spending per pupil all seems to be driven by contrasting trends in pupil numbers. As shown in Figure 4.3, total spending on schools has grown by similar amounts between 2009–10 and 2024–25, with real-terms growth of 20% in England and 21% in Scotland. However, pupil numbers grew by more than 13% in England, whilst they only rose by 1% in Scotland. As a result, we see much faster growth in spending per pupil in Scotland than in England.
Figure 4.3. Changes in total spending, pupil numbers and spending per pupil for England and Scotland between 2009–10 and 2024–25
Source: See Figures 4.1 and 4.2.
4.2 Teacher and pupil numbers
Pupil–teacher ratios remain stable
In recent years, councils have maintained teacher numbers roughly in line with pupil numbers, which has included small cuts in teacher numbers since 2021 (see Figure 4.4). As a result, pupil–teacher ratios (PTRs) have remained relatively stable over time, ranging between 12.9 in 2008 to 13.7 in 2015, and sitting at 13.3 in 2024 (15.5 in primary schools and 12.6 in secondaries).
Figure 4.4. Teacher and pupil numbers by mainstream school type, 2017 = 100

Source: Pupil and teacher numbers for 2006 to 2018 come from School pupil, school and teacher historical time series. Pupil numbers up to 2023 come from School level summary statistics and for 2024 from Pupil census supplementary statistics. Teacher numbers up to 2024 come from Teacher census supplementary statistics.
As shown in Figure 4.4, we saw contrasting trends in primary and secondary numbers up to about 2016/2017. For primary schools, there were similar increases in teacher and pupil numbers. For secondary schools, we see declines in pupil and teacher numbers, again each of a similar magnitude.
From 2017 onwards, the pattern is more complicated. For secondary schools, we see a 12% increase in pupil numbers, which is not quite matched by an 8% increase in teacher numbers. For primary schools between 2017 and 2021, there was a significant spike in teacher numbers despite falling pupil rolls – a gap that has not (yet) been closed. As a result, PTRs have fallen in primary schools since 2017, whilst they have increased slightly in secondary schools.
Naturally, PTRs vary across councils, with island areas seeing PTRs as low as 9.8 and more urban areas having PTRs of up to 15. Notably, all of these ratios are significantly lower than in the other UK nations, where they range between 17.4 and 18.6. This gap has existed between Scotland and other nations since at least the 1990s (Jerrim and Sibieta, 2021).
The 2021 SNP manifesto promised to recruit 3,500 additional teachers by the end of the parliamentary term (May 2026 at the latest) in order to bring total numbers to 57,100 and reduce class contact hours for teachers from 22.5 to 21 hours per week. However, the most recent figures for 2024 show total teacher numbers to be almost 3,700 short of the initial goal. More recently, the Scottish Government appears less focused on these initial aims and has instead set out joint plans with councils to bring teacher numbers back up to 2023 levels by the end of this year (Learning Directorate, 2024). Further increases would be required in order to meet the reduction in class contact time target (WPI Economics, 2024).
Since 2022–23, these plans have been backed by an annual grant to councils of £145.5 million, increased to £186.5 million for 2025–26, and theoretically ring-fenced for protecting teacher numbers. Despite this, many councils have still opted to cut teacher numbers to make savings on local government spending (and grant funding was not withdrawn from these councils despite threats to the contrary). These cuts, as well as the failure to reduce class contact hours, have prompted some threats of strike action.2 There are also some worrying signs of the impact of this government and council misalignment on newly-qualified teachers in Scotland. From 2016–17 to 2023–24, the share of newly-qualified (in their first year post-probation) primary school teachers who had permanent contracts in state schools has fallen from a recorded high of 57.6% to 12.8%, and the share with either permanent or temporary contracts has fallen from 88.4% to 54.7%.3
Pupil numbers are falling
Scotland faces a future of declining pupil numbers: the number of pupils is likely to have peaked in 2017 for primary schools, and is projected to peak within the next two years for secondary schools (WPI Economics, 2024).4 Indeed, this has been a key motivating factor behind decisions to cut teacher numbers. Population projections suggest that these declines are expected to continue over the next 15 years (Figure 4.5), with pupil numbers in mainstream schools projected to be 12.5% lower in 2040 than in 2024, largely due to lower birth rates. Additionally, these changes are not spread evenly (see Figure 4.6). Typically, more remote and rural areas are forecast to see the greatest proportional falls. These falls have occurred since government plans were formulated to increase teacher numbers, and are also projected to steadily continue.
Figure 4.5. Actual and forecast pupil numbers by school type
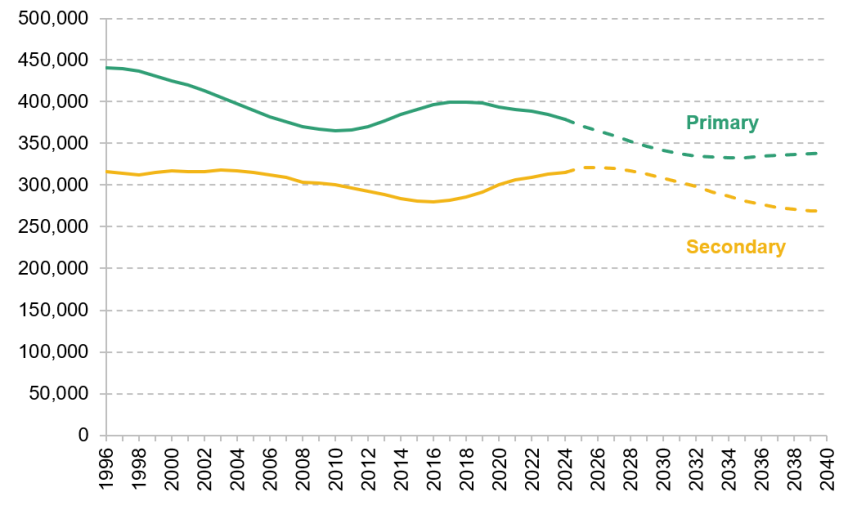
Source: Pupil numbers up to 2023 are taken from School level summary statistics and for 2024 from Summary statistics for schools in Scotland 2024. National-level projections are constructed using Principal projection - Scotland summary, where we estimate the number of 4.5-year-olds in 2022 to correspond to the number of children eligible to be P1 pupils in the 2023 school census. Participation rates for each year group are constructed based on this and used to scale the estimated population by age group that would be enrolled in that school year.
Figure 4.6. Absolute and percentage change in primary school pupils by council, 2020–24 and 2024–27 (projected)
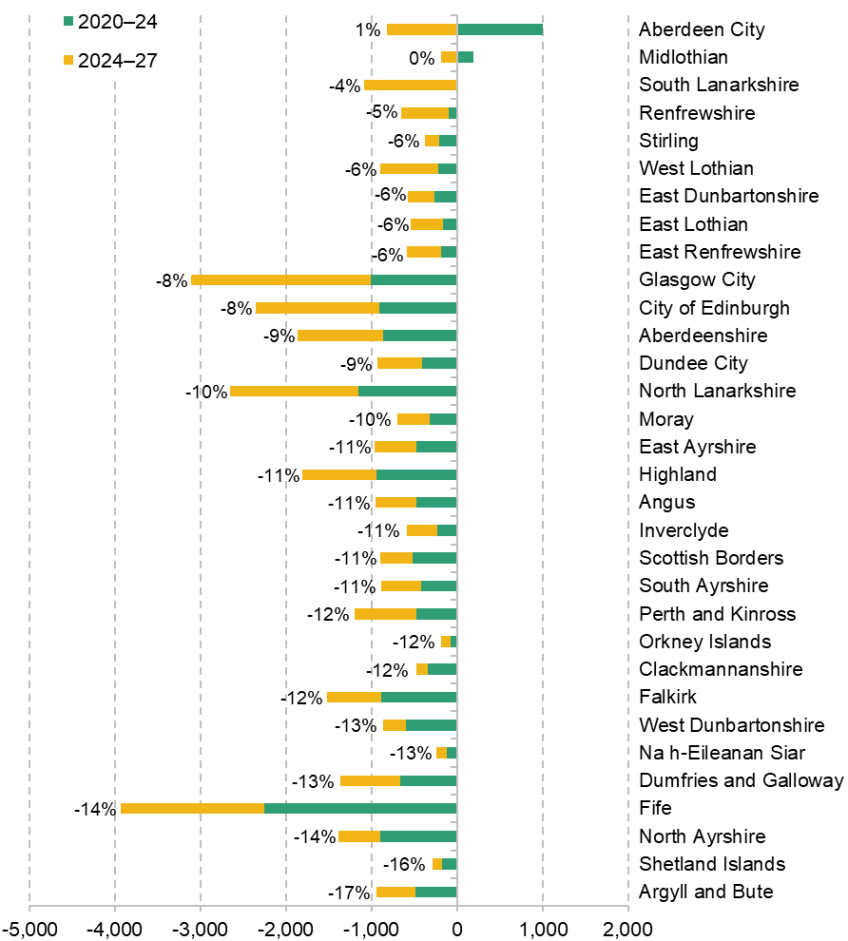
Source: 2020–2024 pupil figures sourced as in Figure 4.5. Council-level projections are constructed using year-on-year growth rates from 2024 to 2027 for each council in Pupil projections - 2018 2020, applied to true pupil levels in 2024 to estimate up to 2027.
4.3 Future challenges and choices
The next few years will see a number of challenges and choices for the Scottish Government and Scottish councils on school funding and policy.
On the funding side, the Scottish Government’s Budget for 2025–26 suggested a 4.3% real-terms increase in day-to-day funding for councils compared with the current financial year. However, this comparison omitted in-year top-ups to council funding in 2024–25 that amount to £238 million to help meet the cost of pay deals, pension costs and a council tax freeze. It also omits an additional £147 million in funding (including £144 million to help cover the costs of higher employer National Insurance contributions (NICs) bills) for 2025–26 announced since the Budget. But councils have estimated the increase in employer NICs will cost closer to £265 million for their own directly employed staff, with a further £93 million for social care and childcare providers.5 Taking this altogether suggests an underlying real-terms increase in funding of closer to 3.5% before subtracting the estimated cost of meeting higher employer NICs bills and 1.0% after. With social care spending likely to need to rise faster than this, councils may be seeking ways to hold down increases in other areas of spending, including schools.
The latter half of the 2020s is likely to involve yet more fiscal headaches, as set out in pre-Scottish-Budget analysis from IFS (Boileau and Phillips, 2024) – which will be updated shortly. Real-terms increases in funding for councils of even 1% a year may be difficult to deliver given expectations for overall funding levels and upwards pressures on the largest component of Scottish Government spending – funding for the Scottish NHS. In this context, maximising value for money in the schools budget will become increasingly important.
Choices on pupil–teacher ratios
In a period when pupil numbers are declining, freezing the current pupil–teacher ratios and thus allowing councils to cut teacher numbers could provide one opportunity to make savings on school spending. However, policymakers will need to consider the practical, educational and financial consequences when making these decisions.
From a practical perspective, it can be difficult to cut teacher or staff numbers in the short run as there is a need to maintain provision levels. In the medium term, teacher numbers can be decreased by reducing the number of classes and/or by reducing the number of schools. Of course, there may be difficulties associated with this – as shown, some of the largest proportional falls in pupil numbers are projected to be in remote and rural areas where it may be more difficult to consolidate pupils across classes or schools by more than is already done. There may be more scope in urban areas, which are generally forecast to see the largest absolute falls in pupil numbers. Furthermore, as we saw earlier, secondary school teacher numbers did fall as secondary pupil numbers fell up to the mid 2010s. However, we have seen less evidence of falling primary school teacher numbers as primary school pupil numbers have fallen in more recent years, suggesting it may be less appealing to amalgamate primary school classes or close schools.
Clearly, it is crucial to consider the educational consequences of resource choices too. Here, we see evidence that lowering PTRs can improve outcomes, but is not generally the most cost-effective way of improving educational outcomes (Filges, Sonne-Schmidt and Nielsen, 2018; Britton and Sibieta, 2024). However, this should be considered amid some evidence of high teacher workload (Hulme et al., 2024), under-recruitment of teachers in shortage subjects such as maths and science,6 and rising pupil needs, which we discuss later.
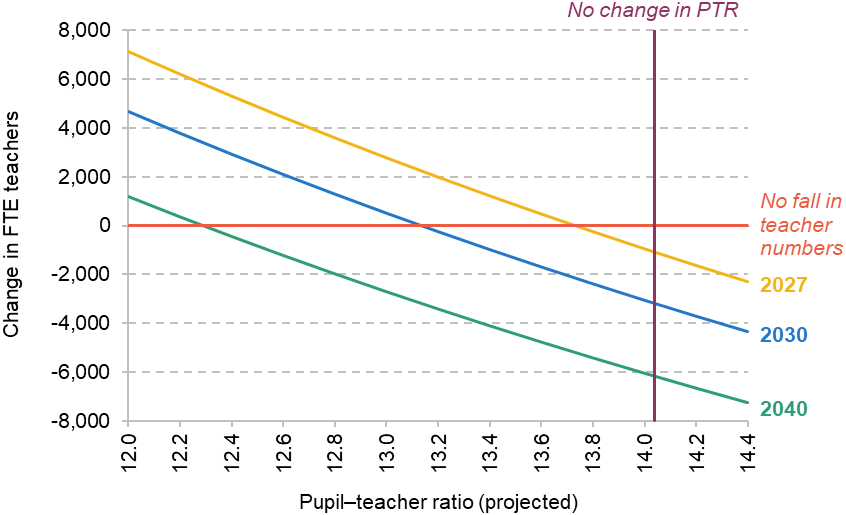
Figure 4.7 shows the projected trade-off between teacher numbers and PTRs that Scotland faces over the next 15 years. In particular, it shows the change in teacher numbers relative to 2024 and the PTR for three selected years (2027, 2030 and 2040) based on projected pupil numbers. If PTRs were frozen for mainstream schools at 2024 levels (about 14 pupils per teacher7) then primary and secondary school teacher numbers could fall by more than 1,000 over the next three years. Based on current employee spending, this could generate in-year savings of
£65–120 million for 2027.8 Alternatively, if teacher numbers were maintained at 2023 levels over this period (as is the current target), PTRs in mainstream schools could fall from 13.9 in 2023 to 13.5.
Figure 4.7. Projected PTRs given change in teacher numbers from 2024: 2027, 2030 and 2040 based on projected pupil numbers
Note: FTE = full-time equivalent.
These numbers become starker further in the future. Under our pupil projections, mainstream teacher numbers could be cut by 6,200 or 12.5% by 2040 to maintain 2024 PTRs, whereas maintaining teacher numbers at 2023 levels would see the PTR for mainstream schools fall to 12.1. The financial consequences are naturally much larger too. A 12.5% reduction in 2024 employee expenditure would produce in-year savings of about £500 million by 2040, though this is naturally subject to high levels of uncertainty. The big question is whether it is worth £500 million to not cut teacher numbers and to reduce class sizes, or whether it would be better to release some of that funding to spend on other priorities (within or outside schools).
In the short run, one can naturally see the attractions of maintaining teacher numbers, with relatively small costs to avoid practical difficulties. However, the long-run picture is a consistent decline in pupil numbers over the next 15 years. A decision not to cut teacher numbers over a series of short runs could dramatically change the nature of schooling in Scotland. Policymakers should confront these long-run trade-offs.
Broader challenges
An additional factor shaping the trade-offs in school spending is the rise in pupils with additional support needs (ASN). Scotland has seen a more than fourfold increase in pupils classed as having ASN since 2010, with more than 40% of all pupils having ASN in 2024. This has mainly been driven by increases in pupils with social, emotional and behavioural difficulties or having English as an additional language (Figure 4.8). We also see a more than fourfold increase in the number of pupils with autistic spectrum disorder, from 6,500 in 2010 to more than 30,000 in 2023. A similar trend among pupils with special educational needs has also been seen in England (Sibieta and Snape, 2024), although the definition of ASN in Scotland encompasses a broader range of needs.
Figure 4.8. Number of pupils with selected additional support needs
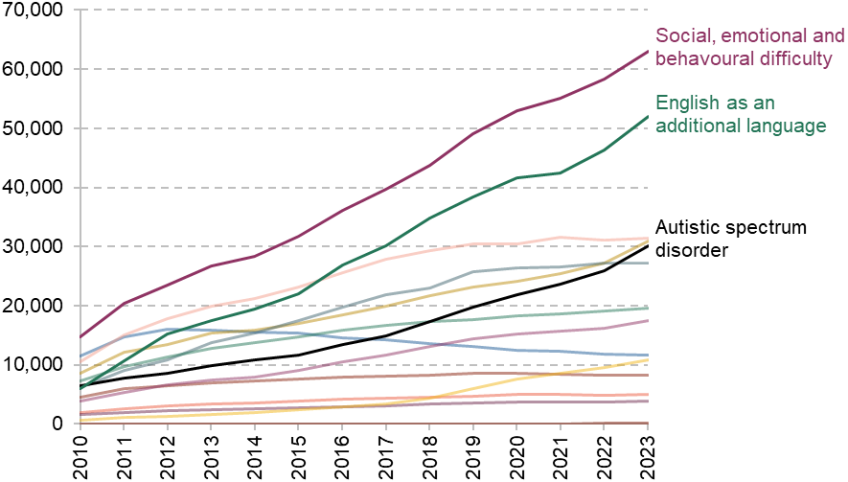
Note: Only selected needs are shown, for clarity; those with significant increases are highlighted. Figures will sum to more than the total number of pupils with ASN as some pupils have multiple needs.
Source: https://www.gov.scot/publications/pupil-census-supplementary-statistics/.
The impact that this rise in ASN will have on spending pressures is unclear, however. Despite the dramatic increase in identified need, spending has not increased at the same rate; between 2017–18 and 2023–24, spending increased by 26% (from £788 million to £993 million) while ASN pupil numbers increased by over 40%.9 Equally, while the number of support staff has risen since 2018, the number of ASN teachers has remained relatively constant since 2017 and indeed has fallen since 2010.10 Scotland has a much greater tendency towards ‘inclusion’ in mainstream education for pupils with additional needs than England (Education, Children and Young People Committee, 2024): the share of pupils with legally binding support in the form of coordinated support plans has fallen, and the share of pupils in special schools has hovered around 1% for the last two decades.11 While this has no doubt kept a lid on costs, it suggests that there has not been a dramatic change in the level of support available for pupils with additional needs, despite the increase in identified need. What this means for future spending pressures, and indeed staff numbers, will depend on whether this level of support has been sufficient to meet those needs.
4.4 Conclusion
Scotland has significantly increased spending on schools and early years education over the last six years. It spends 20% more per pupil than England and has substantially lower pupil–teacher ratios. The Scottish Government has also made repeated commitments to increase teacher numbers, which having not been met were subsequently revised to maintaining teacher numbers.
This is in the context of falls in pupil numbers across Scotland, which seem to be more pronounced in rural and island areas. There is also continued concern about the declining educational performance of Scottish pupils. The evidence suggests there are unlikely to be strong benefits from lower class sizes. Maintaining teacher numbers is also likely to get more expensive over time, just as the trade-offs facing the Scottish Government and local councils become even more challenging. Cutting teacher numbers is not without practical challenge, however, as it would likely involve amalgamating classes or closing schools.
Whilst there may be some clear attractions to avoiding cuts to teacher numbers in the short run, the Scottish Government’s one-size-fits-all approach to maintaining teacher numbers is unlikely to represent value for money over the long run. Instead, it would be better for local councils to make resource choices that reflect their specific circumstances, challenges and the best ways to deliver schooling locally. The Scottish Government should focus on how to distribute funding across different public services and areas. For instance, it could target greater resources at rural areas if it wanted to avoid pupils having to travel even further to school.
References
Boileau, B. and Phillips, D., 2024. The UK Budget has improved the Scottish funding outlook, but tough choices loom down the line. IFS comment, https://ifs.org.uk/articles/uk-budget-has-improved-scottish-funding-outlook-tough-choices-loom-down-line.
Britton, J. and Sibieta, L., 2024. School interventions to reduce intergenerational inequality. In E. Kilpi-Jakonen, J. Blanden, J. Erola and L. Macmillan (eds), Research Handbook on Intergenerational Inequality, Edward Elgar Publishing, 371–86, https://www.elgaronline.com/edcollchap-oa/book/9781800888265/book-part-9781800888265-37.xml.
Drayton, E., Farquharson, C., Ogden, K., Sibieta, L., Snape, D. and Tahir, I., 2025. Annual report on education spending in England: 2024–25. IFS report, https://ifs.org.uk/publications/annual-report-education-spending-england-2024-25.
Education, Children and Young People Committee, 2024. Additional Support for Learning inquiry. Scottish Parliament, SP Paper 585, https://bprcdn.parliament.scot/published/ECYP/2024/5/15/496ab9b0-bd4a-40ed-8f16-64d07018b3d6/ECYP-S6-24-02.pdf.
Filges, T., Sonne-Schmidt, C. S. and Nielsen, B. C. V., 2018. Small class sizes for improving student achievement in primary and secondary schools: a systematic review. Campbell Systematic Reviews, 14, 1–107, https://doi.org/10.4073/csr.2018.10.
Hulme, M., Beauchamp, G., Wood, J. and Bignell, C., 2024. Teacher workload research report 2024. https://www.eis.org.uk/Content/images/Campaigns/QualityEducation/WorkloadResearch.pdf.
Jerrim, J. and Sibieta, L., 2021. A comparison of school institutions and policies across the UK. Education Policy Institute Report, https://epi.org.uk/publications-and-research/a-comparison-of-school-institutions-and-policies-across-the-uk/.
Learning Directorate, 2024. Education: agreement with COSLA. Scottish Government, https://www.gov.scot/publications/education-agreement-with-cosla/.
Paterson, L. 2023. PISA 2022 in Scotland: declining attainment and growing social inequality. Reform Scotland, https://www.reformscotland.com/pisa-2022-in-scotland-declining-attainment-and-growing-social-inequality-lindsay-paterson/.
Sibieta, L. and Snape, D., 2024. Spending on special educational needs in England: something has to change. IFS Report, https://ifs.org.uk/publications/spending-special-educational-needs-england-something-has-change.
WPI Economics, 2024. Pupil projections and implications for teacher resourcing needs in Scotland. WPI Economics Report for the Scottish Government, https://www.gov.scot/publications/pupil-projections-implications-teacher-resourcing-needs-scotland-education-workforce-modelling-research/documents/.
Endnotes
Authors

Luke Sibieta
Luke is a Research Fellow at the IFS and his general research interests include education policy, political economy and poverty and inequality.

Darcey Snape
Darcey joined the IFS in 2024 as a research economist in the Education and Skills sector.
More from IFS
Understand this issue


Policy analysis


Academic research


