
Downloads
Download report PDF
PDF | 958.65 KB
Executive summary
This is our seventh annual report on education spending in England funded by the Nuffield Foundation. It seeks to provide a clear and consistent comparison of the level and changes in spending per student across different stages of education. Our dedicated website (https://ifs.org.uk/education-spending) further provides easy access to our latest analysis, figures and methodology. All figures quoted are in 2024–25 prices and relate to England unless otherwise stated.
Total spending
- In 2023–24, total public spending on education in the UK stood at £116 billion (including the net cost of issuing student loans and in 2024–25 prices). This represents an 11% or nearly £15 billion fall since 2010–11 and represents the level in real terms as in 2006–07. This drop mostly reflects a shift in the cost of higher education from the taxpayer to graduates over time.
- Education spending has also fallen as a share of national income, from about 5.6% of national income in 2010–11 down to about 4.1% in 2023–24. This equals recent historic lows seen in the late 1990s, late 1980s and mid-1960s. There has been no long-run increase in the share of national income devoted to public spending on education spending, despite large rises in education participation over the long run.
Early years
- Total spending on the free entitlement to early years education and childcare nearly quadrupled between 2001–02 and 2023–24, when it reached £4.1 billion in today’s prices. This was largely driven by expansions to the free entitlement. A new expanded entitlement for children aged under 3 is expected to lead to a further doubling of spending to £8.5 billion by 2027–28. This represents a major increase in resources at a time when other stages of education and public services have been squeezed.
- The rollout of the ‘expanded’ entitlement is the biggest ever expansion to the free entitlement. From September 2025, this will provide children in working families with 30 hours of early education and childcare per week between ages 9 months to 36 months.
- Funding rates for new and existing entitlements have seen large increases in 2024–25 to incentivise growth in provision, particularly for younger children: the average hourly rate for under-2s is £11.22, almost twice existing market prices. By comparison, hourly funding for existing entitlements for 3- and 4-year-olds are much closer to market prices. These higher funding rates for younger children better reflect differences in the costs of providing childcare to children of different ages than do current market prices (for instance, younger children require stricter staff:child ratios).
- Between 2016–17 and 2022–23 providers’ costs grew by 25% (mostly due to staffing but also energy, rent and food), which is about twice as quickly as the growth in funding rates for 3- and 4-year-olds (12%). Once we account for rises in providers’ costs, the average funding rate for 3- and 4-year-olds is worth about 15% less in 2024–25 than in 2012–13.
- Local authorities are responsible for distributing funding to providers and take different approaches to targeting spending. Just over a quarter (27%) of local authorities dedicate less than 5% of resources to targeted funding streams, which are intended to support low-income children and children with higher needs and to provide quality and flexibility of provision. Almost another quarter (23%) of areas allocate more than 10% to targeted spending, with these tending to be more urban and more deprived.
- Changes to employers’ national insurance contributions (NICs) and minimum wage rises announced at the Autumn Budget 2024 will particularly affect lower-paid workers. These changes create both winners and losers: a small childcare setting with six or fewer employees on median earnings (£33,000) would benefit from the changes if they are eligible for the more generous employment allowance; providers employing more staff would lose out – and the bigger the employer, the more so.
- The plan to deliver an additional 3,000 school-based nurseries launched in October. Once fully rolled out, this will represent around 30% of the existing number of school-based providers and is intended to drive up the quality of provision. While this may create additional capacity over the longer term, it is unlikely to substantially ease supply constraints by September 2025, the period when demand for new places will be most acute. There may also be a geographical mismatch between spare capacity in primary schools and demand for new early years provision.
Schools
- Between 2019–20 and this financial year (2024–25), total school spending in England grew by about £8 billion. This has led to 11% real-terms growth in school spending per pupil. This reverses past cuts and takes spending per pupil back to 2010 levels.
- In the Autumn Budget 2024, the government allocated a further £2.3 billion to the schools budget in 2025–26, with about £1 billion devoted to high needs. This allows for a further 1.6% real-terms growth in school spending per pupil.
- Secondary school spending per pupil in England in 2024–25 is due to be about £7,400, which is 11% higher than in primary schools (£6,700). This is down from a difference of about 30% in the 2000s and over 50% during the early 1990s.
- Over half of the increase in school funding between 2019 and 2024 can be explained by growth in high needs funding. This reflects the rapid growth in the number of pupils identified as having special educational needs. After accounting for planned spending on high needs, we estimate that mainstream school funding per pupil grew by 5% in real terms between 2019 and 2024, rather than the 11% total increase.
- We estimate that mainstream school funding per pupil will grow by 2.8% in cash terms in 2025–26. We also estimate that school costs will grow by 3.6% in 2025–26 if the pay review body follows the government’s recommendation of a 2.8% pay award for 2025. In this case, schools might struggle to cover their costs without making savings.
- Looking to the 2025 spending review, pupil numbers are expected to fall by 2% between 2025 and 2027. If the government chose to freeze school spending per pupil in real terms, it could make savings of £1.2 billion by 2027. However, the government also projects that high needs spending will grow by £2.3 billion between now and 2027–28. This severely reduces the chances of making savings in the schools budget.
- School capital spending is due to rise from £6.3 billion in 2023–24 to £6.5 billion in 2025–26. This leaves spending within the same range it has been for the last decade and about the same level as in the mid-2000s. From within this spending total, the government will need to cover the costs of the delayed school rebuilding programme, the costs of addressing reinforced autoclaved aerated concrete (RAAC) in schools and other overdue school repair costs.
Further education and skills
- In the 2024–25 academic year, we estimate that funding per student aged 16–18 in further education colleges will be £7,350, compared to £5,900 in school sixth forms and £5,500 in sixth-form colleges. Higher funding for further education colleges reflects extra funding for costly technical programmes and for students from more-deprived areas.
- Between the 2010–11 and 2019–20 financial years, funding per student aged 16–18 fell in real terms by 14% in colleges and 28% in school sixth forms.
- In the Autumn Budget 2024, the government announced a £300 million cash-terms boost to college and sixth-form funding. Because of rising student numbers and inflation, we calculate that this is only sufficient to deliver a real-terms freeze in funding per student. Combined with increases under the previous government, this leaves college funding per student about 11% lower in real terms than in 2010 and school sixth-form funding per student about 23% lower.
- Colleges and sixth forms face a range of financial uncertainty and challenges. They must accommodate a growing student population, which is expected to grow by 5% or over 60,000 between 2024 and 2028. Average college teacher pay is expected to be about 18% lower than for school teachers in 2025, which is likely connected to the high exit rates amongst college teachers (16% leaving their jobs each year). Meanwhile, whilst underlying college financial positions have improved since 2018, there remained about 37% of colleges operating deficits in 2022–23.
- Looking to the upcoming spending review, the government would need to increase annual funding by £200 million in 2027 in today’s prices to maintain spending per student in real terms, given the growth in the student population. A freeze in total funding in real terms would imply a 4% real-terms fall in funding per student.
- Total spending on adult skills and apprenticeships is expected to increase by 12% in real terms between 2019–20 and 2024–25. However, this only reverses a fraction of past cuts: total spending in 2024–25 will still be 23% below 2009–10 levels. Spending on classroom-based adult education has fallen especially sharply, driven by falling learner numbers and real-terms cuts in funding rates, and will still be over 40% below 2009–10 levels in 2024–25 even with the additional funding.
Higher education
- Upfront funding for teaching undergraduate students has declined in recent years, standing at £9,750 per year for the 2023–24 university entry cohort (including fees and teaching grants, less bursaries). This is £2,300 or 19% lower in real terms than in 2012–13, driven by cash-terms freezes in the cap on tuition fees for all but one year between 2012 and 2024. This real-terms fall took upfront funding per student back to the same real-terms level as in 2011–12, just before the tripling of the fee caps, and back to the same level as in the early 1990s.
- The new government chose to increase the tuition fee cap for the 2025–26 academic year in line with RPIX inflation, increasing the fee cap from £9,250 to £9,535 (which applies to new and existing students). It is not clear if this policy of indexation will continue. If it does, then upfront resources per student will rise to about £10,000 for students entering courses in September 2025.
- Until recently, there had been some good news for university finances, despite the long-running freeze in domestic fees. Income from international student fees had risen sharply, to £9.4 billion (a fifth of the sector’s income) in 2022–23, and a revaluation of the USS pension scheme had improved sector finances. However, student numbers in 2024 are well below forecasts (23% lower for international students). Together with the rise in employers’ NICs, the Office for Students forecast that a sector-wide surplus of £1.5 billion in 2022–23 could become a sector-wide deficit of around £1.6 billion in 2025–26, unless savings are made.
- The new government has chosen not to reverse the significant real-terms cuts in maintenance support for students of recent years. In 2025–26, the poorest students will be entitled to borrow around £1,125 (10%) less in real terms towards their living costs than in 2020. The government is yet to signal any long-run intention for the future of maintenance support, including whether or not they will re-introduce grants.
1. Introduction
Education spending is the second-largest element of public-service spending in the UK behind health, representing £116 billion in 2024–25 in today’s prices or about 4.1% of national income. To make efficient and equitable policy choices, it is crucial to have a clear, consistent picture of how the level of spending at each phase of education has changed over time, the expected future changes and the factors driving these changes. Such issues are a vital component of policy debate, given evidence showing how education investments at different ages combine to drive long-run outcomes (Cunha, Heckman and Schennach, 2010; Johnson and Jackson, 2019).
In a series of annual reports on education spending funded by the Nuffield Foundation, we have sought to cast light on this subject by illustrating how spending per pupil across different stages of education has changed over time. We also publish a range of smaller outputs throughout the year to provide more timely and rapid analysis of the resource challenges facing different phases of education. This analysis is housed on a dedicated website (https://ifs.org.uk/education-spending), providing easy access to the latest figures and the underlying methodology.
The new government has high ambitions to improve education and reduce inequalities. However, like most governments in recent years, it faces a very challenging set of public finances, maybe even more challenging than the situation faced by past governments. In the Autumn Budget 2024, the government chose to top-up departmental spending plans for 2025–26, including a £2.3 billion increase in the schools budget in England. Public-service spending will, over the two years from 2023–24 to 2025–26, grow by an average 3.4% per year in real terms. Departmental spending plans for 2026–27 and 2027–28 will be determined in next year’s spending review. For these two years, the government has pencilled in real-terms increases in overall day-to-day spending on public services of 1.3% per year. However, once likely spending commitments on the NHS, defence and expansions to early years entitlements are accounted for, other areas would very likely face the need to make spending cuts. These would be cuts made from a higher level, following two years of budget increases – but cuts all the same. There is naturally quite a bit of uncertainty around the precise scale of the cuts facing those areas – it matters a lot, for instance, how much cash goes to the NHS, or whether geopolitical developments necessitate a sharp increase in defence spending – but the overall message is clear. On current plans, most areas of education will be asked to find real-terms savings after 2025–26.
At the same time, the cost of special educational needs (SEN) provision is spiralling up by the billions, spending on skills and further education is low by historical standards, and the government faces a delicate balancing act between asking indebted students to pay more for their studies and universities warning of insolvency. It is, of course, possible that these spending plans won’t be implemented. Indeed, historic experience suggests that tight spending plans are likely to get topped up when a spending review comes along and specific choices have to be confronted. But the government has minimal room for manoeuvre against its fiscal rules and the Chancellor has ruled out further tax rises, and while the government could get lucky on growth, there’s every chance that global events weigh on the UK’s economic prospects. This is a delicate fiscal balancing act.
Before we turn to individual areas of education, the rest of this introduction provides overall context on total spending, pupil numbers across each sector over time and the overall methods.
1.1. Total spending on education
The total level of UK education spending rose significantly up to about 2010. As shown in Figure 1.1, growth was particularly fast from the late 1990s through to the late 2000s, with real-terms growth averaging about 5% per year between 1998–99 and 2010–11. Education spending then fell as public spending cuts began to take effect from 2010 onwards. Between 2010–11 and 2019–20, official education spending fell by 15% in real terms. Since then, it has risen slightly, but remained 12% below its level in 2010–11 by 2023–24.
Some of the decline in education spending during the 2010s reflects initially large declines in capital spending just after 2010 (Sibieta, 2024). These declines also reflect a deliberate increase in effective private funding for higher education through graduate contributions later in life.
Unfortunately, these official figures do not fully account for the cost to the taxpayer of issuing student loans from 2011–12 onwards. As a result, the series overstates cuts to education spending since 2010–11. Changes to national accounting rules mean that the expected cost of issuing student loans is included in overall measures of government spending and the public finances, such as the deficit. We estimate that if official measures of education spending had followed the new national accounting rules for student loans, education spending would have been around £6 billion higher in 2015–16, £5 billion higher in 2022–23 and £2 billion higher in 2023–24.1 The reason for the decline in spending on student loans reflects the recent changes in repayment terms and increased expected graduate contributions (see Chapter 5 for more details). If we add these numbers to the official measure of education spending, the real-terms cut in education spending between 2010–11 and 2023–24 falls from 12% to 11%. As a result, the real-terms level of education spending in 2023–24 was the same as it was in 2006–07. This decline mostly reflects shifting most of the cost of higher education from the taxpayer to graduates. The actual amount of (gross) upfront support through loans for tuition fees has increased from about £5.0 billion in 2012–13 to £10.1 billion in 2015–16 and about £10.6 billion in 2023–24.
Figure 1.1. UK education spending (2024–25 prices and as a share of national income)

Source: HM Treasury Public Expenditure Statistical Analyses 2024, and previous versions; HM Treasury (2024); Office for Budget Responsibility, Economic and Fiscal Outlook, various editions (https://obr.uk/efo/); Office for National Statistics, ‘Student loans in the public sector finances: a methodological guide’, January 2020 (https://www.ons.gov.uk/economy/governmentpublicsectorand taxes/publicsectorfinance/methodologies/studentloansinthepublicsectorfinancesamethodologicalguide).
Including the adjustments for student loans, education spending represented about 4.1% of national income in 2023–24. This follows a temporary peak of 5% during the height of the COVID-19 pandemic in 2020–21, when spending was boosted and the size of the economy was depressed. The underlying picture, however, is a significant decline in education spending as a share of national income over the last 15 years. Following a significant rise over the 2000s, education spending as a share of national income reached a peak of 5.6% of national income in 2010. Since then, it has declined to its current level of 4.1% of national income. This equals a historic low point, with education spending as a share of national income equal to that seen in the late 1990s, late 1980s and mid-1960s. Indeed, it is clear that education spending as a share of national income has not seen a sustained rise since the early 1970s, when it stood at 4.5–5% of national income. It has instead oscillated between about 4% and 5.5% of national income. This is despite large rises in participation in post-compulsory education over time, both in schools and higher education, as well as the creation of an early years sector.
1.2. Student numbers over time
Total spending figures can obscure the impact of changes in the number of pupils or students, which is often one of the most important factors driving changes in the total and per-student level of spending over time. There have also been some fairly substantial changes to pupil and student numbers in recent times, which are due to continue over the next decade.
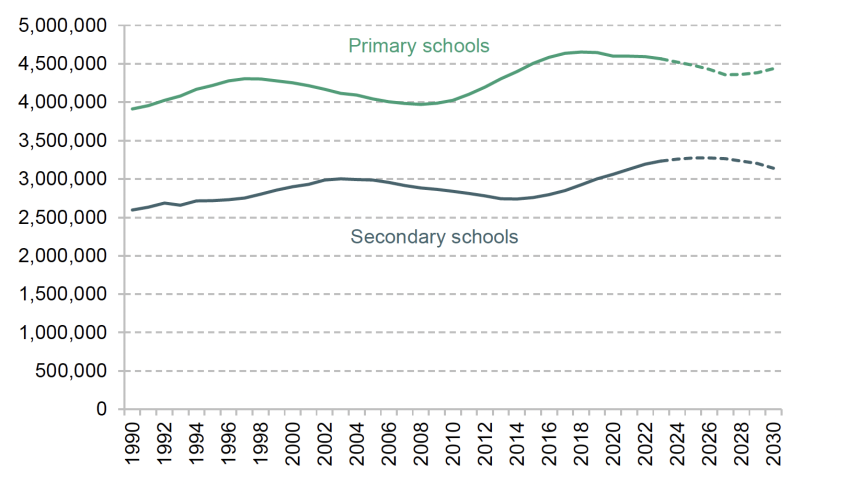
Figure 1.2(a) shows the number of pupils in state-funded primary and secondary schools over time. Numbers in primary schools grew by 17% between 2009–10 and 2019–20, the equivalent of an extra 700,000 pupils – or effectively a full cohort of children. They have since fallen, with a 3% or 100,000 expected drop between 2019–20 and 2024–25. Pupil numbers in secondary schools fell from the early 2000s through to about 2014–15. Between 2014–15 and 2019–20, they then grew by nearly 10% or 300,000, and are expected to have grown by a further 8% or 250,000 between 2019–20 and 2024–25.
Looking beyond 2024–25, the primary pupil population is expected to fall by over 150,000 between 2024–25 and 2027–28, whilst the secondary pupil population is only expected to start falling from 2026–27 onwards and at quite a slow rate initially. This implies a fall in the total pupil population of only about 2% or just over 150,000 between 2024–25 and 2027–28.
Official forecasts for the school-pupil population end in 2027–28, but Office for National Statistics (ONS) forecasts for the total number of children by age groups suggest that the number of primary school age pupils will actually rise by about 2% or 100,000 between 2027–28 and 2030–31, whilst the number of secondary school age children will continue to fall (by over 100,000 or 4% between 2027–28 and 2030–31). This would amount to only a very small net reduction in the total pupil population between 2027–28 and 2030–31. Combined with earlier years, this would imply a 200,000 or 3% fall in the pupil population between 2024–25 and 2030–31. This small fall contrasts sharply with the 600,000 or 8% reduction implied by government forecasts published in 2023.
Figure 1.2. Pupil or student numbers in education in England
(a) Schools
(b) Other stages of education
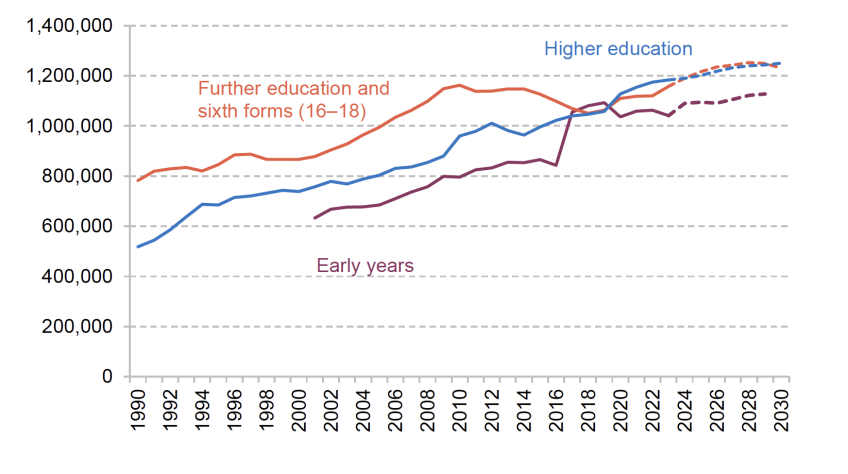
Source to Figure 1.2: Years refer to academic years starting from September (i.e. 2002 refers to the 2002–03 academic year). Early years numbers represent part-time equivalent places of 3- and 4-year-olds taking up the universal and extended early years entitlement (excluding 4-year-olds in infant classes) and are taken from Department for Education, ‘Education provision: children under 5 years of age’, January 2023, January 2010, January 2006 and January 2002. Primary and secondary school numbers are taken from Department for Education, ‘Schools, pupils and their characteristics’, January 2024 and earlier years, and ‘National pupil projections: July 2024’. Projections for primary and secondary school children for 2028–30 are based on ONS 2021-based forecasts for the growth in the population of 5–9- and 10–14-year-olds. Further education and sixth-form figures refer to 16–18-year-olds in state-funded schools or colleges as measured at the end of each calendar year in Department for Education, ‘Participation in education, training and employment: 2023’. Higher education figures relate to full-time students on first undergraduate degrees and other undergraduate courses from HESA, ‘Who’s studying in HE?’ and also use ‘Historical statistics on the funding and development of the UK university system, 1920–2002’. Forecasts for the early years and 16–18 education are based on ONS 2021-based forecasts for the population of 3–4- and 16–18-year-olds. Forecasts for higher education are based on Department for Education forecasts of entrants up to 2028 (https://explore-education-statistics.service.gov.uk/methodology/student-loan-forecasts-for-england-methodology) and then ONS 2021-based forecasts for the number of 18- and 19-year-olds.
The numbers of pupils in primary and secondary schools are mostly driven by demographic changes, while pupil numbers in other stages of education – early years, further education and higher education – are also affected by changing patterns of participation. Each of these three stages have seen substantial increases in pupil numbers, as shown in Figure 1.2(b). Population growth plays a role, but expansions of the free childcare entitlement (in the early years) and rising participation rates (at later stages) are more important factors driving these changes.
Early years education and childcare in England is increasingly dominated by the ‘free entitlement’ to a government-funded early years education place. The free entitlement is comprised of several distinct offers and has been progressively expanded to cover more children for more hours:
- The universal entitlement offers all 3- and 4-year-olds a part-time (15-hour) place for 38 weeks of the year.
- The extended entitlement, introduced in 2017, offers an additional 15 hours a week of childcare to 3- and 4-year-olds in working families.
- The 2-year-old offer, introduced in its current form in 2014, provides the roughly 40% most-disadvantaged children with a part-time early education place, again for 38 weeks a year.
- The expanded entitlement was announced at the March 2023 budget and is currently being rolled out. From September 2025, this will provide a full-time place (30 hours a week) for children aged 9 months to 36 months in working families.
From 2001–02 to 2016–17, the total number of part-time equivalent places for the universal free entitlement in the early years rose by a third, driven by increases in the population of pre-school aged children and expansions to free entitlement eligibility. With the introduction of the extended entitlement for children in working families in 2017–18, the number of part-time equivalent places jumped. Between then and 2023–24, there were no further expansions of the free entitlement and the number of part-time equivalent places has remained roughly constant. This stability masks two offsetting trends: while the number of places taken up for the extended entitlement has grown by around 63,500, the number of children taking up the universal offer fell by around 9% between 2017–18 and 2023–24, driven by a combination of falls in the population of 3- and 4-year-olds and lower take-up.
Looking ahead, the latest ONS population projections forecast imply that the pre-school age population by 2029–30 will be close to the numbers for 2023–24. Meanwhile, if rising take-up of the extended entitlement continues, we would expect to see around 8% more part-time equivalent places for 3- and 4-year-olds in 2029–30 compared with 2023–24.
Figure 1.2(b) focuses on places for 3- and 4-year-olds, which historically have made up the bulk of children accessing the free entitlement. With the introduction of the expanded entitlements – the largest and fastest expansion to date – this is set to change and will see substantial increases in the number of places for younger children. This is discussed further in Chapter 2.
The number of students in 16–18 education grew by almost 50% between 1990–91 and 2010–11, from about 800,000 to 1.2 million full-time equivalent students. After 2010–11, numbers fell by about 10% down to just over a million in 2018–19, reflecting reduced cohort sizes rather than falls in participation.
Since then, numbers have started to rise again, and the number of students is 10% or 100,000 higher in the latest year of data (2023–24) than in 2018–19. This mostly reflects growth in cohort sizes again. Further rises are expected over the next few years due to population growth, with numbers currently projected to rise by 8% between 2023 and 2028, before then starting to fall slightly. This would make for 100,000 extra students by 2028. If realised, this would clearly place upwards pressure on college and sixth-form spending.
The number of full-time undergraduate students in higher education in England more than doubled between 1990 and 2019, to reach 1.06 million. Participation increased during the pandemic, with student numbers increasing by 6.5% in 2020, but growth has since slowed. In the latest year (2024), acceptances of offers at UK universities increased by 1.3%, far more slowly than the sector forecast (5.8%). As we discuss in Chapter 5, recruitment of international students has also fallen, which creates financial headaches for many UK universities.
Nonetheless, the latest Department for Education forecasts imply a further increase in the number of England-domiciled higher education students of 4% or 44,000 between 2022 and 2026. ONS population forecasts would then imply a total increase of 6.5% or 76,000 by 2030 compared with 2022, taking the number of full-time undergraduate students in higher education to 1.25 million.
Increases in higher education student numbers will clearly place pressure on spending. In the past, such as during the 1990s, spending has not always increased in line with rising student numbers, thereby reducing spending per student. At other times, large increases in higher education student numbers have led governments to make substantial changes to the higher education finance system in order to ensure sufficient levels of resources.
The previous government already made large changes to the student finance system, which will likely reduce the cost of the system to the taxpayer (Waltmann, 2022). However, we have also seen a large real-terms reduction in spending per student as rising inflation eroded the real-terms value of the tuition fee cap, which was frozen in cash terms at £9,250 between 2017 and 2024. This long-running decline in resources is now set to end, with the fee cap due to rise in line with RPIX inflation in 2025.
1.3. Methods and approach
The rest of this report mainly focuses on day-to-day or current spending on different areas of education in England. This is primarily for data availability reasons, though we have also provided analysis comparing school spending per pupil across the four nations of the UK, which indicates higher levels of school spending per pupil in Scotland in particular (Sibieta, 2023a). We also provide some evidence in this report on trends in school capital spending.
For the most part, we focus on public spending on education. This is due to a lack of reliable data on total private spending on each stage of education over time. For schools, we have produced additional analysis comparing state school spending per pupil and private school fees over time (Sibieta, 2023b), including the likely effects removing tax exemptions from private schools. For higher education, we also separately consider the support provided to students with their living costs, and expected graduate contributions to higher education spending through student loan contributions later in working life.
In Chapters 2–5, we examine trends in spending on the early years, schools, further education and skills, and higher education. In Chapter 6, we compare trends in spending per pupil across different stages of education over time. In each case, our methodology for calculating spending per student is detailed in full on the dedicated website (https://ifs.org.uk/education-spending/methods-and-data). In most cases, figures relate to core education spending and exclude temporary support during the pandemic, though it is not always possible to separate this out. Chapter 7 concludes.
In most cases, we calculate real-terms changes by adjusting for economy-wide inflation as captured by the GDP deflator. This is the standard practice used for analysing public spending in the UK. Across long periods of time and in stable economic environments, the GDP deflator is likely to provide a close approximation to the costs faced by education providers. However, the recent spike in inflation was mainly driven by imported food and energy prices, which is not fully captured in the GDP deflator. With this in mind and to provide more context, we often provide analysis of likely costs faced by providers. This also allows us to consider the financial pressures on providers’ budgets, and how the actual funding available to providers compares with their actual cost pressures.
2. Early years
Today, public spending on early years education and childcare is synonymous with the free entitlement programme, the scheme that offers a government-funded place in early education and childcare. The free entitlement has grown to become the largest pre-school education and childcare programme in England – see, for example, Drayton et al. (2023) for a history of how early years support has changed – with spending doubling in real terms over the decade from 2001, and rising further to reach £4.2 billion last year (i.e. 2023–24). On the back of this precipitous rise, it is also set to grow in importance: as shown in Figure 2.1, the free entitlement is forecast to undergo its fastest and largest expansion to date, rising to an estimated £8.5 billion in 2026–27.
The free entitlement is not one single programme; different offers are available to children of different ages, with different eligibility requirements. These include:
- a universal offer of 15 hours a week for all 3- and 4-year-olds;
- an extended entitlement to 30 hours a week for 3- and 4-year-olds in working families;
- a disadvantage offer of 15 hours a week for the most disadvantaged 2-year-olds.
Alongside these schemes is the new ‘expanded’ entitlement announced at the March 2023 budget by the previous government. This new entitlement for working families is currently being expanded under the following timescales:
- from April 2024, 15 hours a week for 2-year-olds in working families;
- from September 2024, 15 hours a week for children aged 9–36 months in working families;
- from September 2025, 30 hours a week for children aged 9–36 months in working families.
Once fully rolled out, the expanded entitlement will provide children in households with all adults in work with access to 30 hours a week of free childcare from the end of maternity leave (nine months) to when children start school.
This chapter is split into three parts. The first (Section 2.1) documents how spending on the existing entitlements has changed over time, including changes to hourly funding rates, before turning to how spending is expected to evolve with the introduction of the expanded entitlements. The second part (Section 2.2) looks at how funding for the free entitlement is distributed by local authorities and the extent to which different types of provision or certain groups of children are supported through the funding system. Finally, in Section 2.3, we consider the implications of the most recent policy changes affecting the early years sector (including the expansion of school-based nursery places and the recent rises in employers’ NICs announced in the Autumn Budget 2024) and look forward to considerations for the upcoming spending review.
2.1. Spending on the free entitlement
Figure 2.1 shows total public spending on the free entitlement over the past 25 years, split by type of programme. For the first decade of this period, the sole programme at the time, the universal entitlement, saw significant real-terms growth of about 120% in total. This saw total spending on a part-time place for 3- and 4-year-olds rise from £1.2 billion in 2001 to £2.7 billion in 2011. Over the 2010s, real-terms total spending on free entitlement programmes continued to rise steadily, a notable departure from the real-terms cuts experienced in other stages of education (see later chapters). Figure 2.2 also highlights, however, how these increases in spending were largely driven by the introduction of additional entitlements rather than increased generosity in the funding of existing entitlements.
Figure 2.1. Total real-terms spending on free entitlement hours in England (£ million, 2024–25 prices)
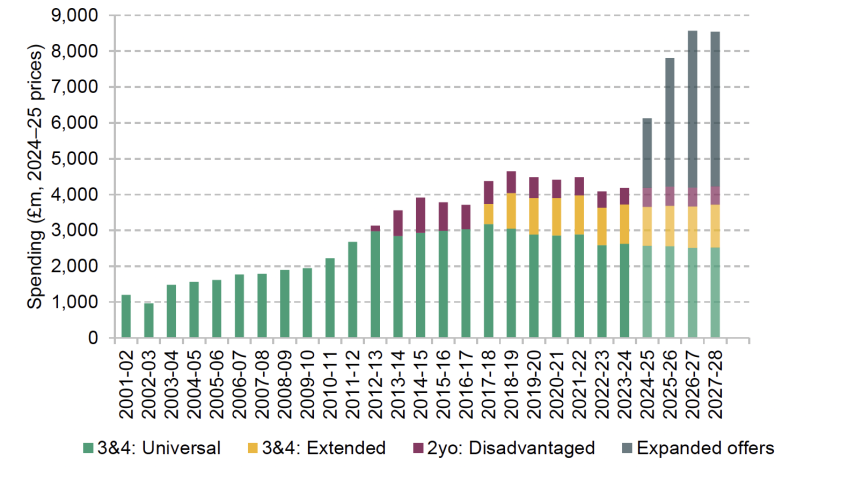
Note: Entitlements as described at the start of the chapter. The 2-year-old disadvantaged offer was initially piloted in a small number of areas in 2012, before being rolled out nationally in 2013. Because our data on total spending do not split out the universal and extended entitlements, we allocate total spending proportional to their budgets from the Dedicated Schools Grant (DSG). From 2024–25 onwards, we use DSG budget for core funding.
The final years in Figure 2.1 project from 2024–25 (i.e. the first year of the rollout of the expanded entitlements) the expected budget for the free entitlements. This differs from the measures of spending out-turn for previous years but provides a useful indication of how spending may evolve in the coming year. Funding rate rises announced at the March 2023 budget are expected to restore total real-terms funding on existing entitlements (universal, extended and 2-year-old disadvantage) in 2024–25 to the 2018–19 peak of around £4.7 billion in today’s prices. This is even though the number of child-hours delivered for two of these programmes (universal and 2-year-old disadvantage) are lower than they were in 2018–19. In addition, the partial rollout of the expanded entitlements is expected to add a further £1.7 billion to this amount, representing the largest year-on-year increase in our series.
Looking further ahead, spending on the free entitlement is projected to continue to rise substantially in real terms as the new entitlements are rolled out. By 2027–28, total spending will be more than double its 2023–24 level, representing a major increase in the early years budget. This significant injection of funding is notable against the backdrop of a historically challenging position for the public finances (Johnson, 2024).
Figure 2.2 paints a picture of a long-term rise in real-terms spending on the free entitlement. However, this period has seen significant growth in the number of children and hours covered by the entitlements, as well as population fluctuations in the number of 2-, 3- and 4-year-olds (see Drayton and Farquharson, 2023 for more detail). It is therefore more instructive to consider how real-terms spending per child and per childcare hour has evolved over time.
Taking 3- and 4-year-olds first (covering the universal and extended 30-hour offer), as shown in Figure 2.2, growth in real-terms spending per child taking up a place has largely tracked changes in total spending and saw substantial real-terms growth, doubling over the decade from 2009–10. Between 2017–18 and 2023–24, where no new entitlements were introduced, spending per place was more volatile as it was exposed to funding rate changes as well as rising costs eroding the real value of resources, particularly during the 2022–23 inflation spike.
In contrast, if we account for the number of hours of childcare children are taking up, we see much more muted growth, with real hourly resources growing by 23% over the 14 years between 2009–10 and 2023–24. That said, this still represents substantially higher growth in real resources compared to spending per pupil on other stages of education over the same period (Drayton et al., 2023).
Figure 2.2. Growth in real-terms spending on the free entitlement for 3- and 4-year-olds (indexed 2009–10 = 100)
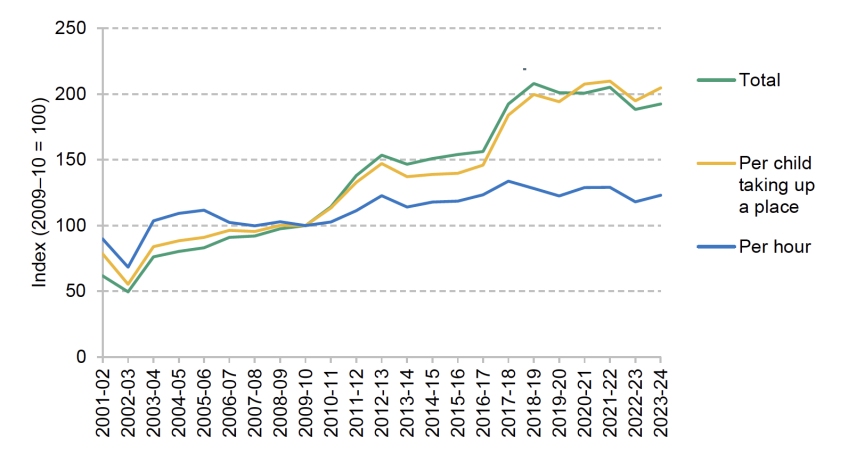
Note: Spending on universal and (from 2017–18) extended entitlements for 3- and 4-year-olds. Spending per place is spending per part-time equivalent place (15 hours) across both entitlements, so a child accessing their full universal and extended entitlement would count towards two part-time equivalent places; see https://ifs.org.uk/education-spending/methods-and-data for more details.
Source: See ‘Methods and data’ at https://ifs.org.uk/education-spending/methods-and-data.
Note that 2-year-olds are funded at a different rate, and the picture for spending on the 2-year-old disadvantage offer looks somewhat different: hourly resources have remained roughly stable since its introduction in 2015–16, but total spending on the programme has fallen over time (Drayton and Farquharson, 2023). This is largely driven by a decline in the number of places taken up, which fell by a quarter between 2015–16 and 2022–23. The demographic shifts and tighter eligibility criteria for the programme that are behind this fall are discussed in greater detail in Drayton and Farquharson (2023).
Funding rates
While the total amount of funding for the free entitlement is an important indication of the government’s priorities, what matters more to childcare providers is the hourly funding rate that they receive for children in their care. This provides a proxy2 for the amount of resources providers have to deliver the free entitlement.
Figure 2.3 shows the average funding rate across England in 2024–25 by age of child, compared to current market prices for childcare. The first pattern that emerges is that providers tend to charge parents similar hourly prices for childcare, irrespective of a child’s age. This smoothing of prices across ages is notable given differences in the costs of providing childcare to children of different ages (for instance, younger children have stricter requirements around the number of staff per child). This gradient in the cost of provision by child age is reflected, however, in the funding rates providers receive for children of different ages in their care, with higher funding rates for younger children.
Figure 2.3. Free entitlement funding rates in comparison to market prices (2024–25 prices)
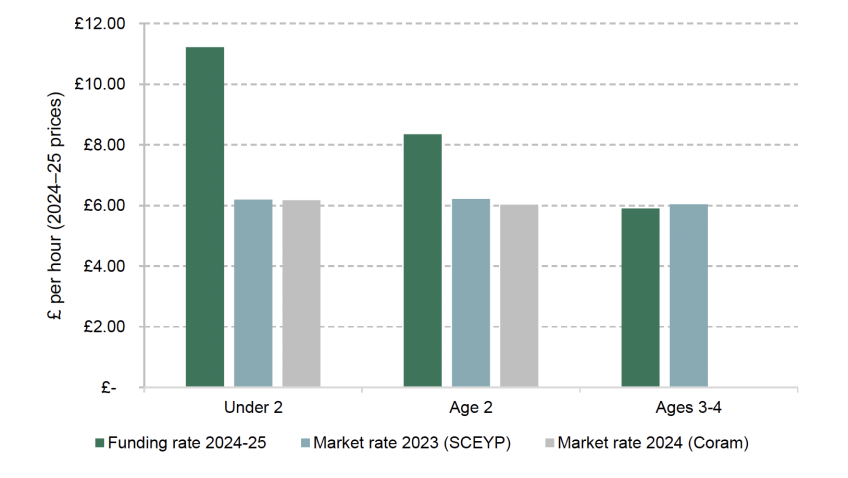
Note: Market prices are shown from two sources: the Department for Education 2023 Survey of Childcare and Early Years Providers (‘SCEYP’ survey) and the Childcare Survey 2024 from Coram Family and Childcare (‘Coram’ survey). Market rates from the Coram survey are a weighted average of rates across group-based nurseries and childminders, with weights based on number of registered places in the SCEYP survey. Funding rate rates are retrieved from the Dedicated Schools Grant 2024–25.
Source: Department for Education (2023a, 2024a) and Hodges, Shorto and Goddard (2024).
The second takeaway from Figure 2.3 is that funding rates for younger children are much more generous than current market rates. For 2024–25, the government has budgeted for a much higher funding rate for 2-year-olds, while rates for the under-2s will start at £9.45, almost 50% higher than existing prices in the market. This suggests the government is channelling resources towards younger ages to both incentivise expansion in provision for younger children and to better align funding rates with differences in costs of provision for different age groups.
However, hourly funding for the existing entitlements for 3- and 4-year-olds is much closer to market prices on average. While this makes it less likely that this public funding translates into excess profits for providers rather than being put to better use elsewhere in the public sector, it leaves less margin for error: providers who are less financially sustainable, or in areas experiencing challenges with delivery, may be more financially exposed if providers’ costs become misaligned with funding rates.
While Figure 2.3 focuses on hourly rates as they stand today, what also matters is how funding rates have evolved over time and the extent to which they have kept up with changes in provider costs. In Figure 2.4, we document how the funding rate has changed over time in cash terms for provision for 3- and 4-year-olds and 2-year-olds, alongside changes in the costs that childcare providers face – the provider cost index. These provider costs account for changes over time in employee wages, including changes in the minimum wage, as well as changes in other components of costs, including energy, rent and food.3
Figure 2.4. Growth in core hourly funding and providers’ costs for 3- and 4-year-olds and 2-year-olds, indexed to 2016–17
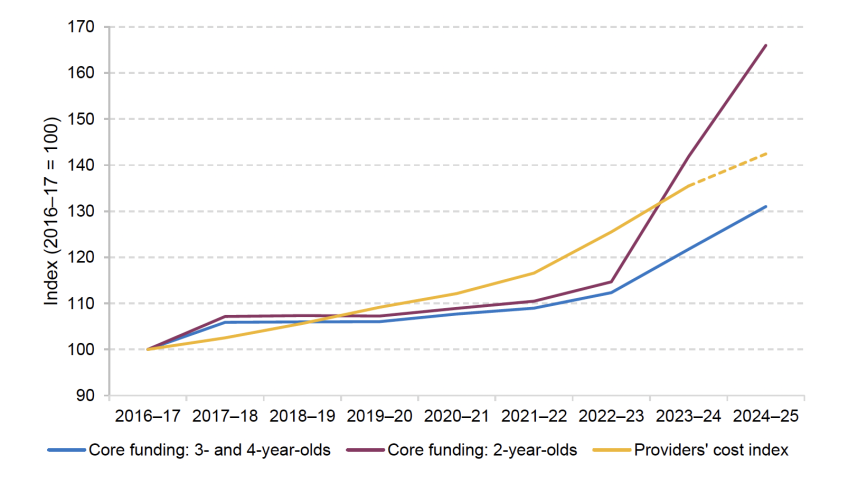
Note: Funding rates up to 2022–23 are drawn from the Early Years block of the Dedicated Schools Grant. In 2023–24, funding rates mid-way through the financial year, in September; the chart presents weighted averages of the April–August and September–March rates. The funding rate for 2024–25 has been announced as £8.28 for 2-year-olds and £5.88 for 3- and 4-year-olds in cash terms.
As shown in Figure 2.4, between 2016–17 and 2019–20, funding rates for 3- and 4-year-olds were largely frozen in cash terms, with the exception of an uplift in 2017–18 when the extended entitlement for 3- and 4-year-olds in working families was brought in. Over the same period, the costs that providers incur to deliver childcare slightly outpaced growth in funding: the average provider experienced a 9% rise in costs compared to a 6% increase in funding rate. However, recent years have seen a wedge open up between funding rates for 3- and 4-year-olds and provider costs, as high inflation and rises in minimum wage have generated large cost rises for providers (Drayton and Farquharson, 2022). This has meant that even relatively generous uplifts in funding rates in 2023–24 and again in 2024–25 have not offset the cost pressures. By our estimates, core resources per hour for 3- and 4-year-olds will remain 8% lower in real terms in 2024–25 than in 2016–17 once provider costs are taken into account. This rises to 15% lower relative to 2012–13.
The picture looks somewhat different for childcare for 2-year-olds. As Figure 2.4 shows, while growth in 2-year-old rates tracked changes in funding rates for 3- and 4-year-olds between 2016–17 and 2022–23, the two have diverged in the past couple of years with the largest cash increase in the 2-year-old funding rate in 2023–24 since its introduction (30%4). Funding for 2-year-olds has also been prioritised this year, with a 17% cash-terms rise in 2024–25, well above current market prices.
It is also important to consider how funding rates are set going forward. As explored in Drayton and Farquharson (2024), next year will see a small rise in core funding rates, expected to largely offset the impact of economy-wide inflation (as measured by the GDP deflator). The uplift for 3- and 4-year-olds is slightly higher, meaning that effective funding rates will rise about 1% faster than economy-wide inflation.
However, provider costs are set to rise next year too: rises in employers’ NICs and the minimum wage announced in the Autumn Budget 2024 will leave childcare providers with new expenses (we discuss possible impacts in Section 2.3). For some providers, this will outweigh the modest increases to funding rates, continuing the long-term trend of funding not keeping up with changes in provider costs (Reed and O’Halloran, 2024).
2.2. Distribution of spending across local authorities
Our focus so far has been to study total spending on the early years ‘free entitlement’ at a national level. However, there is no single childcare market for England: different places have different availability of provision and serve different children and families. What matters to childcare providers is not the headline funding rate but what they receive on the ground to deliver the entitlements.
The funding childcare providers receive is governed by a two-step process. First, central government allocates funding between local authorities according to the Early Years National Funding Formula (EYNFF). Under this system, areas receive different hourly funding rates, which vary according to local costs of providing childcare (areas with higher rents for premises and staff wages attract more funding) and the needs of the population (areas with more-deprived or disabled children or children with additional language needs attract additional funding). Drayton and Farquharson (2023) provide more detail on how the EYNFF works and the implications of the funding formula for different areas.
In a second step, each local authority is responsible for distributing funding to the providers in its area based on its own funding formula, known as the Early Years Single Funding Formula (EYSFF). Technically, this results in 153 distinct funding allocation formulas across local authorities; in practice, local authorities are heavily restricted in how they distribute this funding.
The two biggest constraints on local authorities are the requirements to pass through at least 95% of the funding received under the EYNFF to providers5 and to pay the same rate to different types of providers.6 Local authorities are then permitted to offer supplements that can be used to tweak their formula; though again, there are restrictions on the total value of supplements, which must not exceed 12% of total funding. A deprivation supplement is mandatory for 3- and 4-year-olds; other allowable supplements can include:
- quality, to support workforce qualifications or system leadership;
- rurality or sparsity;
- flexibility, to support providers offering more flexible provision to match parents’ working patterns and needs;
- English as an Additional Language (EAL).
Finally, the EYNFF also allocates additional funding streams to areas such as the early years pupil premium (EYPP) and the disability access fund (DAF).7 These supplements operate somewhat differently: instead of raising the base funding rate for a local authority, which is then handed down to providers equally, providers receive extra funding for each eligible child – meaning that funding follows the child.
By design, this standardisation across local authorities in use of the EYSFF imposes some alignment between the rate allocated under the national funding formula and the rates that providers receive. In this section, we study how 153 local authorities use the tools available to them under the EYSFF, focusing on 2023–24, the most recent year of data.
A limitation of this analysis is that this reflects local authority allocations prior to the introduction of the expanded entitlements. These new entitlements represent a major expansion to the previous entitlements (the universal and extended entitlements for 3- and 4-year-olds and the 2-year-old disadvantage offer) and areas may well alter their allocations to support the delivery of the new entitlements for younger children in working families. This will be important to look into as data become available. In our analysis, we exclude the EYPP and the DAF, which allocate additional funding to deprived and high needs children, respectively, as these operate outside of the local authority funding system. We discuss EYPP and DAF funding separately in Section 2.3.
Distribution of spending under the EYSFF
We first study how funding handed down from the national formula is channelled into different types of spending by local authorities. Figure 2.5 divides each local authority’s total funding under the single funding formula (excluding EYPP and DAF) into:
- core – funding for the core hourly funding rate;
- supplements, SEN inclusion fund and Maintained Nursery Supplement – targeted spending to compensate providers with higher cost provision such as through the SEN inclusion fund, supplements for quality and deprivation, and supplementary funding for maintained nurseries;
- centrally retained and contingency – resources held back by local authorities for contingency planning, that is, resources for managing fluctuations in demand, and to support early years related activities performed centrally, including eligibility checking or supporting local authority-wide specialist SEN services.
Owing to the requirement to pass through at least 95% of core funding for the 3- and 4-year-old entitlements to providers, and restrictions on how much funding can be allocated to supplements, there is a reasonably high level of conformity in how different local authorities allocate funding. In particular, the pass-through requirement ensures that at least 95% of core funding is split between the base funding rate, supplementary funding rates, the SEN inclusion fund and contingency funding. On average, local authorities distribute 88% of funding to the core hourly funding rate, received equally across providers. Three-quarters of local authorities allocate at least 85% of funding to the core rate.
Figure 2.5. Composition of spending under the EYSFF, by local authority
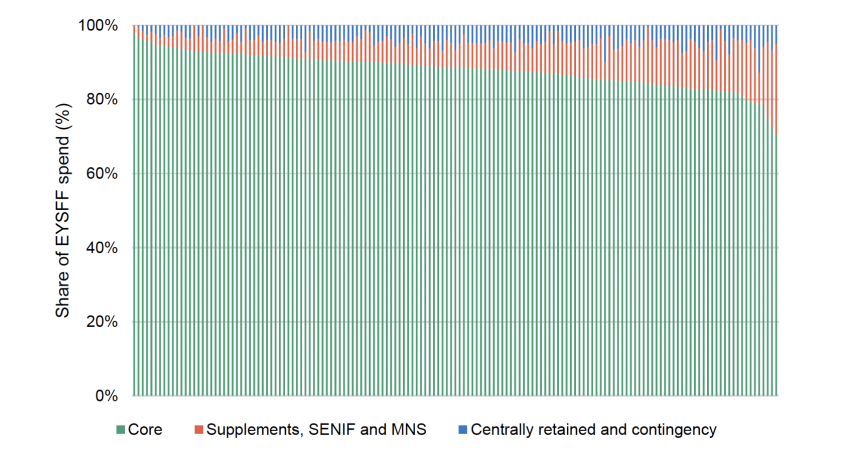
Note: Excludes spending on the EYPP and the DAF. The pass-through requirement requires at least 95% of core funding to be split between Core, Supplements, SENIF and MNS, and contingency funding. Since we conceptually group centrally retained and contingency funding, it cannot be read from this graph whether a local authority meets the pass-through requirement.
There is variation, however, in how local authorities make use of supplements and SEN inclusion funding, the mechanisms through which areas can target more resources to providers serving higher-needs population or delivering higher-quality or more flexible provision. Just over a quarter (27%) of local authorities dedicate fewer than 5% of resources to these more-targeted funding streams, while almost another quarter (23%) of areas allocate more than 10% to this targeted spending. Areas distributing more through supplements and the SEN inclusion fund tend to be more urban (around two in five are in London) and more-deprived. We study the use of supplements in greater detail in the following subsection.
Another way to see how the centrally determined funding rates translate into resources on the ground is to examine how closely provider base rates set by local authorities align with the EYNFF rates. Table 2.1 shows differences across areas in the proportion of the EYNFF funding rate that providers receive in their base rate from local authorities.
Table 2.1. Core rates under EYSFF versus EYNFF for 2023–24
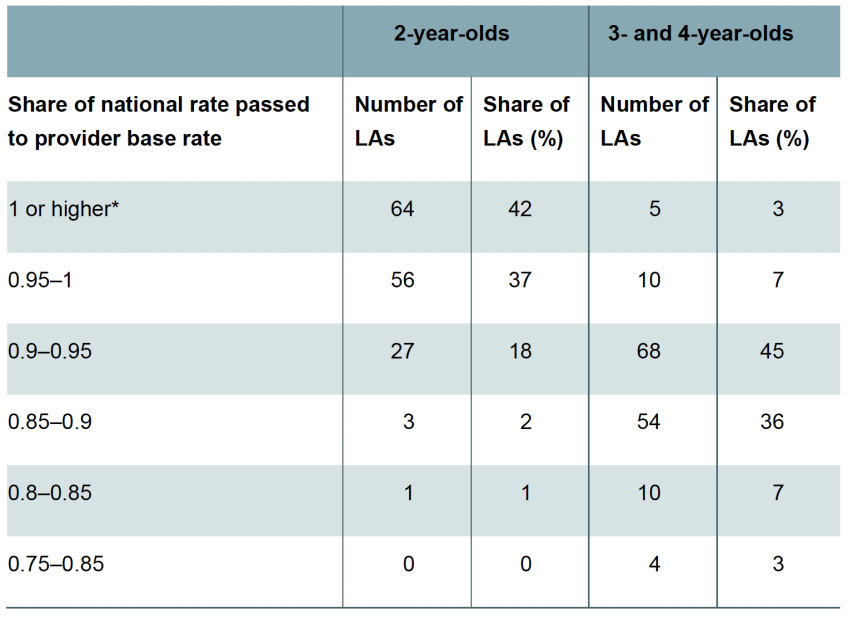
Note: * Only two and one local authorities (LAs) have a pass-through higher than 1 for the 2-year-old rate and 3- and 4-year-old rate, respectively.
For 2-year-old funding rates – which, for 2023–24, relate to the 2-year-old disadvantage offer – many local authorities (41%) pass on exactly the EYNFF rate to providers. A further 37% of areas pass through at least 95% of the EYNFF rate. Since the 2-year-old disadvantage entitlement is eligible only to low-income children, it serves a less variable population, and therefore resources are more easily targeted through the base rate with less need for additional supplements (as we will see, this was also encouraged in Department for Education guidance). As the expanded entitlements draw in 2-year-olds from working families into the free entitlement, however, local authorities may need to change their funding formulas to ensure providers are encouraged to (continue to) offer childcare places for disadvantaged 2-year-olds.
For 3- and 4-year-olds, fewer resources feed into core funding relative to targeted spending (e.g. supplements), resulting in lower pass-through from the EYNFF rate to the universal base rate. Very few areas pass on the EYNFF rate to providers exactly, and only 7% of areas set the base rate to 95% of the EYNFF rate or higher. Still, all local authorities feed at least three-quarters of the EYNFF rate into their base rate for 3- and 4-year-olds, with the majority of areas falling in the 85–95% range.
Local authorities’ use of supplements
Figure 2.6 shows, for each type of supplement permitted by the Department for Education, the share of local authorities who offer additional funding for that factor for entitlements for 3- and 4-year-olds.8
Figure 2.6. Use of supplements for entitlements for 3- and 4-year-olds by local authorities
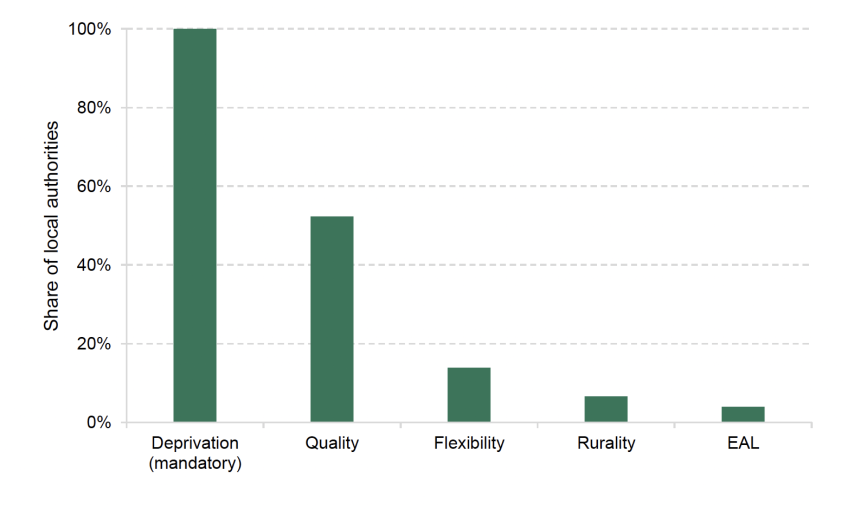
All local authorities use deprivation funding for 3- and 4-year-olds, which is a mandatory requirement. This can be measured in different ways: some areas top up funding for children eligible for the EYPP, others may target providers located in deprived neighbourhoods (e.g. based on the Index of Multiple Deprivation, IMD). Around half of local authorities additionally fund higher quality provision, that is, providers with more qualified staff or who support other local providers to deliver quality provision, at higher rates. Only around 1 in 10 areas support flexibility of provision, for instance, providers who offer wraparound care or out-of-hours provision. This suggests incentivising high quality early years education and childcare and supporting provision for parents who require flexibility (such as shift workers) through higher funding rates is not a universal approach taken by local authorities. Variation in use of quality and flexibility supplements may also have implications how different types of provider fare in different areas. For instance, childminders often provide greatest flexibility of provision, while quality supplements are more likely to benefit group-based providers, whose staff tend to hold more early years qualifications, and providers with more resources to support systems leadership amongst local providers.
Figure 2.6 also highlights that very few areas compensate for rurality and for serving children with EAL. Partly, this is because most areas will not serve especially rural or EAL populations. Yet, the relationship between the use of the supplements, rurality and EAL is not entirely straightforward. For instance, it is local authorities with high, but not the highest, shares of children with EAL that make greatest use of the EAL supplement: no local authorities in the top quartile of children with EAL use the supplement, while 14% of local authorities in the third quartile have an EAL supplement. This suggests that in areas with more homogeneous populations (mostly rural or mostly EAL), support flows through the core funding rate, while in more mixed areas it is useful for local authorities to target support via supplements.
As well as considering how local authorities use the different supplements available to them, it is also important to consider the extent to which they align with the needs of an area. Figure 2.7 plots for each local authority the share of total spending under the EYSFF going to deprivation uplifts against the average level of deprivation in the local authority, measured using the index of multiple deprivation (IMD). The downwards-sloping relationship confirms that more-deprived areas tend to allocate more funding to deprivation supplements: an increase in deprivation equivalent to moving 10 ranks on the IMD is associated with a 5 percentage point increase in the proportion of funding dedicated to deprivation. That said, there is a lot of variation in funding for deprivation amongst local authorities with similar levels of deprivation. It is also notable that some of the local authorities with the most resources dedicated to deprivation are those in the middle of the pack and many are based in London. A number of London boroughs have pockets of deprivation alongside wealthier neighbourhoods, possibly making it more effective to direct resources via supplements compared with more uniformly deprived areas.
Figure 2.7. Value of deprivation supplement by local authority IMD
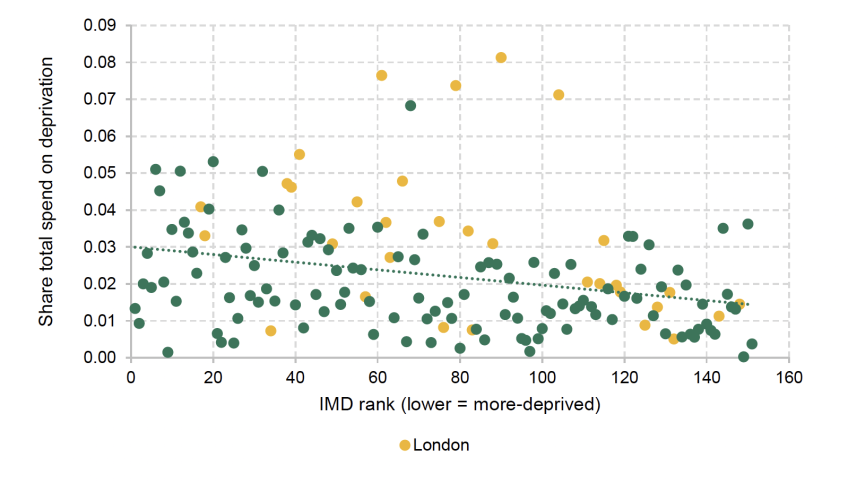
Note: 2019 index of multiple deprivation. Share of total spend under the EYSFF, excluding the DAF and EYPP.
Overall, the EYSFF is a transparent method of allocating funding to different providers within a local area. The requirements for what local authorities can and can’t do with free entitlement funding are relatively restrictive, generating a fair amount of conformity in how money is spent in different places. There are differences, however, in how much areas spend on targeted funding streams (supplements for deprivation, quality, rurality, EAL and SEN inclusion fund), with more-urban and more-deprived areas making greater use of these funding mechanisms. These areas are likely to have a higher prevalence of disadvantaged and SEN children, indicating that funding is responsive to need. Interestingly, some particularly high-need areas make less use of supplements than those in the middle of the pack, suggesting that the funding system provides areas with the flexibility to tailor resource allocation to the needs of the local area.
Understanding how this funding system and differences in approaches across local areas map on to measures of performance in the early years, such as availability and quality of provision, is an important next step for future research (Reed and O’Halloran, 2024).
2.3. Future changes and challenges in the early years
In this section, we return to looking at the early years system from a national perspective to assess what we know so far about the rollout of the new entitlements, to study the impact of more recent policy changes and to look ahead to considerations for the spending review.
Delivery of the new entitlements
Local authorities are responsible for ensuring there is sufficient childcare provision for eligible children to access the free entitlements. Since April 2024, this expanded to 15 hours of childcare per week for 2-year-olds from working families and, from September 2024, for children aged 9 months in working families. From September 2025, these children will be entitled to 30 hours per week.
A widely discussed issue (e.g. Drayton and Farquharson, 2023) is around the deliverability of these entitlements. A key determinant of this is the hourly funding rate the providers receive. As discussed in Section 2.1, for 2024–25 this is relatively generous for younger children (2-year-olds and under), which is expected to incentivise providers to offer the new entitlements.
An early indication of how well the rollout is going comes from Department for Education statistics on the number of childcare codes issued and validated for the new entitlements. Codes are issued by local authorities to children who apply and are eligible for the entitlements; they are validated when children take up a place with a provider. The former offers insight into demand for the new entitlements, while the latter is a proxy for the availability of childcare provision.9 The latest release of statistics covers the full summer term 2024 for 2-year-olds, and data for the autumn term 2024 until 13 October for 2-year-olds and for children aged 9–36 months.
Table 2.2 shows, for England, the number of codes issued (representing the number of children) and the share that have been validated (demonstrating that a child has taken up a place) in the first term of eligibility for the new entitlements. The final row provides a comparison with the 30-hour expansion for 3- and 4-year-olds in September 2017. At the same point in the rollout, the share of interested and eligible children taking up childcare across the age groups looks very similar (at around 85%) and, if anything, it is slightly higher for 1-year-olds (88%). This is encouraging as the market for 1-year-olds is less established than for 2-year-olds, likely requiring more new provision rather than changes in who is paying for existing childcare (Farquharson, 2024). This is also broadly in line with take-up during the rollout of the previous 30-hour offer for 3- and 4-year-olds at 90%. Validation rates have since risen to 96% for 2-year-olds by the end of summer term 2024.
Table 2.2. Codes issued and validated by entitlement and age of child for first term of eligibility in England
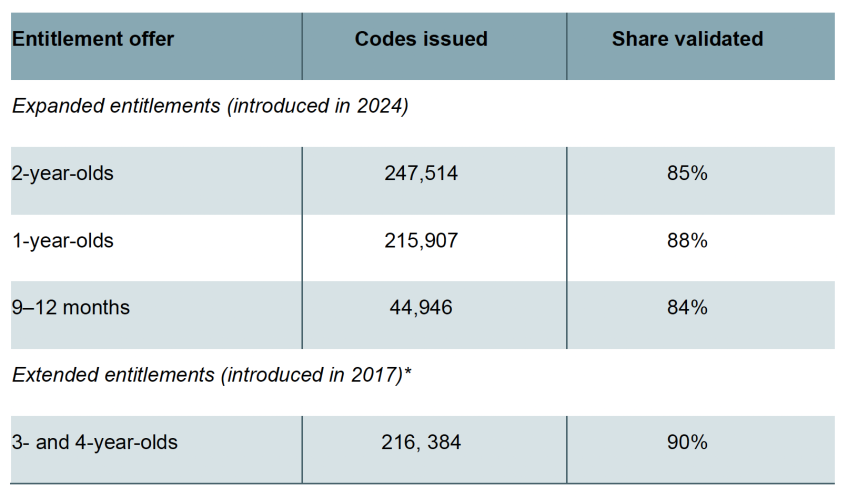
Note: Using the first release of code data for the first term of eligibility to account for validation rates rising over time. For 2-year-olds, this is for summer term 2024 for codes applied for by 31 March and issued and validated by 2 May. For children aged 9–12 months and 1-year-olds, this is for the autumn term 2024 using codes applied for by 31 August and issued and validated by 13 October. * The final row provides code statistics from the previous extension of the free entitlement of 30 hours for 3- and 4-year-olds for comparison. This covers codes issued by 31 August 2017 and validated by 9 October 2017.
Source: Department for Education (2017, 2024c, 2024f).
Taken together, this suggests that the rollout, at least at a national level, is in line with previous expansions. However, as emphasised throughout this piece, childcare provision operates locally, and at this geography there is more scope for demand and supply to become misaligned.
Department for Education (2024f) analysis suggests substantial variation across the country in the percentage of codes validated for the autumn term 2024 for children aged 9–36 months. Overall, local authorities in the north of England exhibit higher validation rates (i.e. higher proportions of approved children taking up a childcare place) compared with the south. Urban areas also tend to have lower rates. Some areas in London as well as local authorities surrounding London have particularly low validation rates compared with elsewhere; for instance, in Haringey, only 74% of childcare codes have been validated, while in Birmingham the figure is 88%. This suggests that eligible and interested parents in more urban areas, particularly in the South East of England, are possibly unable to access free entitlement places or are not well matched to the places on offer.
Upcoming policy changes
The expansion of the free entitlements represents a large change to early years education and childcare in England but is also a continuation of previous government policy. Finally, we consider policies announced since the new government took office that are likely to affect the early years sector, and we look at challenges ahead for the government’s first spending review.
The first policy is capital funding for primary schools to facilitate the conversion of classrooms into nurseries. This scheme comes with a total funding pot of £15 million and can be used by schools to make adjustments to the school estate, such as changing the layout of rooms, providing additional toilets or creating outdoor play areas, in order to meet regulations for nursery provision. The first phase of the programme, which launched in October 2024, aims to support 300 new or expanded nurseries (Department for Education, 2024g), with the aim of ultimately generating 3,000 additional school-based nurseries. Once fully rolled out, this will represent around 30% of the existing number of school-based providers, although these providers currently make up only 20% of places (Department for Education, 2023a).
Additional support for expanding childcare provision will certainly be welcome, especially if the places generated are higher quality, which is an explicit aim of the policy (Labour, 2024). However, there are two key risks that could undermine the scheme’s ability to meet additional demand for childcare places as the new entitlements are expanded.
The first is around when these additional places will become available. Under current timescales, the first tranche of nursery conversions (which represent one-tenth of the target) are expected to come online for the final stage of the expanded entitlements rollout in September 2025 (Department for Education, 2024g). While this policy may generate additional capacity over the longer term, under existing plans it is unlikely to substantially ease supply constraints when they are most acute. As well as the timeliness of the policy, another consideration is where in the country the additional school-based places will become available. The policy is largely targeted at repurposing primary classrooms where pupil rolls are falling, but if there is a geographical mismatch between falls in primary school population and rises in demand for new early years provision, this could prove a challenge to delivering these nursery school targets.
Another set of policies that is likely to affect childcare providers comes from the Autumn Budget 2024. These policies include increases in the rate of employers’ NICs, albeit alongside more generous offsets for small businesses, and rises in the national minimum wage, which will take effect in April 2025.
Early years staff are essential to delivering early years education and childcare, reflected in the high share of providers’ costs that go to staffing (around three-quarters). Changes that raise the cost of employing workers can therefore have significant impacts on providers’ financial position. Moreover, the Autumn Budget 2024 changes will particularly affect younger and lower-paid workers. A full-time early years worker earning £25,000 a year would see the employers’ NICs bill rise by more than a third, while a minimum-wage worker aged 18–20 would see a 16% jump in hourly wage.
Higher wages would be welcome for many early years professionals earning at or near the minimum and could support the drive to recruit around 35,000 additional early years staff by September 2025 (Department for Education, 2024h). But together with changes to NICs, it also adds cost pressures to providers.
The impact of these changes will really depend on the type of early years provider. Most obviously, childminders, who tend to be self-employed or, if they employ an assistant, often fall within the tax-free allowance, would be much less affected. For most providers, however, what matters is the number of employees and how much they are paid. The majority of the tax increase comes through the reduction in the NIC threshold, which affects employers with lower-paid workers most in proportional terms. These are the same providers who will be most likely to be hit by increases in the minimum wage.
These impacts are somewhat offset by a more generous NIC employment allowance, which could particularly help providers with small numbers of employees, as they are unlikely to pay NICs. However, providers are not currently eligible for employment allowance if more than 50% of their business is done in the public sector, which may apply to more early years providers as the free entitlement expands over time. Two illustrative examples of providers who – if eligible for the employment allowance – would stand to benefit under the Autumn Budget 2024 changes are:
- a small provider with six employees (or fewer), each on median earnings of £33k;
- a small provider with seven employees (or fewer) on the current minimum wage.
Providers employing more staff than in these examples would lose out from the changes announced in the Autumn Budget; the bigger the employer, the more so. Although data availability makes it difficult to assess the impact on the early years sector as a whole, these illustrative scenarios highlight which sections of the market are more exposed to these financial pressures. Over the longer term, providers may be able to ‘pass on’ higher costs to workers: on average, around 60% of the impact of the NICs tax rise will eventually be felt by workers, in the form of smaller pay rises and lower wages. This adjustment will be more challenging, however, for providers with many employees at or near the minimum wage.
Targeted funding in the early years
Another important area of early years funding is provisions for children with additional needs, such as low-income children through the EYPP and support for SEN via the DAF. These operate differently from the funding formulas discussed earlier and provide additional payments to providers per eligible child. As shown in Figure 2.8, historically, the low frequency of updating rates has eroded the real value of these funds over time, leaving childcare providers with fewer resources to support higher-needs children. For example, the EYPP rate fell by 9% between 2017–18 and 2021–22. A funding system that is responsive to need is more important in the context of rising demand: although smaller in absolute numbers than rises for primary school age children (Sibieta and Snape, 2024), the proportion of children identified as having SEN and taking up the 15-hour entitlement rose from around 6% to 9% between 2018 and 2024, representing a 30% increase in numbers of pre-school age children with SEN (Department for Education, 2024e).
Figure 2.8. Real-terms funding for the early years pupil premium and disability access fund
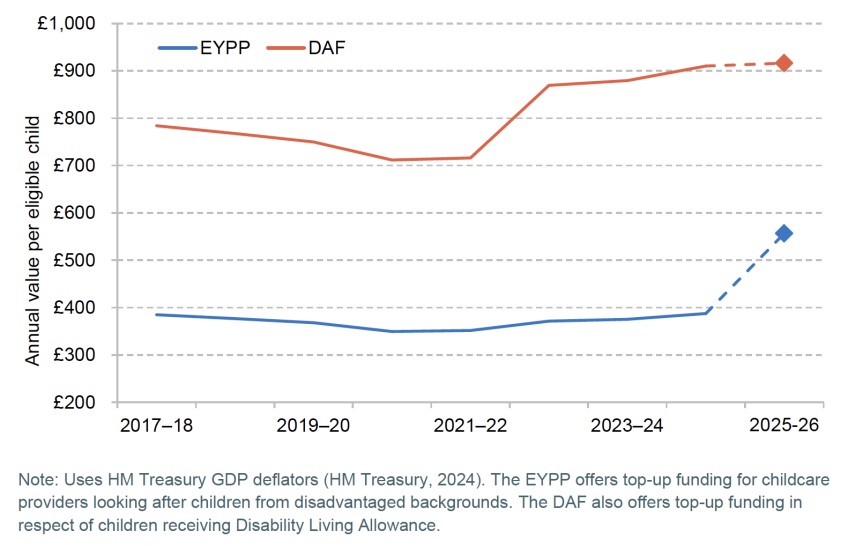
Note: Uses HM Treasury GDP deflators (HM Treasury, 2024). The EYPP offers top-up funding for childcare providers looking after children from disadvantaged backgrounds. The DAF also offers top-up funding in respect of children receiving Disability Living Allowance.
In 2024–25, there has been a 9% cash-terms increase in the EYPP and DAF, as well as an extension of eligibility to younger children, and the introduction of deprivation supplements for the new entitlements (Department for Education, 2024d). Next year will see bigger changes, with EYPP rising to £570 a year, which is a 44% increase in real terms. This is a major uplift, meaning that, for the first time, the value per hour will be comparable to the pupil premium funding that schools receive for disadvantaged pupils (though because EYPP only applies to part-time childcare entitlements, the total funding will still be half as much as for schools).
2.4. Summary
The discussion throughout has raised a number of considerations ahead of the 2025 spending review. In contrast to other areas of public spending, the spending envelope has already been set for spending on early years education, including funding allocated to the new entitlements. Within this allocation, notwithstanding modest rises next year, money has been directed more towards provision for younger children (via higher funding rates) compared with 3- and 4-year-olds, leaving resources for 3- and 4-year-olds at greater risk of losing value. Tax and minimum-wage changes announced at the Autumn Budget 2024 are expected to add cost pressures to providers and exacerbate this risk. The process for setting rates has historically generated uncertainty for providers, with rates frozen for multiple years and inflation eroding their real value, followed by a big adjustment at a spending review or fiscal event (Drayton and Farquharson, 2023). The spending review would be an opportunity to consider a process for setting funding rates that is more responsive to changing financial pressures.
In terms of targeted early years funding, the rise in EYPP next year represents a major increase in real resources for children from disadvantaged backgrounds, children who are less likely to achieve a ‘good level of development’ by the end of Reception. This is particularly welcome as the new entitlements are by and large geared towards reducing the costs of childcare and helping parents into work rather than addressing inequalities in children’s development. It does, however, come on the back of multi-year freezes to EYPP, which reduced the progressivity of the early years funding system.
3. Schools
In the Autumn Budget 2024, the new government chose to increase school spending by £2.3 billion, with the core schools budget increasing in cash terms from £61.6 billion in 2024–25 to £63.9 billion in 2025–26. This allows for a 1.6% real-terms increase in spending per pupil. Coming on the back of an 11% real-terms increase in spending per pupil between 2019–20 and 2024–25, this allows spending per pupil to return to, and exceed, its previous high point in 2010. This is not the full story, however.
Out of the £2.3 billion cash-terms rise in the core schools budget in 2025–26, about £1 billion is focused on the high needs budget, which covers pupils with the highest levels of SEN and disabilities. After accounting for this, the £1.3 billion rise in the rest of the schools budget is likely to amount to a 2.8% rise in cash terms in funding per pupil in mainstream schools in 2025–26, which is a very small real-terms rise relative to economy-wide inflation of 2.4%. In contrast, we estimate that school costs are likely to rise by about 3.6%, which includes the effect of government proposals for a 2.8% pay rise. If these projections are accurate, then core school budgets will feel very tight in 2025–26.
This pattern of seemingly large rises in total school spending per pupil being swallowed up by large increases in high needs funding is a familiar one. About half of the increase in total school spending per pupil between 2015–16 and 2024–25 can be accounted for by rises in high needs funding. As we document in our recent briefing note (Sibieta and Snape, 2024), this reflects rapid increases in the number of pupils with identified needs, particularly those with Education, Health and Care Plans (EHCPs). These plans create statutory obligations to provide specific support to individual children. This has pushed up spending even faster than funding, leading to large deficits across local authorities. These deficits have effectively been moved off balance sheet to prevent local authority bankruptcies. This ‘Statutory Override’ is due to run out in March 2026.
In the rest of this chapter, we present trends in spending per pupil to date and examine the potential pressures on spending in the period covered by the next spending review, particularly 2026–27 and 2027–28. For further details, on the methods used to analyse school spending, please see the accompanying ‘Methods and data’ section at https://ifs.org.uk/education-spending/methods-and-data.
3.1. Total school spending per pupil
Figure 3.1 shows total school spending per pupil aged 3–19 between 2003–04 and 2024–25 broken down into four different components:
- Funding allocated to schools. This includes funding directly allocated to schools and early years providers. Early year funding for children aged 3–4 is included in primary school budgets for past years. We cannot exclude this for all years, so we include early years funding for children aged 3–4 in all years to maintain consistency. This includes funding for special schools and alternative provision. It also includes high needs top-ups and place-funding provided to state-funded mainstream and special schools.
- Local authority spending. This includes central spending on a range of services for pupils with SEN, admissions, transport and other services.
- Sixth-form funding. This is funding provided to schools for pupils aged 16–19. We include this given that it is often included within total secondary school expenditure figures.
- Extra funding for employer pension contributions. From September 2019, schools received about £1.5 billion in extra funding to meet the cost of higher employer pension contributions. From April 2024, they were provided with a further £1.1 billion to cover another increase in employer pension contributions. We often present figures with and without this extra funding for comparisons over time as the funding was directly intended to compensate schools for higher costs.
Combining all these factors, we calculate total school spending as nearly £70 billion in 2024–25, or nearly £73 billion if we include all recent employer pension contribution grants. This is higher than the core schools budget for England presented by the government, which was £61.6 billion in 2024–25 (this covers school funding for pupils aged 5–16). This can be mostly explained by the fact that we include £3 billion in post-16 funding and over £4 billion in early years funding, as well as additional services provided by local authorities that are funded through the wider local government settlement. However, as we shall show directly below, our measure appears to show faster growth in total school spending per pupil in 2024–25 than the core schools budget on what should be an equivalent basis.
In 2003–04 (the earliest year for which we can produce this consistent set of figures), total school spending stood at about £6,500 per pupil in 2024–25 prices. This rose by 23% in real terms up to 2009–10, reaching a high point of £8,000 per pupil. After 2009–10, spending per pupil fell by 9% in real terms to reach £7,300 in 2019–20, taking spending per pupil back to around the level last seen around 2006.
Up to 2009–10, each of the components rose by similar amounts. After 2009–10, the different components evolved very differently. Per-pupil funding provided to schools rose by around 4% in real terms between 2009–10 and 2019–20. In contrast, local authority spending on services fell by 57% over the same period. A large part of this contrasting pattern is mechanical, reflecting a transfer of funding and responsibilities from local authorities to both academies and maintained schools. There was also a big drop in sixth-form funding. As we show in Chapter 4, school sixth-form funding per pupil fell 28% over this period.
Figure 3.1. Total school spending per pupil by component (2024–25 prices)
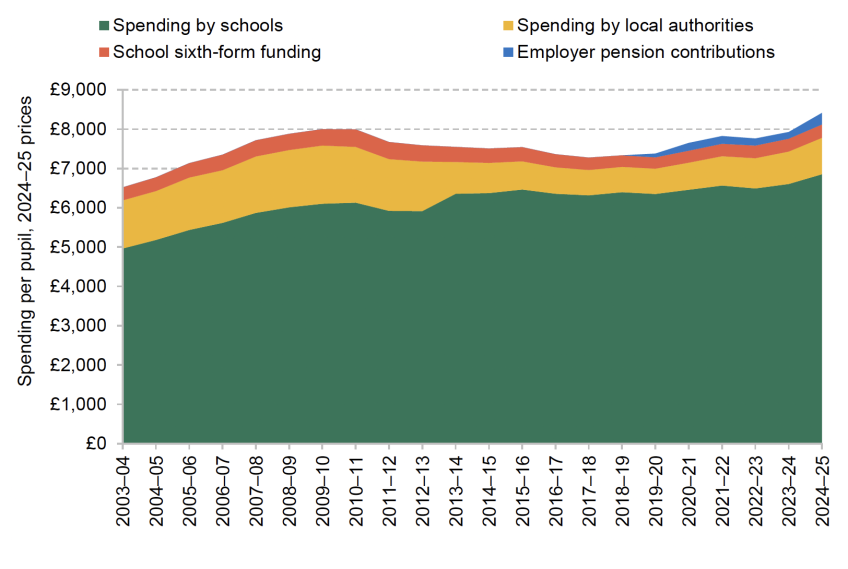
Note and source: See ‘Methods and data’ at https://ifs.org.uk/education-spending/methods-and-data. No data are available for 2020–21, so these are imputed based on a constant real-terms growth rate between 2019–20 and 2021–22. HM Treasury (2024).
Since 2019–20, school spending per pupil has begun to grow again in real terms. Between 2019–20 and 2024–25, we estimate that spending per pupil grew by more than 11% in real terms. This results from an £8 billion increase in total school spending over these five years, as well as the £1.1 billion extra in July 2024 to cover the costs of the 2024 teacher and support staff pay awards, over and above what schools could already have afforded.
As shown in Figure 3.2, this already takes total school spending per pupil in 2024–25 back to the level of its most recent high point in 2009–10. In the Autumn Budget 2024, the government announced a £2.3 billion increase in school spending for 2025–26. This amounts to a 1.6% real-terms increase in spending per pupil, and would take spending per pupil about 3% above its previous high point in 2010.
Figure 3.2. Growth in school spending per pupil and costs between 2019 and 2024–25 under various definitions
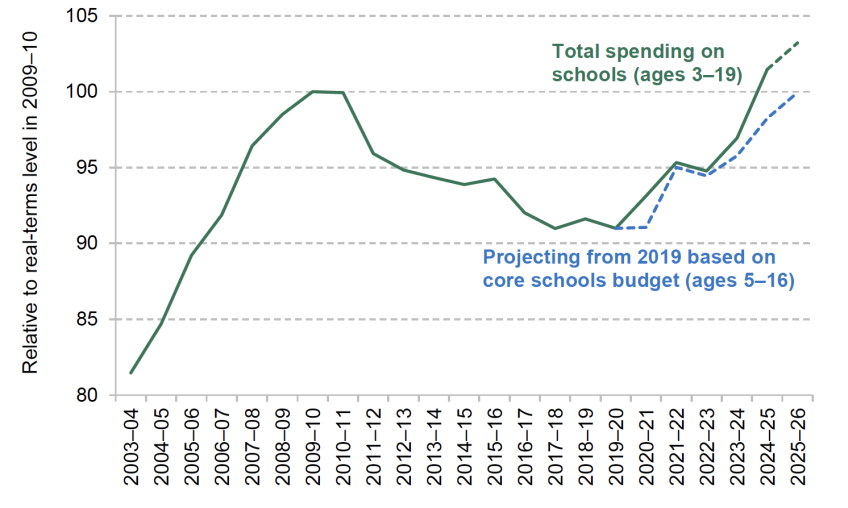
Note and source: See ‘Methods and data’ at https://ifs.org.uk/education-spending/methods-and-data for cash-terms spending per pupil up to 2024–25. Cash-terms spending per pupil forecast for 2025–26 based on figures for the core schools budget (excluding pensions grants) published in the Autumn Budget 2024 (see https://www.gov.uk/government/publications/autumn-budget-2024) and national pupil projections (https://explore-education-statistics.service.gov.uk/find-statistics/national-pupil-projections). See also HM Treasury (2024).
Figure 3.2 also shows the growth in school spending per pupil if spending per pupil exactly followed the growth in the national core schools budget (excluding pensions grants). Up to 2022–23, the two series are relatively close together. For 2024–25, we see a significant gap. Our measure of total school spending per pupil increases by 5% in real terms, or by £3 billion in 2024–25 prices. In contrast, the core schools budget increased by £1.5 billion (excluding pension grants) or about a 3% rise in spending per pupil in real terms.
As shown in Figure 3.3, this drives a large difference in growth in spending per pupil across the two measures between 2019–20 and 2024–25. We see 11.5% real-terms growth in our measure based on total planned school spending by local authorities (excluding the pensions grants), which compares with 8.0% real-terms growth in the core schools budget in per pupil terms (also excluding pensions grants). These figures are naturally higher if we include the effect of the £2.6 billion in pension grants (combining grants that began in September 2019 and April 2024).
Given that the core schools budget only covers pupils aged 5–16, it is important to narrow planned spending by local authorities down to the same age group (which we can do for recent years, but not for earlier years). This reduces the real-terms growth in total planned spending on schools down to 10.9%, which is still 2.9 percentage points higher than the 8% growth in the core schools budget per pupil.
Figure 3.3. Growth in school spending and funding per pupil between 2019–20 and 2024–25 under various definitions
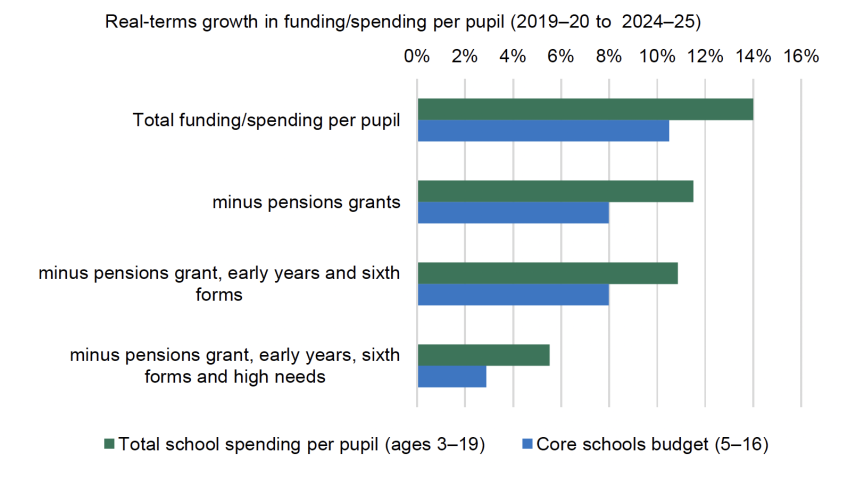
Note and source: Total spending per pupil reflects planned spending by local authorities on schools as defined in Figure 3.1 and further described at https://ifs.org.uk/education-spending/methods-and-data. Early years spending excludes all funding for 3- and 4-year-olds as part of planned spending by local authorities (spending on younger ages is already excluded). Sixth-form spending is defined in Figure 4.2. The core schools budget covers pupils aged 5–16 only, and figures are taken from the Autumn Statement 2022 (https://www.gov.uk/government/topical-events/autumn-statement-2022) and Autumn Budget 2024 (https://www.gov.uk/government/publications/autumn-budget-2024). Planned spending and funding for high needs are taken from Sibieta and Snape (2024). Pupil numbers are taken from Department for Education, national pupil projections (https://explore-education-statistics.service.gov.uk/find-statistics/national-pupil-projections) and figures provided by the Department for Education. See also HM Treasury (2024).
In the final set of bars, we exclude high needs funding from central government and planned high needs spending by local authorities. This reduces the gap in growth rates slightly to 2.6 percentage points, reflecting the faster growth in planned spending than in funding. However, this analysis also shows the importance of the growing cost of high needs provision in explaining trends in funding and spending. After accounting for growth in high needs funding, the growth in funding per pupil drops from 8.0% to 2.9%. Similarly, the growth in planned spending per pupil drops from 10.9% to 5.5%. As such, the growth in the cost of high needs provision can explain over half of the growth in funding and spending between 2019–20 and 2024–25. It may also explain why schools leaders might have still felt a squeeze on mainstream school budgets despite large apparent growth in total funding per pupil.
3.2. Average spending by primary and secondary schools
Figure 3.4 shows our estimates for the level of primary and secondary school spending per pupil in England from the late 1970s through to 2022–23 (in 2024–25 prices), together with projections up to 2025–26. Real-terms changes are shown relative to the GDP deflator. Actual figures up to 2022–23 are based on spending levels by individual schools, which excludes spending undertaken by local authorities and spending on special schools. As a direct result, growth in spending per pupil during the 2000s and 2010s is higher than in Figure 3.1. This is because funding (and the responsibility for delivering various functions) was moved from local authorities to individual schools. Projections are based on underlying growth in mainstream school funding per pupil (i.e. the core schools budget minus high needs and pensions grants).
We see that spending per pupil has evolved in a number of distinct phases:
- Modest growth over the 1980s and 1990s. Under the period of Conservative government between 1979 and 1997, real-terms spending per pupil rose by about 1.4% per year in primary schools, and by about 1% per year in secondary schools.
- Rapid growth over the 2000s. From 1999 onwards, spending per pupil grew rapidly. As a result, we see that primary school spending per pupil grew by about 5.9% per year under the period of Labour government between 1997 and 2010, and by about 5.1% in secondary schools.
- Spending squeeze over the 2010s. There was a squeeze on funding between 2010 and 2019. Secondary school spending per pupil fell by about 0.9% per year between 2010 and 2019, whilst primary school spending per pupil rose by 0.6% per year. This averages out to a small real-terms cut in spending per pupil over the decade. It is smaller than that implied in Figure 3.1 as individual schools were taking on funding and responsibilities previously assigned to local authorities over this period. Secondary schools saw a worse picture mainly due to big reductions in school sixth-form funding.
- Recovery in spending since 2019. Since 2019, we have seen a recovery in spending per pupil, with 1% per year real-terms growth in primary and secondary school spending per pupil between 2019 and 2024. This reflects increases to the schools budget delivered in the 2019 and 2021 spending reviews, and extra grants to cover higher-than-expected staff pay awards. It will also include the effects of additional pensions grants.
- Modest growth expected in 2025. For next year, we expect modest real-terms growth of 0.5% in spending per pupil. Whilst the overall schools budget is growing by £2.3 billion in cash terms, about £1 billion of this is focused on high needs provision, which means we only expect very modest growth in primary and secondary school spending per pupil.
Figure 3.4. Primary and secondary per-pupil spending by schools, actual up to 2022–23 and forecasts up to 2025–26
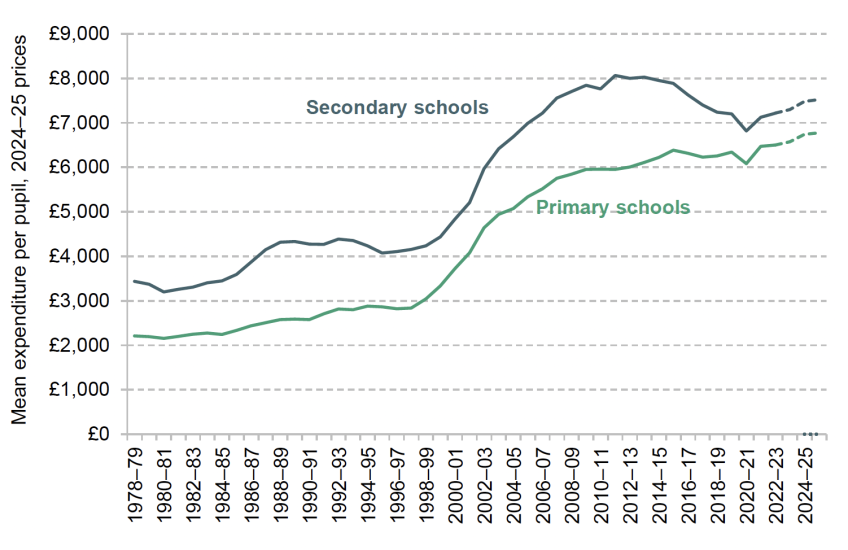
Note and source: See ‘Methods and data’ at https://ifs.org.uk/education-spending/methods-and-data. Projections from 2022–23 based on growth in core schools budget less pensions grants and high needs funding as calculated in Figure 3.3. HM Treasury (2024).
Two long-terms trend emerge from this analysis. First, there have clearly been cycles in the growth of spending per pupil. Over the long run, primary school spending per pupil has grown by about 2.4% per year in real terms, and by 1.7% in secondary schools. This averages out across phases to about 2% per year across all schools. However, growth has clearly not been even over time. Modest growth or cuts during the 1980s and 1990s were followed by large increases during the 2000s, which were in turn followed by cuts and freezes during the 2010s. Whilst we have seen some recovery in spending per pupil since 2019, the modest rates of growth we see (about 1% per year or less in real terms) are still below the long-run average growth rate.
Second, the gap between secondary and primary school spending has fallen significantly over time. In the 1980s, secondary school spending per pupil was about 56% higher than primary school spending per pupil. This narrowed to 49% in the 1990s and then to 30% in the 2000s. This narrowing continued through the 2010s, and the secondary–primary school funding difference is due to be only 11% in 2025–26. Some of the recent narrowing reflects that primary schools have benefited more from the transfer of responsibilities and funding from local authorities to schools. However, this is also clearly part of a long-term relative shift in funding and resources from secondary to primary schools.
3.3. Growth in school costs
Whilst we have seen robust real-terms growth in total school funding per pupil since 2019–20, there are lots of reasons to believe that the actual picture for mainstream school budgets is a bit tighter. We have already shown how the rapid growth in the cost of high needs provision accounts for about half of the growth in real-terms funding per pupil. There are also good reasons to think that the actual costs faced by schools might have grown faster than economy-wide inflation (as captured by the GDP deflator) in recent years. The reason for this divergence results from the specific way in which the GDP deflator measure of economy-wide inflation is calculated. In particular, it focuses on domestic prices and largely excludes the effects of rises in the price of imports. This matters a great deal in recent times as imports of food and energy have played a big role in driving overall inflation, which has in turn led to higher wage demands.
With this in mind, Figure 3.5 compares cash-terms growth in funding per pupil with estimated growth in school costs and the GDP deflator. We also show forecasts for 2025–26 through to 2027–28, which are helpful for considering the pressures in the upcoming spending review. For the period up to 2024–25, school costs are estimated based on actual staff pay awards, Department for Education estimates of pay drift and the cost of changes to employer pension contributions, and consumer price index (CPI) inflation. For 2025–26, we assume pay awards follow the 2.8% recommendation from Department for Education to the School Teachers’ Review Body (Department for Education, 2024b). For 2026–27 onwards, staff pay awards are projected based on Office for Budget Responsibility forecasts for average earnings. Changes in cash-terms funding per pupil are based on the core schools budget and central government funding for high needs (as represented by the high needs block plus direct funding, as documented in Sibieta and Snape (2024).
The first clear conclusion is that the growth in cash-terms total funding per pupil always exceeds growth in mainstream school funding per pupil (here represented by total funding minus high needs funding10). Growth in mainstream funding per pupil averages around 1 percentage point below growth in total funding per pupil. In 2025–26, mainstream funding per pupil is growing by 2.8% in cash terms, about 1.2 percentage points less than 4% cash-terms growth in total funding per pupil.
When looking at comparisons with costs, we see an evolving picture over time. During the pandemic, the GDP deflator was extremely volatile, reflecting the big swings in measured GDP. For 2020–21 and 2021–22, school costs are likely to be the fairer measure of inflation for schools. For these two years, we see mainstream school funding per pupil growing slightly faster than the growth in costs, indicating real-terms growth. For 2022–23, we see mainstream funding per pupil growing slightly less than school costs and the GDP deflator. For 2023–24, we see mainstream funding per pupil growing slightly faster than school costs and the GDP deflator.
Figure 3.5. Estimated growth in school costs and funding over time by component, actual spending plans up to 2025–26
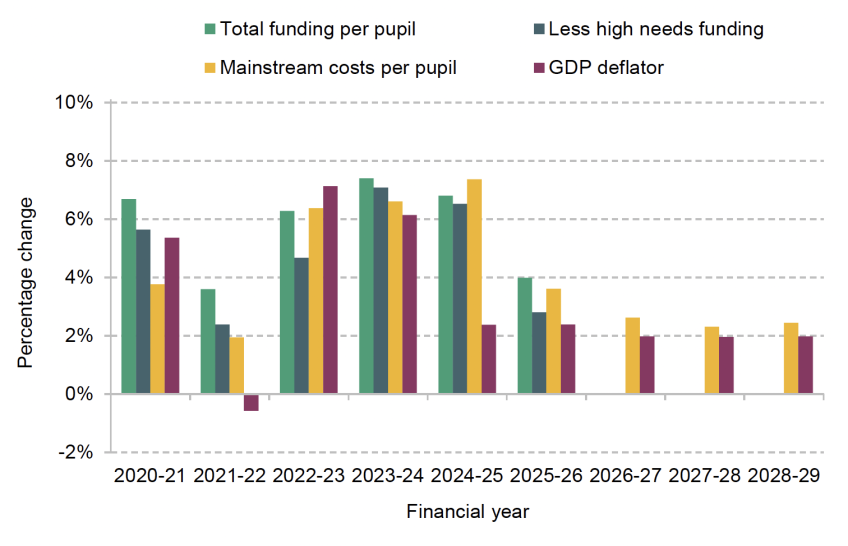
Note and source: Funding figures are based on the same methods and sources for the core schools budget and high needs block as detailed in Figure 3.3. Teacher pay figures are based on a weighted average of paybill per head growth of 2.75% in September 2019, 3.1% in September 2020, 0% in September 2021, 5.4% in September 2022, 6.5% in September 2023 and 5.5% in September 2024. Assumed pay drift of 0.2% in 2021–22, –0.2% in 2022–23, 0.1% in 2024–25 and zero for all other years. Increase in teacher costs includes the rise in employer pension contributions from September 2019 and April 2024. Pay per head figures do not include the temporary Health and Social Care Levy during 2022–23. Figures taken from or estimated from Department for Education ‘Schools’ costs: technical note’: 2020 to 2021, 2021 to 2024, 2022 to 2024 and 2023 to 2025 (https://www.gov.uk/government/publications/schools-costs-technical-note). Increases in costs of other staff pay per head taken from Department for Education schools’ costs notes: 2020 to 2021, 2021 to 2024 and 2023 to 2025, plus an assumed average pay award of 4.5% for 2024–25. Pay drift and pensions costs for other staff also match the schools’ costs notes assumptions. Staff pay awards are assumed to follow projected growth in average earnings for 2025–26 onwards, as detailed in the Office for Budget Responsibility’s Economic and Fiscal Outlook – October 2024 (https://obr.uk/efo/economic-and-fiscal-outlook-october-2024/). Other costs assumed to grow in line with actual CPI inflation up to 2023–24 and Office for Budget Responsibility forecasts after that, as detailed in the Economic and Fiscal Outlook – October 2024. As assumed in Department for Education schools’ costs notes (2022 to 2024 and 2023 to 2025), we also add additional amounts for the rising costs of SEN provision (0.6% in 2022–23, 0.5% in 2023–24, 0.3% in 2024–25 and an assumed 0.25% thereafter).
In 2024–25, we see a more complicated picture. Mainstream school funding per pupil grew by around 6.5% in cash terms, which is well above the GDP deflator of 2.4% and indicates real-terms growth from an economic perspective. However, mainstream school costs probably grew by about 7.4%. This faster growth in school costs reflects higher employer pension contributions for teachers, which rose from 23.6% to 28.6% of gross salary in April 2024, and above-inflation pay awards of 5.5% for teacher and about 4.5% on average for support staff. Therefore, whilst there was real-terms growth in spending per pupil, growth in funding per pupil didn’t seem to quite cover school costs.
We see a similar picture emerging for 2025–26. Mainstream school funding per pupil is due to rise by about 2.8% in cash terms, which just about matches the GDP deflator. However, we project that school costs are likely to rise by 3.6%. This reflects the full financial year effect of the September 2024 teacher pay award and an assumed pay award of 2.8% for 2025, based on the government’s evidence to the School Teachers’ Review Body. Another interpretation is that schools probably can’t afford a pay award of 2.8% in 2025, as things stand. They can probably only afford pay awards of closer to 2% from existing budgets. Note that these estimates of school costs exclude the cost of rises in employers’ NICs and the promised compensation for schools. This should be neutral at a national level as the government has committed to providing schools with compensation to cover the total cost to schools.
Figure 3.5 then projects school costs further into the future. This shows school costs growing by just over 2% as compared with exactly 2% for the GDP deflator. This reflects projected average earnings growth and CPI inflation being slightly above 2%, and an assumed 0.25% growth in the cost of high needs provision per year.
3.4. Future spending pressures
School funding after 2025–26 will be determined as part of the planned spending review later in 2025. Given the tight picture on overall public spending, policymakers will no doubt be seeking options for savings. With this in mind, Figure 3.6 sets out some options and scenarios for the core schools budget after 2025–26.
The green bars show that the core schools budget is due to rise to about £62.4 billion in 2025–26, in today’s prices. As discussed in Chapter 1, pupil numbers are expected to fall by about 2% between 2025–26 and 2027–28. If the government chose to freeze spending per pupil in real terms, it could make savings of about £1.2 billion. This is a lower level of savings than we concluded prior to the 2024 election (Sibieta, 2024), which reflects the fact that pupil numbers are falling at a slightly slower rate than previously forecast (a 3% fall in pupil numbers under old forecasts from July 2023). As illustrated in Chapter 1, recent ONS forecasts imply rising numbers of primary school age children from 2027 onwards. Banking savings from falling pupil numbers now is therefore also not without risk.
As per Figure 3.5, we project that the growth in school costs is likely to be slightly higher than economy-wide inflation. If the government wanted to compensate schools for this forecast growth in school costs, it would need to allocate a further £600 million in 2027–28, which shrinks potential savings in half.
Figure 3.6. Plans and potential increases in schools budget, 2024–25 to 2027–28
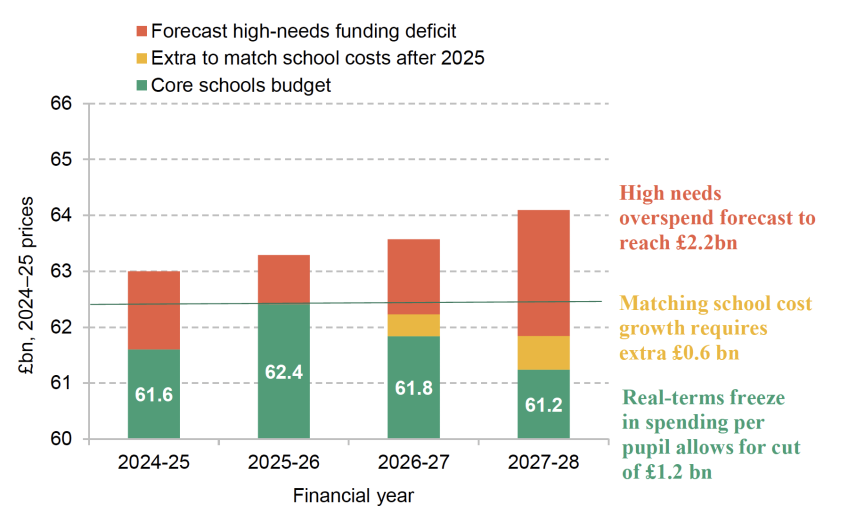
Note and source: Core schools budget up to 2025–26 taken from Autumn Budget 2024 (https://www.gov.uk/government/publications/autumn-budget-2024), and forecast on the basis of Department for Education, national pupil projections (https://explore-education-statistics.service.gov.uk/find-statistics/national-pupil-projections) and HM Treasury (2024). Schools cost growth taken from Figure 3.5; forecasts for the high needs deficit taken from Sibieta and Snape (2024).
Finally, this picture is hugely complicated by potential spending on high needs. As discussed in Sibieta and Snape (2024), local authorities have been spending significantly more on high needs provision than initially planned and more than their level of high needs funding from central government. This has led to large deficits, which have been accumulating over time. The government has used the ‘statutory override’ to keep these deficits off local authority books and prevent many from having to declare bankruptcy. The National Audit Office estimates that the gap between funding and spending was about £1.4 billion in 2024–25, and quotes government forecasts for spending needs increasing by £2–3 billion in cash terms between 2024–25 and 2027–28 (National Audit Office, 2024). These forecasts were published before the government added £1 billion to the high needs budget for 2025–26, which will likely reduce the gap between funding and spending to around £900 million in 2025–26. However, because of continued forecast growth in numbers, the gap between spending and funding would still likely rise to about £2.3 billion in 2027–28 (in 2024–25 prices) under current forecasts for spending and assuming a real-terms freeze in funding.
This is the default scenario, and it is important to state that these overspends represent actual spending by the public sector on schooling. Indeed, the combined total levels of the core schools budget and high needs deficits for 2024–25 and 2025–26 come closer to the actual level of public spending on schools in those years. The government cannot assume that overspends keep on happening, especially as the statutory override is due to expire in March 2026.
The government has signalled a strong desire to reform high needs funding and provision, with more core provision in mainstream schools. However, reforming the system and creating new provision will almost certainly entail significant costs, probably in the billions rather than hundreds of millions. As such, the scope for savings in the schools budget seems incredibly slim. It seems more likely that policymakers will come under huge pressure to increase spending.
3.5. School capital spending
Lastly, we consider capital spending on school buildings and maintenance. Figure 3.7 shows the historical trends in education capital spending in England back to 2002–03, including plans up to 2025–26. For recent years, we also illustrate the share taken up by school maintenance and repair, free schools and spending on further education colleges (where available). Before 2020, almost all of spending will have been focused on schools.
Total capital spending on education in England was about £6.3 billion in 2023–24. This reflects different types of capital spending. In 2023–24, about £1.8 billion was devoted to school maintenance and repair, £900 million was spent on free schools, £900 million was spent on rebuilding further education colleges, with about £2.7 billion on new schools and other aspects of capital spending. Interestingly, the actual level of capital spending seems to be about £900 million less than previous plans from a year ago. This is likely to reflect the significant delays in the school rebuilding programme.11 Money for these delayed projects will either need to come out of allocations from 2024–25 onwards, or the plans will need to be scaled back.
Figure 3.7. Education capital spending in England over time, actual and plans in 2024–25 prices
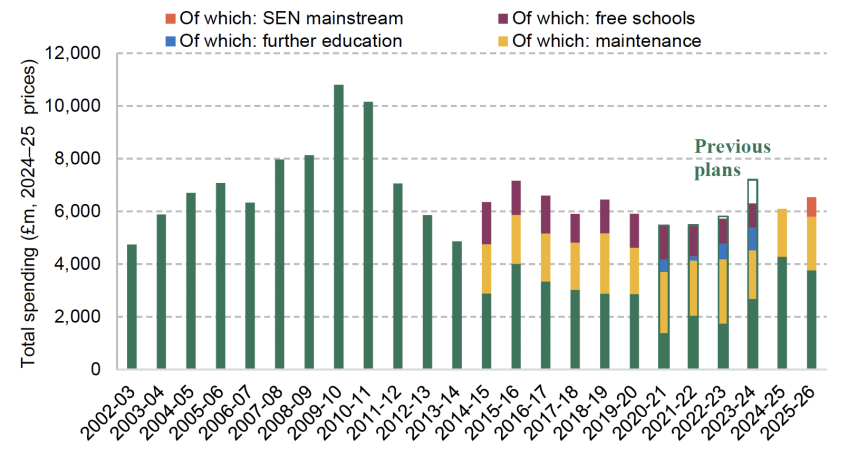
Source: HM Treasury Public Expenditure Statistical Analyses 2024, 2023, 2020, 2019, 2014, 2013, 2010 (https://www.gov.uk/government/collections/public-expenditure-statistical-analyses-pesa) and 2008 (https://www.gov.uk/government/statistics/public-expenditure-statistical-analyses2008). Capital spending on further education capital and free schools taken from Department for Education supplementary and main estimates (various years, https://committees.parliament.uk/committee/203/education-committee/publications/10/estimate-memoranda/). School maintenance and repair spending (https://www.gov.uk/guidance/school-capital-funding). 2025–26 plans taken from HM Treasury, Autumn Budget 2024 (https://www.gov.uk/government/publications/autumn-budget-2024). See also HM Treasury (2024).
The government also faces the cost of addressing RAAC in schools. The government has provided schools with support through two main mechanisms. First, some schools have received grants for repairs and works (totalling £181 million in 2023–24,12 with further grants in future years). Second, some costs will be met through the school rebuilding programme, given the scale of the work required.
For 2024–25, government plans still imply spending of about £6.1 billion, matching previous plans. In the Autumn Budget 2024, the government set out education capital spending plans of £6.5 billion for 2025–26. From this amount, the government has already committed to about £2.1 billion for school maintenance (about equal to the average real-terms spending over the past decade). It has also committed £740 million to help mainstream schools adapt infrastructure to expand core provision for SEN and disabilities. This leaves about £3.8 billion, which will need to cover school and college rebuilding projects, the costs of addressing RAAC, as well as any other capital plans.
As can be seen, capital spending tends to be lumpy over time. There was a large increase in spending in the late 2000s, with spending increasing from nearly £7 billion in the mid-2000s to over £10 billion in 2009–10 and 2010–11 (all in today’s prices). The large increase reflects the last Labour government’s Building Schools for the Future programme, with delays in this programme leading to the big upticks in spending in 2009–10 and 2010–11. There was then a large decline up to 2013–14. Since then, overall capital spending has oscillated around £6–7 billion per year in today’s prices. Plans for 2025–26 remain well within this range and thus not significantly different from experience over the last decade. Furthermore, the fact that plans include further education college rebuilding may mean the underlying level of school capital spending is lower than over the past decade. The planned level of education capital spending is also similar to the level last seen in the mid-2000s.
The big question is whether spending is meeting current needs. National Audit Office (2023) reported that the Department for Education calculated it needed about £5 billion per year from 2021 to 2025 in order to maintain school buildings and mitigate the most serious risks. This was based on a survey of the condition of school buildings. It instead requested about £4 billion per year based on the rate at which it could increase spending. HM Treasury allocated about £3 billion per year. As a result, actual funding allocations from government have been more than 40% below government-assessed levels of need.
For 2025–26, school maintenance spending is due to be about £2.1 billion, which is about 13% higher than in 2024–25, but still about the same level in real terms as the average over the past decade. This strongly suggests that school maintenance spending remains well below government-assessed levels of need.
In summary, spending on school buildings is relatively low in historical terms and low compared with levels of need for maintenance and repair. Based on the analysis of the National Audit Office and Department for Education, there is a strong case for increasing spending on school buildings. With a small drop in the pupil population over the next few years, there might be some scope to redirect funding from new schools towards repairs and maintenance.
In the Autumn Budget 2024, the government chose to top-up capital spending allocations for future years, particularly 2025–26. However, total capital spending across departments is only expected to rise by 3% in real terms in 2026–27 and is due to be frozen in real terms in 2027–28. This suggests little scope for further significant increases in school maintenance spending over the next two-year spending review period.
3.6. Concluding summary
Since 2019, the core schools budget in England has increased by nearly £7 billion (in today’s prices), including the £2.3 billion extra funding announced in the Autumn Budget 2024. This has enabled school funding per pupil to rise by 10% in real terms up to 2025–26, which more than reverses previous cuts. However, this is not the full story. There has been a rapid increase in the costs of SEN provision. About half of the total increase in school funding has been focused on high needs funding. This may explain why school leaders have felt their budgets squeezed by more than might be implied by large increases in overall funding.
The upcoming spending review is likely to see this pattern continue. With a tight picture on overall public spending, the government will be looking to make savings. Falling pupil numbers mean the government could deliver an annual saving of £1.2 billion in 2027 just by protecting spending per pupil in real terms. However, the government also projects a £2.3 billion increase in spending on SEN, which seems likely to wipe away any prospects of savings. The government has provided strong indications it will look to reform the SEN system, but this is likely to cost money too, at least in the short run.
4. Further education and skills
Further education encompasses a wide range of academic and vocational courses taken by young people and adults. In this chapter, we divide further education into 16–18 education and adult education. We begin by examining spending on 16–18 education, which covers funding for students pursuing academic and technical qualifications in school sixth forms, sixth-form colleges and further education colleges. We then turn to adult education and apprenticeships, analysing how spending has changed and the key challenges.
Of all areas of education spending, further education faced the deepest cuts in the decade following 2010. This reflects a persistent historical trend: when overall spending increases, further education tends to receive smaller boosts, and when budgets are tightened, it often bears the brunt of the reductions. While there has been additional funding for the sector since 2019, including an additional £300 million announced in the Autumn Budget 2024, the increases have fallen short of reversing the substantial real-terms cuts experienced since 2010.
4.1. 16–18 education
There are currently around 1.6 million people aged 16 to 18 in further education and training in England.13 These young people follow a variety of educational pathways that are publicly funded. Most 16–18 education takes place in school sixth forms or colleges, which together number over 2,800 institutions with approximately 2,400 school sixth forms (including academies). The funding that these institutions receive depends not only on the number of students but also on the types of courses they offer.
Spending per student over time
Figure 4.1 illustrates funding per student aged 16–18 in school sixth forms, further education colleges, and sixth-form colleges across academic years starting from 2013–14 (the earliest year available in the allocations data). For this graph and the analysis that follows, we focus on the funding allocated per student aged 16–18, rather than the actual expenditures on individual students. Actual spending can vary depending on how schools and colleges distribute their budgets across different stages of education.
Figure 4.1. Funding per student in further education colleges, sixth-form colleges and school sixth forms
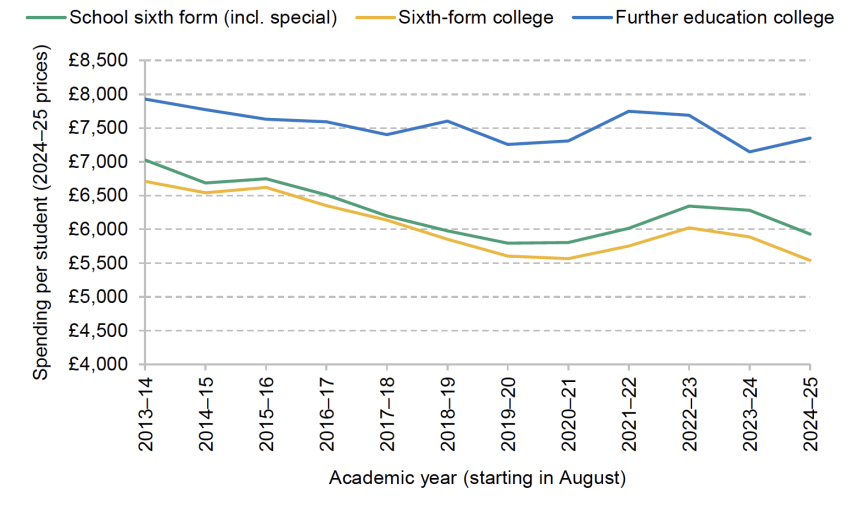
Note: See ‘Methods and data’ at https://ifs.org.uk/education-spending/methods-and-data.
Source: HM Treasury (2024).
Funding per student aged 16–18 has consistently been higher in further education colleges than in school sixth forms and sixth-form colleges. This is because further education college students are more likely to pursue vocational qualifications and often come from more disadvantaged backgrounds, both of which attract increased funding levels. In the 2024–25 academic year, projected funding per student in further education colleges is approximately £7,350, compared with £5,900 in school sixth forms and £5,500 in sixth-form colleges.
Between 2013–14 and 2019–20, real-terms funding cuts affected school sixth forms and sixth-form colleges similarly, with a decrease in the range of 16–18%. Further education colleges experienced smaller cuts of 8% over the same period. This difference is partly due to the higher prevalence of vocational qualifications in further education colleges, which have benefited from targeted funding initiatives such as the Capacity and Delivery Fund (CDF). Another factor is the decline in part-time study at further education colleges: the share of part-time students aged 16–18 dropped from 17% in 2013 to just 10% by the end of the decade. This shift has contributed to an increase in funding per student.
Since 2019, additional funding has been allocated to further education. Between 2019 and 2024, the previous government increased cash-terms funding by about £2.3 billion. However, rising student numbers and inflationary pressures mean that funding per student has not increased significantly beyond the levels in 2019–20. For the current academic year (2024–25), real-terms funding per student is about 1% higher in further education colleges and 2% higher in school sixth forms compared with 2019–20, while it is about 1% lower in sixth-form colleges. This means that funding for students in school sixth forms is 11% lower, and in sixth-form colleges 15% lower, than a decade ago. Whilst higher in absolute value than in school sixth forms and sixth-form colleges, further education college spending per student is also 5% lower than a decade ago.
Figure 4.2 provides a clearer picture of how per-student spending in school sixth forms and colleges has shifted over time, starting from 1989–90 for colleges (and from 2002–03 for school sixth forms) to the present, and projections to 2025–26. Due to data limitations, spending for further education and sixth-form colleges is combined into a category of ‘16–18 colleges’, and trends in expenditure are shown by financial year rather than by academic year.
Figure 4.2. Spending per student in 16–18 colleges and sixth forms (actual and projected for 2025–26)
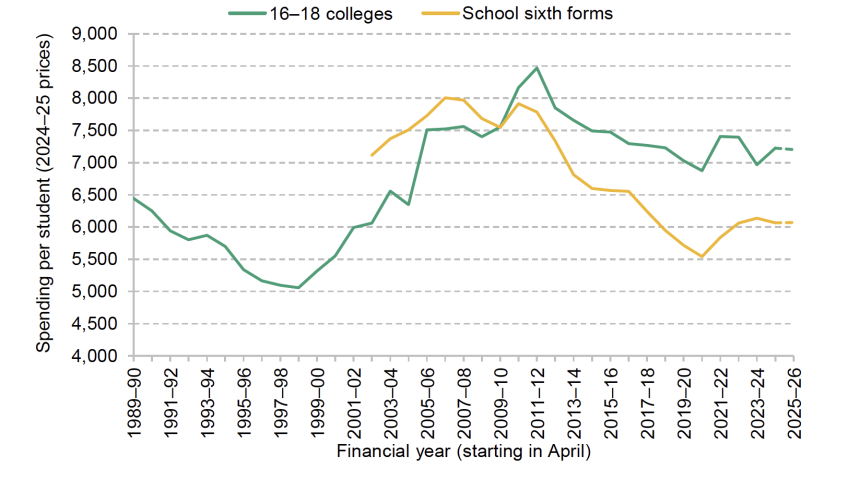
Note: See ‘Methods and data’ at https://ifs.org.uk/education-spending/methods-and-data.
Source: HM Treasury (2024).
Since the start of public spending cuts in the 2010–11 financial year, spending per student has declined across both types of institutions. Between 2010–11 and 2019–20, college spending per student dropped by 14%, while school sixth forms saw a much sharper decline of 28%. For colleges, this reduction brought per-student spending back to roughly the same level as in
2004–05. School sixth-form funding fell to its lowest point in the data series, which extends back to 2002.
Overall, spending per-student in 16–18 education across all institutions has increased by 4% in real terms between 2019–20 and 2024–25. Even with additional funding, levels will remain significantly below those of 2010–11. In 2024–25, funding for colleges, encompassing both further education and sixth-form institutions, is expected to be around 11% lower per student than it was in 2010–11, while spending in school sixth forms is projected to be 23% below 2010–11 levels. Thus, the increased funding from the last government only partially offsets the cuts of the previous decade.
Figure 4.2 also includes projections for funding levels in 2025–26. Funding is expected to rise following the Autumn Budget 2024 where the government committed ‘an additional £300 million for further education in England’. While the precise allocation of this funding has not yet been confirmed, in Figure 4.2 we assume that it flows through the 16–19 budget.
This additional money builds on funding for 2025–26 previously announced last autumn in conjunction with the announcement of the Advanced British Standard (ABS). Despite the ABS being scrapped by the new government, funding has already been allocated for 2025–26 to increase advanced maths premium payments and introduce a new core maths premium. The additional money allocated for 2025–26 is just enough to maintain funding per student at the same level in real terms as the previous year. Spending per student thus remains low in historical terms in both colleges and sixth forms.
The challenges facing 16–18 education
Further education colleges and sixth forms have faced a sustained real-terms decline in funding. With the spending review in 2025 set to determine future funding levels, the sector faces several important challenges. These include increasing student numbers, rising cost pressures and ongoing qualification reform.
Rising 16–18 population
The number of 16- to 18-year-olds in England has been increasing since 2017, a trend expected to persist in the coming years. Between 2018 and 2024, this age group grew by 230,000 – a 13% increase. Projections suggest a further increase of 110,000 (5%) by 2028, when the population of 16- to 18-year-olds is anticipated to peak. Between 2018 and 2028, this would amount to a total increase of around 340,000 (18%). This significant growth is creating additional demands on further education providers who must accommodate the rising number of students.
The 2025 spending review will set funding levels for 2026–27 and 2027–28. Figure 4.3 outlines the potential implications of three scenarios for future spending on further education and sixth forms: (1) maintaining spending per student in real terms at current levels; (2) freezing the total further education budget in real terms; and (3) freezing spending per student in cash terms. For the purposes of this analysis, further education spending refers to the funding allocated to colleges and sixth forms for educating 16- to 18-year-olds.
The number of 16- to 18-year-olds is expected to grow by 5% between 2024 and 2028, or just over 1% per year. If participation rates remain unchanged, this would equate to an extra 60,000 students in colleges and sixth forms. This would mean that the government would have to increase real-terms funding to keep funding per student constant in real terms. To maintain spending per student at the 2025–26 levels in real terms (scenario 1), the government would need to increase total funding by almost £200 million in today’s prices by the end of the spending review period in 2027–28.
An alternative scenario is the government freezing the budget for further education at the current level in real terms which is illustrated in scenario 2. Fixing the budget in real terms would result in spending per student falling by around 4% in real terms between 2025–26 and 2027–28. Overall, spending per student would be around 14% lower in real terms than in 2009–10.
Lastly, if the government chose to freeze spending per student in cash terms this would result in a similar trajectory to freezing the total budget, as shown in scenario 3. In particular, spending per student would fall by 4% in real terms between 2025–25 and 2027–28, which would once again leave overall spending per student 14% lower in real terms than in 2009–10. Thus, the expected growth in student numbers means that providing no additional funding would lead to sharp cuts in per-student spending over the spending review period, and even maintaining existing per-student spending levels would require significant additional funding.
Figure 4.3. Projecting options for 16–18 education spending per student after 2025,
2009–10 = 1
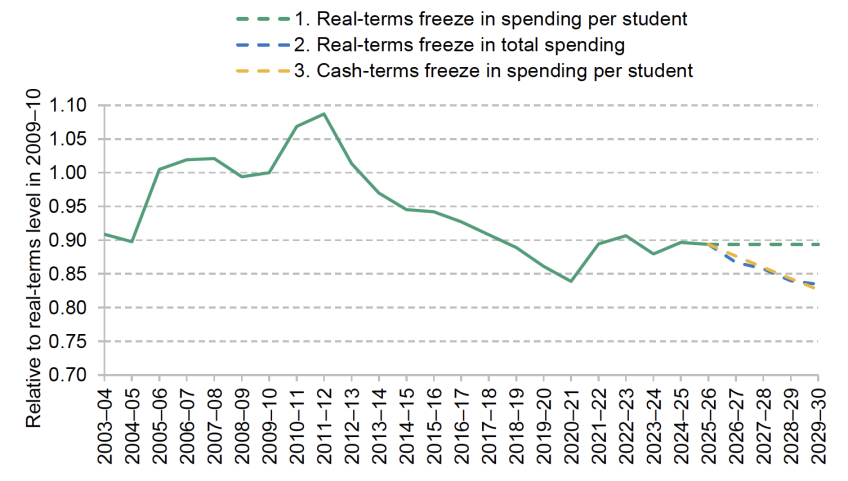
Source: Update of figure 2 in Sibieta and Tahir (2024).
College finances and staff costs
The financial health of further education colleges has deteriorated since the early 2010s (Moura and Tahir, 2024). Figure 4.4 presents the distribution of deficits and surpluses among colleges in England (a key indicator of financial health). Based on this measure, the financial health of the college sector declined in the early 2010s. In 2010–11, only 16% of colleges (weighted by income) were operating in deficit. By 2015–16, this proportion had more than tripled, with 54% of institutions reporting deficits, and nearly one in five colleges showing deficits exceeding 5% of their income. Although there has been some improvement since 2017, 37% of colleges reported operating in deficit in 2022–23 (the latest year for which data are available). While a single year of deficit does not necessarily indicate financial distress, 44% of these colleges had been in deficit for at least three consecutive years.
Figure 4.4. The distribution of deficits and surpluses across English colleges
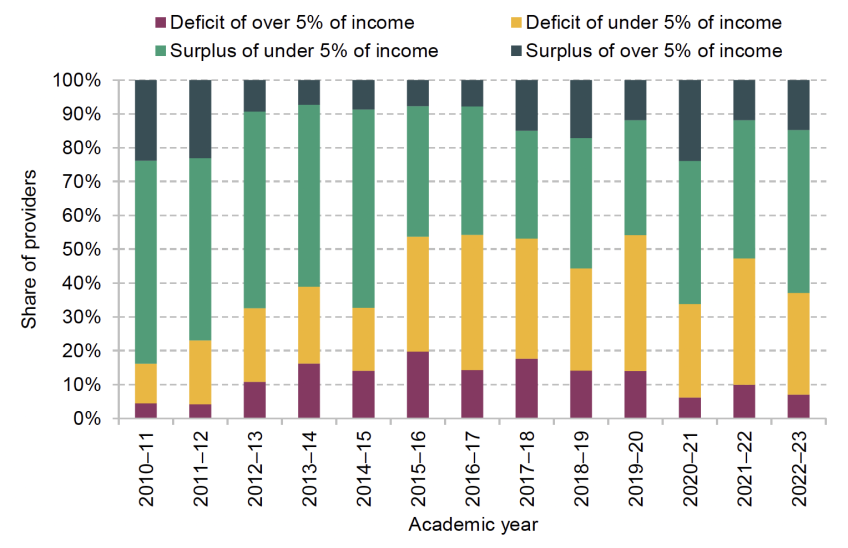
Source: Figure 4 in Moura and Tahir (2024).
The Education and Skills Funding Agency (ESFA) financial scores, which assess colleges based on their solvency and borrowing levels, provide another measure of financial health. According to this measure, nearly one in five colleges were rated as either ‘inadequate’ or ‘requiring improvement’ in 2022–23, meaning they face significant financial risks and limited capacity to respond to challenges. This highlights the challenging financial situation that many further education providers are currently facing.
In common with the rest of the education sector, further education providers have grappled with rising costs for key inputs such as staff salaries and energy in recent years. Staff costs represent the largest expenditure category, accounting for approximately 70% of total expenditure in England’s further education colleges (Moura and Tahir, 2024), so further increases in staff costs will particularly affect the finances of the sector. In the coming years, pressures to increase staff salaries are likely to intensify, particularly in light of ongoing pay disputes and strike action across the sector.14
College staff have experienced significant real-terms pay cuts since 2010. There have been especially sharp declines in recent years due to high levels of inflation. The median salary for school teachers is currently around £44,000, and for college teachers around £38,000. The gap in median salary between school and college teachers is now around £5,500 or 15% (Moura and Tahir, 2024). The existing pay gap is set to widen during 2024–25, with school teachers set to receive a 5.5% pay rise this academic year while the Association of Colleges has recommended a 2.5% increase or £750 – whichever is higher – for college staff this academic year.15 As a result, the forecast salary gap in the 2024–25 academic year is set to increase to almost £7,000 or 18% – the largest gap on record. Unlike for schools, no additional government funding has been made available to fund salary increases for college teachers, which means that any pay increase will have to be funded from existing college budgets.
It is within this context that the Autumn Budget 2024 introduced two key changes to employer taxes, which will directly affect the finances of further education providers. First, employers’ NICs will increase by 1.2 percentage points starting in April 2025, as part of a broader package of tax increases. While there is expected to be additional funding to cover these costs at the national level, the details have not been confirmed. Second, the threshold at which employers begin paying NICs will be reduced from £9,100 to £5,000 per employee until 2028. This change is likely to increase financial pressures for private providers and small training organisations, which may face additional challenges in managing staff costs.
Qualification reform
A persistent challenge for the further education sector is ongoing uncertainty surrounding the post-16 qualification landscape. After age 16, young people can choose from a wide range of qualifications and courses. Figure 4.5 shows participation in education and training, categorised by the primary course studied. In 2023, 45% of 16–17-year-olds were enrolled in A/AS levels, making these the most common qualifications at this stage. This has remained consistent for decades, with A/AS level participation ranging between 43% and 47% in every year. Beyond A levels, the picture becomes more complex. Around 19% of students currently take other level 3 qualifications, such as BTECs. 15% study level 2 qualifications, often retaking their GCSEs. Additionally, 6% of young people engage in apprenticeships or other forms of training, although this figure has declined significantly, nearly halving since 2004.
Over the past two decades, England’s post-16 qualification system has experienced frequent reforms, including changes to funding and financing, as governments have sought to increase participation and steer young people towards particular qualifications. Among the most significant recent changes is the introduction of T levels in 2020, which are designed to provide a technical alternative to the traditional A level pathway. To encourage uptake, the previous government announced plans to withdraw funding from technical qualifications that overlap with T levels from August 2024. This policy would have affected funding for approximately 134 qualifications, affecting around 40,000 enrolments among 16- to 19-year-olds – representing 2% of all level 3 enrolments and 6% of non-A level enrolments at this level.
Figure 4.5. Participation in education, apprenticeships and wider training by 16–17-year-olds in England
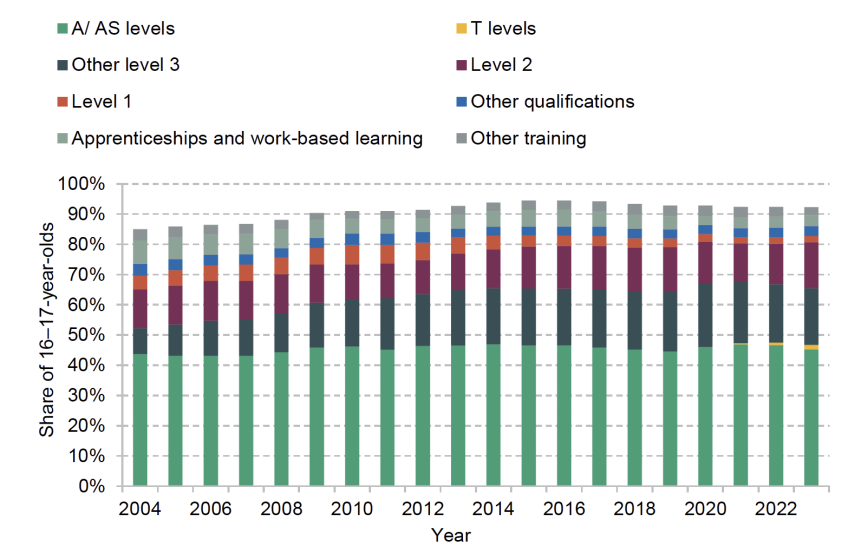
Source: Department for Education statistics, ‘Participation Institutions and Qualifications’ from ‘Participation in education, training and employment age 16 to 18’, https://explore-education-statistics.service.gov.uk/data-tables/permalink/4cf54284-623d-4c63-1311-08dd12e09af5.
The current government has recently revised its approach to level 3 qualification reform, allowing 70% of qualifications previously earmarked for defunding to remain funded.16 The reduction in the number of qualifications removed from funding is likely to be pragmatic, as there is still debate about the merits of T levels. The uptake of T levels remains limited – around 20,000 students or 1.5% of all students currently take T levels. There are also practical challenges with T levels, such as the feasibility of providing the required industry placements. Before deciding whether to withdraw funding from a wider range of level 3 qualifications in the future, the government needs to address these issues to ensure that T levels can become a viable alternative on a wider scale.
The government has also recently announced that the ABS will not be going ahead.17 The ABS was proposed as a new baccalaureate-style qualification for 16- to 18-year-olds that would replace A levels and T levels in a decade’s time. The ABS promised increased tuition time and additional opportunities, but it would likely have caused significant disruption and required substantial funding to deliver. Its cancellation reflects the continual cycle of qualification reforms, which often result in significant changes to the system that prevent stability and make planning immensely difficult for further education providers.
4.2. Adult education and skills
Few areas of public policy have seen as much change as adult education and skills. Since the early 2000s, a series of major reforms has shaped a post-18 education system that can often be challenging for both individuals and employers to navigate. The pace of change shows no signs of slowing under the new government, with the creation of Skills England, major reforms to the apprenticeship levy, and the introduction of the Lifelong Learning Entitlement (LLE) all on the agenda. Underpinning these policy reforms is a funding environment characterised by substantial real-terms reductions since the early 2000s and significant shifts in the allocation of public funds across different areas of adult education.
We divide public spending on adult education and skills into three main categories:
1. classroom-based learning, including basic skills and qualifications at multiple levels;
2. subsidies for work-based learning, such as apprenticeships;
3. loans for further education courses, known as advanced learner loans.
In the remainder of this section, we set out how the public funding of adult education and skills has changed over time. We then consider each of the three areas of adult education in turn.
Adult education spending over time
Figure 4.6 illustrates public spending on adult education and apprenticeships, covering the period from the early 2000s to the present, along with projections for 2024–25. The chart presents total public funding and divides it into three categories: classroom-based learning, work-based learning, and loans issued through advanced learner loans.
Public funding for adult skills has declined significantly since its peak in the early 2000s. In 2023–24, spending stood at approximately £4.3 billion, which means it has fallen by a third compared to its inflation-adjusted high of £6.3 billion in 2003–04. The decline has been particularly steep in classroom-based learning, where expenditure has fallen by two-thirds, from £5.1 billion in the early 2000s to £1.7 billion in 2023–24.
Figure 4.6. Public spending on adult education and skills (actual and projected for 2024–25)
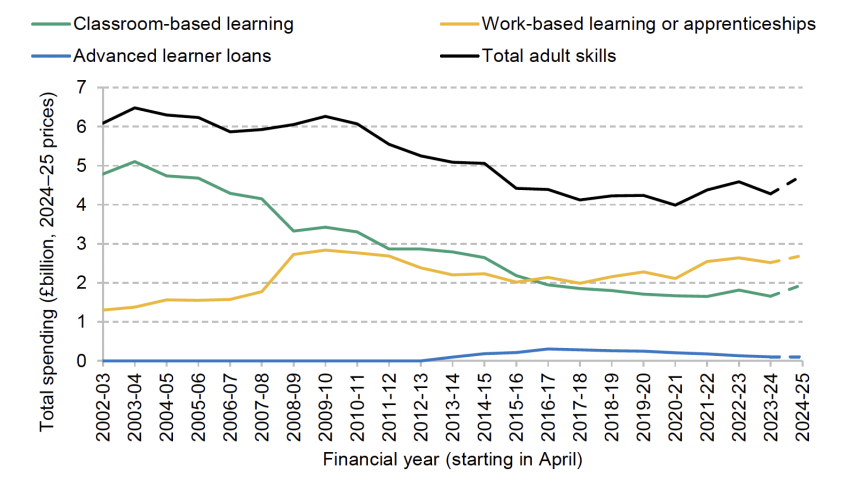
Note: The figure for 2024–25 is a projected spending level based on spending plans announced in the 2021 spending review.
Source: See source for figure 6.4 in Drayton et al. (2022). Amount lent through advanced learner loans from Student Loans Company (2022). See also HM Treasury (2024).
In the 2000s, some of the reductions in classroom-based funding were redirected towards work-based learning, keeping overall spending relatively stable during this period. Expenditure on work-based learning reached its highest point in 2009–10, driven by the introduction of the Train to Gain programme, which peaked at £2.8 billion. In the 2010s, spending on work-based learning settled at around £2 billion annually (in today’s prices) as funding for classroom-based learning continued to decline. Since 2020, public spending on apprenticeships has increased and currently stands at around £2.5 billion. Advanced learner loans, introduced in 2013–14, have consistently accounted for a small portion of total skills funding. By 2023–24, approximately £100 million was issued through these loans, making up just 2.5% of the overall skills budget.
The 2021 spending review allocated an additional £900 million in day-to-day funding for adult education in 2024–25 compared with 2019–20 (Drayton et al., 2023). As a result, total spending on adult skills is projected to rise by 12% in real terms over this period. However, similar to funding for 16–18 education, these funding increases only partially offset previous reductions. By 2024–25, total skills funding will be 23% lower than in 2009–10. The decline is particularly stark for classroom-based adult education, where funding – even with the additional investment – will still be over 40% below 2009–10 levels.
Public funding for classroom-based learning
There have been large and sustained reductions to public spending on classroom-based learning over time, which have been driven by two factors. The first is a sharp fall in the number of adults enrolling in classroom-based further education courses. As shown in Figure 4.7, the number of publicly funded qualifications taken by adults in England dropped from 5.6 million in 2004–05 to just 2.3 million in 2023–24 – a reduction of 58%. While participation has declined across all qualification levels, the steepest drop occurred at the lowest levels (below level 2) during the 2000s.
The reduction in participation in classroom-based learning has had a direct impact on funding for colleges and education providers, as funding is largely determined by the number of courses delivered. The fall in the number of classroom-based learners can be traced to several policy decisions, including the withdrawal of public funding for low-level qualifications during the 2000s, a deliberate shift in focus from classroom-based education to apprenticeship training, and tightening of eligibility criteria for funding entitlements introduced in the 2010s. While a substantial decline in the number of adult learners may seem like an inherently undesirable trend, the implications depend on which courses have declined. There is variation in the value of different further education qualifications for learners, with many low-level classroom-based courses offering limited labour market returns (Tahir, 2023).
Figure 4.7. Participation in classroom-based further education qualifications by adults (19+) in England
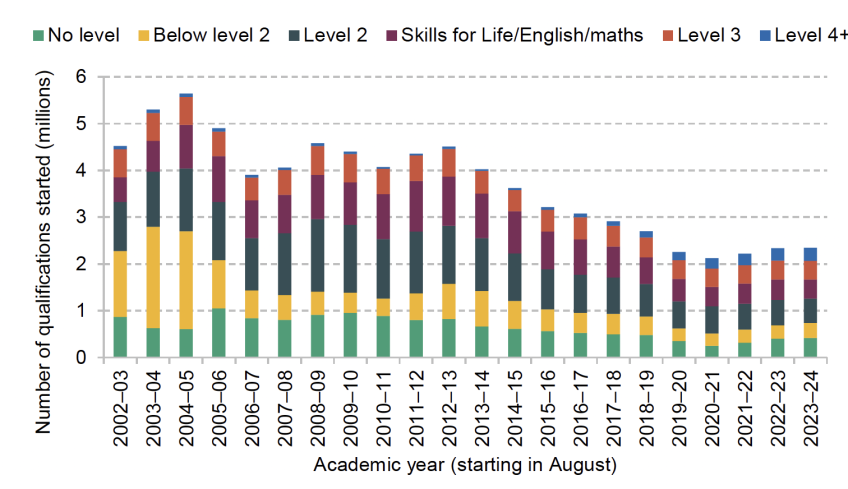
Note: Level 2 corresponds to GCSE or equivalent. Skills for Life encompasses everyday literacy and numeracy courses. Level 3 corresponds to A level or equivalent qualifications. Level 4+ corresponds to higher-level qualifications such as Higher National Certificates or Higher National Diplomas.
Source: Learner numbers from 2002–03 to 2018–19 from figure 2.2 in Sibieta, Tahir and Waltmann (2021). Learner numbers for 2019–20 to 2023–24 calculated from Department for Education apprenticeship statistics (https://explore-education-statistics.service.gov.uk/find-statistics/apprenticeships) and adult further education participation statistics (https://explore-education-statistics.service.gov.uk/find-statistics/further-education-and-skills).
The second driver of the fall in public funding for classroom-based learning is the large real-terms reduction in funding rates for these courses. The funding that further education providers receive for teaching a learner is determined by a formula that includes the course funding rate, a disadvantage uplift and an area cost uplift (to account for higher costs in specific regions). Since 2013–14, the Education and Skills Funding Agency (formerly the Skills Funding Agency) has used the following formula to allocate funding through the Adult Education Budget (AEB):
Funding received for teaching a learner = Course funding rate × Disadvantage uplift × Area cost uplift
The course funding rate, which is based on the number of guided learning hours and the course subject area, is the key component in this formula. Between 2013–14 and 2023–24, the funding rate for most adult education courses remained fixed in cash terms. Over this period, inflation eroded the value of these rates by nearly 25% in real terms (Drayton et al., 2023). Although the previous government applied a 2.2% increase to the final earnings for formula-funded provision under the AEB in both 2022–23 and 2023–24, this small adjustment did not offset the prolonged cash-terms freeze. Freezing rates for a decade has likely led to funding becoming detached from the actual resource needs of education providers, eroding their capacity in an unpredictable and arbitrary way.
For the 2024–25 academic year, the previous government introduced new funding rates. Under this system, courses are grouped into five funding bands, each with a fixed hourly rate ranging from £6 an hour to £12 an hour. This new structure should lead to increases in funding rates for most courses and simplifies the funding schedule by eliminating cliff edges present in the current system. While it is not feasible to detail how the funding rate for each adult education course has changed, Figure 4.8 illustrates the changes in the hourly funding rate for the two most common subject areas: ‘Preparation for work and life’ (38% of all further education courses undertaken in England in 2022–23) and ‘Health, public services and care’ (12% of all further education courses).
Figure 4.8. Hourly funding rate for ‘Preparation for work and life’ and ‘Health, public services and care’ courses
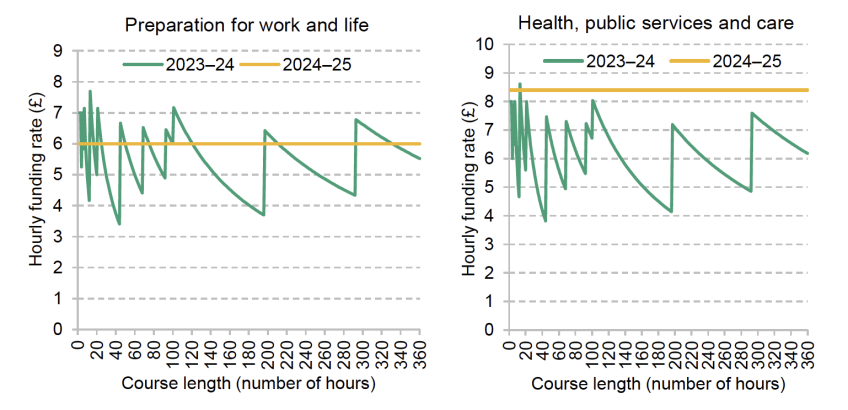
Source: Authors’ calculations using the ESFA AEB funding rules 2023 to 2024 (https://www.gov.uk/government/publications/adult-education-budget-aeb-funding-rules-2023-to-2024) and Adult Skills fund: funding rules for 2024 to 2025 (https://www.gov.uk/government/publications/adult-skills-fund-funding-rules-for-2024-to-2025).
Figure 4.8 illustrates that the previous funding structure resulted in widely varying hourly funding rates across courses, whereas the new funding structure establishes a consistent hourly rate. This is a positive development, as it simplifies the funding system, making it easier to understand, and reduces potential distortions in the length of courses. The overall impact on funding levels will depend on the length of courses and subject area. For ‘Preparation for work and life’ courses, which attract the lowest base funding rate, the changes may result in small increases or even decreases in hourly funding rates. In contrast, other subject areas, such as ‘Health, public services and care’, have seen more substantial increases in their base rates, resulting in higher hourly funding levels across all course lengths.
Public funding for apprenticeships
Employers receive public subsidies to offset the cost of apprenticeship training. Since 2017, these subsidies have been financed through the apprenticeship levy, which requires businesses with annual pay bills exceeding £3 million to contribute 0.5% of their payroll above this threshold. These contributions are then topped up by 10% in public funding and can be used by firms to cover apprenticeship training costs. For non-levy-paying firms, there is a generous public funding system where employers pay only 5% of the training costs, with the remaining 95% covered by the government.
The government has announced that it will replace the existing apprenticeship levy with a growth and skills levy, which would give firms flexibility to use their levy contributions for specified forms of non-apprenticeship training as well as shorter apprenticeships (i.e. apprenticeships that last less than a year).18 The types of training eligible for funding will be determined by Skills England, a newly established body tasked with identifying the skill needs of the country. In principle, providing greater flexibility should help employers to invest in additional training that they and their employees find valuable. But the history of these wider training subsidies, such as the former Train to Gain programme, suggests that the result is often that much of the spending goes on training that firms would have provided – and paid for – even without the subsidy. In determining the list of eligible training, Skills England must ensure that subsidised training is likely to be additional and genuinely productive.
As part of reforms to the apprenticeship levy, the government also plans to remove some level 7 apprenticeships (the highest level of apprenticeships) from the scope of levy funding. Figure 4.9 presents the share of the apprenticeship budget allocated to apprenticeships by level. The proportion of funding directed to higher-level apprenticeships (level 4 and above) has trebled between 2017–18 and 2021–22 from 13% to 39%. There has been an especially sharp rise in level 7 apprenticeship spending from 1% in 2017–18 to 10% by 2021–22. These apprenticeships are predominantly taken by older adults who already hold degrees, with nearly 70% of higher apprenticeship starts by individuals aged 25 and over.
Figure 4.9. Share of apprenticeship budget spent on each apprenticeship level
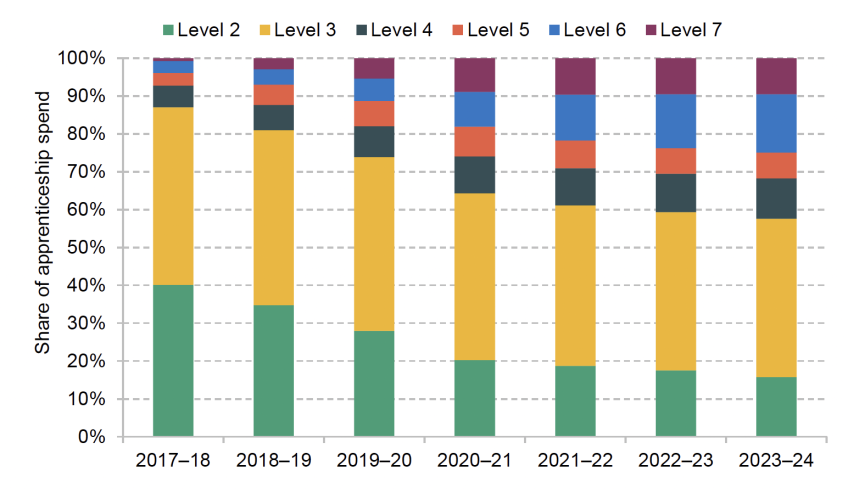
Source: Freedom of Information (FOI) request.
The exclusion of certain level 7 apprenticeships is intended to redirect funding towards younger, less-skilled apprenticeships. While restricting subsidy funding is likely to reduce the demand for level 7 apprenticeships, it does not address the underlying costs businesses incur when hiring and training apprentices at lower levels. For many employers, these costs will remain a significant barrier to taking on younger apprentices, particularly those who require more support and training. As a result, this policy may have limited impact on achieving its broader goal of incentivising businesses to hire younger apprentices.
Further education loans
The government provides access to loans for further education courses through advanced learner loans. These represent a tiny fraction of public outlay on student loans: in 2023–24, the amount lent through advanced learner loans (£101 million) was less than 1% of the amount lent through higher education loans (£20.1 billion), and the amount lent through further education loans has shrunk over time. The previous government announced that the system of further education loans is set to be reformed through the introduction of the new LLE.
The LLE is best thought of as a package of three reforms to the existing post-18 loan system. First, it will unify the two existing post-18 loans systems, with learners studying further education courses being offered maintenance loans like their counterparts studying at university. Second, the LLE will introduce ‘modular funding’, which will allow learners to access loans for specific modules and short courses rather than just entire courses. Third, the LLE will remove existing restrictions on accessing loan funding known as ‘equivalent and lower qualification’ rules.19
The current government has confirmed its commitment to the LLE but has delayed its launch. Initially scheduled to begin funding course enrolments from January 2026, the LLE’s rollout has now been pushed back to January 2027. This continues a pattern of delays since the policy was first announced in 2023, and significant questions about its design remain unanswered, such as the courses that will be eligible for LLE funding. It is essential that the current government addresses these uncertainties and provides a clear implementation roadmap as soon as possible.
4.3. Concluding summary
Since 2010, there have been significant cuts to funding for young people in colleges and sixth forms, with recent funding increases falling short of reversing these declines. Although there have been improvements since 2017, college finances remain in a precarious state, with nearly one in five rated as financially vulnerable by the industry regulator. Recruitment and retention challenges add to these pressures, with average teacher pay in colleges around 15% lower than in schools, which is likely to contribute to ongoing recruitment and retention challenges.
Total spending on adult skills remains about 23% lower in real terms than in 2010. This decline is primarily due to significant reductions in classroom-based adult education, which has seen enrolment fall by 60%. Spending on apprenticeships has been more protected, although it is increasingly concentrated on higher-level apprenticeships, raising questions about the opportunities available to younger and less-skilled learners.
Looking ahead to the 2025 spending review, rising student numbers will intensify pressures. To maintain spending per student in real terms between 2025 and 2027, the government would need to allocate an additional £200 million in today’s prices. At the same time, ongoing reforms, such as the introduction of the Lifelong Learning Entitlement and changes to the apprenticeship levy, add further complexity to an already stretched system. With the public finances under significant strain, finding additional resources for colleges, sixth forms and other FE providers will be a substantial challenge.
5. Higher education
The government currently spends upwards of £20 billion upfront on higher education for each cohort of students in England, which goes towards teaching but also supports students with their living costs. The vast majority of this funding is in the form of student loans, of which the majority is expected to be repaid by graduates over their working lives. This makes estimating spending on higher education more complex than for earlier stages of education.
Over recent years, policy decisions by the previous government – including significant reforms to the student loan system, as well as various cash freezes during a period of high inflation – have reshaped the higher education funding system. In this chapter, we discuss the early choices that the new government has already made in relation to higher education funding, the extent to which these continue – or diverge from – the trends seen over recent years, and the many important choices that are yet to be made. We begin by discussing the recently announced increase in tuition fees, and the extent to which this will ease pressures on university finances. We then turn to support for students’ living costs. Finally, we consider the potential shape of further student loan reforms.
5.1. The unfreezing of tuition fees
Since the cap on tuition fees for England-domiciled undergraduate students was tripled in 2012, tuition fees have accounted for the vast majority of teaching resources, with teaching grants now accounting for only around a tenth of overall teaching resources. But since 2012, the fee cap had only been increased once (from £9,000 to £9,250 in 2017). This long-running cash freeze had seen the real-terms value of the tuition fee cap fall by 22% between 2017 and 2024 (and 25% since 2012) – an even larger fall than anticipated by previous governments when they announced successive freezes. For instance, when the most recent two-year freeze in the fee cap was announced in February 202220, it was expected to leave fees 6% lower in real terms by 2024–25 than in 2021–22, but higher-than-expected inflation meant fees actually fell by 13% over those three years.
Increases in teaching grants had not made up for the substantial real-terms cuts in the fee cap, such that the real-terms value of resources available for teaching home undergraduates had been steadily eroded – from £12,070 per student per year for those starting courses in 2012–13 in today’s prices, to £10,010 (17% less) for the 2022–23 starting cohort. The freeze had very nearly returned universities’ teaching resources to where they were before the fee increase (£9,720 in 2011–12).
As we described in a report in June 2024, providers had in recent years been able to largely compensate for the cuts in income from domestic students with increased recruitment of international students (Ogden and Waltmann, 2024). But it was far from clear that this strategy would continue to work, making an indefinite freeze in the fee cap unsustainable (at least in the absence of increases in teaching grants to make up for it). This presented a difficult inheritance for the incoming Labour government.
In early November, the new government announced that it would increase the tuition fee cap from £9,250 to £9,535 for the 2025–26 academic year, in line with the latest forecast for inflation as measured by RPIX (3.1%).21 The government’s intention is that this higher cap will apply for both new and existing students, although some have raised concerns about whether all universities will be able to impose the increase on existing students under consumer protection law (Dickinson, 2024). If universities can raise the fees of both entrants and continuing UK undergraduate students, estimates suggest that this could spare the higher education sector a further real-terms cut to teaching resources of £350–£400 million next academic year.22
The government has not indicated whether it plans to continue to increase fees in line with RPIX in future years, or whether it may revert to a cash freeze after 2025–26. It has only said that ‘longer-term funding plans for the higher education sector will be set out in due course’.23 If it indexes fees in the same way each year, the tuition fee cap could reach £10,630 in cash terms by 2029–30, on current forecasts. Either way, if the government knows what it plans to do on the fee cap, it should say so – and provide some certainty to universities and prospective students alike. While student loans will not figure directly at the spending review in summer 2025, decisions around the balance between tuition fees and teaching grants going forwards will affect the teaching grants required to deliver a particular level of teaching resources.
If indexation is continued, we expect that the steady downward trend in the upfront resources provided for higher education per student will have been arrested for the first time in 2024–25, with total teaching resources per student per year for the 2024–25 university entry cohort standing at £9,760 in today’s prices, roughly the same as for 2023–24 entrants in real terms.24 We would then expect real-terms resources to increase slightly for future cohorts (who will benefit from more years of unfrozen fees), as shown in the blue line on Figure 6.1. Importantly, these estimates assume that indexation of fees continues, and that total teaching grants are maintained in real terms after 2024–25.25 There was no new funding earmarked for higher education in the 2025–26 financial year in the Autumn Budget 2024, suggesting that there will not be substantial increases in teaching grants next academic year.
The unfreezing of tuition fees will add to student borrowing, and see students graduate with higher cash-terms student loan balances (compared with a continued cash freeze). Under current student loan terms, we expect around a quarter of the additional loans extended will eventually be written off and met by the taxpayer. These extra loan write-offs count as capital spending, and so don’t have an impact on the government’s ability to meet its new ‘stability rule’ (current budget balance) – unlike an increase in direct grants to universities or maintenance grants, which would count as current spending. In Box 5.1, we describe the way higher education funding appears in the public accounts and the impact of changes in the government’s fiscal rules.
Box 5.1. Higher education and the new fiscal rules
Whereas spending on most stages of education represents current, day-to-day spending on the delivery of a public service, the vast majority of upfront funding for English higher education is in the form of loans to students. This makes reflecting higher education in the public accounts more complex.
When loans are initially issued, this loan outlay is classed as Department for Education Annually Managed Expenditure. As loan outlay is demand-driven, this is budgeted for outside of the main spending review process, which sets departmental spending limits. In the public accounts, the loan outlay is partitioned into two parts in the year the loan is issued: a loan asset, which corresponds to the portion of borrowing that government expects to be repaid; and a ‘transfer proportion’ or ‘write-off share’, the share of loans that government expects will eventually be written off. These write-offs will typically take place in several decades, once graduates reach the end of their loan terms with some outstanding balance. The ‘write-off share’ is treated as a capital transfer from the government to the borrower, and so is counted as capital spending when the loan is issued. In contrast, direct grants to universities for teaching represent current, day-to-day spending.
Alongside the Autumn Budget 2024, the government announced reforms to how it will manage the public finances (the ‘fiscal framework’). It will target different measures to the previous government’s main two fiscal rules: current budget balance and public sector net financial liabilities (PSNFL), instead of public sector net borrowing (PNSB) and public sector net debt (PSND). Table 5.1 describes the fiscal rules of the previous and current governments and how the relevant measures are affected by different elements of spending on higher education.
Overall, the changes are likely to have increased the relative appeal of providing additional teaching resources through tuition fee loans rather than direct grants, and of providing additional living cost support through maintenance loans rather than grants. This is because additional loan write-offs would have added to PNSB, but issuing additional loans does not make it harder for the government to meet its new current budget balance rule (whereas both measures are affected by any increase in grants). The switch from focusing on PSND to PSNFL may also allow the government to be relatively less concerned about issuing loans that it does expect to be repaid. Importantly, potential sales of the student loan book do not flatter PSNFL in the same way as they did PSND (which would have recognised the proceeds of any sale, but not the loss of the asset).
Table 5.1. Fiscal rules, and how higher education spending affects different measures
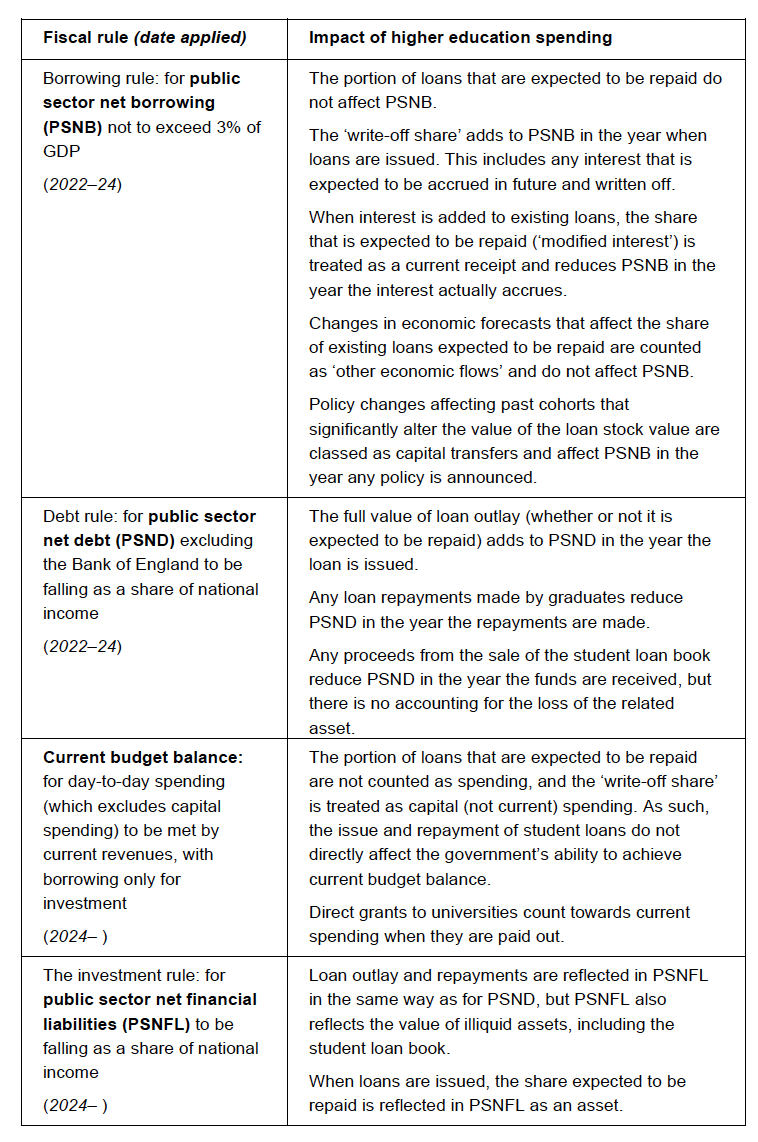
Conversely, in the long run, we expect graduates will eventually repay around three-quarters of any additional loans. But for most students, the impact on actual student loan repayments will not be felt for many years. This is because until the loan is paid off, monthly loan repayments only depend on a borrower’s earnings and not on their outstanding loan balance. Amongst those starting courses in 2025 and studying for three years, less than a third of borrowers will see any difference in their loan repayments before they reach the age of 40 (assuming they start courses at age 18), as shown in Figure 5.1. They might then continue making loan repayments for a few more months than they otherwise would have. Around one in five borrowers will never repay any more, as they would never clear their loans even if the freeze continued.
Figure 5.1. Proportion of borrowers who would have made higher repayments by each age if fee freeze was allowed to expire in 2025–26 compared with continued freeze
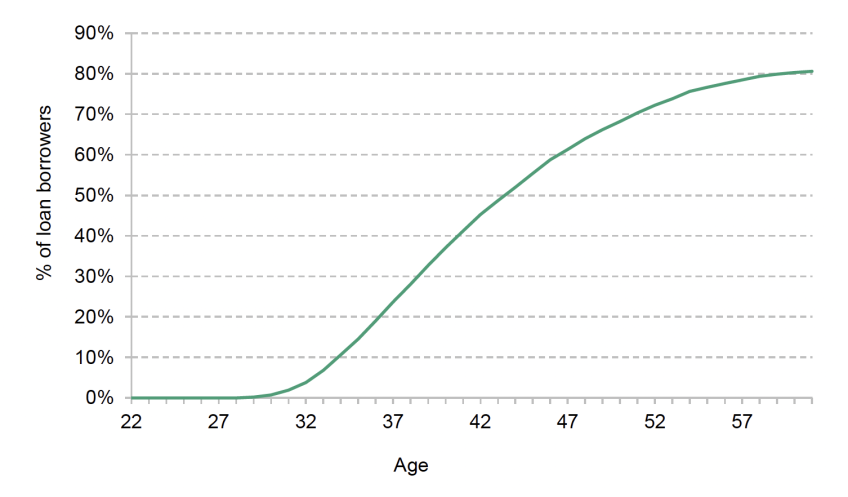
Note: Compares expected loan repayments made by 2025 starting cohort if fee freeze was allowed to expire in 2025–26, compared with continuing indefinitely. Loan repayment terms are for Plan 5 borrowers and are assumed to reflect current government policy, including the freeze in the repayment threshold until 2027. Restricted to those on three-year courses and assumes all start courses at age 18.
Source: Figure 8 of Ogden and Waltmann (2024).
5.2. University finances
The increase in tuition fees was intended to support the finances of higher education providers, who have reported increasing financial challenges in recent years.
The latest finance data published by HESA relates to the 2022–23 academic year.26 As we discussed in June 2024 (Ogden and Waltmann, 2024), the sector-wide surplus (adjusted for mostly one-off pension effects) was £1.5 billion in 2022–23, equivalent to 3.7% of income, down from a surplus of £2.5 billion (6.1% of income) in 2021–22.27 As shown in Figure 5.2, more than a fifth of universities (weighted by income) had an in-year deficit in 2022–23. This compares to a tenth of providers in the previous year and is higher than had been typical before the pandemic. There was also a substantial fall in the share of providers achieving surpluses of more than 10% of their income, from 19% to 1%.
Running a deficit in a single year may not be a cause for concern – universities are usually able to draw down reserves to meet shortfalls – but consistently running a deficit would not be sustainable in the long run, and growing deficits across the sector might indicate problems with the long-run viability of the funding model. As of 2022–23, deficits remained relatively small compared to providers’ net assets (assets minus liabilities). The median deficit, weighted by income, was equivalent to 1.5% of net assets, with the largest deficit worth 9% of net assets.28 Consistently running deficits remained relatively rare, with only six providers (accounting for only 1.7% of sector income) in deficit for three consecutive years. These numbers suggest that, as of 2022–23, provider balance sheets were in good shape, and no provider in our analysis sample was facing an immediate threat of insolvency.
Figure 5.2. Distribution of in-year surpluses and deficits, by academic year
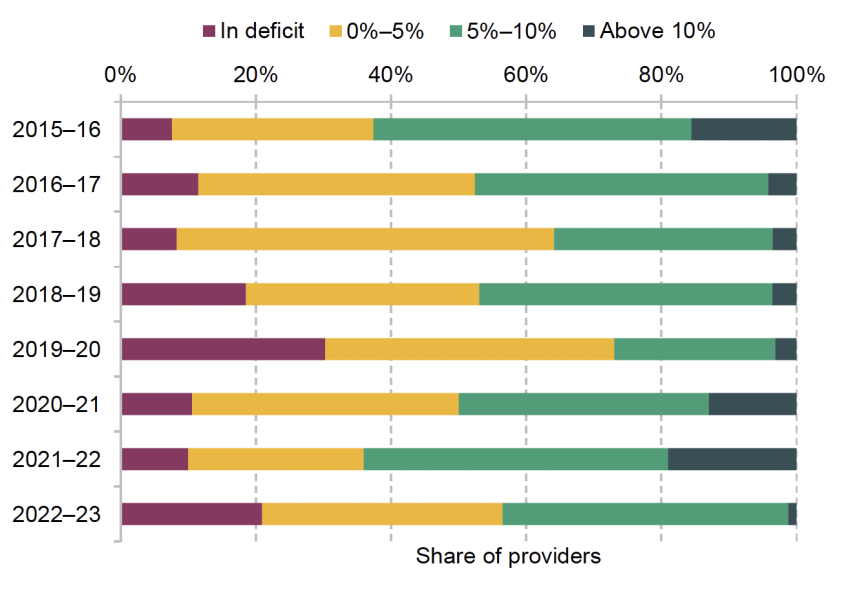
Note: Surplus is total income less expenditure, where expenditure figures are adjusted to remove the impact of pension cost adjustments. Share of providers is weighted by provider income. Includes only the subset of providers in England which appear in every year of the finances data from 2015–16 to 2022–23.
Source: Figure 3(a) of Ogden and Waltmann (2024).
Since then, one significant positive development for higher education providers’ finances has been the improvement in the finances of the Universities Superannuation Schemes (USS), the largest university pension scheme. Largely due to the increase in long-term interest rates, USS moved to a surplus of £7.4 billion at its 2023 valuation – a swing of more than £40,000 per scheme member in three years. As a result, employers now need to make substantially lower pension contributions (14.5% instead of 21.6% of salary) despite higher future benefits for scheme members, and employees also pay less (6.1% instead of 9.8% of salary), amounting to a substantial implicit pay rise.
However, other developments are likely to have worsened the financial challenges facing English universities since 2022–23.
The tuition fee cap was frozen for a further two years, equivalent to a real-terms cut of 6.5%. Relatively high inflation in 2023–24 will have had knock-on impacts for university running costs (including through staff wage demands) and will have meant that the continued freeze in domestic tuition fees will have bitten harder. According to providers’ own projections (submitted to the Office for Students in around December 2023 or January 2024), total expenditure without pension cost adjustments was expected to increase by 6% in nominal terms between 2022–23 and 2023–24, or roughly in line with economy-wide inflation, while providers expected their total income to grow at a rate of only 3.7% in nominal terms (Office for Students, 2024b). This works out to a tiny projected sector-wide surplus of 0.8% of sector income. Providers then predicted sector-wide surpluses would rise again from 2024–25 on the back of further growth in international student numbers, despite an expected further erosion in the value of domestic undergraduate teaching resources.
However, the sector’s projections were predicated on strong growth in both domestic and international student numbers. Acceptances of UK students at providers registered with the Office for Students and recruiting through UCAS increased by 1.3% overall between 2023 and 2024, far more slowly than the sector forecast (5.8%). Large, research-intensive, high-tariff providers exceeded their recruitment forecasts for UK undergraduates, but all other groups recruited fewer students than forecast, with declines of 5% in acceptances at smaller and specialist providers (Office for Students, 2024a).
Fee income from international students has become increasingly important for the finances of many UK universities, with international students – who are not subject to the tuition fee cap – typically paying higher fees, and implicitly cross-subsidising the teaching of domestic undergraduates. International students from outside the European Union (EU) accounted for 38% of full-time entrants to English universities in 2022–23 – the latest year of published data on student numbers. Income from fees paid by these students amounted to £9.4 billion in the same year, more than a fifth of the sector’s income.
International recruitment is likely to have fallen sharply since. In the ten months to October 2024, there were 16% fewer applications for main applicant sponsored study visas than in the same period in 2023, and 14% fewer than in 2022.29 This contrasts with the sector’s aggregate forecast of a 6.6% increase in total non-UK entrants between 2023–24 and 2024–25. The Office for Students estimates that total non-UK entrants in 2024–25 may be 23% lower than providers’ forecasts, and expects this to be unevenly felt across the sector – with larger falls at those that are less competitive, or that are particularly exposed to particular source countries experiencing the largest falls in visa applications.
Between the most relevant period for the 2024–25 academic year (the year to September 2024) and the same period two years earlier, there were particularly large falls in the number of study visas granted to students from Nigeria (−62%), Bangladesh (−61%) and India (−27%). As shown in Figure 5.3, students from these three countries accounted for four-fifths of full-time non-EU students enrolled at some universities in 2022–23. However, there was also substantial variation in the proportion of total income from non-EU student fees. Those which both recruited heavily from these source countries in recent years, and for whom international student fees have been a major source of income (such as the University of East London and the University of Hertfordshire) may be particularly exposed to any falls in student numbers.
The increase in employers’ NICs at the Autumn Budget 2024 will also have a substantial impact on universities’ costs. Across the economy, it will add an average of 2.1% to employment costs from April 2025 (and a higher percentage than this for lower-earning employees).30 The Universities and Colleges Employers Association has estimated the impact of this on the sector’s pay bill at £372 million31 (based on that average of 2.1%), while the Office for Students has estimated that it will result in additional costs for the sector of £133 million in 2024–25 (as it takes effect part way through the academic year) and around £430 million each year from 2025–26 (Office for Students, 2024a).
In the long run, much of the additional tax is expected to fall on employees in the form of wages growing more slowly than they otherwise would have done. But it will take time for wages to adjust, so that the immediate cost impact is likely to fall on universities rather than their staff. While the government intends to compensate public-sector employers for these additional costs, we do not expect universities in England to receive any compensation.
Figure 5.3. Share of total income from tuition fees charged to non-EU students in 2022–23, and share of these students who were from Nigeria, Bangladesh or India in 2022–23
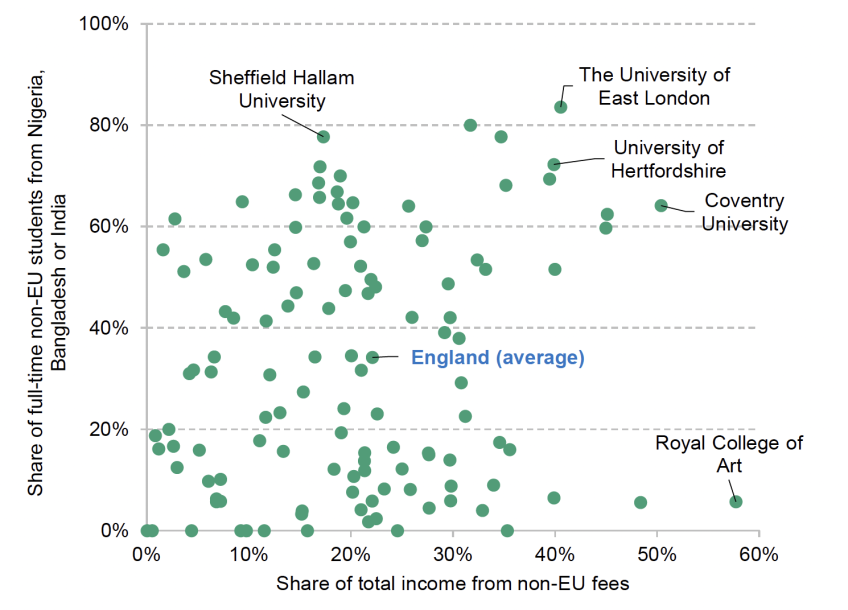
Note: Share of full-time non-EU students in 2022–23 at each provider who were from three countries experiencing substantial falls in study visas granted between the year to September 2022 and the year to September 2024 (Nigeria, Bangladesh, and India). Includes subset of providers shown in Figure 5.2 who had at least some undergraduate students in 2022–23.
Source: Analysis using HESA student data (DT051 Table 1 and DT051 Table 28), HESA finance data (DT031 Table 1 and DT031 Table 6) and Home Office grants of entry clearance visas, by course level and nationality, year ending September 2024 (Edu_D02).
Recent Office for Students modelling accounts for these various trends – an increase in tuition fees next academic year, likely under-recruitment relative to forecasts and increased NICs (Office for Students, 2024a). It implies that without significant mitigating action, providers may face an aggregate deficit of around £1.6 billion in 2025–26, with seven-in-ten providers in deficit. Indeed, many institutions are now reported to be cutting costs, seeking to make redundancies, or closing whole courses.32 This suggests that the tuition fee increase alone has not been sufficient to put the sector ‘on a secure financial footing’ – something the Secretary of State33 appeared to recognise in a letter to the sector, as she also called for a ‘sustained efficiency and reform programme’ and less wasteful spending. University funding is likely to continue to be a concern for the government.
5.3. Support for living costs
The new government has confirmed that maintenance loans (which support students with their living costs) will increase by 3.1% in cash terms for the 2025–26 academic year.34 As with the increase in the tuition fee cap, this is in line with forecast RPIX in 2026Q1. For a student living away from home, studying outside London and with a low household income, this will add £317 in cash terms to the maximum they are entitled to borrow for their living costs next academic year.
However, the last few years have seen a substantial effective cut to the generosity of maintenance loans. Under the previous government, loans were also increased each year in line with forecast inflation – but these increases were not revisited when inflation turned out higher than expected, as happened for several years in a row. Based on the CPI, a measure of consumer prices, entitlements were cut by 10.4% in real terms between 2020–21 and 2024–25. Maintenance entitlements will increase by very slightly more than forecast CPI inflation next academic year (3.1% compared to CPI inflation of 2.5% in the relevant quarter). But that will still leave support for the poorest students around £1,125 (9.8%) lower in real terms than support for an equivalent student in 2020–21 (the recent high point), as shown in Figure 5.4. The current government has made a choice not to reverse the substantial cuts in generosity experienced under the last government.
A further cut to the generosity of student support has come from an even longer-running cash freeze in the lower parental earnings threshold – the level of household income below which students are entitled to the maximum level of support. This has been set at £25,000 since 2008–09. Average nominal earnings have increased by nearly 60% over the same period. This represents a substantial cut in the generosity of support, with fewer students each year eligible for the maximum support, and support being withdrawn from better-off students more quickly.
Figure 5.4. Maximum maintenance support entitlements per year for students living away from home, outside London, 2024–25 prices
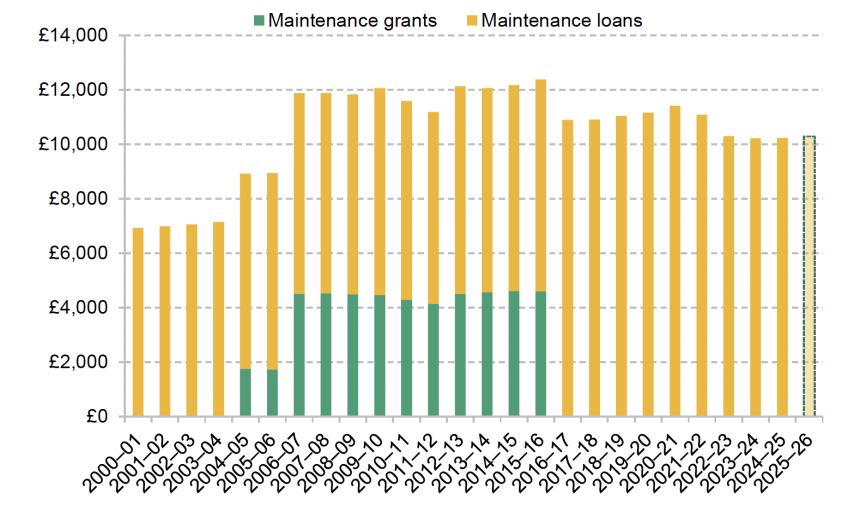
Note: All monetary amounts are in CPI real terms, in 2025Q1 prices. In each academic year, the chart reflects the maintenance system as it applied to new students.
Source: Authors’ calculations using Bolton (2024) and Office for Budget Responsibility’s Economic and Fiscal Outlook – October 2024.
The government has not yet confirmed whether it will maintain the freeze in the parental earnings threshold, but if it does so, this will be more consequential for many students than the headline 3.1% increase. Students’ entitlement to support is initially assessed based on their household income a few years previously (over the 2022–23 financial year for the 2024–25 academic year). Particularly high growth in average earnings in 2023–24 means that maintaining the cash freeze would see the parental earnings threshold applying next academic year fall by 6.7% relative to average earnings over the relevant period. As shown in Figure 5.5, for students with household incomes in the range over which loan entitlements are gradually withdrawn (between roughly £25,000 and £60,000), such a freeze would see the real-terms value of support they were entitled to fall year-on-year if their household incomes rose in line with average earnings over the relevant period. Some would see their entitlement fall by up to £500 in today’s prices, despite the 3.1% headline increase, even if their household was no better off relative to the average. A student with an assessed household income of £58,000 for the 2024–25 academic year would be entitled to borrow £4,820 next year (in today’s prices) compared to £5,400 for an equivalent student in 2024–25 and £7,270 in 2020–21. This implies a substantial increase in the contribution that the government expects some parents to make towards students’ living costs, if they are not to have a much lower standard of living than earlier cohorts.
Figure 5.5. Maintenance loan entitlements by household income in different academic years
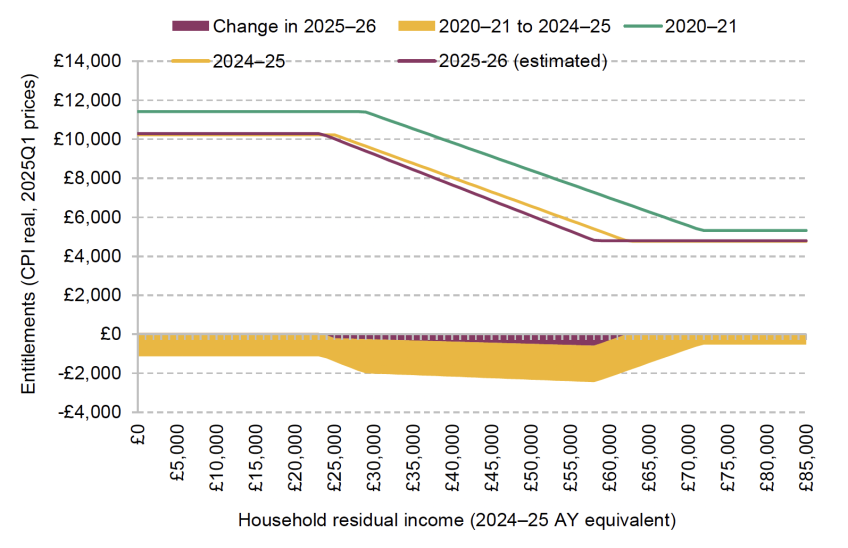
Note: For students living away from home and studying outside London. Entitlements for students starting courses each academic year in CPI real terms (2025Q1 prices). Parental earnings thresholds are deflated in line with average earnings in the relevant financial year, to 2022–23 financial year prices (the relevant period for entitlements to support in the 2024–25 academic year). Schedule for 2025–26 academic year reflects 3.1% cash-terms increase in levels and assumes upper and lower parental earnings thresholds frozen in cash terms.
Source: Authors’ calculations using Office for Budget Responsibility’s Economic and Fiscal Outlook – October 2024.
Indeed, if the threshold remains frozen, another large increase in the National Living Wage (NLW) means 2025–26 could be the first year that a parent earning for 40 hours per week at the NLW would be expected to contribute. Higher potential earnings from work may help some students who are able to work part-time alongside their studies. However, a widening of the gap between the support students are entitled to while studying and what they could otherwise earn from working the same number of hours may induce some to forgo university altogether.
One policy option for the new government would be to reconsider what a sufficient level of student support would look like, based on up-to-date estimates of living costs, and some explicit degree of expected parental support or measure of potential earnings from part-time work alongside studies (or from the hours of earnings foregone while studying). Scotland has recently moved in this direction, offering maximum support of £11,400 to the poorest students in 2024–25, in line with foregone earnings for 25 notional hours of study for 38 weeks a year at the real Living Wage. The Augar Review recommended setting maintenance support in England with reference to an established standard linked to minimum wage rates, although matching this level now would require entitlements for the poorest to increase by at least a quarter compared to current levels.35 Achieving this through additional loans would add around £2.4 billion to loan outlay for each cohort (around £5,000 per borrower) but only around £0.6 billion to the long-run cost to government (the ‘write-off share’) as 70% of the additional borrowing would eventually be repaid.36
The Augar Review also recommended the reintroduction of means-tested maintenance grants to reduce the amount borrowed by students from low-income backgrounds. Such grants existed in England for students starting courses up to 2016–17 and are still available in other parts of the UK. There had been widespread speculation that the Labour government might be considering reintroducing maintenance grants, although it does not appear to be doing so for the 2025–26 academic year. Replacing £3,000 of loan entitlements with grants for the poorest students would cost around £1.1 billion (in foregone loan repayments), without increasing the total level of support for students. If grants were additional to existing loan entitlements, a larger increase in total student support could be achieved at the same long-run cost to the exchequer through increased loan entitlements than through non-repayable maintenance grants.
While the new government has set the maximum level of maintenance entitlements for the 2025–26 academic year, important choices remain around how quickly support is withdrawn with household income. More radical changes for support from 2026 onwards – such as resetting support to some principled benchmark, or reintroducing grants – would likely require more funding, and would depend on the outcome of the spending review in summer 2025.
5.4. Student loans
The new government also faces important choices around the operation of the student loan system in the coming years. It inherits a system with several outstanding issues as a result of the period of recent high inflation.
In the short term, the government may face political pressure over the lagged way the interest rate is set, with the rate applying for a year from each September based on the retail price index (RPI) the previous March. This lag protected borrowers from rises in interest rates from September 2021 to August 2022, even as RPI rose rapidly (shown by the grey line in Figure 5.6). But it also means interest rates will take longer to fall as inflation comes back down. Those with Plan 2 student loans currently face an interest rate between 4.3% and 7.3%, with rates not expected to fall substantially until September 2025. At that point, the RPI will have been below 4.3% for 18 months.
Much more significant in the long term for borrowers will be the long-running freeze in the loan repayment threshold. In 2022, the previous government announced that the repayment threshold would be frozen at £27,295 – its level in the 2021–22 fiscal year – until 2024–25, instead of rising with average earnings. At the time, average earnings were expected to increase by 12% over the period of the freeze. The most recent forecasts suggests they will have increased by nearly a quarter (23%), so that the impact of the freeze has been roughly twice as large as planned.
Figure 5.6. Minimum and maximum interest rates charged on Plan 2 student loans since 2012–13
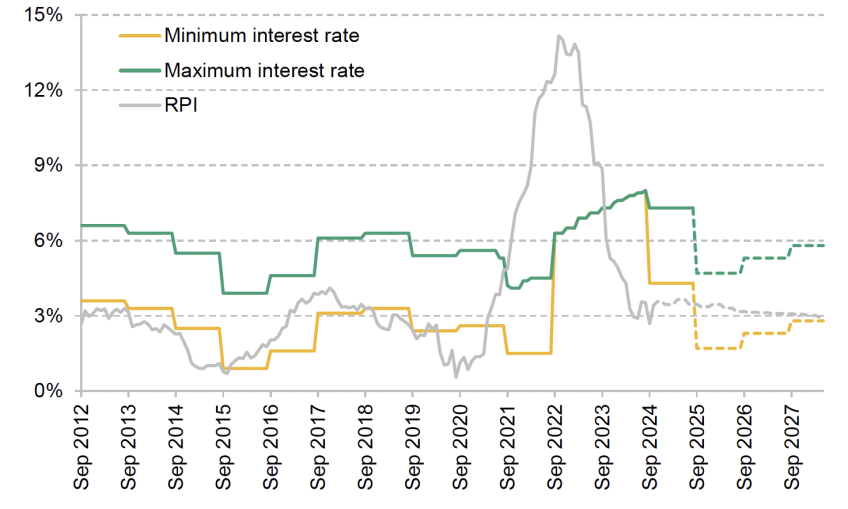
Note: Dashed lines are forecasts. Forecast interest rates applying from September reflect the forecast for the RPI in the year to the previous Q1. The prevailing market rate cap is assumed to be applied quarterly.
Source: Department for Education guidance, ‘How interest is calculated – Plan 2’ (https://www.gov.uk/guidance/how-interest-is-calculated-plan-2); Office for National Statistics, RPI All Items (https://www.ons.gov.uk/economy/inflationandpriceindices/timeseries/czbh/mm23); Office for Budget Responsibility’s Economic and Fiscal Outlook – October 2024; authors’ calculations.
That freeze was due to expire in April 2025, and the government has confirmed that the threshold will at that point increase from £27,295 to £28,470 (4.3%). Compared with extending the freeze, this will reduce annual loan repayments in cash terms from borrowers earning over the new threshold by £106 next fiscal year. This return to indexation will be welcomed by existing borrowers, although their monthly repayments will remain much higher than they would have been had the threshold not been frozen for the previous three years.
The government could consider more fundamental changes to the student loan system. When she was Shadow education secretary, Bridget Phillipson had written that the then-government’s 2022 reforms to loan terms had made the system worse, and referred to alternative proposals for making the system ‘fairer and more progressive… [reducing] the monthly repayments for every single new graduate without adding a penny to government borrowing or general taxation’.37 However, the Labour manifesto at the 2024 General Election did not mention student loan reforms, and no proposals have been forthcoming from the party in its first five months in office.
There would be ways to make repayments more ‘progressive’ amongst graduates. Repayments from the lowest earners could be reduced by increasing the repayment threshold (the level of earnings above which repayments are made) or by reducing the loan term so that outstanding balances are wiped more quickly. However, within the structure of the current system, the only way to increase lifetime repayments from the highest earners who are expected to fully repay their loans in real terms is to reintroduce a maximum interest rate above inflation for new borrowers.38 Any other change that was revenue-neutral for the government would only redistribute between low- and middle-earning graduates.39
Another important consideration for any reforms would be how to treat the several million existing student loan borrowers. In England, successive loan reforms have produced a complicated landscape, with new loan terms typically applying only for new borrowers, leaving different cohorts subject to different terms. By 2028–29, the Department for Education expects there to be 2.0 million borrowers with outstanding Plan 1 loans (down from 2.5 million in 2023–24), 5.5 million with Plan 2 loans issued between 2012 and 2022 (a number barely starting to fall in that year) and 1.3 million with Plan 5 loans (which is set to increase further as new loans are issued). The Scottish Government took a different approach in 2021, transferring all existing Scotland-domiciled borrowers with Plan 1 loans to new Plan 4 loans, with a higher repayment threshold.
Potential loan reforms would still affect the government’s ability to meet its fiscal rules, but now in slightly different ways than under the previous fiscal framework. A reform that reduced the expected value of future repayments from existing English borrowers would reduce the value of the loan asset reflected in PSNFL, and so would be felt more quickly than under the previous debt rule (as PSND would only be affected when the loan repayments actually failed to materialise, and only gradually). But such a reform would not affect the government’s ability to achieve current budget balance, whereas it would previously have immediately increased PSNB.
5.5. Summary
So far, the new government has broadly continued the previous government’s policies on higher education funding. The starkest break with recent policy – increasing the tuition fee cap with inflation – has arrested the steady real-terms decline in teaching resources for higher education. But falls in international student numbers at some universities, and additional costs from the rise in employers’ NICs, mean that ending the fee freeze will not be enough to put the sector on a secure financial footing. University finances will remain a headache for the new government at the spending review in summer 2025 and as it sets future tuition fee caps.
On student support, the picture has been one of continuity, rather than change. Increasing maintenance loan entitlements in line with forecast inflation next year will leave real-terms cuts in generosity under the previous government in place. If the long-running freeze in the parental earnings thresholds is maintained, many students will see their entitlements fall in real terms next year.
If the government was minded to reshape how higher education is funded – for example, changing the balance between loan and grant funding, or how loans are repaid – it will confront difficult trade-offs. Changes to the fiscal framework have, if anything, made funding the system through loans rather than grants more appealing, and do not allow the government to escape difficult choices around who pays for higher education.
6. Comparisons
In this chapter, we compare the level of spending per pupil or student across the different stages of education. Figure 6.1 compares the trends in public spending per student on various stages of education over time in England, whilst Figure 6.2 shows the levels relative to primary school spending per pupil. For the early years, schools and further education colleges, we base these on the figures presented in Chapters 2–4, with projections up to 2025–26. For higher education, we focus on total upfront public resources provided for teaching. This is effectively tuition fees (minus any fee discounts) plus teaching grants. Whilst this includes upfront funding that will eventually be repaid via graduate contributions later in life, we feel this gives a better measure of the public resources available for teaching.
Figure 6.1. Spending per pupil or student per year at different stages of education (2024–25 prices)
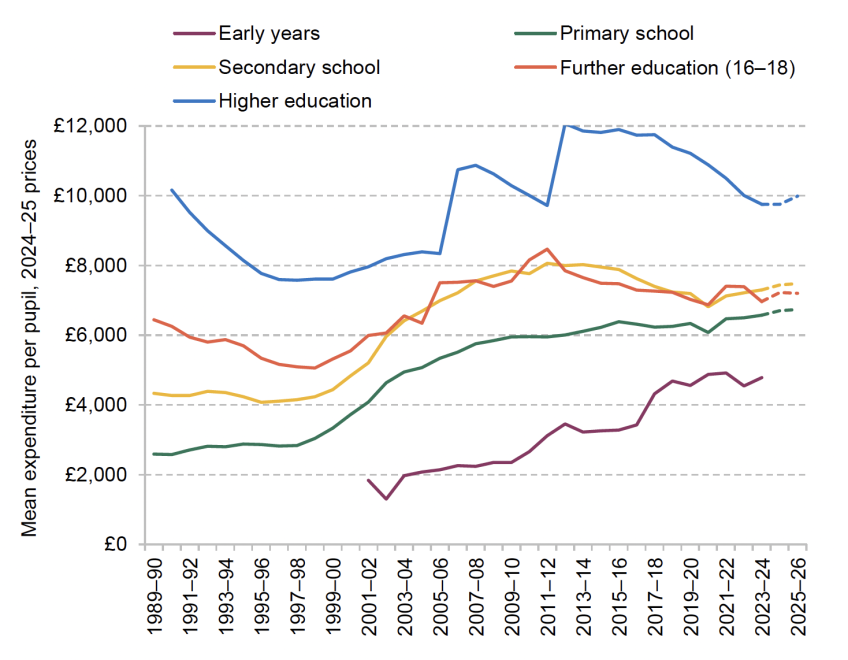
Note and source: Early years figures are spending per part-time equivalent child for 3- and 4-year-olds taking up a place. Secondary school spending per pupil includes spending on school sixth forms. Further education figures represent spending per student aged 16–18 in further education and sixth-form colleges. Higher education figures are cohort-based numbers divided by 3 – an approximate course length. See also HM Treasury (2024).
Figure 6.2. Relative spending per pupil or student per year at different stages of education (primary school spending per pupil = 1)
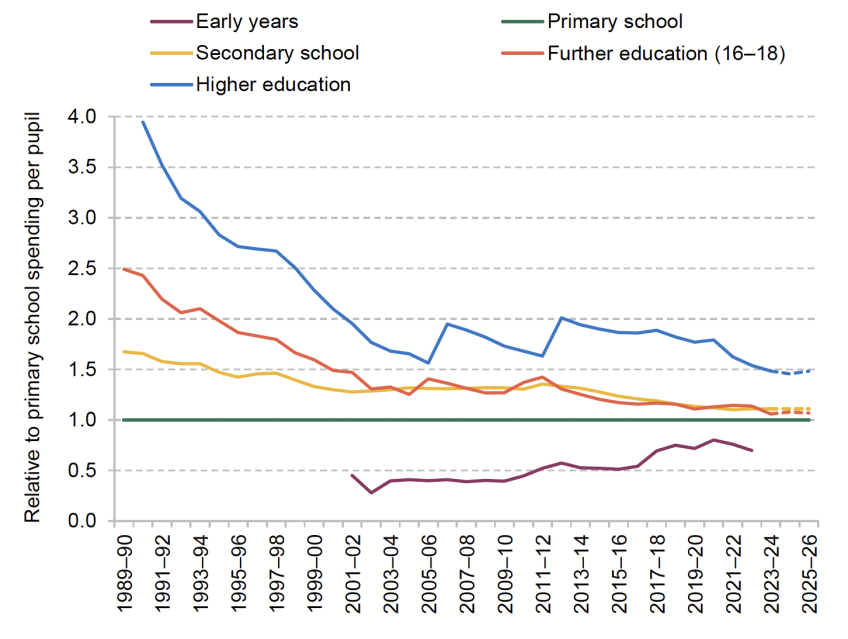
Source: See Figure 6.1.
The shape of public spending on education has changed significantly since the early 1990s. In 1990–91, there was a very clear gradient across education stages: the older the pupils being taught, the higher the level of public spending (or resources) per pupil per year. Although this broadly remains true now, the relative differences are much, much smaller.
At the start of the period in 1990–91, higher education spending was £10,200 per student per year (this and all figures here are in 2024–25 prices), about four times the level of primary school spending per pupil, and it all came directly from government spending. Further education spending was about £6,300 per student and 2.4 times the level of primary school spending (and 1.5 times the level of secondary school spending) per pupil. Secondary school spending was £4,300 per pupil, about 1.6–1.7 times the level of primary school spending per pupil (£2,600). Early years spending was very low (less than £100 million in total, with no centralised national programmes for early education) and is not shown on these graphs as a result.
Over the next 30 years, there were then significant changes in this balance of spending, with three distinct phases of change: falls in spending (1990–91 to 1997–98); rapid growth (1997–98 to 2010–11); and differential protections from spending cuts (2010–11 onwards).
In the period of falling spending during the 1990s, higher education spending per student fell by 25% in real terms and further education spending per student aged 16–18 fell by 19% in real terms between 1990–91 and 1997–98. These cuts largely reflected total spending not keeping pace with rapid rises in student numbers. Secondary school spending per student fell by 3% over this period, whilst primary school spending per student rose by about 10% in real terms. These trends significantly narrowed the differences in spending per student between schools and further and higher education.
Spending per student then rose significantly across all stages of education between 1997–98 and 2010–11, though at different rates and for different reasons. The early years entitlement was introduced in the late 1990s, initially representing about £1,900 per child, and rose to about £2,700 in 2010–11 or 45% of the spending per pupil in primary schools. Turning to schools, we see that spending per pupil rose by about 6% per year in real terms in primary schools, and by about 5% per year in secondary schools. This led primary school spending per pupil to rise from £2,800 in 1997–98 to £6,000 in 2010–11, and secondary school spending to rise from £4,200 to £7,800 per pupil. This narrowed the ratio between secondary and primary school spending per pupil from 1.5 in 1997–98 to 1.3 in 2010–11.
Further education spending per student also rose, but at the slower rate of about 4% per year in real terms. This narrowed the difference between further education and school spending per student, with further education spending per student only about 40% greater than primary school spending per pupil and very similar to secondary school spending per pupil by 2010.
Following the big decline during the 1990s, higher education spending per student increased by about 32% in total between 1997–98 and 2010–11, or about 2% per year, on average, in real terms. These increases largely reflected the introduction of tuition fees in 1998 and their increase to £3,000 in 2006. By 2006–07, spending per student in higher education was back above its level in 1990. However, cash-terms freezes in fees up to 2010 led to real-terms declines in spending per student, taking it back to below 1990 levels again. This meant that higher education spending per student was only 70% greater than primary school spending per pupil in 2010, having been about 2.7 times higher in 1997 and nearly 4 times in 1990.
Since 2010, most areas of education spending have seen real-terms cuts in some form or another. Early years has been the main exception, with spending per child about 80% higher in real terms in 2023–24 than in 2010–11. This mainly reflects extensions to the free entitlement, particularly the extension from 15 to 30 hours for working parents in 2017, and the boosts to hourly funding in 2017 and in more recent years. However, after accounting for rapid growth in early years providers’ costs, real-terms funding per hour is set to be about 8% lower in 2024–25 than in 2016–17. That being said, the expansions to the early years entitlements for children aged under 3 will clearly increase the scale of early years spending in a broad sense.
As we saw in Chapter 5, total school spending per pupil fell by 9% in real terms between 2010–11 and 2019–20. This was felt differently by individual primary and secondary schools, partly because of a transfer of funding and responsibilities from local authorities giving an artificial boost to individual schools’ budgets. Primary school spending per pupil actually rose by 6% in real terms between 2010–11 and 2019–20, reflecting the transfer of responsibilities and funding. Secondary schools saw a worse picture, with a 7% real-terms cut over the same period. This worse picture for secondary schools largely reflects the 28% drop in school sixth-form funding per pupil over the same period. The cuts to school spending per pupil are now being reversed and spending per pupil has largely gone back to at least 2010 levels in 2024. However, the ratio between secondary and primary school spending per pupil is set to be much lower at a difference of 11%.
Further education spending per student aged 16–18 fell by 14% in real terms between 2010–11 and 2019–20, the largest cut across all areas of education spending for young people. This has also been partially reversed, with further education spending per student still due to be about 11% lower in real terms in 2025–26 than in 2010–11.
The 2012 reforms to higher education led to a significant boost in spending per student of about 25% in real terms. This pushed spending per student up to £12,000, well above its level of £10,000 in 1990. However, in a repeat of recent history, there have been real-terms falls in spending per student as fees were frozen in cash terms across most years. In 2023–24, spending per student was around £2,300 or 19% lower in real terms than for 2012–13 entrants, largely because the cap on tuition fees is now 25% lower in real terms than it was in 2012–13. Notably, more than two-thirds of the decline was due to real-terms cuts over the four years between 2019 and 2023. Spending per student is then due to rise by 2% in real terms up to 2025–26 as a result of the decision to increase fees from September. This still leaves spending per student at about the same level in real terms as in 2011–12, just before the increase in tuition fees to £9,000, and about the same level more than 30 years ago in 1990.
This differential pattern of cuts has further narrowed differences in education spending per student by age. In 2023–24, early years spending per pupil represented about 73% of the value of primary school spending per pupil, having been a tiny element of public funding in the early 1990s. Secondary school spending per pupil will be about 11% greater than primary school spending, having been about 66% greater in 1990 and even more so further back in time (Belfield and Sibieta, 2016). Further education spending per student aged 16–18 is now slightly lower than secondary school spending per pupil and only 6% greater than in primary schools, having been more than two times greater in the early 1990s. Higher education spending per student is still higher than across other stages, but is now back to the 1990s level and is due to be only 50% greater than primary school spending per pupil, having been almost four times greater in the early 1990s.
7. Conclusion
The government faces a very difficult set of trade-offs in the spending review in summer 2025. The state of the public finances is very challenging. Current plans for total public services spending imply that most departments, including education, might need to make real-terms savings after 2025. Commitments on tax and the fiscal rules give the government little room to top up these spending plans. They can only really hope for some luck on growth and tax revenues.
Existing plans for education spending provide some clues on how the government may seek to navigate these trade-offs. In order to deliver the expanded entitlement for working families, spending on the free entitlement – already the largest component of early years spending – is still expected to double by 2026–27. The government provided a small real-terms increase in school spending per pupil for 2025, though much of this was focused on the rising costs of SEN provision. Colleges and sixth forms saw extra funding, but growth in student numbers means this only amounted to a real-terms freeze in spending per student, which was already low by historical standards. An inflation-linked rise in the cap on tuition fees arrested a long-run real-terms decline in funding for teaching undergraduates, but university finances are still in a concerning state.
We cannot offer recommendations on how much the government should allocate to specific areas of education in the upcoming review. The government will need to make these decisions with reference to the challenges faced by other areas of public service spending. We can, however, offer advice on the key features of long-term spending plans for each sector.
In early years, for many years, infrequent increases in hourly funding rates have been eroded by rising provider costs, leaving many early years providers squeezed financially. Although 2023 and 2024 saw substantial uplifts to funding rates for younger children, rates for 3- and 4-year-olds are at greater risk of losing value if providers’ costs continue to rise. While the introduction of more nurseries in school settings may have the potential to improve quality, it is unclear whether this will address geographical mismatches in childcare supply. A clearer and more consistent process for setting funding rates is needed – one that accounts for expected costs and ensures equitable access to childcare across all parts of the country.
For schools, the most important priority should be reform of the system for funding SEN provision to ensure that it is both financially sustainable and meets the needs of children. There have been rapid rises in the number of pupils identified with the highest levels of SEN. This has driven large increases in funding, which have accounted for about half of the increase in total school funding and led to large pressures on mainstream school budgets. Spending on SEN has risen by even more, which has led local authorities to build up huge deficits that are effectively kept off the books to prevent many declaring bankruptcy. Without reform, this pattern looks set to continue in the next few years. The government has signalled a long-term desire to expand SEN provision in mainstream schools. This may ease pressures in the long run, but could be costly in the short run. Nevertheless, reform is vital to ensuring financial sustainability and easing pressures across the whole school system.
Further education and skills remain the most uncertain area. Recent decisions, such as establishing Skills England to oversee the transition of the apprenticeship levy into a growth and skills levy, cancelling plans for an ABS and continuing to fund many level 3 qualifications, suggest that the ongoing cycle of changes to this sector will continue. A cohesive long-term strategy for the sector remains absent. Critical questions about the future of T levels and the role of existing level 3 qualifications remain unanswered, as does the challenge of ensuring that training funded through the new growth and skills levy is additional and delivers genuine economic value. For much of recent history, the story of further education and skills has been chaotic and frequent policy changes alongside a long-term decline in resources. To break this cycle, the government must articulate a clear, stable and long-term vision for further education and skills.
Higher education faces big questions, particularly around the growing reliance on international students and how sustainable this will be in the long run. Maintaining the real-terms value of tuition fees and student support is important, but the government needs to set out how it intends to balance the needs of students, taxpayers and universities.
Endnotes
Authors


Christine Farquharson
Christine's research examines inequalities in children's education and health, especially in the early education and childcare sector.

Kate Ogden
Kate joined the IFS in 2020 and works on local government finance and higher education.

Luke Sibieta
Luke is a Research Fellow at the IFS and his general research interests include education policy, political economy and poverty and inequality.

Darcey Snape
Darcey joined the IFS in 2024 as a research economist in the Education and Skills sector.

Imran Tahir
Imran joined the IFS in 2019 and works in the Education and Skills sector.
More from IFS
Understand this issue


Policy analysis


Academic research


