
Downloads
Download report PDF
PDF | 342.74 KB
Executive summary
Key findings
1. Excluding volatile pension cost adjustments, the higher education sector posted a surplus of 3.7% of its income in 2022/23 (£1.5 billion), down from 6.1% of income (£2.5 billion) in 2021/22. Over the same period, the proportion of higher education providers in deficit, weighted by their total income, increased from 1 in 10 to 1 in 5.
2. The 2022/23 surplus was lower than in most years since 2015/16. Teaching-intensive providers, which historically have had larger surpluses, posted their smallest surplus in at least eight years.
3. The main factor behind the sector’s worsening financial performance was the nominal freeze in undergraduate tuition fees for domestic students. Since it was raised to £9,000 in 2012, the cap on domestic undergraduate fees has only increased once, to £9,250, in 2017. Per-student funding for teaching home undergraduate students has now fallen by 18% in real terms since 2012/13 but is still slightly higher than in 2011/12.
4. Real-terms falls in undergraduate fee income were partly offset by higher income from international students. Yearly fee income from non-EU international students nearly doubled in real terms from £4.7 billion in 2016/17 to £8.9 billion in 2022/23. If income from non-EU international students had remained at its 2017/18 level, the sector surplus would now plausibly be around 3 percentage points lower at around 0.7% of income.
5. According to data from the Office for Students, providers in aggregate expected only a tiny surplus of 0.8% in 2023/24. This may still turn out to be optimistic, as it is predicated on continuing strong growth in the number of non-EU international entrants (16%), when Home Office data on study visas suggest a decline. However, with overall sector net assets worth around 16 months of expenditure (15 months for teaching-intensive providers), the sector is well placed to withstand any temporary shortfalls.
6. The cheapest and most straightforward option for an incoming government to address the sector’s worsening finances would be to allow the cap on tuition fees to expire at the end of the 2024/25 academic year. This would be worth £270 million to the sector in the first year and £1.8 billion by 2029/30 compared to a continued freeze. Only about a quarter of the cost would be borne by the taxpayer (and this would be capital spending). The rest would be borne by students, mostly in the form of higher student loan repayments in their 40s and 50s.
7. An alternative would be to increase per-student teaching grants for universities. Greater grant funding for teaching would give the government more control over what subjects were taught but would be much costlier for the taxpayer than increasing fees.
1. Introduction
The finances of higher education providers have fared unexpectedly well in recent years. International student recruitment did not collapse during the COVID-19 pandemic and has actually expanded substantially beyond research-intensive universities, bringing in additional tuition fee income. Digital technologies adopted during the pandemic appear to have delivered some lasting efficiency savings. Pension worries have been eased by higher interest rates.
However, the storm clouds are now gathering. Undergraduate fees for domestic students remain frozen in nominal terms even as universities’ costs have risen. New restrictions on student visas and uncertainty about future immigration policy mean that institutions can no longer rely on an ever-greater number of international students to make up for falling funding for domestic ones.
In 2022/23, the sector-wide surplus (adjusted for mostly one-off pension effects) had already fallen to £1.5 billion, with one-fifth of institutions in deficit. By providers’ own forecasts, only a tiny sector-wide surplus is expected for 2023/24, and this is despite assuming strong growth in international student numbers. Substantial job cuts have already been announced at several institutions.
None of the major parties has outlined any credible plans for what they would do on higher education funding. Both the Conservative Party and Reform UK aim to cut numbers of undergraduate students, and plan to use any savings outside of higher education. The Greens have called for the abolition of tuition fees and would presumably replace lost fee income with direct grants to universities. The Lib Dems have promised a review of higher education finance in the next Parliament but haven’t outlined specific plans for higher education funding. The Labour Party manifesto states that ‘higher education is in crisis’ with a funding settlement that ‘does not work for the taxpayer, universities, staff, or students’ but includes no specific plans for changes to the current funding model.
This report examines the higher education sector’s current financial challenges and a new government’s options for addressing them. Section 2 digs into the finance data up to 2022/23, focusing on information from providers’ income statements.1 Sections 3 and 4 examine two challenges in more detail: the frozen fee cap for domestic undergraduate students and the sector’s increasing reliance on international students. Section 5 discusses what has likely happened in the current academic year and looks ahead to the future. Section 6 lays out the policy options for an incoming government wishing to put the funding of undergraduate teaching on a sustainable footing, along with their costs and potential impacts. Section 7 concludes.
2. University financial health up to 2022/23
In the 2022/23 academic year, the total income of the English university sector was £40.8 billion or 1.6% of UK GDP.2 Expenditures were £39.2 billion, leaving the higher education sector with an overall surplus of £1.5 billion.3 This is down from a surplus of £2.5 billion in 2021/22.4
These expenditure and surplus figures are exclusive of ‘pension cost adjustments’, which represent mostly one-off adjustments to expenditure figures resulting from the changing projected cost of university pensions. Throughout this report, we exclude these adjustments, as they otherwise introduce substantial volatility into providers’ expenditure and hence their surpluses/deficits that is unrelated to their operational financial performance. We discuss pension cost adjustments in detail in Appendix A.5
As shown in Figure 1(a), universities’ expenditures are much less volatile from year to year once pension cost adjustments are removed. Across the sector, income and expenditure (adjusted to remove pension cost adjustments) have risen roughly in parallel since 2015/16, with real-terms growth in income of around 18% and growth in expenditure less pension cost adjustment of around 21% over seven years. This is roughly twice as fast as the overall UK economy, which grew by around 9% over the same period.
Figure 1. Total income and expenditure of English universities by academic year, £ billions, in 2022/23 prices
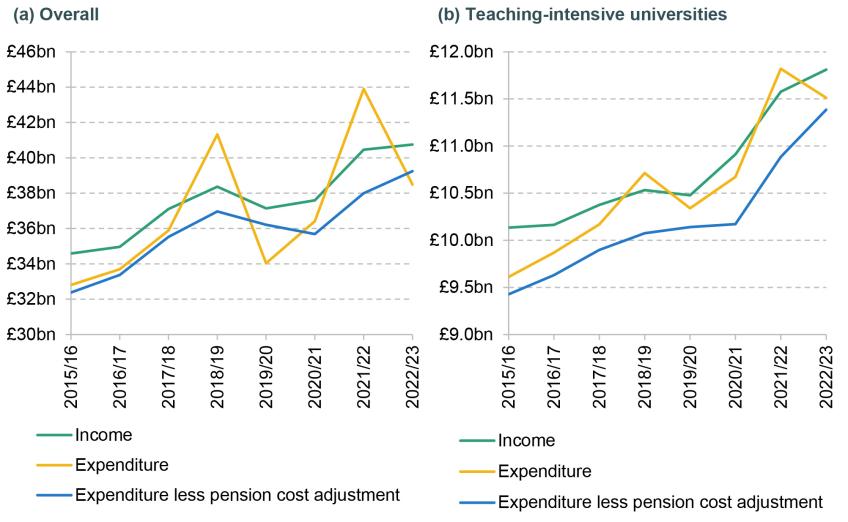
Note: We include only the subset of providers in England which appear in every year of the finances data from 2015/16 to 2022/23 to allow for consistent comparisons over time. Teaching-intensive universities are those for which income from tuition fees accounted for at least 30% of income in 2022/23. University financial years typically run from August to July, so figures for 2022/23 relate to the year to July 2023.
Source: Authors’ calculations using Higher Education Statistics Agency (HESA) finances data (various years); GDP deflator from the Office for Budget Responsibility’s Economic and fiscal outlook – March 2024 (https://obr.uk/efo/economic-and-fiscal-outlook-march-2024/).
We separately examine the finances of a specific subset of ‘teaching-intensive’ universities, defined as those for which income from tuition fees constitutes more than 70% of total income. While these institutions account for less than a third of the sector’s income, they deliver more than half of all undergraduate teaching. Teaching-intensive universities are financially more at risk because their income streams are less diversified, their reserves tend to be lower, and their typically lower selectivity means that they are more exposed to fluctuations in student demand. As shown in Figure 1(b), the trends in income and expenditure for teaching-intensive universities have been similar to those for the sector as a whole over recent years.6
As an indicator of financial health, we focus on whether a university is in surplus (with income exceeding expenditure once we remove the impact of ‘pension cost adjustments’ on expenditures) or in deficit in a given academic year. While running a deficit in a single year may not be a cause for concern – universities are usually able to draw down reserves to meet shortfalls – consistently running a deficit would not be sustainable in the long run, and growing deficits across the sector might indicate problems with the long-run viability of the funding model.
Figure 2 shows the evolution of surpluses since 2015/16, expressed as a proportion of income, across the sector as a whole and amongst teaching-intensive universities. The total surplus of the sector declined steadily as a share of income after 2015/16, reaching a low point of 2.5% in 2019/20 (3.2% for teaching-intensive universities).
Figure 2. Surplus as a percentage of income, by academic year
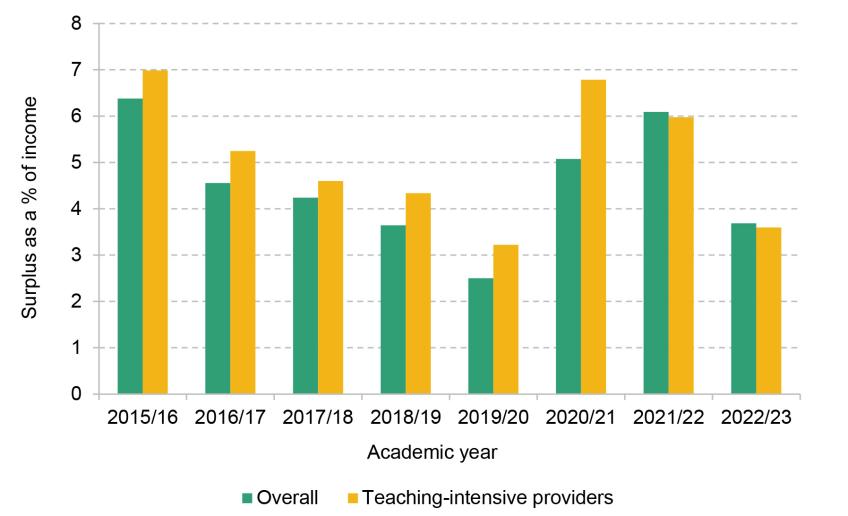
Note: See note to Figure 1. Surplus is total income less expenditure, where expenditure figures are adjusted to remove the impact of pension cost adjustments.
Source: Authors’ calculations using HESA finances data (various years).
This trend was sharply reversed in 2020/21, as universities’ incomes continued to rise in real terms but their expenditures fell slightly on average, leading to a bump in profitability. Pandemic-related changes had a significant impact on universities’ operations, with more teaching delivered online, reduced use of on-campus facilities, and some planned expenditure deferred. Greater use of digital technologies may have enabled more students to be taught using the same staff and buildings. The aggregate sector-wide surplus remained high in 2021/22 at 6.1% of income.
In 2022/23, the sector-wide surplus declined sharply to 3.7% of income, as real-terms growth in expenditure (3.3%) outpaced growth in income (0.7%). Real-terms increases in expenditure were driven by non-staff expenditures; staff expenditures, which make up slightly more than half of total expenditures for providers, grew in line with income at a rate of 0.7%, with nearly identical growth for academic and non-academic staff. At least for academic staff, this implied a real-terms cut in cost per hour worked, as the number of full-time equivalent academic staff grew by 2.5% over the same period.7
Teaching-intensive universities, which historically had larger surpluses as a share of income than the sector as a whole, similarly decline from 6.0% to 3.6% of income. For these providers, real income growth up to the 2022/23 academic year was relative strong at 2.0%, but real expenditures grew substantially faster still at 4.6%. These numbers point to an increasing financial squeeze despite strong real growth of the sector, especially for teaching-intensive universities.
The trends in the sector’s aggregate surplus were reflected across different levels of provider profitability. As shown in Figure 3, more than a fifth of universities (weighted by income) had an in-year deficit in 2022/23. This compares to a tenth of providers in the previous year and is higher than had been typical before the pandemic. There was also a substantial fall in the share of providers achieving surpluses of more than 10% of their income, from 19% to 1%. Amongst teaching-intensive universities, the share in deficit in 2022/23 was the highest in at least eight years.8
Figure 3. Distribution of in-year surpluses and deficits, by academic year
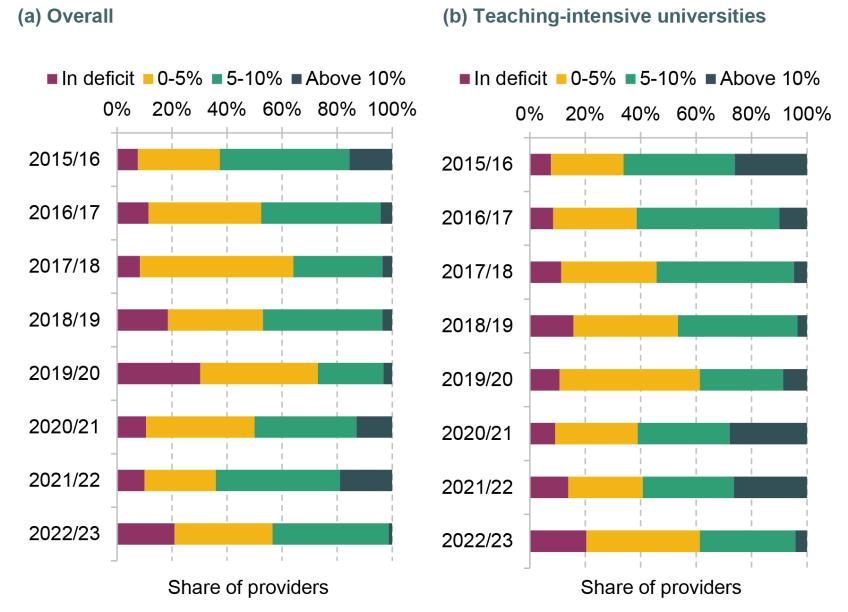
Note: See notes to Figures 1 and 2. Share of providers is weighted by provider income.
Source: Authors’ calculations using HESA finances data (various years).
However, deficits remained relatively small compared to providers’ net assets (assets minus liabilities). For the sector as a whole, net assets were worth around 16 months of expenditure (15 months for teaching-intensive providers). The median deficit, weighted by income, was 1.5% of net assets. The largest deficit as a share of net assets in 2022/23 was worth 9% of net assets.9 These numbers suggest that, as of 2022/23, provider balance sheets were in good shape, and no provider in our analysis sample was facing an immediate threat of insolvency.
Of the fifth of all providers by income in deficit in 2022/23 (37 institutions), only six had also been in deficit in both of the past two years. Together, these six providers accounted for only 1.7% of sector income. This suggests that consistently running deficits remained relatively rare up to 2022/23, although given the worsening overall financial picture for the sector we describe in Section 5, this is likely to become more common going forward. Of the fifth of all providers by income in deficit in 2022/23 (37 institutions), only six had also been in deficit in both of the past two years. Together, these six providers accounted for only 1.7% of sector income. This suggests that consistently running deficits remained relatively rare up to 2022/23, although given the worsening overall financial picture for the sector we describe in Section 5, this is likely to become more common going forward.
3. Declining resources for teaching domestic undergraduates
The most important driver of the relatively low real-terms growth in university income in 2022/23 was the continuing real-terms erosion of the resources available for teaching domestic undergraduate students. On average, £9,600 was available per year in upfront funding for teaching a UK-domiciled undergraduate student starting a course at an English university in 2023/24. This includes the tuition fees universities can charge to students, teaching grants universities receive from government, and an estimate of fee waivers and bursaries offered by universities (which reduce the funding they have available for teaching).
At £9,600, per-student funding for domestic undergraduates was also still substantially higher than funding at any other stage of education in England, including for secondary schools (£7,000) and for 16–18 year olds in further education colleges (£7,100).10 But, as shown in Figure 4, this was 18% less in real terms than for someone starting a course in 2012/13 – the first year after the substantial increase in tuition fees from £3,225 to £9,000 per year (an increase partly offset by a cut in teaching grants). In effect, a long-running cash-terms freeze on domestic tuition fees (with only one uplift, in 2017, raising the cap from £9,000 to £9,250) translates into a substantial real-terms cut. The freeze has very nearly returned universities’ teaching resources to where they were before the fee increase.
Had the fee cap instead been linked to economy-wide inflation (measured by the GDP deflator), it would have reached £12,000 this academic year. Capped domestic tuition fees accounted for 25% of all income for the sector in 2022/23 (and 47% at teaching-intensive universities).
Figure 4. Spending per pupil or student per year at different stages of education, 2023/24 prices
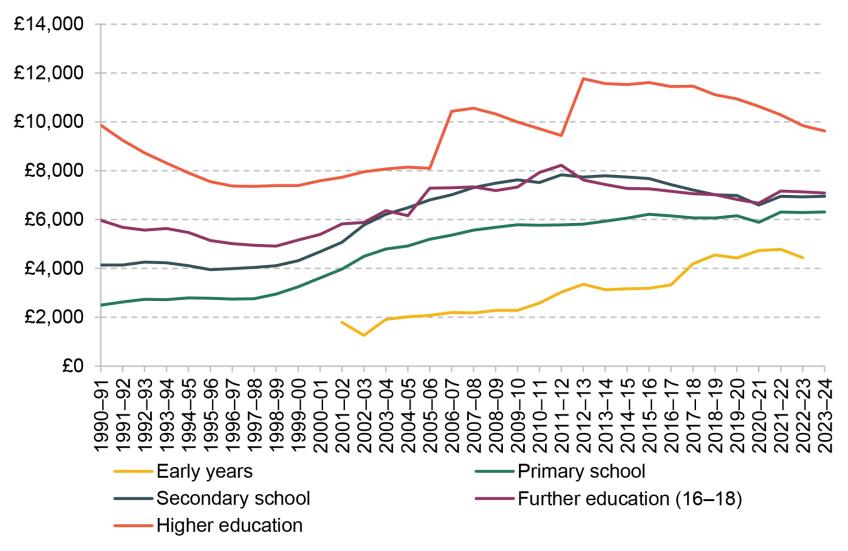
Note: Early years figures are spending per part-time-equivalent child for 3- and 4-year-olds taking up a place. Secondary school spending per pupil includes spending on school sixth forms. Further education figures represent spending per student aged 16–18 in further education and sixth-form colleges. Higher education figures are upfront resources available for teaching home undergraduate students, and cohort-based numbers divided by 3 – an approximate course length in years.
Source: Drayton et al. (2023, Figure 6.1).
Sector estimates submitted to the Office for Students suggest that the available funding did not cover the full costs of educating undergraduate students in 2021/22.11 However, there are good reasons for caution in interpreting these estimates.12 The 2019 independent review of post-18 education and funding (‘Augar Review’; Department for Education, 2019) concluded that, while it was difficult to estimate what it ‘should’ cost to teach an undergraduate student, ‘significant efficiency savings’ were possible. While policymakers had introduced a cap on fees at £9,000 in 2012/13, the expectation had been that the fees for many courses would be set closer to £6,000 or £7,000 (see Willetts, 2010).
4. Increasing reliance on international student fees
In recent years, universities have recruited increasing numbers of international students. In 2021/22, the latest year for which comprehensive data on student numbers are available, international students accounted for around a quarter (24%, 555,000) of all students enrolled at English higher education providers and for 29% of all first-year students (310,000).13 While the number of students from the EU has fallen by 14% (16,000) since 2017/18, the number of students from outside the EU has increased by two-thirds (183,000) over the same period.
Other data suggest there was continued rapid growth in international student numbers between the 2021/22 and 2022/23 academic years, with the annual number of student visas granted reaching a new record of 484,000 in 2022.14 This was a 29% rise on the previous year (376,000) and a 112% rise on 2018 (228,000).
International students are not subject to the same tuition fee cap as domestic students, with average tuition fee income per international student exceeding £20,000 per year in 2021/22 at the highest-ranked UK universities.15 Income from tuition fees paid by non-EU international students was worth £4.7 billion in 2016/17 (in 2022/23 prices) and increased to £8.9 billion in 2022/23, when it accounted for 22% of all university income.
As shown in Figure 5(a), international fees accounted for 41% of all tuition fee income in 2022/23, compared to 26% in 2016/17. Over the same period, the share of tuition fee income from UK-domiciled students has fallen from 63% to 52%. These trends are the same at teaching-intensive universities, as shown in Figure 5(b), but the share of fees from UK students is much higher on average for these institutions.
Figure 5. Share of tuition fee income by student domicile, by academic year
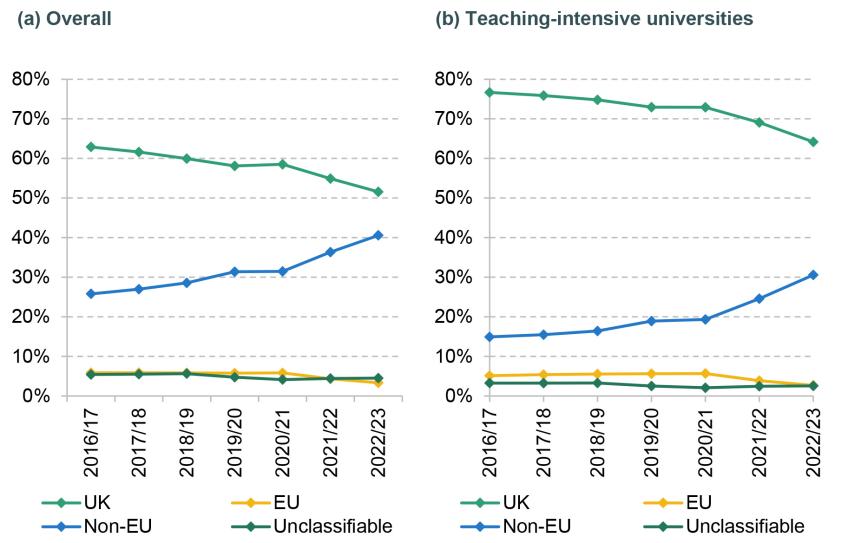
Note: See note and source to Figure 1.
Higher fee income from international students accounts for all of the increase in university incomes since 2017/18 – both across the sector and at teaching-intensive universities. But crucially, as well as additional income, recruiting additional students also means higher expenditure. Sector estimates submitted to the Office for Students suggest that non-publicly funded teaching (mainly international students) on average costs universities around two-thirds of the income universities receive for this teaching.16 However, there are good reasons to be cautious in interpreting these estimates. In particular, these average cost estimates could be substantially above the true cost of teaching additional students for providers with spare capacity.
Figure 6 shows how the aggregate surplus of the sector has evolved since 2017/18 (green) and how they may have instead evolved if fee income from international students had remained constant in real terms instead of rising substantially (yellow). Based on the Office for Students estimate of average costs for 2022/23, this modelling makes the simplifying assumption that each £1 of income from international student fees translated into a 32p increase in university surpluses in every academic year. These calculations suggest that, all else equal, sector surpluses would have been much lower as a share of income by 2022/23 if international fee income had not risen: 0.7% for the sector as a whole. Teaching-intensive universities would have had a deficit of 0.8% of income on average in 2022/23.
We further consider the financial position of the sector if income from non-EU international fees had remained constant and the tuition fee cap had risen with the GDP deflator since 2017/18 (instead of being frozen). That would have seen tuition fees reach £10,800 per in 2022/23, 17% higher than they are now. In that case, sector surpluses may have reached 5% by 2022/23, and 8% at teaching-intensive universities. This suggests that, by 2022/23, the sector was still worse off financially (with the tuition fee freeze and rise in international student fees) than it would have been if the tuition fee cap had risen and there had not been the same growth in international student recruitment – to the tune of 1.6% of total income or around £0.6 billion in 2022/23.
Figure 6. Actual and counterfactual surplus before pension adjustment as a percentage of income
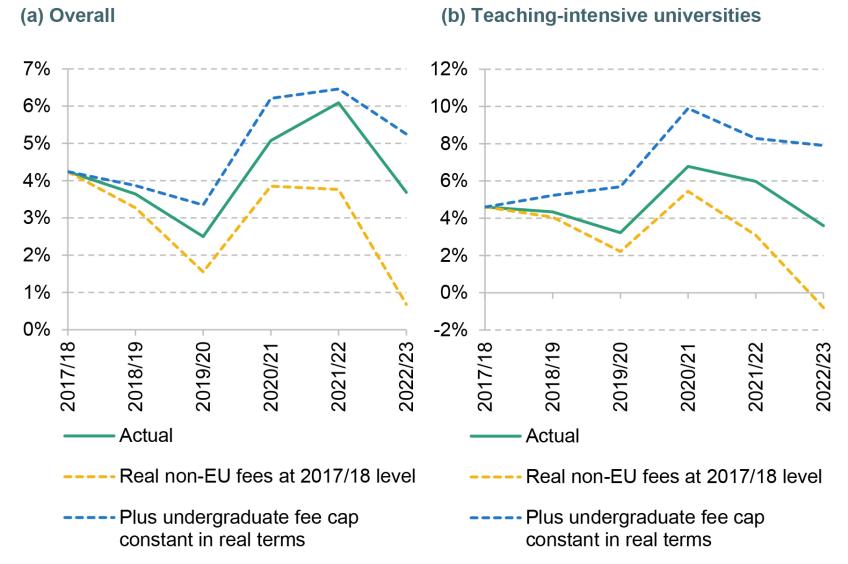
Note: See note and source to Figure 2. Assumed surplus generated in relation to international student fees informed by Office for Students (2023).
5. How have university finances fared since 2022/23?
The figures on surpluses above are for the 2022/23 academic year, reflecting the latest finance data published by HESA. Since then, a significant positive development for higher education providers’ finances has been the improvement in the finances of the Universities Superannuation Schemes (USS), the largest university pension scheme. Largely due to the increase in long-term interest rates, USS moved to a surplus of £7.4 billion at its 2023 valuation – a swing of more than £40,000 per scheme member in three years. As a result of the improved finances of USS, employers now need to make substantially lower pension contributions (14.5% instead of 21.6% of salary) despite higher future benefits for scheme members. Employees also pay less (6.1% instead of 9.8% of salary), amounting to a substantial implicit pay rise.17
At the same time, relatively high inflation in 2023/24 will have had knock-on impacts for university running costs (including through staff wage demands) and will have meant that the continued freeze in domestic tuition fees will have bitten harder. According to providers’ own projections (submitted to the Office for Students in around December 2023 or January 2024), total expenditure without pension cost adjustments was expected to increase by 6% in nominal terms between 2022/23 and 2023/24, or roughly in line with economy-wide inflation. In contrast, providers expected their total income to grow at a rate of only 3.7% in nominal terms, representing a fall of 2.6% in real terms (Office for Students, 2024). This works out to a tiny projected sector-wide surplus of 0.8% of sector income, down from 3.7% in 2022/23.
These projections are predicated on strong growth in student numbers of 6.3% for UK students and 10.7% for non-EU international students. Especially for non-EU international students, these projections appear optimistic. The sector predicted an increase in entrants by 15.7%, but study visas issued in the 2023 calendar year actually fell by 5% compared with the previous year. For January 2024 entry, data from an international student enrolment platform suggests that postgraduate entrants were down by around one-third on the year before.18 Less selective providers especially may have struggled to recruit the number of students they were expecting.
In their submissions to the Office for Students, providers’ predictions have sector-wide surpluses rising again from 2024/25 on the back of further growth in international student numbers, despite an expected further erosion in the value of domestic undergraduate teaching resources. But the mood in the sector seems to have shifted in recent months. Perhaps recognising that these forecasts may have been overly optimistic, many institutions are now reported to be cutting costs, seeking to make redundancies, or closing whole courses.19
6. Policy options
The continuing cuts in funding for universities to teach domestic undergraduates – arising from a freeze in the fee cap without corresponding increases in teaching grants to make up for it – are the main factor destabilising higher education finances. While providers have so far been able to compensate for the cuts in income from domestic students with increased recruitment of international students, this strategy now appears to be coming up against the limits of political acceptability. In 2022/23, sector finances were still in decent shape overall but clearly deteriorating, with more and more institutions struggling to stay in the black.
This section discusses two ways in which an incoming government could address this problem. The most straightforward way would be to allow the fee cap on tuition fees for UK undergraduates to rise with inflation. Alternatively – or in addition – a new government could increase direct grants to higher education providers to make up for further losses in fee income.
Increasing tuition fees
Under current government policy, the tuition fee cap is expected to remain frozen at £9,250 for one more academic year (2024/25). There are no concrete plans for how the level of the tuition fee cap will be set for the 2025/26 academic year and beyond, but the government’s stated default indexation assumption is that fees should rise with forecast RPIX inflation. Based on the latest official inflation forecasts, this would mean that the 2025/26 fee cap would be 2.1% higher in cash terms at £9,450 and would reach £10,500 by 2029/30.
Relative to keeping the fee cap frozen, raising it with RPIX from 2025/26 would avoid a further real-terms cut in funding for the sector of around £270 million in 2025/26 and an expected £1.8 billion by 2029/30. A credible government commitment to end the freeze would give providers much-needed certainty about their future income per student. As things stand, it is clear that the current freeze is unsustainable (in the absence of increases in teaching grants to make up for it), but there is no way for providers to know how much longer it will last.
As shown in Figure 7, if the tuition fee cap were frozen indefinitely and per-student teaching grants maintained in real terms, the per-student resources available for teaching domestic undergraduates would continue to fall, dropping below £8,700 in 2023/24 prices for those starting courses in 2029. Ending the freeze and indexing fees with the GDP deflator would see resources roughly maintained in real terms, at a higher level the earlier the freeze expired.
Figure 7. Upfront funding for higher education per student per year under different policies on tuition fees, 2023/24 prices
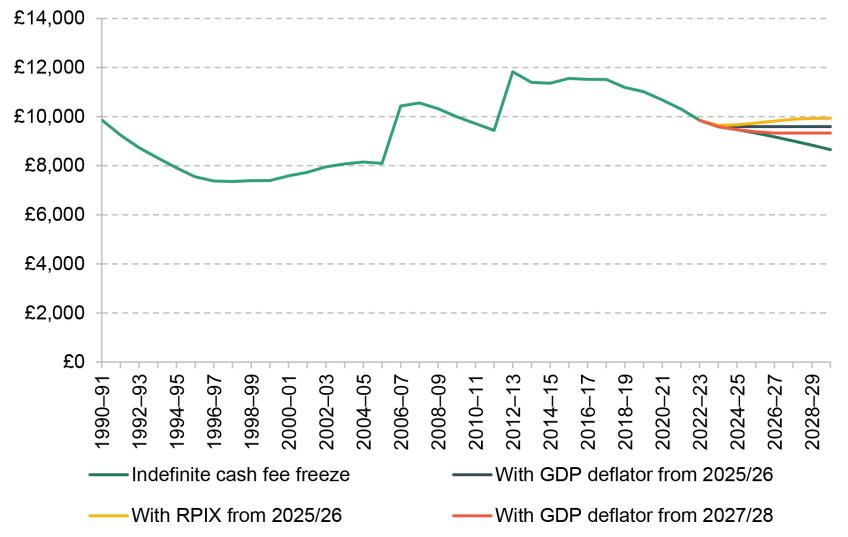
Note: Higher education figures are upfront resources available for teaching home undergraduate students, and cohort-based numbers divided by 3 – an approximate course length in years. Under all policies, we assume per-student teaching grants are constant in real terms after 2024/25 and fee waivers and bursaries are constant as a share of tuition fees.
Source: Authors’ calculations following same methodology as in Drayton et al. (2023).
Increasing fees in line with forecast RPIX would be more generous still, and see teaching resources per student increase to slightly above £9,900 for the 2029 starting cohort.
Raising the fee cap would be fairly cheap for the taxpayer. Under the loan terms applying for new borrowers (Plan 5), we expect that around a quarter of any additional tuition fee loans extended would eventually be written off, at a cost of around £65 million to government in the first year. The remaining three-quarters would eventually be repaid by graduates, as those who can expect to repay their loans in full before they are written off (40 years after graduation) would continue to make repayments for a few more months.
Of course, any increase in tuition fees would lead to higher loan balances in cash terms for affected students. But the impact on actual student loan repayments would not be felt for many years. We model the impact on student loan repayments if the fee cap was indexed to inflation from 2025/26, compared to if it continued to be frozen in nominal terms. As shown in Figure 8, amongst those starting courses in 2025 and studying for three years, less than a third of borrowers would see any difference in their loan repayments before they reached the age of 40. This is because until the loan is paid off, student loan repayments only depend on a borrower’s earnings and not on their loan balance. Around one in five would never repay any more, as they would never clear their loans even if the freeze continued.
The eventual share of the cost of an increase in tuition fees borne by taxpayers and graduates also depends on the student loan repayment terms in place. Under current policy, the repayment threshold – the earnings level above which graduates make loan repayments – is set to remain frozen in cash terms until 2027, making the loan repayment terms less generous for successive cohorts of graduates. Amongst those starting courses in 2029, an increase in tuition fees would typically affect their repayments earlier, with 40% of borrowers seeing an increase affecting their loan repayments before age 40, and only 15% never repaying more as a result of a fee increase.
Figure 8. Proportion of borrowers who would have made higher repayments by each age if fee freeze was allowed to expire in 2025/26 compared to continued freeze
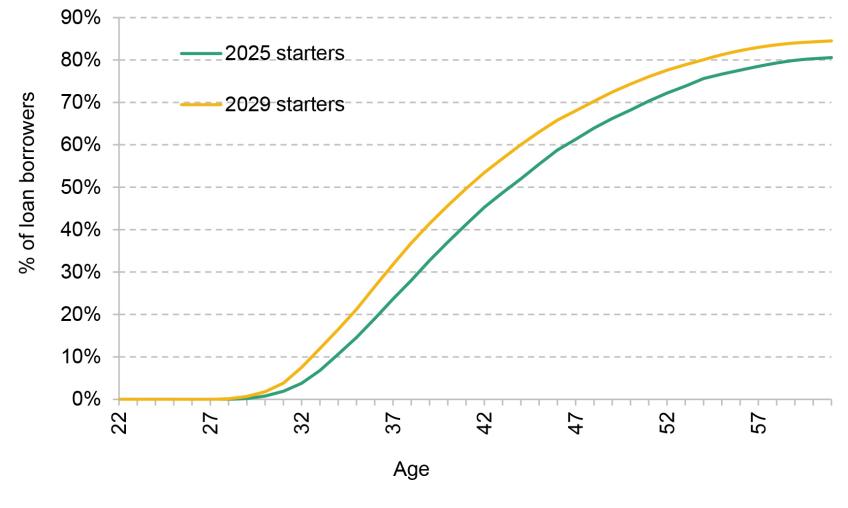
Note: Compares expected loan repayments made by 2025 and 2029 starting cohorts if fee freeze was allowed to expire in 2025/26, compared to continuing indefinitely. Loan repayment terms are for Plan 5 borrowers and are assumed to reflect current government policy, including the freeze in the repayment threshold until 2027. Restricted to those on three-year courses and assumes all start courses at age 18.
Source: Authors’ calculations using IFS student finance calculator (https://ifs.org.uk/student-finance-calculator).
Increasing direct grants to universities
An alternative – or a complement – to raising tuition fees would be to instead increase the teaching grants paid to universities by the Office for Students on behalf of the government. In 2023/24, £1,034 million was allocated to fund the teaching of high-cost courses, including medicine, dentistry and other laboratory-based courses.
Increasing grant funding would have the advantage that teaching grants could be increased differentially across courses. As highlighted by the 2019 review of post-18 education and funding (‘Augar Review’; Department for Education, 2019), there is a mismatch between funding and the cost of provision in the current system, which makes it financially attractive for universities to shift provision towards courses that are inexpensive to teach. Increasing teaching grants would allow an incoming government to remove this mismatch. In addition, differential grant funding could be used to encourage provision in areas deemed of particular value to society.
Increasing grants would be four times as expensive for the taxpayer as delivering the same increase in teaching resources through higher loans, as the whole cost would be borne by the taxpayer. This additional spending would make it more difficult to meet the current ‘fiscal mandate’ (which both Labour and the Conservative Party have signed up to), which requires debt to be forecast to fall as a share of national income between four and five years out. While higher loan write-offs would be treated as capital spending in the accounts, any increase in grants to universities would add to current public spending.20
The only way that an incoming government could simultaneously maintain the value of teaching resources per domestic student, keep the freeze in fees, and avoid increasing government spending on higher education would be to pay for an increase in teaching grants through a reduction in the number of undergraduate students. The current public subsidy, in the form of both teaching grants and loan write-offs, would then be spread amongst a smaller number of remaining students.
The Conservative Party’s proposal to cut so-called ‘rip-off degrees’ goes in this direction, although they envision the savings to be used for funding additional apprenticeships instead.21
They estimate that reducing undergraduate numbers by 13% would deliver a saving for the taxpayer of £0.9 billion per year – figures which seem plausible.22 However, it is far from guaranteed that the Conservatives’ plan to cut specific courses would actually lead to a fall in overall student numbers, as universities would be free to expand other areas of provision.23
An alternative, which would lead to more certain falls in overall student numbers (but which the Labour Party has already ruled out24), would be to bring back some version of student number caps, which applied in England until 2015. Given that the number of 18-year-olds in England is expected to increase by nearly 10% (65,000) over the next six years, a cut of around a quarter in the share of domestic students going to university would be required by 2029/30 to keep the overall taxpayer subsidy to higher education constant if the tuition fee cap freeze were allowed to expire.25
By design, imposing such limits would exclude some prospective students with lower prior attainment from a university education. This would deprive them of the financial and other benefits they would otherwise obtain from going to university.26 If those prospective students went on to earn less than if they had gone to university, as is likely for most, new number caps would also lead to lower future tax receipts for the government.27
7. Conclusion
Universities have had a string of good luck in the past few years – but now the reality of frozen fees for domestic undergraduates is starting to bite. So far, providers have been able to partially compensate for the cuts in income from domestic students with increased recruitment of international students, but this approach now seems to be hitting the limits of what is politically acceptable. Sector finances are still in decent shape overall, but they are already deteriorating, with more and more institutions struggling to stay in the black.
For a new government, there is a good case for letting the nominal fee freeze expire at the end of the 2024/25 academic year, with tuition fees then rising in line with inflation. Alternatively, a new government could commit to increases in the level of teaching grants to make up for the effect of a continuing freeze. This would be much more costly for the taxpayer, unless the total number of domestic students were cut at the same time to make up for the additional cost per student. Any party considering further restrictions on international students will need to carefully consider the effect on higher education providers, which would now be felt well beyond financially resilient research-intensive universities.
Appendix A. Pension cost adjustments
The pension cost adjustments to expenditures in the HESA finance record represent the difference between the cost of pension obligations that higher education providers have incurred in an academic year and the pension contributions made by employers and employees over the same period. These adjustments are necessary because, in accordance with current accounting standards, the value of the incurred obligation for future payments counts as expenditure in a given accounting period rather than the cash value of pension contributions. This means that where the value of future pension obligations incurred is greater or smaller than pension contributions made, an adjustment needs to be made to account for the difference.
For some pension schemes, this adjustment is typically small or zero. For defined-contribution pension schemes, employers have no further obligations than their monthly contributions, so no pension cost adjustment is necessary, save for any employer contributions due but not yet paid. Much the same is true for unfunded defined-benefit schemes backed by the government: no obligations fall on providers except for their regular contributions. The two unfunded defined-benefit schemes that are relevant for the university sector in England are the Teachers’ Pension Scheme (important for former polytechnics and colleges) and the NHS Pension Scheme (important for universities with staff teaching medicine or related subjects).
The adjustment is more important for funded defined-contribution schemes. In these schemes, the employer incurs obligations for the payment of future pensions, whose value can be much greater (or smaller) than the contributions made to the scheme, in which case a substantial pension cost adjustment is necessary. How this adjustment is determined depends on whether a defined-benefit scheme is ‘transparent’ or ‘non-transparent’. Whether a scheme is transparent in turn depends on whether its assets and liabilities can be apportioned to a particular employer.
Apportioning assets and liabilities to a particular employer is trivial for single-provider pension schemes and also usually possible for the local government pension schemes in which support staff at some institutions are enrolled. It is not possible for the USS – the largest university pension scheme – and for two smaller funded multi-employer pension schemes in the higher education sector (SAUL and OSPS). This is because employers in these schemes are jointly liable for all obligations and not just for those relating to service at their own institution.
For ‘transparent’ funded defined-benefit schemes such as employers’ own pension schemes, the required ‘pension cost adjustment’ will cover the difference between the present value of future pension obligations incurred in a financial year and actual pension contributions made. This present value can fluctuate from year to year as actuarial assumptions change, but the resulting changes in the pension cost adjustment will rarely have a major impact on a provider’s surplus or deficit. Changes in the valuation of existing pension scheme assets and liabilities, which can be more material, will be recorded as ‘actuarial gain/(loss) in respect of pension schemes’. Along with gains and losses in other assets, these gains and losses are excluded from our measures of income, expenditure and surplus/deficit.
The large swings in pension cost adjustments reported in the main text largely arise from ‘non-transparent’ funded defined-benefit schemes, primarily the USS. Ordinary contributions to these schemes are treated similarly to defined-contribution schemes – they are accounted for when they are due, which is usually at roughly the same time as when they are paid. However, in addition to the ordinary contributions, employers often make further contributions to these schemes known as deficit recovery contributions. These arise when a scheme’s liabilities exceed its costs and a plan is agreed to make up for this deficit through additional contributions from employers. The change in the present value of planned future ‘deficit recovery contributions’ – aggregated over the full length of the recovery plan, which can cover decades – is included in the ‘pension cost adjustment’. This follows the accounting principle that obligations should be accounted for when they are incurred.
This means that in years when a new deficit recovery plan is agreed, the pension cost adjustment can be very large, as the present value of agreed recovery contributions changes by a lot. This was the case in 2021/22, when a new deficit recovery plan for the USS was agreed, as its 2020 valuation had shown a deficit (difference between assets and liabilities) of £14.1 billion.
From a financial monitoring perspective, this system has the unfortunate consequence that expenditures and thus surpluses in years when deficit recovery plans are agreed are not a good reflection of the underlying financial situation of higher education providers. For the purposes of this report, we therefore concentrate on expenditures and surpluses ‘before’ the pension cost adjustment, i.e. with the pension cost adjustment removed. This means that the expenditures and surpluses we report do not take into account the estimated cost of pension obligations incurred insofar as that cost differs from actual pension contributions. Consistent with guidance from the British University Finance Directors Group (2023) and reporting practice by the Office for Students, we judge that excluding the ‘pension cost adjustment’ yields more useful measures of universities’ financial performance.
Recent favourable economic conditions for defined-benefit pension schemes provide a further reason for focusing on indicators before pension cost adjustment. Largely due to the increase in long-term interest rates, USS has moved to a surplus of £7.4 billion at its 2023 valuation – a swing of more than £40,000 per scheme member in three years. Given this surplus, no future deficit recovery contributions are now planned. Other defined-benefit schemes in the higher education sector will have seen similar improvements to their funding positions. As a result, the sector-wide pension cost adjustment is likely to be substantially negative in the 2023/24 accounts and generally smaller going forward – unless and until financial conditions change again.
References
Belfield, C. et al. (2018). The impact of undergraduate degrees on early-career earnings. Institute for Fiscal Studies Report, https://ifs.org.uk/publications/impact-undergraduate-degrees-early-career-earnings.
British Universities Finance Directors Group (2023). A BUFDG Guide to Accounting for Pensions in Higher Education. https://www.bufdg.ac.uk/Resources/News/View?g=18ca2b34-6bba-4285-93d5-2e616546c37a&t=Guide%20to%20Accounting%20for%20Pensions %20in%20HE.
Britton, J. et al. (2020). The impact of undergraduate degrees on lifetime earnings. Institute for Fiscal Studies Report, https://ifs.org.uk/publications/impact-undergraduate-degrees-lifetime-earnings.
Department for Education (2019). Post-18 review of education and funding: independent panel report. https://www.gov.uk/government/publications/post-18-review-of-education-and-funding-independent-panel-report.
Department for Education (2023). Student loan forecasts for England, financial year 2022–23. https://explore-education-statistics.service.gov.uk/find-statistics/student-loan-forecasts-for-england.
Drayton, E., Farquharson, C., Ogden, K., Sibieta, L., Tahir, I. and Waltmann, B. (2023). Annual report on education spending in England: 2023. Institute for Fiscal Studies, https://ifs.org.uk/publications/annual-report-education-spending-england-2023.
Emmerson, C. and Stockton, I. (2024). How do the parties’ policy proposals fit in with their fiscal rules? Institute for Fiscal Studies Comment, https://ifs.org.uk/articles/how-do-parties-policy-proposals-fit-their-fiscal-rules.
Farquharson, C., Ogden, K., Tahir, I. and Waltmann, B. (2024). High-skilled apprenticeships have high returns – but funding via a ‘crackdown’ on higher education courses is challenging. Institute for Fiscal Studies, https://ifs.org.uk/articles/high-skilled-apprenticeships-have-high-returns-funding-crackdown-higher-education-courses.
Higher Education Statistics Agency (2023). Higher Education Student Data, https://www.hesa.ac.uk/data-and-analysis/students.
Higher Education Statistics Agency (2024a). Higher Education Provider Data: Finance, https://www.hesa.ac.uk/data-and-analysis/finances.
Higher Education Statistics Agency (2024b). Higher Education Staff Data, https://www.hesa.ac.uk/data-and-analysis/staff.
Migration Advisory Committee (2024). Graduate route: rapid review. https://www.gov.uk/government/publications/graduate-route-rapid-review.
Office for Students (2023). Annual TRAC 2021–22: sector summary and analysis by TRAC peer group. https://www.officeforstudents.org.uk/publications/annual-trac-2021-22/.
Office for Students (2024). Financial sustainability of higher education providers in England: 2024. https://www.officeforstudents.org.uk/publications/financial-sustainability-of-higher-education-providers-in-england-2024/.
Willetts, D. (2010). Statement on higher education funding and student finance. https://www.gov.uk/government/speeches/statement-on-higher-education-funding-and-student-finance--2.
Zimmerman, S. D. (2014). The returns to college admission for academically marginal students. Journal of Labor Economics, 32, 711–54, https://doi.org/10.1086/676661.
Endnotes
Authors

Kate Ogden
Kate joined the IFS in 2020 and works on local government finance and higher education.

Ben Waltmann
Ben's main research areas are tax and social protection in developing countries, higher education, and dynamic discrete choice models.
More from IFS
Understand this issue


Policy analysis


Academic research


