
Downloads
Executive summary
The Labour party has proposed a package of policies to remove tax exemptions from private schools. Most importantly in revenue terms, it has proposed levying VAT on private school fees. The revenue raised would then be used to increase state school spending and would be targeted at pupils from disadvantaged backgrounds. In this report, we analyse the likely effects of these proposals on tax revenues and school spending.
Key findings
1. In 2022–23, average private school fees across the UK were £15,200 in today’s prices (net of bursaries and scholarships). This is £7,200 or nearly 90% higher than state school spending per pupil, which was £8,000 in 2022–23 (including day-to-day and capital spending). The gap between private school fees and state school spending per pupil has more than doubled since 2010, when the gap was about 40% or £3,500.
2. The share of pupils across the UK in private schools has remained around 6–7% for at least the last 20 years (or about 560,000–570,000 pupils in England). This has occurred despite a 20% real-terms increase in average private school fees since 2010 and a 55% rise since 2003. Unsurprisingly, private school attendance is largely concentrated at the very top of the income distribution. There is also evidence to suggest that it is often motivated by wider factors, such as culture and values.
3. We estimate that removing tax exemptions from private schools would raise about £1.6 billion a year in extra tax revenue. This results from an effective VAT rate of 15% after allowing for input deductions, likely VAT on boarding fees and exemptions for specialist provision. It also includes extra revenues from business rates.
4. If demand for private schooling reduces as a result of increases in post-tax fees, the additional tax revenue raised would likely be unaffected. This is because any reduced revenue from VAT on private school fees will likely be made up for by higher VAT revenues on other goods and services, holding overall consumer spending constant. If parents decided to stop paying for private school fees as a result of the extra VAT, this would release spending on fees that would likely be spent on other goods and services, thereby generating extra VAT revenues.
5. If private school attendance drops, state schools will require extra funding to accommodate them. The (limited) evidence on the determinants of the demand for private schooling suggests that the effects of fee rises are quite weak. In the short run, the effect might be extremely small as few parents might opt to take their children out of a school part-way through primary or secondary school. The effect might be larger over the medium to long run. Our best judgement is that it would be reasonable to assume that an effective VAT rate of 15% would lead to a 3–7% reduction in private school attendance. This would likely generate a need for about £100–300 million in extra school spending per year in the medium to long run.
6. Combining estimated tax revenues and extra public spending needs, our view is that it would be reasonable to assume a net gain to the public finances of £1.3–1.5 billion per year in the medium to long run as a result of removing tax exemptions from private schools. This would allow for about a 2% increase in state school spending in England, which Labour has proposed would be targeted at disadvantaged students.
7. There is still lots of uncertainty around these estimates. We have not accounted for potential reductions in labour supply and there is the potential for tax avoidance behaviour on the behalf of parents or schools. The effects are also likely to be heterogeneous given the range of different schools in the private sector. Finally, it is possible that the state sector could easily accommodate extra pupils given that overall pupil numbers across England are due to decline by at least 100,000 per year on average up to 2030 – i.e. a total drop of more than 700,000, which is bigger than the total number of children attending private schools.
1. Introduction
Whilst only about 6–7% of pupils across the UK go to private schools, there has long been significant public debate on the role and effects of private schools on the UK economy and society (Green and Kynaston, 2019). Evidence shows that pupils attending private schools benefit from significant advantages in later-life earnings (Green et al., 2011; Green, Henseke and Vignoles, 2017). However, the level of fees means that most pupils attending private schools come from families at the top of both the income and wealth distributions (Blundell, Dearden and Sibieta, 2010; Anders et al., 2020). This leads to concerns about inequalities between pupils and the effects on social mobility (Macmillan, Tyler and Vignoles, 2015). There are, however, many factors that determine choice of private schooling. Such decisions can reflect the quality of local state schools, parental values, experiences of private (or state) schooling themselves, or a desire for a different form of education (Dearden, Ryan and Sibieta, 2011; Anders et al., 2020).
The popular image is dominated by famous schools such as Eton and Winchester, where fees can be over £30,000, but there are many different types of school and a high level of variation in fees. Some private schools are religious schools, some are foreign language schools for children and some use different pedagogical practices. In some of these schools, fees can be under £10,000 per year. There is also a great deal of specialist provision, including provision for pupils with high levels of need and paid for by local authorities.
The Labour party has proposed to remove several tax exemptions from private schools (see Neame (2023)). There have also been suggestions of removing charitable status from private schools, but this would be a more complicated process. More importantly in revenue terms, Labour has proposed levying VAT at the main rate of 20% on private school fees. The resulting extra funding would then be used to increase state school spending and would be targeted at pupils from disadvantaged backgrounds.
In this report, we seek to provide a guide to the debate on this policy package. We start by providing a summary of the economic rationale for and against providing tax reliefs to private schools. We then update our comparisons between private school fees and state school spending per pupil (Sibieta, 2021a). We then move to examining the potential additional tax revenue raised by Labour’s package of proposals for removing tax exemptions from private schools and the potential implications for public spending if more pupils end up in the state sector as a result. We use this analysis to indicate a plausible range for the net public finance impact of Labour’s proposals. We then conclude with an overview of the potential short- and long-term effects of removing these tax exemptions. Throughout this report, we use the term private schools to refer to all independent or fee-paying schools.
2. Economic case for and against tax reliefs
Before analysing the figures in detail, it is useful to start by considering the economic theory and likely effects of removing tax exemptions from private schools. For simplicity of exposition, we focus on the effects of putting VAT on private school fees, but many of the arguments apply equally to other tax exemptions too. There are a number of ways to analyse the merits of tax exemptions for private schools. This partly reflects the complicated nature of education as an economic good. Education will include both consumption and investment components, but could also lead to both positive and negative spillover effects for wider society. We consider these different components in turn.
We could think of education as a standard consumption good, where individuals derive immediate benefits from being in education. This will relate to some elements of private schooling if parents place a high value on the school environment and extracurricular activities. If we do treat private education like any other good or service, then there would be good reasons to put VAT on private school fees. As we argue later, the demand for private schooling is likely to be inelastic – i.e. the number attending private schools is not that responsive to the price. The old Ramsey rule would suggest inelastic goods should be subject to higher-than-average tax rates to minimise deadweight costs and maximise revenues (Ramsey, 1927). More general theory argues that one should only place higher rates of taxes on goods that are a substitute to work (Atkinson and Stiglitz, 1976). In reality, the welfare benefits from applying differentiated consumption taxes are likely to be small and there are likely to be more benefits from a wide, simple base for consumption taxes (Crawford, Keen and Smith, 2010). This would argue for extending the VAT base to private schooling – i.e. subjecting it to a VAT rate of 20% rather than a lower, or higher, rate of tax.
It is perhaps more standard to think of education as an investment in human capital. Economic theory would argue for not taxing investments at the point they are made, but instead taxing the resultant increase in earnings later in life. This would argue for exempting investments in private education from VAT and instead taxing the return to these investments. This could be justified by the clear evidence showing that pupils from private schools manage to achieve higher earnings than pupils from the state sector (Green et al., 2011).
Private education, however, is a very different type of good from normal investments as there is also the potential for positive and negative spillovers on others from children attending private schools. Positive spillovers could occur if parents choosing private education save the government money needed to educate that pupil in the state sector. Linked to this there are also equity arguments for the state making a contribution to the cost of educating pupils across all sectors. This partly motivates the idea of a voucher system whereby parents could access state education for free or top the voucher up at private schools (Epple, Romano and Urquiola, 2017). Current tax exemptions could be seen as playing a similar role to such a voucher. More generally, it is normal to think of education as a good that generates wider positive spillovers.
There are also the possibilities of negative spillovers. Whilst individuals attending private schools tend to achieve better long-run outcomes, evidence suggests that these higher outcomes mostly reflect differences in information (such as knowledge of routes to high-earning careers), access to networks or differences in family circumstances (which cannot be controlled for in empirical analysis), rather than higher skills built by private schools (Macmillan, Tyler and Vignoles, 2015; Green, Henseke and Vignoles, 2017). In this situation, investments in private schools may come at the cost of worse outcomes for other pupils. This would create a social justice or social mobility argument for removing tax exemptions from private schools. Furthermore, one could imagine that there are positive spillover or peer effects from pupils from private schools being part of the state system, particularly if such pupils have high ability.
We are not able to offer a definitive answer as to what the optimal level of subsidy or tax is for private schools. There are arguments running in both directions. However, it is worth highlighting the factors that are likely to shape the optimal level, including the effect of price on private schooling choices, and the nature and level of any spillovers.
If we treat education as a consumption good, then there is a good case for extending the VAT base to private education. If there are high societal benefits from attending private schools as a result of higher levels of skills and human capital, then there would be a good case for exempting investments in private education from VAT. This is even more the case if private schooling choices generate significant savings for government and positive spillovers.
This argument then changes, however, if there are negative spillovers from attending private schools. This could occur if returns to private schooling result from access to particular networks or information, thereby reducing social mobility and increasing inequalities. If decisions to attend private schools are not very sensitive to price, then tax exemptions for private schools probably would not generate significant savings for government either.
3. Comparing spending and fees
Figure 1 shows the total level of state school spending per pupil across all state-funded schools in England between 2003–04 and 2022–23. These figures are higher than the ones in Sibieta (2023) as they include both current and capital spending, given that private schools will need to fund their capital expenditure. For comparison, we also show the average day fee at private day schools over time (i.e. excluding the cost of boarding). We show this before and after deducting estimated levels of bursaries and scholarships, given that over one-quarter of pupils receive some kind of discount or bursary. Figure 2 then shows the percentage difference between spending per pupil in the state sector and private school fees (minus bursaries and scholarships). In particular, this shows the difference as a percentage of spending per pupil in the state sector.
Figure 1. Comparing state school spending per pupil and average private school fees over time (2023–24 prices)

Note and source: State-funded school spending includes both current and capital spending, with figures for current spending and pupil numbers taken from Sibieta (2021b) and capital spending taken from Britton et al. (2020) and HM Treasury (2022). Capital spending on the further education (FE) capital transformation programme has been deducted from Department for Education total capital spending (based on DfE supplementary estimates (Department for Education, undated)). Private school fees represent the average termly day fee at day schools multiplied by three as reported in the Independent Schools Council (ISC) annual censuses 2004–23 (https://www.isc.co.uk/research/annual-census/), with figures prior to 2007 backcast using an older methodology for calculating average fees across different age groups. Level of bursaries calculated using total spending by schools on bursaries and scholarships divided by the total number of pupils at ISC schools. HM Treasury GDP deflators, March 2023 (https://www.gov.uk/government/statistics/gdp-deflators-at-market-prices-and-money-gdp-march-2023-quarterly-national-accounts).
Figure 2. Percentage difference between state school spending per pupil and private school fees (minus bursaries and scholarships)
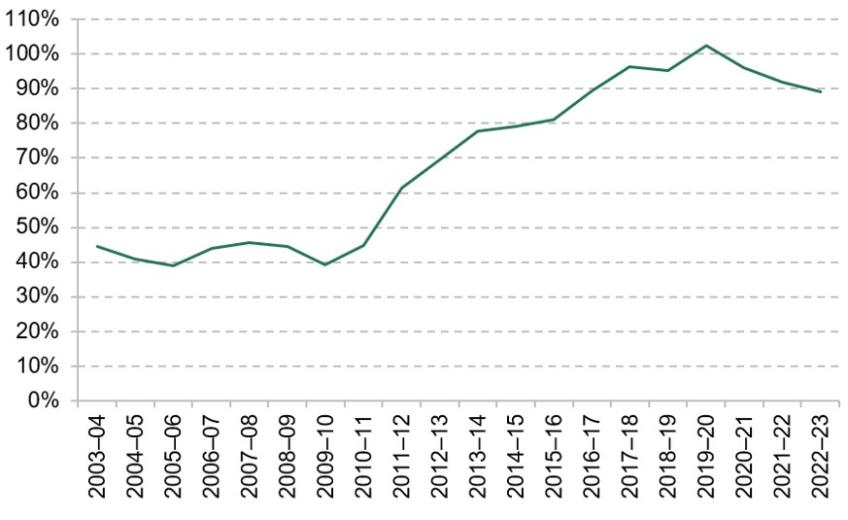
Note and source: See Figure 1.
This is not a perfect comparison between resources in the private and state sectors, but there are good reasons to believe that these figures probably understate the gap in resources. First, we do not account for investment income, endowments or gifts/donations, which are likely to push up private school spending by more. Second, private school fees are for the UK as a whole, with state school spending shown for England only due to the availability of data over time. Figures for private school fees in England only would be higher given that figures for Scotland and Wales are below the UK average.
The trends over the last 15 years have been very dramatic. Back in the late 2000s, total spending per pupil in the state sector was approaching £9,000 (in today’s prices and thus adjusted for 14 years of inflation) compared with net fees of over £12,000 in private schools. The gap in spending was thus about £3,500 or 40%.
Since then, total state school spending per pupil dropped to about £7,500 in 2019–20, just before the pandemic. This represents a drop of 15% in real terms and is partly driven by a large drop in capital spending, which was somewhat inflated in 2009 and 2010 due to delays in a large school-building programme. However, the underlying figures for current or day-to-day spending still show a drop of 9% over the decade between 2009–10 and 2019–20.
In sharp contrast, net private school fees rose from £12,300 in 2009–10 to £15,200 in 2019–20, a real-terms increase of 24% over the decade. As a result, the gap in spending between the two sectors more than doubled from under £3,500 to nearly £7,700, or from around 40% to over 100% in relative terms, i.e. net private school fees were more than double state school spending levels in 2019–20.
Since then, this gap has come down a little bit to £7,200 or about 90% in 2022–23. This partly results from increased state school spending per pupil, which has grown by about 7% in real terms on this measure since 2019–20. Meanwhile, private school fees are about the same in real terms in 2022–23 as they were in 2019–20. Fees dropped in real terms during the pandemic, perhaps reflecting discounts for the lack of face-to-face teaching. They have since begun to grow again and are now back to the same level as in 2019–20. The gap in spending between the two sectors also remains more than double its level in the late 2000s.
A natural question to ask is what higher spending levels in private schools deliver in terms of extra resources. One of the key differences is lower class sizes. There are 9 pupils for every teacher in the private sector, which compares with about 18 for every teacher in state-funded schools. Interestingly, however, higher increases in private school fees over the last 10–15 years do not seem to have been spent on lower class sizes, with the pupil:teacher ratio at around the same level in 2010. It is therefore likely that higher private school fees have been spent on other resources – for example, other staff, facilities, staff pay levels and extra costs, such as higher employer pension contributions.
Whilst there is clearly a large difference between average state school spending per pupil and private school fees, it is important to emphasise that there is significant variation in spending and fee levels within both sectors.
Within the state sector, total day-to-day funding per pupil across regions varies from about £7,600 per pupil per year in London down to about £6,200 per pupil in the East of England, a range of about 22%. According to the Independent Schools Council, average day school fees vary from about £12,000 per year in the North West of England to about £20,000 in London, a bigger regional range of 66%.
There is then a great deal of variation across individual schools. About 5% of state schools have levels of funding per pupil below £4,700 (mostly less deprived primary schools), whilst about 5% have funding levels above £8,000 per pupil (mostly deprived schools in London or small rural schools). Private school fees also vary substantially at the individual school level, and probably by more than in the state sector. At some of the most famous private schools, such as Eton and Winchester, fees can be over £30,000 per year. At the other end of the spectrum, some smaller private schools can charge even less than average state school spending per pupil. These are normally religious or foreign language schools.
Looking across phases, the difference in fee levels between secondary and primary day schools (15% in 2022–23) actually closely matches the ratio between state-funded secondary and primary school funding levels (about 14% in 2022–23 (Drayton et al., 2022)). Where there is more of a difference is sixth forms, with average sixth-form fees in 2022–23 being over £16,000 (after deducting an assumed level of bursaries and discounts). This is nearly three times larger than school sixth-form funding per pupil aged 16–18 in the same year in the state-funded sector (£5,600 per student in 2022–23 (Drayton et al., 2022)). Funding per student aged 16–18 in further education colleges is higher at £6,800 per student. However, it is very notable that funding per student aged 16–18 in colleges is actually slightly lower than secondary school spending per student (across ages 11–18) in the state sector. This implies that funding is lower for ages 16–18 in the state sector than for ages 11–16. In contrast, private day school fees are about 3% higher for sixth forms (16–18) than for senior schools (11–16).
Stable overall pupil numbers in private schools
Despite these large increases in private school fees over the last decade, Figure 3 shows that there has only been a small drop in the share of pupils attending private schools in England, from 7.1% in 2010 to 6.4% in 2022. This fall was mainly driven by a rising pupil population in the state-funded sector, with the number of pupils in private schools remaining around 560,000–570,000 in England over most of the 23 years.
Figure 3. Number and share of pupils attending private schools in England over time
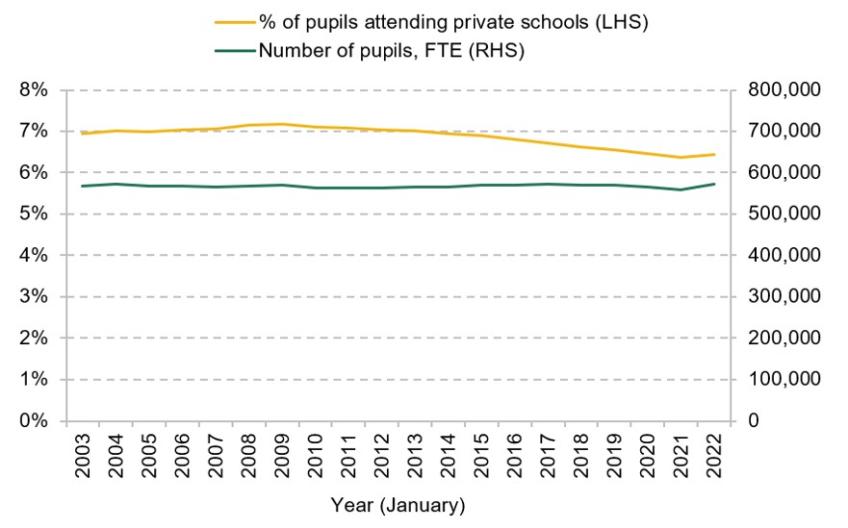
Note and source: FTE is full-time-equivalent. Department for Education, ‘Pupils, schools and their characteristics’.
It is noteworthy that the demand for private schooling in the UK has hardly changed over the last 10 or 20 years, despite a 20% real-terms rise in fees since 2010–11 and a 55% real-terms rise since 2003–04. This could indicate a potentially weak relationship between fees and the demand for private schooling. However, there are many factors likely to be driving demand for private schooling and the level of private school fees. For example, a drop in state school quality could increase the perceived advantage of private schooling and parental demand. A large rise in top incomes or wealth levels could also push up demand for private schooling. If the supply of places is very limited, then prices or fees would naturally rise.
Curiously, however, the evidence does not point to such factors increasing demand for private schooling. Top incomes have not seen especially high growth compared with the rest of the income distribution. Indeed, income inequality has declined (Cribb et al., 2022). Measured state school quality has been rising over the last decade, particularly in London where private school attendance also tends to be highest (Blanden et al., 2015; Department for Education, 2020; Hunt et al., 2022). Of course, it is possible that state school quality could have risen by more without cuts to school spending per pupil and that parents have responded to reduced resources in the state sector. However, the more likely story seems to be that the relationship between private school demand and fee levels is quite weak.
Finally, it is important to remember that the demand for private schooling in the UK has a distinctly global element. The number of non-British pupils whose parents live overseas attending private schools across the UK rose over time from about 23,000 in 2010 to 29,000 in 2020, but has now come down to about 25,000 in 2023. Non-British pupils with parents living overseas account for about 5% of pupils at private schools in 2023. A further 7% of private school pupils are non-British with parents living in the UK.
4. Estimating extra tax revenues
The Labour party has proposed to eliminate several tax reliefs enjoyed by private schools. In particular, it has proposed adding VAT, at the main rate of 20%, to private school fees. Labour would also remove relief on business rates in England and Wales, whereby private schools currently benefit from an 80% discount on business rates. This relief has already been abolished in Scotland.
In this section, we estimate the extra tax revenues likely to be raised by this package of policies. We focus on the extra revenue from adding VAT to private school fees as this is the most substantial element of the package. There are a number of uncertainties surrounding the revenue effects, including the potential to deduct input costs when calculating VAT, the effects on VAT revenues from other goods and services, behavioural effects and the potential for avoidance.
When producing these estimates, we make extensive use of figures and surveys produced by the Independent Schools Council, which are detailed below. All figures are calculated as if the policy was in place for the 2022–23 school year and are shown in cash terms.
For this analysis, we assume no changes in the level of private schooling, no changes in labour supply decisions and no changes in saving decisions. This effectively means we are holding total consumer expenditure constant, but allowing consumers to reduce other expenditures to afford the increase in VAT on private school fees. However, we argue that changes in the demand for or supply of private schooling in response to higher post-tax fees are unlikely to have any meaningful effect on tax revenues. Whilst a reduction in the demand for or supply of private schooling would reduce VAT revenue from private schooling, it is likely to increase VAT revenues on other goods and services. If parents stop spending £15,000 on private school fees because of the increase in VAT, they are likely to spend the money on other goods and services at some point in time, generating extra VAT revenues. The main way in which reduced levels of private schooling would affect the public finances is through a potential need for extra spending to educate more pupils in the state-funded system. We turn to this issue in Section 5.
A large number of private schools have charitable status, which means they are exempt from corporation and other taxes. There have been suggestions of removing their charitable status, but undertaking this change in legal status would be a much more complicated process and the associated extra corporation tax revenues would be likely to be small. We therefore do not consider this option as part of our analysis.
Calculating total tax revenues
We estimate that total fee income for all private schools across the UK was about £10.2 billion in 2022–23. Table 1 details the basis for this calculation. According to the Independent Schools Council (ISC) census for January 2023, there are about 310,000 pupils at ISC-registered day schools and about 210,000 pupils at ISC-registered schools with boarders. We have excluded nursery pupils at independent schools as many are likely to be covered by the free entitlement to early education and childcare. We include foreign pupils as we assume that they would still be subject to VAT as the service is consumed within the UK.
Table 1. Calculating total fee income in 2022–23
| Type of school | Pupils | Average annual fee (£) | Total fee income (£m) |
|---|---|---|---|
| ISC day schools | 311,316 | 14,843 | 4,621 |
| ISC boarding schools (day fee) | 214,094 | 20,078 | 4,299 |
| Non-ISC schools | 89,039 | 14,843a | 1,322 |
| Total | 614,449 | 16,667 | 10,241 |
a. Fees for non-ISC schools are assumed to match ISC day schools.
Source: Author’s calculations using Independent Schools Council Annual Census 2023 (https://www.isc.co.uk/research/annual-census/). Day fee for boarding schools excludes the cost of boarding. We exclude about 30,000 nursery pupils from pupil numbers for ISC day schools.
We then multiply through by the average fee level for day schools (around £15,000) and the day fee at boarding schools (around £20,000). This includes the same deduction for bursaries and discounts as used in Figure 1 and assumes discounted fees would be subject to VAT. The day fee for boarding schools excludes the cost of boarding, an issue we return to later in this subsection.
This only accounts for about 86% of pupils in private schools across the UK. A further 90,000 pupils attend non-ISC schools. These schools are mostly inspected by Ofsted rather than the Independent Schools Inspectorate and cover a range of different types of schools, including some for-profit schools, special schools, foreign language schools and religious schools. There are less data available for these schools. We therefore assume fee levels equal to the average fee at ISC day schools.
We cross-referenced our calculations against research commissioned by ISC on the economic footprint of independent schools (Oxford Economics, 2022). This shows that income from main school operations across all independent schools was almost £10 billion in 2021–22. Uprating this by the 7% increase in average fees in 2022–23 would give an estimated income of £10.6 billion in 2022–23, only slightly above our estimate of £10.2 billion. Furthermore, the income of non-ISC schools was about £1.4 billion in 2021-22, which would imply average net fees of just over £15,000, very close to our assumption. These checks give us confidence in our estimates for total fee income.
The VAT paid by firms is calculated as the difference between the VAT charged to customers (which would become 20%) and any VAT paid on inputs. This ensures VAT is charged on the ‘value added’ by firms and ensures that VAT is not levied multiple times through the supply chain. We must therefore also estimate the likely amount of VAT on inputs private schools would be able to deduct.
According to Oxford Economics (2022), most private school expenditure relates to staff costs (accounting for about 71% of fee income), about 26% relates to non-staff costs and a further 3% is recorded as net surplus. Figure 4 shows the implied levels of spending on different inputs given our estimates of total fee income across all private schools in 2022–23. This further divides non-staff costs into estimated expenditure on goods and services subject to VAT, and input purchases not subject to VAT. Again according to Oxford Economics (2022), ISC schools paid about £270 million in taxes on purchases of goods and services worth £1.82 billion (excluding VAT) in 2021. This implies an effective tax rate of about 15% on purchases and that about 74% of non-labour input purchases are subject to full VAT of 20%. This is not precisely accurate as some goods and services will attract lower rates of VAT – for example, energy costs – and some input taxes, such as insurance premium tax, are not deductible. However, this presentation simplifies the exposition and is unlikely to have a material impact on the results.
Figure 4. Estimated uses of private school fee income, 2022–23
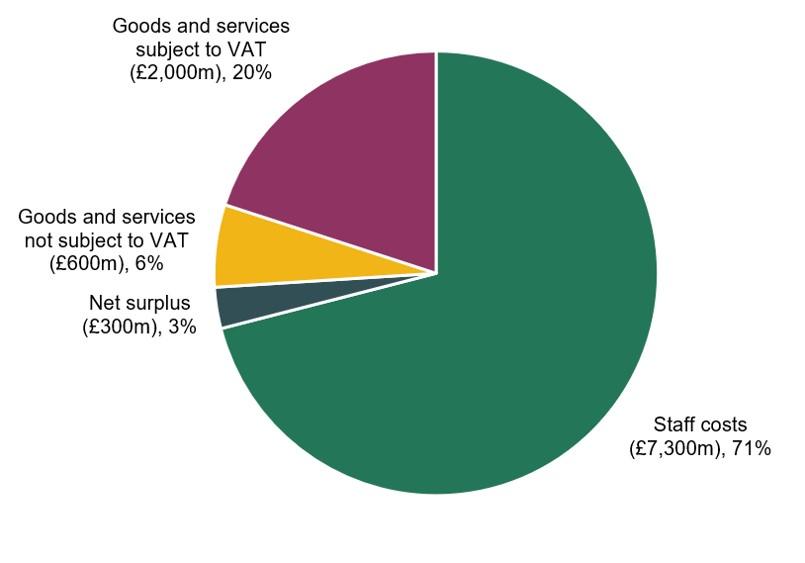
Source: Author’s calculations using figures for total fee incomes shown in Table 1 and Oxford Economics (2022).
In line with these, we assume that about 20% of private school costs are subject to full VAT and that about £340 million could be deducted when paying VAT. This is larger than the £270 million paid in taxes on goods and services in 2021 quoted above, for two reasons. First, we are estimating taxes paid on inputs for all private schools (not just ISC schools). Second, purchases were slightly depressed in 2021 due to temporary effects of the pandemic. Our estimate of £340 million is more in line with what would be expected in a normal year.
As shown in Table 2, this would imply net VAT revenue of just over £1.7 billion before making any assumptions about changes in demand or other taxes
Table 2. Calculating likely tax revenues from removing tax reliefs for private schools
| Total revenue (£m) | |
|---|---|
| Gross VAT charged (20% of total fee income) | 2,000 |
| Less VAT paid on inputs | –340 |
| Net VAT yield on private school day fees | 1,700 |
| Plus VAT on boarding fees | +170 |
| Less VAT exemption for specialist provision | –220 |
| Net VAT yield after exemptions and related services | 1,700 |
| Less reduced VAT on other goods and services | –220 |
| Plus extra business rates revenue | +140 |
| Total extra tax revenues | 1,600 |
Source: Author’s calculations using Independent Schools Council Annual Census 2023 (https://www.isc.co.uk/research/annual-census/). Day fee for boarding schools excludes the cost of boarding. Fees for non-ISC schools are assumed to match ISC day schools. We exclude about 30,000 nursery pupils from pupil numbers for ISC day schools.
So far, we have assumed that VAT is only applied to day school fees. Fees for boarding accommodation are also currently exempt from VAT. However, as they could be defined as a ‘closely-related’ service to education, boarding fees may well become subject to VAT too. We estimate the boarding element of fees to be about £17,500 per pupil per year in 2022–23 based on ISC figures for boarding fees and day fees for boarding schools. Multiplying this through by the 66,000 boarders and assuming a net VAT rate of about 15% gives an extra estimated VAT revenue of about £170 million, or £1.9 billion in total.
The Labour party has also stated that fees paid by local authorities for specialist provision would be exempt from VAT (specifically fees for pupils with education, health and care plans), which cover provision paid for by local authorities but delivered in the independent sector. This often relates to some of the highest levels of need and most costly places for pupils with extremely high levels of special educational needs, which often cannot be catered for in the state system. At the latest count, local authorities (LAs) spent about £1.47 billion on such provision in independent primary, secondary and special schools,1 with the vast majority in special schools. Exempting this provision reduces the overall yield by about £220 million to about £1.7 billion. However, it is important to note that exempting LA-paid fees could cause additional complexities as schools would not be able to claim back input costs relating to exempt provision, which might be hard to calculate in practice. The simpler solution would be to zero-rate LA-paid fees, but this would be more expensive as LAs would receive relief at the full VAT rate of 20% and private schools would be able to claim back all input costs for VAT purposes.
In order to afford £1.7 billion in VAT on private school fees, individuals are likely to need to reduce expenditure on other goods and services, reducing the VAT yield on these goods and services. We assume an effective VAT rate of 15% on other expenditure, which then further reduces the expected net VAT yield by about £220 million. This assumes no change in individuals’ overall expenditure, working behaviour or saving choices.
Finally, we make use of previous research estimating that business rates relief is worth about £140 million (Private Education Policy Forum, 2022).
Combining everything together, we estimate total extra tax revenues of about £1.6 billion before any behavioural changes.
Behavioural changes
Imposing VAT on private school fees will lead to some behavioural change amongst both parents and schools. There is likely to be lower demand for private schooling due to higher post-tax prices. Private schools could also absorb some of the increase in post-tax fees by reducing pre-tax fees and expenditure and/or choose to reduce the number of places they offer.
A number of studies argue that reduced levels of private schooling would reduce tax revenues (Baines Cutler Solutions, 2018; EDSK, 2023). In a narrow sense, reduced spending on private schooling would reduce VAT revenues expected from private schooling. However, these studies ignore how VAT revenues on other goods and services would be affected in the long run. If parents chose to reduce demand for private schooling, then demand for other goods and services would rise, thereby increasing VAT revenues from those other goods and services. Indeed, if we assume constant consumer expenditure and an effective VAT rate of 15% on other goods and services, then while reduced demand for private schooling would reduce VAT from private schools, it would have zero effect on overall VAT revenues.
This is naturally subject to a number of caveats. First, the effective VAT rate on other purchases may be slightly higher or lower than 15%. However, any deviations from this are likely to be small. Second, the timing of expenditure may well affect the profile of tax revenues over time. If parents chose to save any money saved on private school fees, then immediate tax revenues may drop, but future tax revenues will increase when such money is eventually spent on goods and services. HM Treasury and the Office for Budget Responsibility would consider this time profile when costing any such policy. However, we focus on the long-run or steady-state revenues.
There is also potential for other behavioural changes. For example, adding VAT to private school fees will increase the overall tax on consumption and reduce work incentives, thereby potentially reducing labour supply. Considering affected families, Anders et al. (2020) show that school fees account for about 15–20% of household income for those choosing private education. Adding an effective VAT rate of 15% on private school fees may therefore amount to 2–3% in extra costs for such families. This would likely reduce work incentives.
Finally, as with many other aspects of the VAT system, there is the potential for tax avoidance. This is naturally hard to predict. One could envisage schools seeking more gifts or donations to reduce the impact of the tax changes or charging more for other non-VATable goods and services. Such opportunities may be reduced through VAT on related services. There are almost certainly more opportunities for avoidance.
Issues around tax avoidance are also highly connected with how private schooling is defined for the purposes of VAT. A wide definition would restrict the opportunities for tax avoidance, but could also end up (unintentionally) applying VAT to other forms of education and training. For example, we have assumed that VAT would not be applied to early education and childcare, or to adult education. An age-based definition (e.g. for pupils aged 5–18) would help maintain such exemptions. But there are many potentially problematic boundary cases, including: private tutoring services; breakfast and after-school clubs taking place in schools; and apprenticeships delivered by independent training providers. Such definitional issues would need to be carefully considered as part of any legislation.
5. Effects on state school spending
Whilst changes in the level of private schooling are unlikely to affect tax revenues, reduced levels of private schooling could clearly impact the public finances through an increased need for state-funded education. The overall level of extra funding required is highly uncertain and depends on two key factors: the drop in attendance at private schools; and, the marginal cost of educating an extra pupil in the state-sector. We consider each of these issues in turn before then showing the range of potential effects on the public finances.
Fall in private school pupil numbers
The effect on the level of private schooling from imposing VAT on fees is clearly uncertain. The effects could come on the demand side, with reduced demand from parents in response to higher fees. They could also come through the supply side with a reduced supply of places at private schools. We focus on the change in the level of private schooling, which could occur through either channel. In particular, we focus on the elasticity of private schooling with respect to the effective VAT rate. This is the expected percentage change in private schooling in response to a given percentage change in the effective VAT rate (15% in this case). For example, an elasticity of 1 corresponds to a case where an effective VAT rate of 15% reduces private schooling by 15%. An elasticity of 0.5 would equate to a 7.5% reduction in private schooling.
The responsiveness of demand is also likely to vary over time. In the very short term (one or two years), the effect is likely to be very small as parents seem less likely to change schools for their children midway through primary or secondary school. Over the medium and long terms, the effect is likely to be larger as fewer parents choose private schools for their children in the first place and private schools potentially change their expenditure patterns.
There are a number of pieces of evidence to guide judgements on the potential responsiveness of the level of private schooling, all of which are imperfect. A number of surveys produced for the Independent Schools Council have suggested potentially high impacts, with a survey produced by Baines Cutler Solutions (2018) estimating a reduction of 90,000. This included surveying parents at private schools and modelling household expenditure decisions. However, how people respond to a survey is rarely a good guide to how they behave in practice. Modelling how households would respond to fees without any direct evidence on behavioural effects is also likely to be subject to significant error. Other evidence suggests that parents who choose to send their children to private schools tend to be concentrated at the very top of the income and wealth distributions (Anders et al., 2020), and such individuals tend to have relatively complex income and wealth streams.
The best evidence will come from actual changes in behaviour in response to fee levels, although it is also quite thin. An IFS working paper from 2010 used dynamic methods to estimate a relatively low impact of fees on the level of private schooling, with an estimated elasticity of 0.26 (Blundell, Dearden and Sibieta, 2010). It effectively examined the impact of unexpected changes in fees on private school levels. It also focused on key entry points at ages 7 and 11, rather than how all pupils would respond. As such, the estimated elasticity is closer to a medium- or long-run impact.
Whilst that paper is the only one to seek to apply causal methods in the UK, it is relatively old and never progressed beyond working paper stage. It does, however, match with US work showing an elasticity of 0.19 for the effect of fees on Catholic private school attendance in the US (Dynarski, Gruber and Li, 2009). It also fits with the overall changes in fees and demand over time. As indicated in Section 3, the share of pupils in private schools across the UK has hardly changed at all over time, despite a 20% real-terms increase in fees since 2010 and a 55% rise since 2003.
Given the state of the evidence, it would be unwise to produce a single point estimate for the likely change in the level of private schooling. However, the evidence we do have on actual behaviour points to relatively low responsiveness. As such, assuming an elasticity between 0.2 and 0.52 would seem reasonable in our opinion, but we cannot fully rule out slightly lower or higher responses, given the sparse amount of causal evidence.
Figure 5 shows the potential change in private school levels in response to a 15% effective VAT rate (the net VAT calculated in Section 4) for different levels of the elasticity. This excludes the 25,000 pupils in independent schools whose fees are likely to be covered by local authorities and exempt from the VAT charges.
Figure 5. Potential falls in private school pupil numbers under different levels of responsiveness to price changes
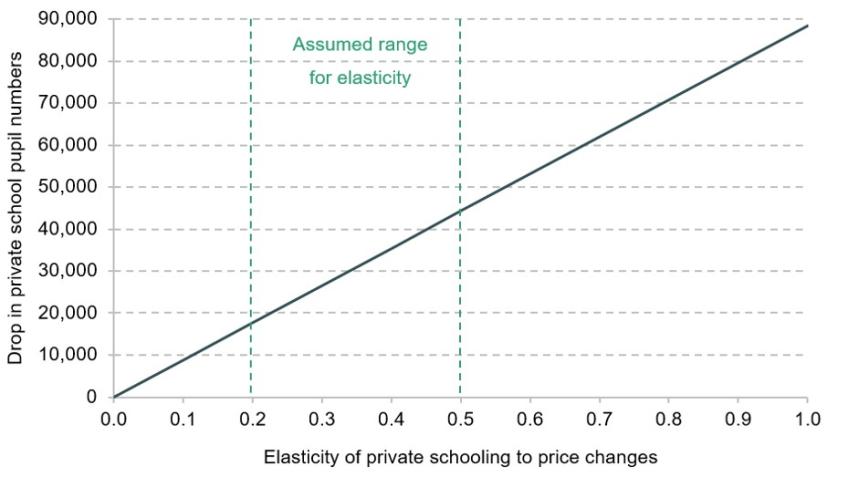
Source: Author’s calculations.
As can be seen, our assumed elasticity range of 0.2–0.5 would generate falls of about 20,000–40,000. If the true elasticity is larger, then the fall in attendance would clearly be larger. Any falls would be spread over time, rather than happening immediately.
We extend this graph up to an elasticity of 1, which would imply that every 1% increase in fees reduces private school attendance by 1%, to show the impact of this assumption. Under this high elasticity, attendance would fall by 90,000, which is similar to the estimate produced by Baines Cutler Solutions (2018) in work for the ISC. However, as argued above, we do not consider this to be a likely scenario.
Marginal cost of educating an extra pupil
If pupils move from the private to the state sector, state schools will require extra resources. As we saw in Section 3, average state school spending per pupil in England in 2022–23 was about £8,000. However, there are good reasons to believe that the required extra spending per pupil will be less than this.
A large element of school funding is targeted at social deprivation and low prior attainment. The schools block element of the National Funding Formula includes a high level of funding for social deprivation, covering about 9% of the schools block, and funding for low levels of prior attainment, which accounts for about 6% of the schools block. There is also the Pupil Premium, which amounted to nearly £2.7 billion in 2022–23 and is funding aimed at improving educational outcomes for disadvantaged pupils. The mix of pupils in private schools is highly skewed towards the top of the income and wealth distributions (Anders et al., 2020). Some pupils moving from private to state sector will be eligible for these extra funds, but to a much lesser extent than the average picture across the state sector at present.
A large element of state school spending is directed at pupils with high levels of special educational needs (about £9 billion of the £54 billion in day-to-day funding allocated through the Dedicated Schools Grant in 2022–23). The vast majority of the high-needs block is directed towards pupils with the highest needs, those with a statement of special educational needs or an education, health and care plan (EHCP). There are many pupils in independent schools with such needs. Indeed, Department for Education statistics show that about 4% of pupils at all independent schools in England had an EHCP or statement of special educational needs, which is very similar to the picture across all schools in England. However, the most expensive pupils with high needs in private schools are likely to already have their fees covered by local authorities, which would be exempt from VAT under Labour’s plans. As such, the extra demands placed upon the high-needs budget by pupils moving from the private to state sectors would likely be small. This is clearly a source of uncertainty though.
In our central scenario, we assume that all pupils entering the state sector require an extra £5,300 in day-to-day funding (the average unit of funding in the mainstream schools funding formula). This includes a large amount of funding for deprivation and for low prior attainment, as well as funding for fixed costs. However, it excludes the Pupil Premium and the high-needs budget.
Making an assumption about capital spending is more difficult as capital spending on schools has been very lumpy and variable over time. We take the average per-pupil spend across the last 20 years, which represents about £600 in 2022–23 prices.
Combining these figures gives an estimated marginal cost of £5,900 per pupil. However, given the uncertainty, we show the impact of varying this by £1,000. Our low marginal cost scenario is £4,900 per pupil and our high marginal cost scenario is £6,900 per pupil.
A further important source of context for these figures is the large expected drop in pupil numbers over this decade, with a 700,000 fall in pupil numbers expected between 2023 and 2030 (Drayton et al., 2022). This total fall of 700,000 is larger than the total number of pupils at private schools across the UK. Furthermore, the annual fall in pupil numbers is expected to be more than 100,000 per year from 2025 onwards, which is more than double the total expected fall in private school numbers under our assumed range for the elasticity.
Falling pupil numbers might not release funding in the short run, however, as costs might not fall in proportion to pupil numbers and policymakers might find it difficult to cut total spending. Rather, to a great extent, these falls might leave the state sector with significant spare capacity. For example, when a primary school class drops from 30 to 25 children, the number of staff needed in the short run is unlikely to change. As a result, any additional pupils – who would otherwise have gone to the private sector – might be able to be accommodated at relatively little cost. However, this picture is further complicated by the fact that forecast drops in state school population will not be even across the country. And they will not necessarily be occurring in precisely the areas where parents decide not to send their children to private schools.
Public finance impact
In this final subsection, we illustrate the potential net public finance impact of Labour’s proposals to remove tax exemptions from private schools. This is estimated as the expected additional tax revenue of about £1.6 billion a year minus the potential increase in public spending needs from any movement from the private to state sector. The spending increases are simply calculated as the changes in pupil numbers shown in Figure 5 multiplied by the marginal cost figures we calculated in the previous subsection. We do not include the expected increase in state school spending Labour would use this revenue to fund. This is because we are intending to show how much is possible and reasonable to assume. Figure 6 shows how the net public finance impact changes as the responsiveness of private school attendance to changes in the effective VAT rate increases. In particular, we show how the net public finance impact varies for different levels of the elasticity of private schooling to price changes. The elasticity corresponds to the expected percentage change in the level of private schooling in response to a 1% increase in price. For example, an elasticity of 0.1 means that a 10% increase in fees would lead to a 1% reduction in the level of private schooling, which is a very inelastic response. An elasticity of 1 implies that a 10% increase in price would lead to a 10% fall in demand.
Figure 6. Total net public finance impact from reducing tax reliefs for private schools under different levels of responsiveness to price changes
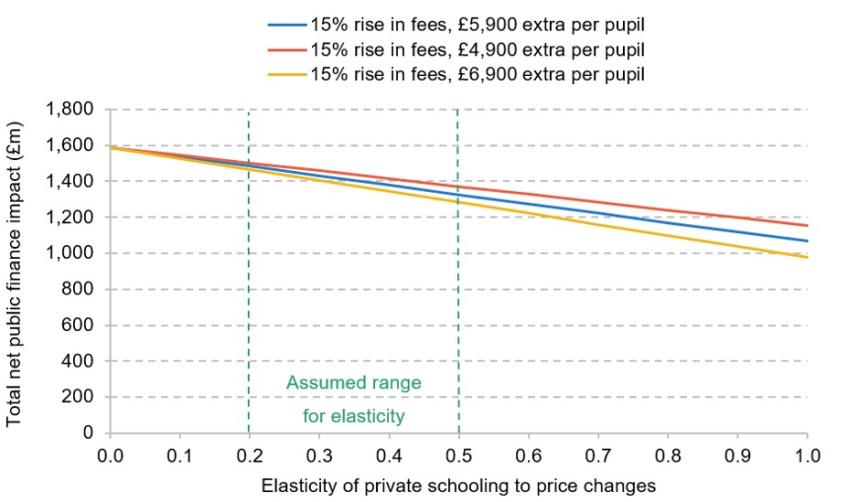
Note and source: See Figure 5 and Tables 1 and 2. Author’s calculations.
We show three scenarios for the marginal cost of educating pupils moving from the private to state sector: our central scenario (£5,900), low-cost scenario (£4,900) and high-cost scenario (£6,900). As can be seen, the net public impact reduces with higher levels of responsiveness to fee changes and for higher marginal costs.
In the short run (one or two years), the impact on the level of private schooling is likely to be small, with £1.5–1.6 billion representing the most likely net public finance impact in the short run. In the medium to long run, the impact on the level of private schooling is likely to be larger. As we have argued, assuming an elasticity of 0.2–0.5 would seem reasonable based on the evidence on the factors that shape the demand for private schooling. This would generate a need for about £100–300 million in extra school spending in our central scenario for the marginal cost of the extra pupil. This then gives a net public finance impact of £1.3–1.5 billion.
This range is smaller in our low-cost scenario (£1.4–1.5 billion), but very similar in our high-cost scenario (£1.3–1.5 billion).
Notably, even under the high-cost scenario and assuming an elasticity of 1 (the implied elastic response assumed by Baines Cutler Solutions in their work for the ISC), we would still estimate a net public finance impact of £1 billion.
Based on these scenarios, our best judgement is that it would be reasonable and cautious to assume a net gain to the public finances of £1.3–1.5 billion over the medium and long terms (with a bigger net impact in the near term). However, there are still a number of sources of uncertainty, including potential effects on labour supply, the potential for tax avoidance and uncertainties around pupils with high needs. We also cannot totally rule out larger responses.
These estimates represent aggregate estimates across the private sector. As emphasised in Section 3, there is a high level of heterogeneity across the private sector. The effect of removing tax exemptions is likely to be different across different types of schools with different fee levels. However, predicting this with any level of certainty is near enough impossible.
6. Conclusions
In this report, we have analysed Labour’s proposal to remove tax exemptions from private schools. We started by considering the economic arguments for and against providing tax exemptions to private schools. This highlighted that the merits and likely effects of removing tax exemptions hinge on two considerations: the responsiveness of private school attendance to changes in fees, and the extent to which there are positive or negative spillovers on others from pupils attending private schools.
We estimate that removing tax exemptions from private schools will likely raise about £1.6 billion a year in overall extra tax revenues. This accounts for the deductibility of inputs, VAT on boarding fees, revenue raised from corporation tax and business rates, and exemptions for specialist provision. Tax revenues are unlikely to change if pupils switch to the state sector as a result of any rise in post-tax fees. This is because any money saved on private school fees would likely be spent on other goods and services, with any reduction in VAT revenues from private school fees effectively cancelled out by increased revenues from VAT on other goods and services. The big uncertainty on tax revenues is the potential for avoidance, with a need for any legislation to carefully consider the definition of private schooling to avoid unintended consequences.
If pupils move from the private to the state sector, state schools will require extra funding. Most of the evidence suggests that the level of private schooling is quite inelastic and often shaped by other factors, such as values, culture and desires for a different type of education. Based on this evidence, our view is that it would be reasonable to assume a range of somewhere between a 3% and 7% fall in private school attendance (or about 20,000–40,000 pupils) as a result of a 15% effective VAT rate.3
The marginal cost of educating these pupils in the state sector is likely to be less than the current average cost, as pupils moving from the private to the state sector are likely to be less deprived and less in need of specialist provision (especially if there is an exemption for fees paid by local authorities). Our assumed central scenario for the marginal cost of educating an extra pupil implies a need for an extra £100–300 million per year. Our best judgement is therefore that removing tax exemptions would probably have a net gain to the public finances of about £1.3–£1.5 billion per year, after accounting for likely tax revenues and spending needs. This would allow for about a 2% increase in day-to-day spending on state schools in England. Labour has proposed that this would be targeted at disadvantaged pupils.
In the very long run, it might be argued that changes in the demand for private schooling could also affect children’s long-term earnings potential. There is significant evidence showing that attending private schools is associated with higher earnings, even after accounting for educational qualifications achieved (Green et al., 2011; Green, Henseke and Vignoles, 2017). Evidence from new linked administrative further suggests higher returns to higher education for those who attended private schooling (Britton, Dearden and Waltmann, 2021). If these effects were driven by higher skills (in its broadest sense) generated by private schooling, then effectively encouraging more pupils to move from the private to the state sector could generate significant negative economic returns over the long run. However, most of the current evidence suggests that higher returns to private schooling are likely to be driven by network and sorting effects (Macmillan, Tyler and Vignoles, 2015; Green, Henseke and Vignoles, 2017). In this case, reducing private school attendance could lead to lower lifetime inequalities between pupils attending different types of school. This is strongly connected to the extent to which private schooling generates positive or negative spillovers.
As it is, we expect that the change in private school attendance levels will be small. This leads to surer increases in tax revenues and less need for increases in public spending. But it also means that the long-run effects on returns to education or inequalities will probably also be small. If the main aim of removing tax exemptions from private schools is to raise revenue, then this is likely to be achievable. If the aim is to encourage more pupils into the state sector and reduce inequalities by school attended, then this policy package is likely to have only minor impacts.
Endnotes
Authors

Luke Sibieta
Luke is a Research Fellow at the IFS and his general research interests include education policy, political economy and poverty and inequality.
More from IFS
Understand this issue


Policy analysis


Academic research


