
Downloads
Download report as a PDF
PDF | 431.9 KB
Given that education policy is a devolved matter across the UK, a natural question to ask is how school spending per pupil differs across the four nations of the UK. In this short report, we show how school spending per pupil has changed across the four nations of the UK over time. We also directly show how the level of COVID-related spending on schools differed across the four nations of the UK. To ensure consistent comparisons, our measure of school spending relates to spending on the early years, schools and school sixth forms per pupil aged 3–19 attending these settings in each nation.
Key findings
- After 2010, school spending per pupil fell across all four nations of the UK. Between 2009–10 and 2018–19, school spending per pupil fell by 8% in real terms in England and by 5% in real terms in Wales. In Northern Ireland, there was a fall of 8% in the shorter period between 2011–12 and 2018–19. In Scotland, there was a fall of 6½% between 2009–10 and 2014–15.
- Since then, spending per pupil has mostly recovered back to 2010 levels across England, Wales and Northern Ireland, with increases of about 8% in real terms in England and Wales between 2018–19 and 2022–23, and of 11% in Northern Ireland. This leaves school spending at about £7,200 per pupil across England, Wales and Northern Ireland in 2022–23. This may end up a little higher in Wales once extra funding has been agreed for a higher teacher pay settlement. In Northern Ireland, there is more uncertainty, with no agreement reached on teacher pay levels stretching back to 2021 and signals of budget cuts for next year.
- In Scotland, large increases in school spending since 2014 have more than reversed past cuts. There was a 13% real-terms increase between 2014–15 and 2019–20, reflecting growth in specific grants over time and a large increase in teacher pay of 7% in 2019. There was then further growth in spending per pupil of 6½% between 2019–20 and 2022–23, reflecting expansion in early years funding and further increases in teacher pay. This makes for a total rise of 21% between 2014–15 and 2022–23 and leaves spending per pupil in Scotland at over £8,500 in 2022–23, over 18% or £1,300 higher than in England, Wales and Northern Ireland.
- There have been different pressures on school budgets from changing pupil numbers across the UK. In England, spending has had to keep pace with a 13% rise in pupil numbers between 2009–10 and 2022–23, whilst in Northern Ireland there was an 8% rise in pupil numbers between 2011–12 and 2022–23. In Scotland, there was much slower growth in pupil numbers (2% between 2009–10 and 2022–23). This meant that total spending only had to grow by a little more in Scotland (15%) than in England (12%) to deliver a much larger rise in spending per pupil in Scotland (13%) than in England (–1%) between 2009–10 and 2022–23. In very stark contrast, pupil numbers have hardly changed at all in Wales over the last thirteen years, which meant that a 3% increase in total spending allowed for a 3% increase in spending per pupil between 2009–10 and 2022–23.
- All four nations are now expected to see falls in pupil numbers of about 6–8% over the next five years. On a national level, this might make it easier to deliver real-terms increases in spending per pupil as money is spread over a smaller population. However, at an individual school level, falling pupil rolls can create budgetary problems if costs do not fall in line with pupil numbers.
- During the pandemic and the aftermath, all four nations provided extra funding to schools to help with extra costs and to aid education recovery. We estimate that total COVID-related spending on schools across 2020–21 and 2021–22 was highest in Wales and Northern Ireland, at about £800 per pupil in total across the two years. It was lower in England and Scotland, at about £300 per pupil, though the figure for Scotland may be a slight underestimate due to extra funding through the main local government settlement.
1. Introduction
Given that education policy is a devolved matter across the UK, a natural question to ask is how school spending per pupil differs across the four nations of the UK. In this short report, we show how school spending per pupil has changed across the four nations of the UK over time. This illustrates that school spending per pupil is broadly similar in England, Wales and Northern Ireland, though the three nations have seen very different pressures from changing pupil numbers. Following recent boosts, school spending per pupil is now significantly higher in Scotland.
Producing consistent comparisons
Differences in data sources and funding systems can make it difficult to compare school spending across nations. In our analysis, we have sought to define a common measure based on total day-to-day school spending on children aged 3–19 by schools, local authorities and funding agencies. This includes early years and pre-primary spending on 3- and 4-year-olds, as well as school sixth form funding to ensure comparability, given that some nations include this funding as part of school allocations. Differences in sixth form and early years provision across the four nations could drive differences in total funding per pupil aged 3–19. In practice, however, these differences are likely to be small given that total funding is largely made up of core schools funding for pupils aged 5–16.
More generally, whilst we have sought to make these measures as comparable as possible, there are always potential limitations with comparing data from different sources, which we highlight for individual nations. Figures for Scotland, Wales and Northern Ireland in 2022–23 should be treated as provisional plans. Figures for Scotland and Wales are likely to increase as a result of agreements on teacher pay and expectations of extra funding to pay for these higher awards. The same could also apply to England and Northern Ireland when agreements are reached.
It is also important to highlight the critical role played by the pandemic since 2020–21. In the first instance, this led to higher levels of funding to schools to help with extra costs, though some schools spent less on some areas whilst they were closed to most pupils (e.g. energy and catering). In the second instance, there was extra spending focused on education recovery. Given that such spending is included as part of standard spending in some nations, we include it for all nations. This leads to jumps in spending in both 2020–21 and 2021–22.
To aid understanding, we also estimate spending per pupil over time excluding COVID-related spending. These figures should be treated as approximations and with some caution as spending did not always occur through standard mechanisms. Some spending also became regularised as part of core spending. However, these estimates do provide a useful guide to the underlying trends in core school spending. We also directly show the level of COVID-related spending across the four nations.
The pandemic also led to unusual trends in the key measure of inflation used for assessing ‘real-terms’ trends in spending over time. In particular, the GDP deflator rose by over 6% in 2020–21 and then fell by nearly 1% in 2021–22. In reality, the specific costs faced by schools are likely to have followed a smoother trend. The single-year changes in 2020–21 and 2021–22 should therefore be treated with some caution.
2. Comparing spending per pupil across UK nations
Figure 1 shows the level of school spending per pupil across the four nations of the UK (with and without COVID-related spending in 2020–21 and 2021–22). With some important exceptions, the trends and levels in core spending per pupil have been broadly similar across England, Wales and Northern Ireland.
Figure 1. School spending per pupil across England, Wales, Scotland and Northern Ireland (2022–23 prices), actual and planned spending
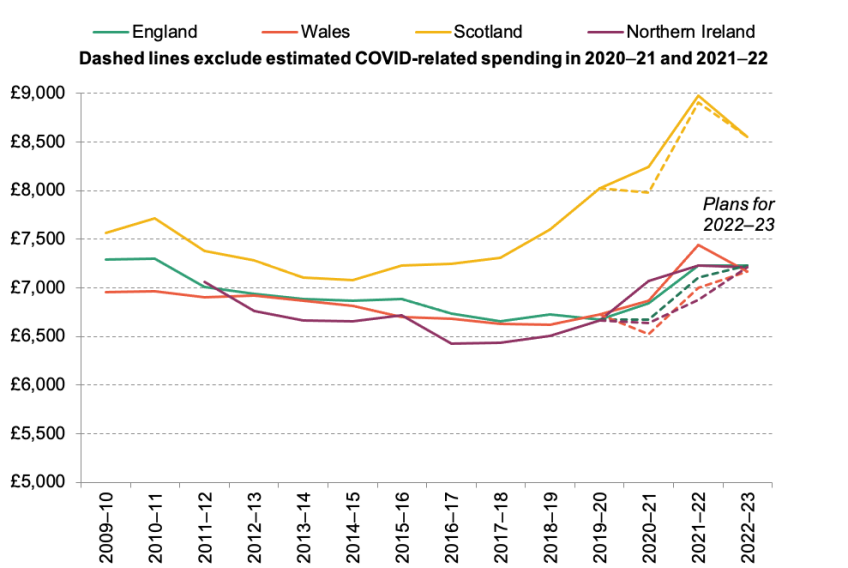
Note: Sources at end of document.
Similar levels across England, Wales and Northern Ireland
Between 2009–10 and 2018–19, spending per pupil fell by 8% in real terms in England and by 5% in real terms in Wales. In Northern Ireland, there was a fall of 8% in the shorter period between 2011–12 and 2018–19 (we can only produce consistent comparisons back to 2011–12 in Northern Ireland).
Since then, spending per pupil has increased across all three nations, though at slightly different rates. Spending per pupil in England grew by 7½% in real terms between 2018–19 and 2022–23. This mostly reflects increases in funding announced at recent spending reviews. The figures for England are also higher than we have previously published as we include the grant for additional employer pension contributions (Drayton et al., 2022). This ensures consistency with figures for other nations.
In Wales, spending per pupil rose by 8% in real terms between 2018–19 and 2022–23, a similar rate of growth to England. However, the level of spending in Wales in 2022–23 should be treated as provisional as there could still be extra within-year spending to meet the cost of a higher teacher pay settlement for 2022–23. As a result of this settlement, teachers in Wales are due to receive a salary rise of 6.5% in 2022–23, plus a non-consolidated bonus worth 1.5% of total salary, and then a 5% rise for 2023–24.
In Northern Ireland, spending per pupil grew by 11% in real terms between 2018–19 and 2022–23. This higher growth partly reflects delays in agreeing and funding salary rises for teachers. The annual teacher pay awards for September 2017 and September 2018 were not agreed until April 2020 and were only paid to schools and teachers as back-pay from 2020–21 onwards. The awards for 2019 and 2020 were then agreed in March 2021, with back-pay funding included for 2021–22. This delay in agreeing teacher pay levels led spending per pupil to be depressed in 2017–19 and increased for 2020 and 2021. Pay awards for 2021–22 and 2022–23 are also still to be agreed and will likely lead to another spike in funding to cover back-pay in 2022–23 or 2023–24. The reported figure for spending per pupil in 2022–23 should be treated as provisional. Indeed, it may be that the level for 2022–23 is not sustained in future years given reports of budget cuts for 2023–24.
The net result of these trends is that spending per pupil is currently expected to be very similar across England, Wales and Northern Ireland in 2022–23, at about £7,200 per pupil.
It is important to note that total school spending per pupil was boosted by COVID-related spending in both 2020–21 and 2021–22. This is part of the explanation for apparent falls in spending per pupil in 2022–23. Measures of spending per pupil excluding COVID-related spending show smoother patterns over time. It is also important to note that figures for spending per pupil across all four nations will include some COVID-related funding in 2022–23, as well as legacy initiatives that have effectively merged into core funding.
Higher levels of spending in Scotland
Spending per pupil is now significantly higher in Scotland than in the rest of the UK. Between 2009–10 and 2014–15, spending per pupil fell by 6½% in real terms in Scotland, mirroring the cuts occurring across the rest of the UK. These cuts were more than unwound, with spending per pupil growing by 13% in real terms between 2014–15 and 2019–20. Some of this growth in spending can be explained by greater use of specific grants from central government, such as the Pupil Equity Fund, which, like the Pupil Premium in England, provides extra funding to schools with more disadvantaged pupils. Total specific grants grew from just under £50 million in 2014–15 (less than 1% of total school spending) to reach over £500 million in 2019–20 (9% of total school spending).
In 2019–20, there was a large single increase of 5½% in real terms or an extra £400 per pupil. This increase largely reflects the Scottish Government’s decision to increase teacher pay scales by 7% from April 2019 (with a further increase of 3% backdated to April 2018). This led to an unusually high level of spending per pupil in 2019–20.
Between 2019–20 and 2022–23, there has been further real-terms growth of 6½% in school spending per pupil. The true level of spending per pupil is also likely to end up higher than this now the teacher pay dispute has been settled. Teachers in Scotland have agreed to a salary rise of 7% for 2022–23 (higher than the original proposal of 5%) and a further 7% in 2023–24 (paid in two stages, with a 5% increase in April 2023 and a further 2% in January 2024). These figures already include £320 million extra funding for 2022–23 and 2023–24, but the level of extra funding could well end up higher.
Part of the reason for further growth in total school spending per pupil reflects extra funding to pay for the expansion of early learning and childcare, with all 3- and 4-year-olds (and eligible 2-year-olds) now entitled to the equivalent of 30 hours’ free early learning and childcare during term time. (In England and Wales, this only applies to working parents.) In 2022–23, there was total funding of over £500 million to pay for this expansion, which accounts for well over half of the estimated £800 million in specific grants in 2022–23.
By 2022–23, planned spending per pupil is currently estimated to be over £8,500 per pupil, about 13% higher than in 2009–10. This still leaves spending per pupil in Scotland over 18% higher than in England, Wales and Northern Ireland. These differences may end up being higher once agreements are reached on teacher pay across all four nations.
Different pressures from pupil numbers
Underlying these changes in spending per pupil, there have been quite different changes in total spending and pupil numbers across the UK. As Figure 2 shows, there has been rapid growth in pupil numbers in England of 13% between 2009–10 and 2022–23. Total growth in spending has just about matched this over the period as a whole, with the measure of spending per pupil in England about the same in 2022–23 as it was in 2009–10.
Figure 2. Changes in total spending, pupil numbers and spending per pupil across England, Wales, Scotland and Northern Ireland* between 2009–10 and 2022–23
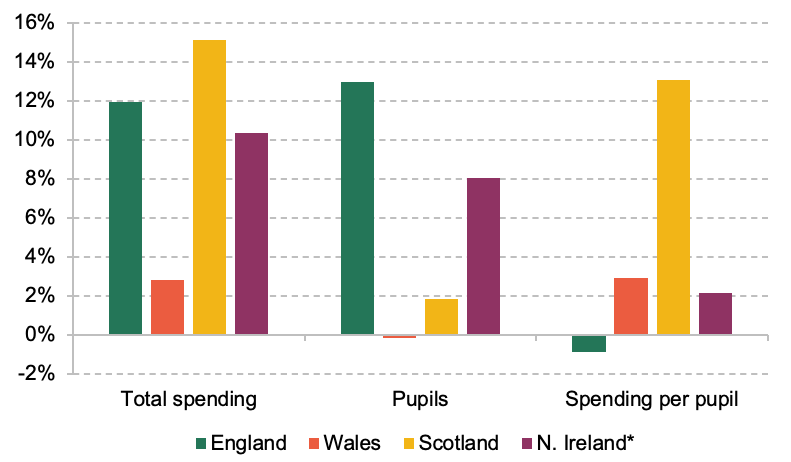
* Figures for Northern Ireland relate to the period 2011–12 to 2022–23.
Note: Sources at end of document.
In sharp contrast, pupil numbers have only grown by 2% in Scotland over the same period and have hardly changed at all in Wales. This allowed a 15% growth in total spending in Scotland (only a bit larger than in England) to translate into a 13% growth in spending per pupil. In Wales, total spending only grew by 3% between 2009–10 and 2022–23, much less than in the other nations of the UK. However, because of the lack of growth in pupil numbers, this directly translated into 3% overall growth in spending per pupil.
The trends for Northern Ireland lie somewhere in between those seen for the other nations of the UK. Pupil numbers grew by 8% between 2011–12 and 2022–23. This meant that 10% growth in total spending delivered 2% growth in spending per pupil.
From these figures, Wales stands out as seeing much lower growth in total spending than that seen in other nations of the UK, partly reflecting much lower pressures from changes in pupil numbers.
Looking to the future, all four nations are likely to experience a similar drop in pupil numbers over the near future. In England, the number of pupils in state-funded schools is expected to fall by 6% over the next five years, between 2023 and 2028. In Wales, the number of pupils in maintained schools is expected to drop by 7% over those years. In Scotland, the number of pupils is expected to fall by 7% between 2022 and 2027. And in Northern Ireland, the number of children aged 5–14 is forecast to fall by 7–8% between 2023 and 2028. Naturally, these falls are expected to initially be larger in primary schools, before then feeding into secondary schools.
On one level, falls in pupil numbers will allow spending to go further, with existing spending levels spread over a smaller population. A given increase in total spending will deliver a larger increase in spending per pupil. However, falling pupil numbers will create challenges for individual schools. Mostly pupil-led funding systems will lead to falls in funding for many schools. With costs mostly fixed in the short run, some schools may find it difficult to cover costs.
3. Differences in COVID-related spending
Finally, we show the level of COVID-related spending per pupil during the peak of the pandemic in 2020–21 and 2021–22. This gives a sense of how much COVID-related spending is pushing up recorded spending in these years. These figures only relate to day-to-day spending on nurseries and schools, and include both support for extra costs (such as cleaning or school meals) and for education recovery. As such, they may differ from other figures published focusing on education recovery only or figures across the whole education system (Sibieta and Cottell, 2021). We focus on the cumulative total across the two years given the slight differences in the profile of how spending is recorded across the two years.
As can be seen from Figure 3, there seems to be a clear difference across the four nations, with Wales and Northern Ireland spending about £800 per pupil in total across the two years in today’s prices, and England and Scotland spending about £300 per pupil. In what follows, we detail the major areas of spending across the four nations. All figures are in cash terms to be consistent with familiar figures in the public domain.
Figure 3. COVID-related school spending per pupil across England, Wales, Scotland and Northern Ireland, 2020–21 and 2021–22
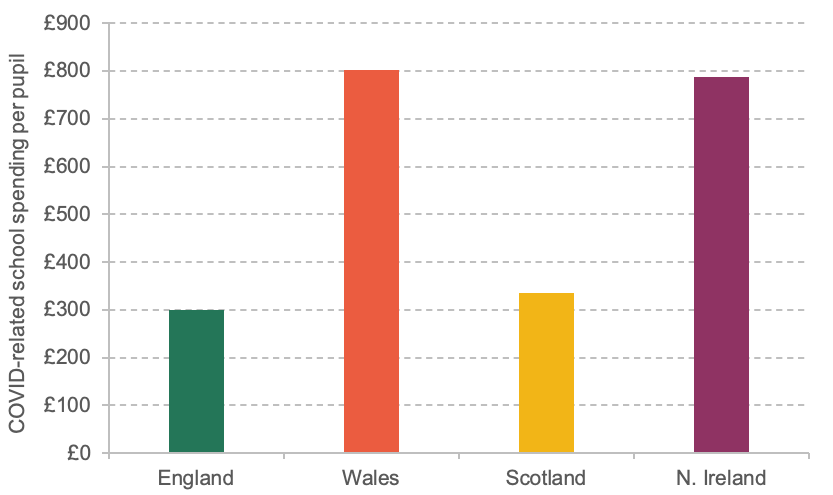
Note: Sources at end of document.
In England, COVID-related spending on schools and the early years totalled about £1.4 billion in 2020–21 and £1 billion in 2021–22. This includes £800 million on recovery or catch-up premiums allocated directly to schools, nearly £500 million on free school meal vouchers and £300 million on the national tutoring programme. This equated to a total of £300 per pupil over the two years in today’s prices. On top of this, the government has committed an additional £350 million for the national tutoring programme in 2022–23 and at least £300 million per year for the continuation of the recovery premium (into 2023–24).
The Welsh Government provided about £150 million in COVID-related grants for schools and the early years in 2020–21 and £200 million in 2021–22. This includes about £130 million for the Recruit, Recover and Raise Standards programme over these two years, which is due to continue through to 2024–25. It also includes over £90 million in funding for free school meals during holiday periods. Total funding equates to about £800 per pupil in today’s prices over 2020–21 and 2021–22 combined. The true figure is likely to be higher, however, as the Welsh Government also provided more general support for local authorities, some of which will have been used for education.
The Scottish Government provided about £200 million of COVID-related grants in 2020–21 and £50 million in 2021–22. This mostly relates to education recovery or additional staff (at least £230 million across the two years). This equates to about £340 per pupil over the two years. As with Wales, however, the true figure is likely to be higher as the Scottish Government also provided more general support to local authorities. Moreover, a number of general grants for 2021–22 relate to areas of spending that were treated as COVID-related in other nations. This includes funding for a ‘summer of play’ (£15 million), free school meals holiday support (£22 million) and additional funding to increase teacher numbers and pupil support assistants (£50 million). This would amount to a further £120 per pupil.
COVID-related spending on schools was also relatively high in Northern Ireland, at about £790 per pupil in today’s prices across 2020–21 and 2021–22 combined. Total funding in 2020–21 amounted to £140 million, most of which related to the provision of free school meals (about £50 million) and the Education Restart programme (over £60 million). For 2021–22, total funding was about £110 million, including over £20 million for the Engage programme focused on education recovery and over £20 million on free school meal provision. These programmes have now come to an end, with COVID legacy programmes not taken forward into 2023–24.
4. Conclusions
To summarise, the level of school spending per pupil is currently planned to be quite similar across England, Wales and Northern Ireland in 2022–23, at about £7,200 per pupil. This may go up in some cases when all nations have agreed teacher pay levels and any consequent extra funding. Across all three nations, cuts to spending per pupil have been effectively reversed by more recent increases. However, each nation has got to this position from quite different pressures from changing pupil numbers. In England, rapid rises in pupil numbers have been just about matched by rises in spending over the last 12 years, such that spending per pupil is now largely back to where it was in 2010. In Wales, by contrast, pupil numbers have hardly changed, such that a small rise in spending allowed for a small rise in spending per pupil.
The picture in Scotland is quite different, with significantly higher levels of school spending per pupil, at least £8,500 per pupil in 2022–23 prices. To some extent, school spending per pupil has been higher in Scotland for a long period (being about 6% or £400 higher per pupil in 2011–12). However, by 2022–23, it was at least 18% or £1,300 higher than in England, Wales and Northern Ireland.
Such differences naturally prompt questions about whether higher funding is leading to better educational outcomes or narrower inequalities in Scotland. The empirical evidence would suggest that it should. However, the evidence also highlights that just doing simple correlations in funding and outcomes is not particularly informative either, as the relationship between funding and outcomes is a complex one. For instance, much of the recent increases in school spending in Scotland have been driven by increased spending on the early years, which would take a very long time to filter through to test scores or other educational outcomes. Nevertheless, it is noteworthy that despite having the highest level of school spending per pupil across the UK for a long period, test scores in reading, maths and science in Scotland have either stayed the same or been going down over time in PISA international comparisons (Scottish Government, 2019).
References
Drayton, E., Farquharson, C., Ogden, K., Sibieta, L., Tahir, I. and Waltmann, B., 2022. Annual report on education spending in England: 2022. IFS Report R234, https://ifs.org.uk/publications/annual-report-education-spending-england-2022.
Scottish Government, 2019. Programme for International Student Assessment (PISA) 2018: highlights from Scotland’s results. https://www.gov.scot/publications/programme-international-student-assessment-pisa2018-highlights-scotlands-results/.
Sibieta, L. and Cottell, J., 2021. Education reopening and catch-up support across the UK. Education Policy Institute, https://epi.org.uk/publications-and-research/reopening-catch-up-support-uk/
Authors

Luke Sibieta
Luke is a Research Fellow at the IFS and his general research interests include education policy, political economy and poverty and inequality.
More from IFS
Understand this issue


Policy analysis


Academic research


