Downloads
Download the report as a PDF
PDF | 1011.82 KB
Executive summary
Public services play an important role in supporting households’ well-being and their members’ life chances. This is especially true for low- and middle-income households, for whom the in-kind services received represent a larger share of overall consumption and for whom equivalent private services may be prohibitively expensive.
Most public service spending in Scotland – including the vast majority of what is spent on health, education, social care, transport, public order and safety, environmental and rural affairs and housing – is devolved to the Scottish Government and Scottish local authorities. But some – such as a significant share of research funding – is reserved to the UK government. Spending on public services – both devolved and reserved – was 22% higher per person in Scotland than in England in 2024–25, while benefit spending was 12% higher per person.
But how is this higher spending allocated across different services? How have these allocations changed over time? What are the trade-offs between services in future? And how do a range of headline indicators of public service outcomes vary between Scotland and the rest of Great Britain?
Key findings
Trends in public service spending
- Identifiable public spending per person in Scotland in 2024–25 was 18.5% higher than in England. The gap is bigger for public service spending (22%) than for benefit spending (12%). However, whereas the gap for benefit spending has grown since 2019–20 (when it was 7%), the gap for public service spending has shrunk over the last few years (it was 28% in 2019–20). This reflects slower growth in funding for public services in Scotland in recent years as a result of the ‘Barnett squeeze’.
- The biggest differences in public service spending are in generally smaller areas of spending. For example, spending per person on recreation, culture and religion was 87% higher in Scotland than in England in 2024–25. Spending per person on environmental protection was 37% higher and spending on adult social care services 36% higher.
- In contrast, the difference for health, the largest area of public spending, is just 2% higher – down from 4% in 2019–20 and 11% in 2010–11. Health spending per person has increased in Scotland over the last 5 and 15 years, but at a slower rate than in England and Wales.
- Education spending is 24% higher than in England despite children representing a smaller fraction of the population in Scotland. In 2025–26, school spending per pupil was about £10,400 in Scotland, which is about 21% or £1,800 higher than in England. Spending per pupil has grown more in Scotland since 2009–10 (12% in real terms) than in England (3%) and Wales (10%). School spending includes early education and childcare spending, which doubled in real terms between 2016–17 and 2022–23 and was a major driver of overall growth in spending in Scotland.
Performance of key Scottish services
- Waiting times in the Scottish NHS remain substantially worse than pre-pandemic, with key elective recovery targets missed. In December 2025, 9.3% of patients waited over a year for elective treatment, compared with 1.0% pre-pandemic, despite targets to eliminate such waits in most specialties by 2024 and despite some recent improvement. A&E waiting times are better in Scotland than in either England or Wales, though still worse than target and pre-pandemic performance.
- Scotland has failed to increase hospital activity above pre-pandemic levels as planned, despite having 14% more NHS staff than before the pandemic. In both England and Wales, hospital activity is now above pre-pandemic levels, in part due to larger increases in hospital staffing than in Scotland. But in all three countries there is evidence of falls in hospital labour productivity since the start of the pandemic.
- Educational performance in Scotland has been declining relative to England as measured by international PISA tests for 15-year-olds. Scotland historically outperformed England on these tests, but overall performance in maths, reading and science has declined since 2012.
- Although overall crime victimisation rates have fallen in Scotland and in England and Wales over the past 15 years – with victimisation now concentrated more among young people in Scotland – courts remain under significant strain. Court backlogs are still around twice their pre-pandemic levels, with Scotland seeing a sharp post-COVID spike followed by a strong but partial recovery over the last three years. England and Wales instead have seen a steadier but more persistent increase in backlog and delays, without any recovery yet.
- Inequalities in health and educational performance appear to be larger in Scotland than in England. Areas with lower average incomes have – on average – lower life expectancy. This is also true in England and Wales, but the relationship is somewhat stronger in Scotland. Moreover, areas in Scotland have lower life expectancy than areas with similar average incomes in England and Wales. School students from more deprived backgrounds also have lower attainment and school attendance in Scotland.
Outlook for public service spending
- A tough outlook for public service spending will make improving public services challenging for the next Scottish Government. Current policy implies that after stripping out funding for social care wage increases, health and social care spending is set to fall in real terms in 2026–27 which, if stuck to, would require heroic improvements in efficiency to avoid a deterioration in NHS performance. Luckily, additional UK government funding confirmed since the Scottish Budget may enable in-year top-ups to health and social care spending without cuts to other services. In 2027–28 and 2028–29, real-terms increases in health and social care resource spending are planned but, given current forecasts for overall funding, could require cuts averaging 1.8% a year to spending on other public services, including local government, policing and justice.
- Both the current Scottish Government’s approach to budgeting and external factors mean there are risks to the public service spending outlook. Recent years have seen the Scottish Government rely on one-off funding sources to pay for new recurrent spending measures. Pay deals have also been agreed which are substantially larger than budgeted for, as well as larger than in the rest of the UK. Both habits will increase the pressure on future budgets. In addition, there is uncertainty about both future UK government funding and devolved tax revenues. If average economy-wide earnings in Scotland grow less quickly than in the rest of the UK (rather than more quickly as current forecasts implicitly assume), a shortfall in income tax revenues could mean other services facing substantially larger cuts. These cuts could average 3.9% a year in real terms in 2027–28 and 2028–29, if the next Scottish Government wanted to protect health and social care spending from the effects of the revenue downgrade.
1. How much is spent on public services in Scotland?
The Scottish Parliament has responsibility for large parts of public spending, including most services directly used by households. This includes the NHS, social care services, education, justice, housing and the police. Responsibility for some areas – such as defence, foreign affairs, immigration services and most social security benefits – is not devolved and remains with the UK parliament in Westminster. A fuller list can be found in our online election explainer.1
Total public expenditure for and on behalf of Scotland in 2024–25 was estimated to be £118 billion, according to the Scottish Government’s Government Expenditure and Revenue Scotland (GERS) publication (Scottish Government, 2025a). This includes a population share of some areas of spending, such as overseas aid, defence and debt interest payments, which is incurred by the UK government on behalf of the whole of the UK, including Scotland.
Total ‘identifiable’ public expenditure in Scotland – that is, spending flowing directly to Scottish beneficiaries, including both devolved and non-devolved areas – amounted to £86 billion in 2024–25, according to the UK government’s Country and Regional Analysis (CRA) publication (HM Treasury, 2025). This is equivalent to £89 billion or £16,021 per person in today’s prices – a figure that is 15.2% higher than the UK average and 18.5% higher than spending per head in England.2 Note this is not the same as Scottish Government funding, which does not include spending in Scotland by the UK central government. Recent work by IFS researchers has showed that total Scottish Government funding per person is around 28% higher than what is provided to UK government departments for spending on comparable functions in England (Brogaard and Phillips, 2026). This bigger difference reflects the fact that the Scotland–England gap in spending on devolved public services is much greater than the gap in spending on non-devolved areas (e.g. most of social security) – an issue to which we will return later.
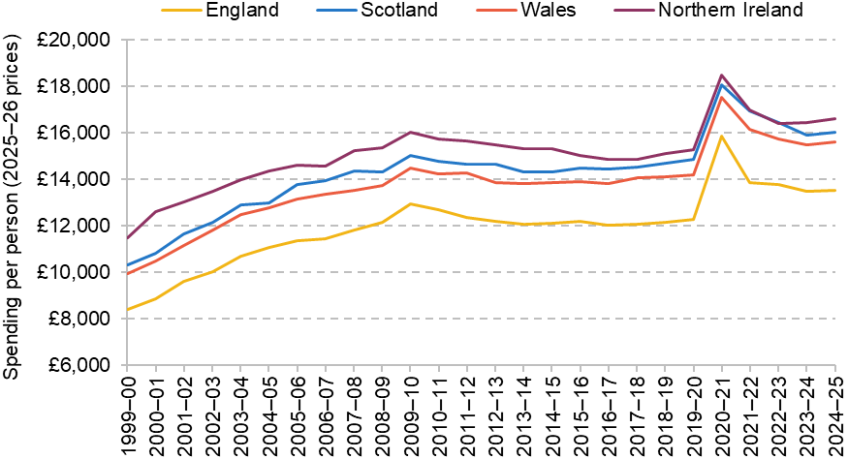
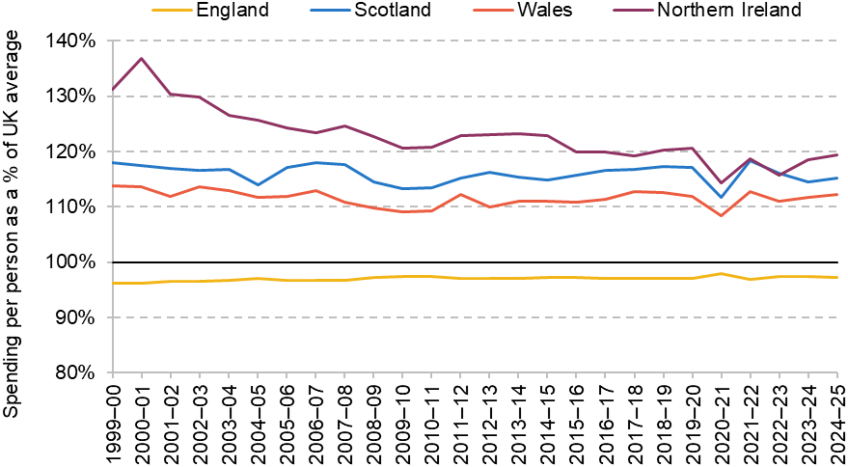
Figure 1 shows how total identifiable spending per person in each of the four nations of the UK has evolved since 1999−2000, at the outset of devolution. Figure 2 shows how identifiable spending per person as a share of the UK average has evolved for each of the four nations over the same period.
Figure 1. Total identifiable expenditure per person (2025–26 prices)
Source: Authors’ calculations using HM Treasury (2024 and 2025) and Office for National Statistics (2024a and 2025a).
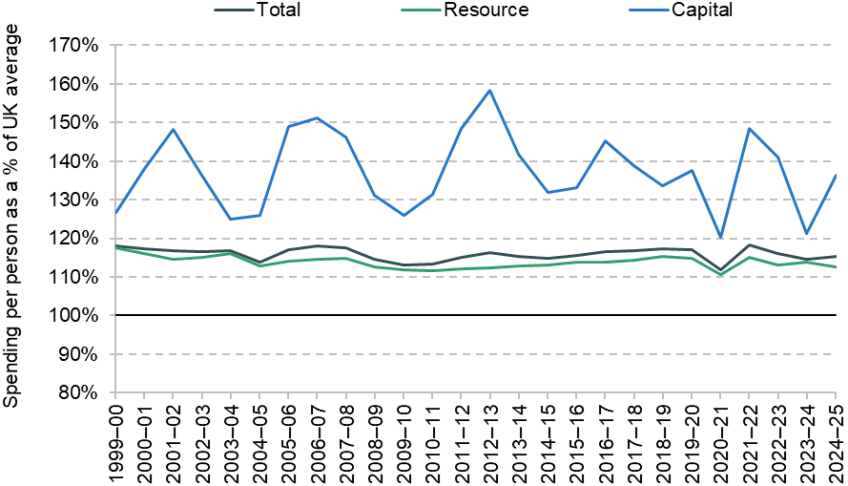
Figure 2. Total identifiable expenditure per person as a share of the UK average
Source: Authors’ calculations using HM Treasury (2024 and 2025) and Office for National Statistics (2024a and 2025a).
Figure 1 shows that while spending per person has fallen back from its COVID-19 pandemic peak, identifiable government spending per person in Scotland was 8% higher in real terms in 2024–25 than in both 2019–20 and 2010–11. This is a slower rate of increase than in both England and Wales since 2019–20 (where growth was 10% per person). But Scotland has seen a slightly bigger increase than in England since 2010–11 (where the growth has been just under 7% per person).
Figure 2 shows that identifiable spending has long been higher in Scotland than in the UK as a whole. The gap narrowed during the 2000s (from 18% above the UK average in 1999–2000 to 13% above the UK average in 2010–11) due to both smaller increases in benefit spending and a former episode of the Barnett squeeze delivering smaller percentage increases in funding for public services compared with England.3 The gap then widened in the 2010s (to 17% above the UK average in 2019–20) as the Barnett squeeze went into reverse. The gap has subsequently narrowed a bit again (to 15% above the UK average as of 2024–25).
Scotland stands out in particular for its higher level of capital spending – that is, investment in buildings, equipment, infrastructure and research – as shown in Figure 3.
Figure 3. Capital and resource identifiable expenditure per person in Scotland as a share of the UK average
Source: Authors’ calculations using HM Treasury (2024 and 2025) and Office for National Statistics (2024a and 2025a).
On average, while identifiable resource spending (that is spending on the day-to-day operation of services) per person has averaged 14% higher than the UK average over the last 10 years, capital spending per person has averaged 36% higher – although this has also been more volatile on a year-to-year basis. Part of the higher capital spending since the mid 2010s has been funded via Scottish Government borrowing – which is repaid using resource funding.
The Scottish Government and Scottish councils are responsible for approximately 70% of all identifiable expenditure in Scotland – £62 billion out of £89 billion as of 2024–25 (in 2025–26 prices). This includes large majorities of capital expenditure (£9.2 billion out of £11.5 billion, or 80%) and resource expenditure on public services (just under £47 billion out of just under £49 billion, or 96%). However, they are responsible only for a minority of resource spending on social security benefits (£6.2 billion out of £28 billion, or 22%), with the UK parliament and government still responsible for most such spending. The devolution of a range of mostly disability-related benefits in 2020 and new Scottish benefits such as the Scottish child payment have increased the share of benefit expenditure that is devolved, though: just 4% of benefit expenditure was undertaken by the Scottish Government five years earlier in 2019–20.
2. How has spending on different services fared?
Figure 4 provides a breakdown of how the £89 billion of identifiable expenditure in Scotland was allocated between different services as of 2024–25. The largest component – spending on non-devolved social security – is outside the purview of the Scottish Government: decisions over pensioner and working-age benefits are made for the most part by the UK government. Similarly, most of ‘economic affairs’ spending (e.g. employment policies and science and technology) is non-devolved.
Figure 4. Breakdown of identifiable expenditure in Scotland in 2024–25, by service area (2025–26 prices)
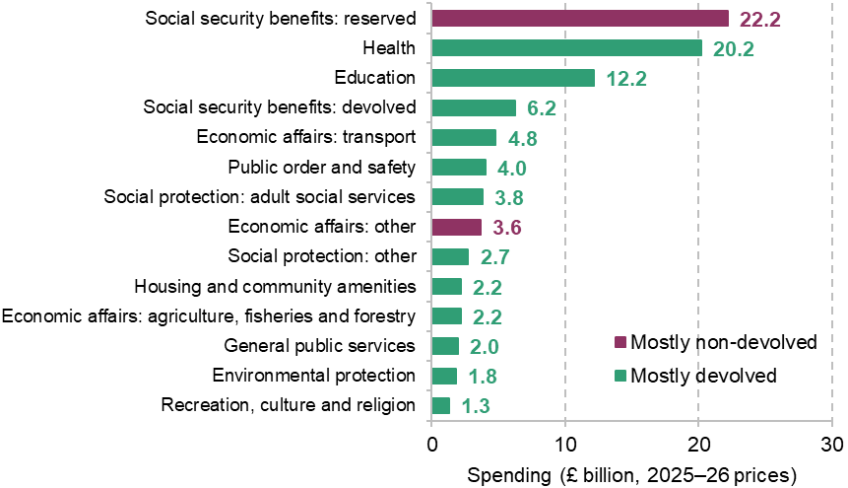
Note: ‘Social security benefits: reserved’ is total social security spending in Scotland minus Scottish Government social security spending. Because it is not possible to precisely identify devolved and non-devolved expenditure, some items within ‘mostly devolved’ will be reserved matters, and some items within ‘mostly non-devolved’ will in fact be devolved.
Source: HM Treasury, 2025; Department for Work and Pensions, 2025.
Identifiable expenditure on health and education are the largest components under Scottish Government control, with spending of £20.2 billion and £12.2 billion in 2024–25. Increases in caseloads and new Scottish benefits since parts of benefit spending were devolved in the late 2010s and early 2020s make devolved benefits the third-largest area of devolved spending.
Table 1 provides a detailed breakdown of how spending on various service areas has evolved in Scotland and England over time. In all of these categories, spending per head is higher in Scotland than in England, but the gaps differ, as do the trends.
Table 1. Spending on different service areas in Scotland and England (2025–26 prices)
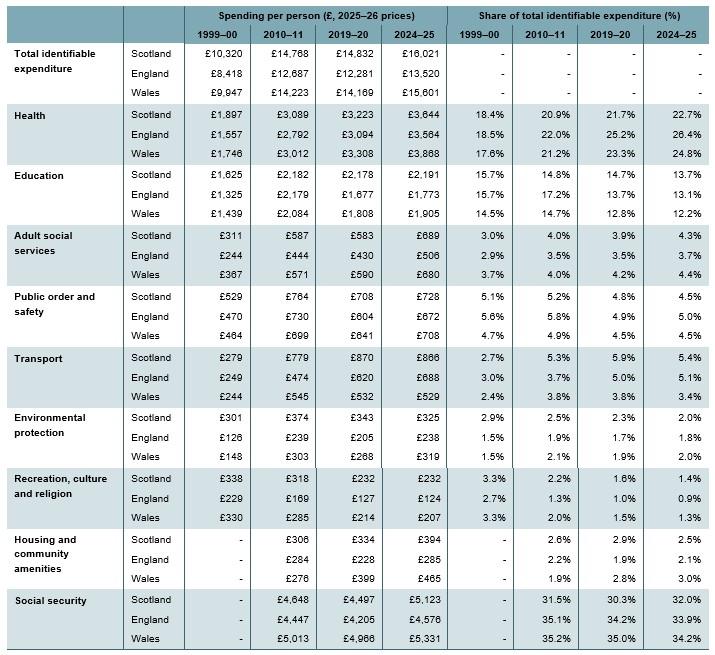
Note: ‘Adult social services’ is defined here as total spending on personal social services, less the family and children and unemployment components. This falls within the overall ‘social protection’ function. ‘Social security’ is defined as identifiable benefit expenditure (from DWP), plus spending by HMRC on child benefit, personal tax credit, guardian’s allowance, universal credit, tax-free childcare, Saving Gateway and child trust funds, plus spending by the Scottish Government on social security, social exclusion, social protection and community justice. This measure of social security spending is not available for 1999−2000. ‘Housing and community amenities’ is defined as identifiable spending on housing and community amenities, less spending on water supply. This measure of spending is also unavailable for 1999−2000. Not all components of spending are included here, so percentages do not add up to 100%.
Source: Authors’ calculations using HM Treasury (2025), Office for National Statistics (2024a and 2025a) and Department for Work and Pensions (2025).
The biggest differences are not for the biggest devolved services (health and education), but instead for some of the smaller areas of spending. For instance: spending per person on recreation, culture and religion was 87% higher than in England in 2024–25 (£232 versus £124); spending per person on environmental protection was 37% higher (£325 versus £238); and spending per person on adult social care services was 36% higher (£689 versus £506). In contrast, the difference in spending for health is much lower (2%).
Trends over time also differ between Scotland and England, reflecting different prioritisation by the Scottish and UK governments. During the period between 2010–11 and 2019–20, spending per person on housing and community amenities increased by 9% in real terms in Scotland, but fell 20% in real terms in England. On the other hand, transport spending per person increased by 12% in real terms in Scotland, compared with 31% in England. The 2010s therefore saw the Scottish Government prioritise housing relatively more and transport relatively less than the UK government did.
Since 2019–20, as spending growth has slowed in Scotland relative to England, most areas of spending have increased by less in Scotland than in England: this is true of health, education, public order and safety, transport, environmental protection, and housing and community amenities. The exceptions are: adult social care, where spending per person in Scotland has increased at a similar rate to England (18% in real terms); recreation, culture and leisure, where spending per person in Scotland was the same in real terms in 2024–25 as in 2019–20 but it had fallen slightly in England (–2%); and social security benefits, where spending per person increased by 14% in real terms between 2019–20 and 2024–25 in Scotland, compared with 9% in England.
Table 1 also shows that spending per person has been consistently higher in Scotland than in Wales over the past 25 years. In 2024–25, it was 2.7% higher, overall. While overall allocations across services are broadly similar, there are some differences. Education represents a larger share of spending in Scotland than in Wales – 13.7% (£2,191 per person), compared with 12.2% £1,905 per person). In contrast, health represents a larger share of spending in Wales: 24.8% (£3,868 per person), compared with 22.7% (£3,644 per person) in Scotland.
As with England, the gap between spending in Scotland and Wales has narrowed recently – spending per person in Scotland was 4.7% higher than in Wales in 2019–20. This reflects the slower real-terms growth in spending seen in Scotland (8.0%) versus Wales (10.1%) over this period. As with England, the pattern is evident across most services, including health (up 13.1% in Scotland versus 16.9% in Wales) and education (up 0.6% in Scotland versus 5.4% in Wales).
Figure 5 shows how overall identifiable spending, spending on public services and spending on social security benefits in Scotland compares with England for three years – 2010–11, 2019–20 and 2024–25. The blue bars show that overall identifiable spending increased during the 2010s (from 16.4% higher than in England to 20.8% higher), with around half of the increase then undone between 2019–20 and 2024–25 (when spending was 18.5% higher than in England).
Figure 5. Relative spending gap between Scotland and England, selected years
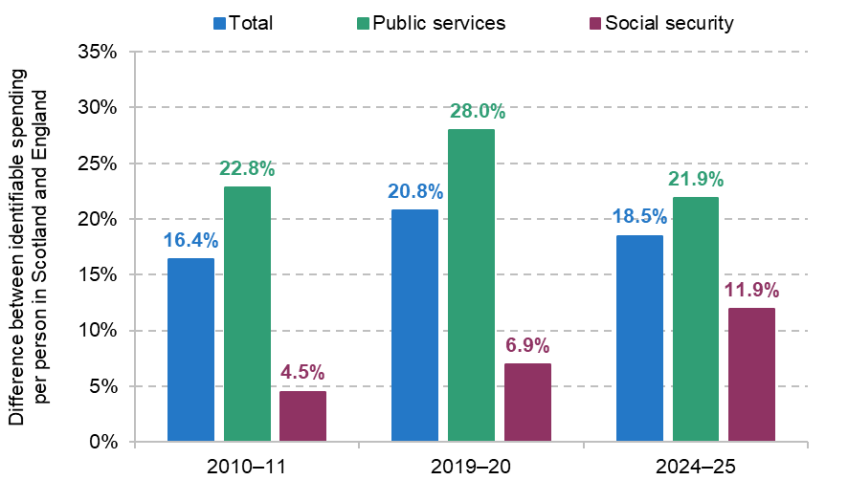
Note: ‘Public services’ is total spending excluding spending on both reserved and devolved social security.
Source: Authors’ calculations using HM Treasury (2024 and 2025), Office for National Statistics (2024a) and Department for Work and Pensions (2025).
The green bars show that the biggest driver of this trend has been changes in public service spending relative to England – which, like overall spending, increased relative to England during the 2010s before falling back from 2019–20. The main reason for this is set out in our previous election briefing on Scottish Government funding (Brogaard and Phillips, 2026): the operation of the Barnett formula, which determines changes in UK government funding for the Scottish Government. During the 2010s, spending was being reduced UK-wide, Scotland’s population was growing less quickly than that of England and, for part of that period, an error in the Barnett formula insulated Scotland from cuts to local government funding in England. Thus Scotland saw smaller cuts in funding for public services than England – leading spending to rise relative to England. Since 2019–20 – when the aforementioned error has been fixed, overall spending has increased substantially and population growth rates have differed less – the so-called ‘Barnett squeeze’ has instead come to the fore.4 This is because (before considering population growth) the Barnett formula provides the same cash-per-person change in funding for the Scottish Government as is planned for England. But this is a smaller percentage change in funding in Scotland given higher initial levels of funding (and spending) per person.
By contrast, the purple bars show that the spending gap in social security has widened over time – and particularly since 2019–20. This reflects both Scottish Government policy (including new benefits such as the Scottish child payment) and the impact of changes in the composition of benefit spending (rapid growth in disability benefit spending, for example, which has long been relatively higher in Scotland than in England due to higher claimant numbers).
Trends in health and education spending
Figure 6 looks in more detail at trends in health and education spending in both Scotland and England – with real-terms spending normalised to 100 in each country and for each service in 2010–11 for ease of comparison.
Figure 6. Health and education spending per person, Scotland and England (real terms, 2010–11 = 100)
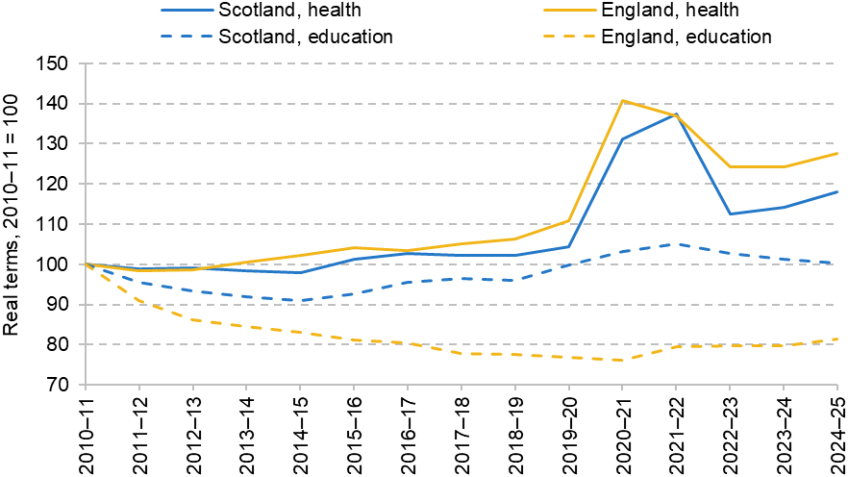
Source: Authors’ calculations using HM Treasury (2025), Office for National Statistics (2024a and 2025a) and Department for Work and Pensions (2025).
It shows that reported health spending per person has increased by less in Scotland over the last 15 years than in England: 18% in real terms per person, compared with 28%. As a result, Figure 7 shows that health spending per person fell from 11% higher than in England in 2010–11 to 4% higher in 2019–20 and just 2% higher by 2024–25.5
Figure 7. Difference between real-terms health spending per person in Scotland and England
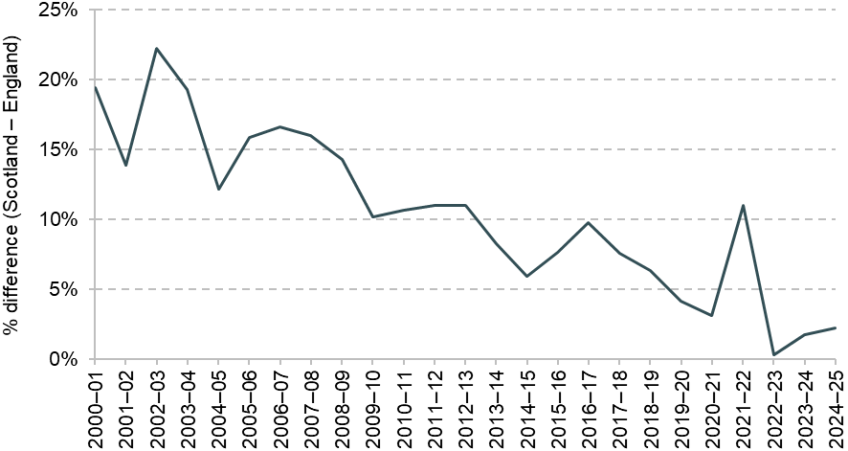
Note: A positive figure indicates that spending per person was higher in Scotland than in England.
Source: Authors’ calculations using HM Treasury (2025), Office for National Statistics (2024a and 2025a) and Department for Work and Pensions (2025).
The picture for education spending is somewhat different, with spending per person in Scotland 0.4% higher in real terms in 2024–25 than in 2010–11, but 19% lower in England. This differential trend opened up in the 2010s, reflecting a range of factors. These include the Scottish Government’s policy of free university tuition and, as we shall see below, significant increases in both Scottish school spending per pupil and early years spending in the late 2010s and first years of the 2020s. In contrast, in England, university fees were increased and direct government funding reduced from 2012, and school spending per pupil fell until 2019–20.6 The gap has now started to narrow, with English education spending per person up 7% in real terms between 2020–21 and 2024–25 – a period during which education spending per person has fallen by 3% in Scotland.
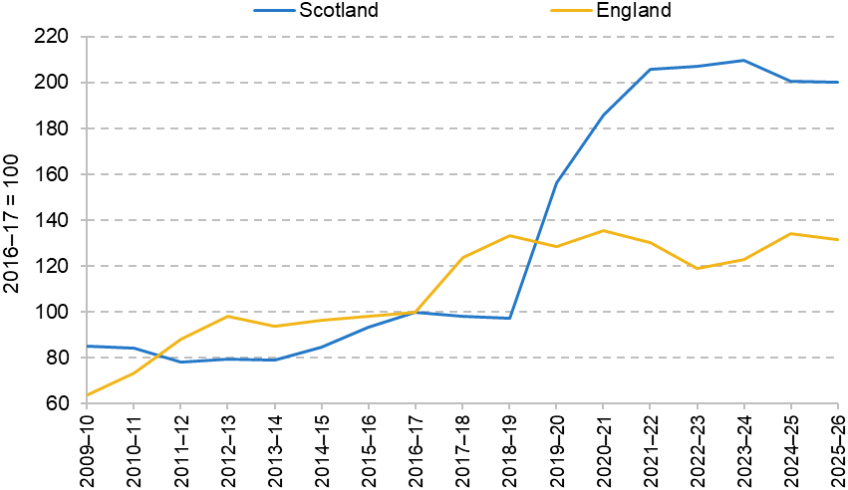
School spending per pupil
In Figure 8, we show the levels of school spending per pupil across Scotland, England and Wales. To ensure full comparability across the three nations, these figures also include early years expenditure on pupils aged 3–4 and school sixth form funding for pupils aged 16–18. All figures are shown as spending per full-time-equivalent pupil. Figures also include temporary, additional funding during and immediately after the COVID-19 pandemic to support schools and pupils with education recovery. All figures are shown in 2025–26 prices.
Figure 8. School spending per pupil aged 3–18 across Scotland, England and Wales (2025–26 prices)
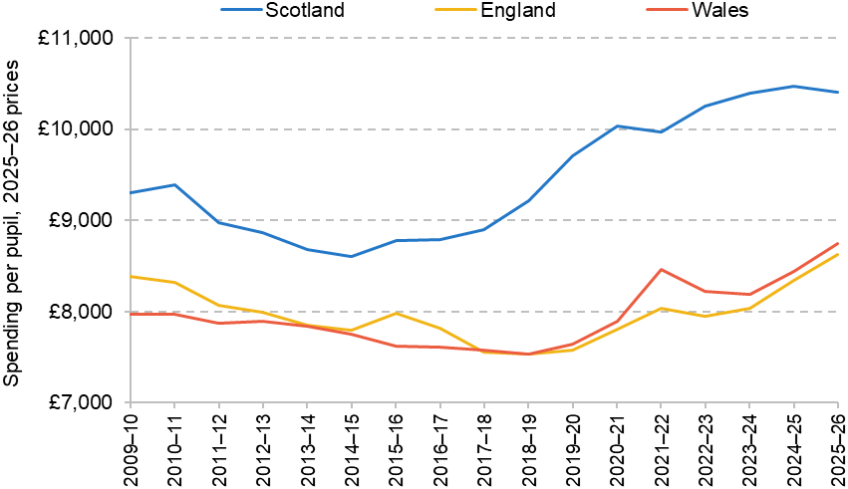
Source: Total school spending for Scotland is based on net revenue spending on early learning and childcare, schools and all education-related specific grants from central government. These figures were kindly supplied by the Scottish Government on a consistent basis from the underlying data for the Scottish ‘Local government finance statistics’ for 2009–10 to 2019–20 (https://www.gov.scot/collections/local-government-finance-statistics/). Figures for net revenue expenditure on schools and education specific grants for later years were taken from ‘Scottish local government finance statistics’ for 2020–21, 2021–22, 2022–23, 2023–24 and 2024–25. Net revenue expenditure on schools in 2025–26 is taken from https://www.gov.scot/publications/local-government-2024-25-provisional-outturn-and-2025-26-budget-estimates/. Ring-fenced specific grants for 2025–26 are based on https://www.gov.scot/publications/local-government-finance-circular-1-2025-settlement-for-2025-to-2026/. HM Treasury, GDP deflators, December 2025 update (https://www.gov.uk/government/statistics/gdp-deflators-at-market-prices-and-money-gdp-december-2025-quarterly-national-accounts). Full-time-equivalent pupil numbers in Scotland calculated as the sum of pupils in state-funded schools and early education centres (https://www.gov.scot/collections/school-education-statistics/). Spending per pupil in England is taken from Farquharson et al. (2026). For consistency with figures for Scotland, we include early years spending, grants to cover higher employer contributions to teachers’ pensions in England and COVID-related grants for 2020, 2021 and 2022. COVID-related spending for England is taken from https://www.gov.uk/government/publications/department-for-education-consolidated-annual-report-and-accounts-2021-to-2022 and school funding statistics for 2022–23 (https://explore-education-statistics.service.gov.uk/find-statistics/school-funding-statistics/2022-23). Spending for Wales is taken from education out-turn statistics (https://statswales.gov.wales/Catalogue/Local-Government/Finance/Revenue/Education) up to 2023–24 and from budgeted expenditure (https://www.gov.wales/local-authority-budgeted-expenditure-schools-april-2025-march-2026-html). For 2024–25, we also add grants of £60.7 million for teacher pensions (https://www.gov.wales/sites/default/files/publications/2024-10/1st-supplementary-budget-2024-2025-note.pdf) and £18.1 million for teacher pay (https://business.senedd.wales/documents/s156757/Paper%201%20-%20Welsh%20Government.pdf). Pupil numbers for Wales are taken from Welsh schools’ census results, 2025 and earlier years (https://www.gov.wales/schools-census-results).
School spending per pupil in Scotland has risen significantly over the last 15 years. In 2025–26, spending per pupil is expected to be £10,400 in Scotland, about 12% higher in real terms than in 2009–10, when it stood at around £9,300 per pupil. This exceeds the growth over time in both England (3%) and Wales (10%).
Spending per pupil in Scotland has long been higher than in England and Wales, but the rapid growth in spending over time in Scotland means that this gap has grown. Around 2010, school spending per pupil was about 12% or £1,000 higher in Scotland than in England. By 2025–26, school spending per pupil was 21% or £1,800 higher in Scotland than in England.
The growth in spending has not been even over time in Scotland. Between 2009–10 and 2016–17, school spending per pupil fell by 5% in real terms in Scotland, about the same as the fall in Wales (5%), but less than the fall in England (7%). This real-terms cut was more than reversed by a 10% real-terms rise in Scotland between 2016–17 and 2019–20, during which time spending per pupil either fell or stagnated in England and Wales. This higher growth in Scotland reflected large teacher pay awards (such as the 7% pay award in 2019) and extra funding for the expansion of early learning and childcare (discussed further below).
Since 2019–20, the growth in school spending per pupil has been lower in Scotland than in England and Wales. Between 2019–20 and 2025–26, school spending per pupil rose by 7% in real terms in Scotland, compared with 14% in England and Wales. However, about two-thirds of the growth in school funding in England can be explained by rapid growth since 2022–23. Over the last three years in Scotland, school spending per pupil has been largely constant in real terms. Furthermore, about half of the overall growth in school funding in England can be attributed to growth in funding for special educational needs and disabilities (SEND), which grew by 54% in real terms between 2019–20 and 2025–26. In Scotland, spending on additional support needs (ASN) – a broadly but not fully equivalent category – grew by 22% in real terms over the same period.
As shown in Figure 9, higher levels of school spending per pupil in Scotland are partly reflected in lower pupil:teacher ratios. As of 2024–25, the pupil:teacher ratio was 13.3 in Scotland, compared with 18 in England and nearly 19 in Wales. Whilst not a direct measure, this will likely equate into lower class sizes in Scotland. The differences between Scotland as compared with England and Wales have been relatively constant over the last 15 years, with a very slight rise in pupil:teacher ratios across all three nations.
Figure 9. Pupil:teacher ratios across Scotland, England and Wales
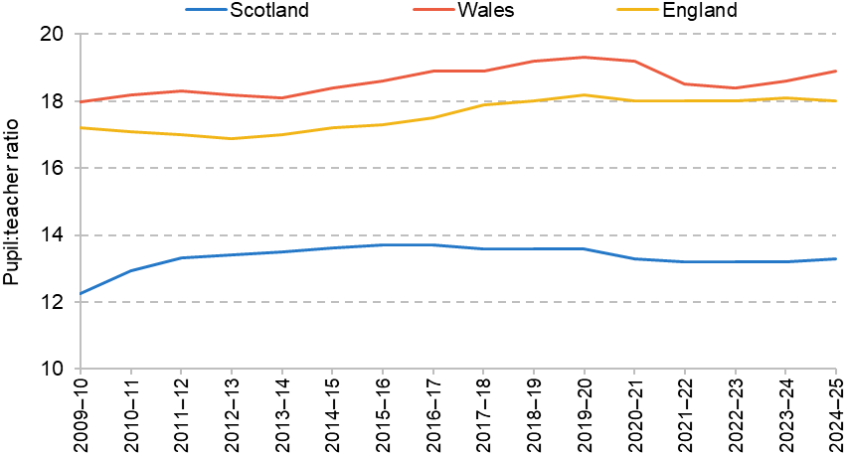
Source: Department for Education, education and training statistics for the UK, 2025 and 2016 (https://explore-education-statistics.service.gov.uk/find-statistics/education-and-training-statistics-for-the-uk/2025 and https://www.gov.uk/government/statistics/education-and-training-statistics-for-the-uk-2016). Figures relate to all publicly funded schools in each nation. For 2015–16 and earlier, figures are backcast based on trends for all schools.
These lower pupil:teacher ratios in Scotland can be seen since at least the 1990s (Sibieta and Jerrim, 2021). This could be a partial explanation for Scotland’s higher historical performance in international tests in maths, science and reading (see Section 3). However, it also makes Scotland’s declining educational performance over the last 15 years more surprising, and potentially less likely to be connected to resources and spending.
One driver of the higher growth in school spending per pupil over time in Scotland has been the rapid expansion of spending on early learning and childcare. To illustrate this, Figure 10 shows early years and pre-primary education spending across Scotland and England (it is not possible to show this for Wales given the way maintained nurseries in primary schools are funded). Figure are shown relative to 2016–17, just before expanded entitlements came into force across both nations.
Figure 10. Early years and pre-primary education in England (3- and 4-year-olds) and Scotland (2- to 4-year-olds) relative to 2016–17
Source: As for Figure 8.
In England, the universal entitlement to free early education and childcare for 3- and 4-year-olds stands at 15 hours per week during term time. In 2017, this was expanded to 30 hours for children with working parents. As a result, total spending on the early years for 3- and 4-year-olds rose by about one-third in real terms between 2016–17 and 2018–19, and has remained around that level through to 2025–26. From 2024, the entitlement was gradually expanded to cover children aged 9 months and over in working families. Spending on this expanded entitlement is not included in Figures 8 and 10.
In Scotland, the statutory entitlement to early learning and childcare for 3- and 4-year-olds expanded from 600 hours per year (or about 16 hours per week during term time) up to 1,140 hours per year (or about 30 hours per week during term time). In contrast to England, it covers all 3- and 4-year-olds (as well as some 2-year-olds). Partly as a result, spending has gone up much faster than in England. Spending actually began to rise rapidly after 2018–19 as local authorities gradually started to expand childcare offers in preparation for the change in statutory entitlement. Indeed, between 2016–17 and 2022–23, spending on early education and childcare doubled in real terms (from £540 million in 2016–17 to £1,090 million in 2022–23, all in 2025–26 prices).
3. How have public services performed?
The previous section showed that in virtually all areas of government, per-person spending is higher in Scotland than in England. In part, this reflects long-standing different patterns of need. For instance, the Scottish population is, on average, in worse health than the English population, so we would expect health spending per person to be higher in Scotland than in England. The population is also more sparsely populated, which might increase the cost of delivering some services and the transport infrastructure needed to link up communities. But part of the difference reflects policy choices, and decisions taken by the devolved administration over how those services should be organised and operated.
Differences in how services are operated and how performance is measured mean it is not feasible to do a comprehensive comparison of how things are faring in Scotland and the rest of the UK. But we can look at how performance has changed over time in Scotland and compare some headline figures with England and Wales. We do this for the NHS and the school and justice systems.
Health and NHS performance
The NHS is the largest single public service in Scotland. The Scottish Government has had many ambitions to improve NHS performance after the impacts of the COVID-19 pandemic, and to more broadly improve population health and well-being (e.g. Scottish Government, 2022, 2024 and 2025b). In this subsection, we first examine health outcomes in Scotland, with a particular focus on life expectancy. In doing so, it is important to note that many factors outside both the healthcare system and the wider public sector affect life expectancy and health, including living standards and conditions, and lifestyle choices and behaviours. We then look more specifically at the healthcare system, and examine recent trends in NHS staffing, activity, productivity and performance in Scotland. Throughout, we compare how health and NHS performance in Scotland compares with England and Wales. We do not consider social care in this report, though it is worth noting that there are substantial differences in how social care is funded and organised between Scotland, England and Wales.
Health outcomes
One important measure of health outcomes is life expectancy at birth. This takes into account mortality rates at all ages, and so is a comprehensive, if crude, measure of overall population health. Last year, the Scottish Government placed improving life expectancies at the centre of its Population Health Framework for 2025–35, after evidence suggested that life expectancy in Scotland ranks amongst the lowest in Western Europe (Scottish Government, 2025c).
Life expectancies have long varied significantly within the UK. Figure 11 shows that life expectancies in Scotland have consistently been lower than in England and Wales over the last 40 years, for both men and women. In the most recent years of data (2022–24), for example, women born in Scotland could expect to live for 81.0 years, compared with 82.2 years in Wales and 83.3 years in England.
Figure 11. Life expectancy at birth in England, Scotland and Wales, 1980–82 to 2022–24

Note: Life tables are calculated on a rolling three-year basis. Values presented here use the midpoint year of each life table to present life expectancies over time.
Source: Office for National Statistics, 2025b.
Life expectancies increased at a steady rate in Scotland between the 1980s and the start of the 2010s. This was at a similar rate to those in England and Wales, leaving differences in life expectancy between the nations relatively similar over time. However, all three nations have seen little change to life expectancies since the early 2010s. Some evidence suggests that ‘healthy life expectancy’ – the number of years people are estimated to spend in good health – has even fallen during this period, with Scotland again ranking below other countries in the UK on this measure (National Records of Scotland, 2025).
Some of these differences can be explained by variation in wider living standards across the UK. Figure 12 shows the average life expectancy and median income in each parliamentary constituency in England, Scotland and Wales in 2023. It illustrates the extent of variation in life expectancy across areas in Scotland. Constituencies in Glasgow have some of the lowest life expectancies in Great Britain. Glasgow North East, for example, has a life expectancy at birth of 74.2, while Glasgow North has a life expectancy of 75.9. At the other end in Scotland are areas such as East Renfrewshire and West Aberdeenshire & Kincardine, which have life expectancy of 83.5 and 82.7 years, respectively.
Figure 12. Life expectancy and median income in England, Scotland and Wales, 2023

Note: Each point represents a parliamentary constituency. Median income is median taxable income, including income from employment, pensions and profits, but not (for example) some benefit income. Lines represent nation-specific ordinary least squares regressions.
Source: HMRC, 2024; Office for National Statistics, 2025b.
The figure suggests that two factors are driving Scotland’s lower average life expectancy than those in England and Wales. First, across Great Britain, areas with lower income tend to have lower life expectancy. Areas in Scotland on average have lower income than areas in England, which therefore partly explains their lower life expectancy. This is also true for Wales, where average income is also lower than in England.
Second, for areas with the same median income, areas in Scotland tend to have lower life expectancy than areas in either England or Wales (the blue line lies below the yellow and red lines). At the extremes, for example, Glasgow North and Outer York have very similar median incomes, at around £29,000 per year, but life expectancies are around 8 years longer in Outer York (83.5 years) than in Glasgow North (75.9 years). Conversely, there is no such gap between England and Wales (the yellow and red lines are very similar).
Moreover, the relationship between median incomes and life expectancy (the blue line) is also steeper in Scotland than in England or Wales. This means that differences in income are more strongly associated with gaps in life expectancies in Scotland than elsewhere in Great Britain, suggesting there are wider health inequalities by average income across areas.
Life expectancy is therefore worse in Scotland than in England and Wales, and there is also some suggestive evidence of wider inequalities by income across areas. The Scottish Government aims both to increase overall life expectancy in Scotland over time and to reduce these inequalities between places. In particular, it has set the target to reduce the gap in life expectancy between the most deprived 20% of local areas and the national average by 2035 (Scottish Government, 2025d).
There are many other measures of health outcomes, such as quality of life. Healthy life expectancy measures the number of years people are expected to spend in good health. Data for 2022–24 suggest that male healthy life expectancy is lower in Scotland than in England and similar to that in Wales. Female healthy life expectancy is also lower in Scotland than in England, but somewhat higher than in Wales (Office for National Statistics, 2026). At the 2022 Scottish Census, 6.8% of respondents reported ‘bad’ or ‘very bad’ health, compared with 5.4% in comparable figures for England and Wales (Scotland’s Census, 2025). Wider risk factors, such as smoking and obesity rates, tend to be slightly higher in Scotland than in the rest of Great Britain (Health Foundation, 2025). There is evidence that alcohol-related and drug-related deaths are higher in Scotland than in England and Wales (Walsh et al., 2021) and that Glasgow sees higher excess mortality than similar post-industrial English cities, particularly for men (Schofield et al., 2021). Recent survey evidence, however, suggests self-reported well-being may be higher in Scotland (Carnegie UK, 2025).
Taken together, these findings suggest that health outcomes are broadly worse in Scotland than elsewhere in Great Britain, in ways not fully explained by wider differences in incomes and living standards. Many of these differences are long-standing – life expectancies have been consistently lower in Scotland since before devolution, for example. These differences are also likely driven by many factors, not all of which are directly in the reach of public policy.
NHS performance
We next examine how the NHS is performing in Scotland. Waiting times for treatment have shot up since the start of the COVID-19 pandemic across the UK, and the Scottish Government – like those in England and Wales – has put a major emphasis on reducing waiting times. We therefore start by examining how waiting times have changed in Scotland and how they compare with those in England and Wales. Waiting times are an important measure of how well each NHS is performing, capturing how easy it is for patients to access the care they need. Importantly, though, they do not directly measure the quality of care that is provided.
Figure 13 shows one measure of waiting times for pre-planned (elective) NHS activity in Scotland: the share of patients who are waiting more than a year for treatment since being referred. Prior to the start of the pandemic, very few patients waited more than a year for treatment in Scotland – in December 2019, 1.0% of patients were waiting more than a year. This shot up during the pandemic, before falling in 2021, rising between 2022 and 2024 and then starting to fall in 2025.7 But in the latest data, for December 2025, 9.3% of patients were still waiting more than a year – more than nine times higher than pre-pandemic. Since the total waiting list for treatment is also much higher than pre-pandemic, the total number of people waiting more than a year is even higher.
Figure 13. Share of patients waiting over a year from referral for elective treatment in Scotland

Note: Data are for waiting for a first outpatient appointment or for admission for treatment as an inpatient or day case after referral.
Source: Public Health Scotland, 2026a.
While there has been some recent improvement in these waiting times, this has been much slower than the Scottish Government planned. In July 2022, for example, it set out a plan to eliminate waits longer than a year by March 2023 for outpatient appointments for most specialties, and by September 2024 for inpatient activity for most specialties (Scottish Government, 2022). These goals are far from having been achieved. The latest Scottish Government plan aims to eliminate waits longer than a year for new outpatient appointments and hospital treatment by March 2026 (Scottish Government, 2025e).
Figure 14 shows performance elsewhere in the UK, with the yellow line showing the share of patients waiting more than a year for pre-planned activity in England, and the red line showing the share for Wales. It is difficult to directly compare pre-planned waiting times in Scotland with those in England and Wales because of differences in measurement and organisation.8 Direct comparisons in the share of patients waiting more than a year should therefore be made cautiously, though the trend in each country is still informative.
Figure 14. Share of patients waiting over a year from referral for elective treatment in England and Wales
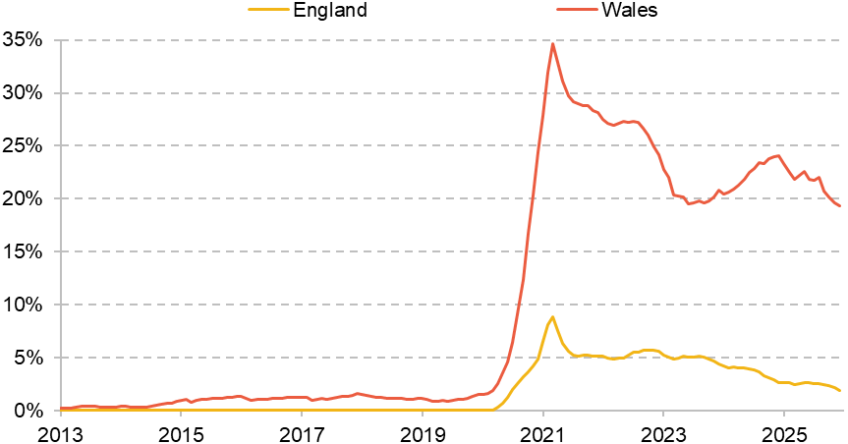
Note: Figures in England and Wales are for waiting for a completed elective pathway (which may end with an inpatient admission or outpatient appointment) after referral.
Source: StatsWales, 2026a; NHS England, 2026a.
The figures show that elective waiting times in the Scottish NHS have followed a similar pattern to that in Wales and England – a large increase in long elective waits since the start of the pandemic. England, however, appears to have had a much smaller spike in long waits, and has managed to consistently reduce the number waiting more than a year – with the share waiting more than a year standing at 1.9% in December 2025. Wales had a much larger spike during the pandemic than England, and has made much more limited progress than either England or Scotland – the share waiting more than a year stood at 19.3% in December 2025. Both the English and Welsh governments also set targets to eliminate waits of more than a year and, as in Scotland, these targets have already been missed (although England has made most progress towards the goal).
Figure 15 repeats this analysis with a key measure of waiting times for emergency care – the share of patients waiting less than four hours to be treated in major A&E departments. Pre-pandemic, Scotland had substantially better performance than either England or Wales, with 83.5% of patients waiting less than four hours in A&E in December 2019, compared with 68.6% in England and 65.3% in Wales. While performance has worsened in all three countries since the start of the pandemic, it remains the best in Scotland, with 62.9% waiting less than four hours in December 2025, the latest data we have for all three countries, compared with 59.6% in England and 52.7% in Wales.
Figure 15. Share of patients waiting less than four hours to be admitted, transferred or discharged in major A&E departments

Note: Only includes ‘type 1’ A&E departments (England), ‘major’ A&E departments (Wales) and Emergency Departments (Scotland), as recommended for comparability by the Office for National Statistics (2024c).
Source: StatsWales, 2026b; NHS England, 2026b; Public Health Scotland, 2026b.
A&E performance in Scotland is therefore poor relative to pre-pandemic performance, and poor relative to the target that 95% should be seen within four hours. But A&Es are still performing better in Scotland than in either England or Wales.
Here we have only focused on two key measures of waiting times, but the Scottish Government has further targets for other areas such as cancer and mental health services. In its recent analysis of NHS performance in Scotland, Audit Scotland reported that the Scottish NHS was only meeting three of the eight key waiting times standards and that performance against five of the targets had got worse between June 2024 and June 2025 (Audit Scotland, 2025).
Taken together, elective waiting time performance has improved recently. But waiting times are consistently worse in Scotland than pre-pandemic and often far below the Scottish Government’s targets for recovery. That is also true in England and Wales. Waits in A&E departments in Scotland – an area that is easier to compare – are shorter than in both England and Wales.
NHS hospital activity and staffing
We next turn to examine hospital activity, i.e. the number of patients receiving treatment in NHS hospitals in Scotland. Panel a of Figure 16 shows hospital activity in Scotland over time relative to the level in July to September 2019. Hospital activity fell at the beginning of the pandemic, and then has gradually increased over time. What is striking, however, is that hospital activity in Scotland has never once reached or exceeded its pre-pandemic level. More than five years after the start of the pandemic, hospitals in Scotland are still treating fewer patients than pre-pandemic. In the latest available data, for July to September 2025, hospitals delivered 4% fewer hospital admissions (emergency and pre-planned) and 5% fewer outpatient appointments than in July to September 2019. Some areas of hospital activity have seen increases above pre-pandemic levels, such as the number of day-case hospital admissions (3% above pre-pandemic levels). But given total hospital activity is below pre-pandemic levels, other areas of hospital admissions are correspondingly even further below pre-pandemic levels.
Figure 16. Changes to hospital activity, relative to 2019 Q3
a. Scotland
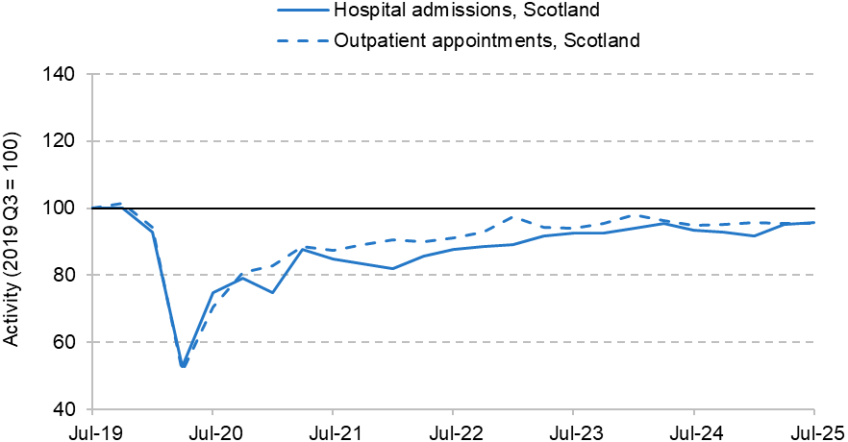
b. England and Wales
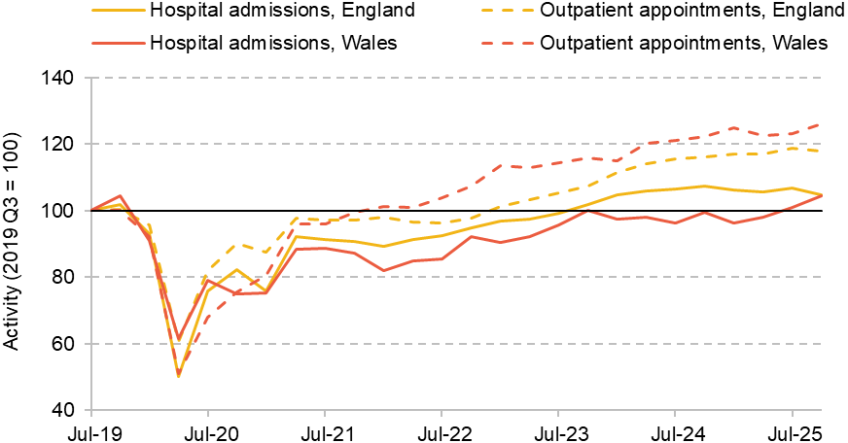
Note: ‘Hospital admissions’ includes both emergency and elective admissions.
Source: Digital Health and Care Wales, 2026; NHS England, 2026c; Public Health Scotland, 2026c.
This persistent fall in hospital activity has taken place despite an aim of increasing activity. In its 2021 NHS Recovery Plan, the Scottish Government set out plans to increase elective hospital activity by 20% above pre-pandemic levels by 2025–26 (Scottish Government, 2021). It also set out plans to increase outpatient activity. It is true that the Scottish Government also intended to remove the need for some outpatient activity through redesigning care pathways. For example, it aimed to free up 210,000 ‘unnecessary’ outpatient appointments in 2024–25 (Scottish Government, 2024). Nonetheless, the Scottish Government still planned to increase the total number of outpatient appointments delivered above pre-pandemic levels, which has not occurred. More recently, the Scottish Government has set out plans to deliver more than 150,000 extra appointments and procedures in 2025–26 relative to 2024–25 (Scottish Government, 2025e). While increases in hospital activity are not always unambiguously good, higher hospital activity would have likely helped reduce waiting times for pre-planned care in Scotland.
Panel b of Figure 16 shows that England and Wales have both done much better at increasing hospital activity above pre-pandemic levels. In July to September 2025, England delivered 6.7% more hospital admissions and 18.9% more outpatient appointments than in July to September 2019, while Wales delivered 0.9% and 23.1% more respectively. Both countries also have plans to reduce ‘unnecessary’ outpatient appointments, as in Scotland, but have still managed to increase hospital activity above pre-pandemic levels.
What explains the worse performance of hospital activity in Scotland? As discussed in Section 2, health spending in Scotland has increased substantially in real terms since the start of the pandemic. We would therefore expect hospitals to be delivering more activity. Figure 17 shows how NHS staffing in Scotland has changed, as well as hospital activity. Since the start of the pandemic, Scotland has substantially increased NHS staffing: in April to September 2025, the Scottish NHS had on average 14% more staff than in the same period in 2019.
Figure 17. Changes to staffing and hospital activity, April to September 2025 versus April to September 2019

Note: ‘Hospital admissions’ includes both emergency and elective admissions. ‘Total staff’ includes both staff working in hospitals and staff working in the community sector.
Source: StatsWales, 2026c; Digital Health and Care Wales, 2026; NHS England, 2026c and 2026d; Public Health Scotland, 2026c; TURAS Data Intelligence, 2025.
The NHS in Scotland therefore has more staff and more money than pre-pandemic. But as the remaining bars of Figure 17 show, hospitals are still treating fewer patients than pre-pandemic. This raises the possibility that labour productivity – the number of patients each staff member can treat – has fallen substantially in the Scottish NHS, something we turn to shortly.
Figure 17 also shows changes to staffing and hospital activity in England and Wales. Both countries have increased their NHS staffing by much more than Scotland – by 25% in England and 24% in Wales. This is likely one reason why hospital activity has increased by more than in Scotland. Nonetheless, as in Scotland, this increase in staffing in England and Wales has not been matched by a commensurate increase in hospital activity, suggesting there may have been a fall in labour productivity in all three healthcare systems since the start of the pandemic.
This analysis is simple, and does not take into account any change in the mix of activity that hospitals are providing, any change in the severity of patients’ conditions or differences in growth rates of different staff groups. Scotland – like Wales, but unlike England – lacks detailed estimates and analysis of NHS productivity. That makes it difficult to precisely characterise how healthcare productivity has changed in Scotland. But given the increases in staffing and funding, combined with hospital activity remaining below pre-pandemic levels, it is very likely that hospital productivity remains lower than pre-pandemic. Indeed, this simple analysis for England matches the qualitative pattern of more advanced analysis, which also finds hospital productivity is lower than pre-pandemic (e.g. NHS England, 2024 and 2026e).
Perhaps in response to these productivity challenges, the Scottish Government has made improvements to NHS productivity a key focus of its recent Budget. As recently discussed by Boileau, Brogaard and Phillips (2026), the Scottish Government has set out plans to make 3% efficiency savings per year from health boards between 2025–26 and 2028–29. These are much larger than recent savings of 1.3% in 2023–24 and 2.2% in 2024–25 (Audit Scotland, 2025). Improving hospital productivity will be one way to deliver these efficiency savings, but they may also be delivered by further holding back growth in hospital activity.
Conclusion
In common with the rest of the UK, performance in the Scottish NHS remains worse than pre-pandemic. There has been some recent improvement in elective waiting times, yet many performance measures have improved far more slowly than anticipated, and almost all targets set out in recovery plans have been missed. Other nations in the UK have faced similar challenges, and Scotland has better A&E performance than either England or Wales. But Scotland – uniquely – has still not recovered its levels of hospital activity to pre-pandemic levels, despite sustained increases in funding and staffing (albeit somewhat smaller than in England and Wales).
School performance
Even before devolution, Scotland has long had a different education system from the rest of the UK, including a slightly later school-starting age (children start school aged 4½–5½ in Scotland as compared with aged 4–5 in England and Wales) and different exams at the end of school (currently National 4/5s at ages 15–16 and Highers and Advanced Highers at ages 16–18). Since devolution, school policies and institutions have gradually further diverged across the UK (Sibieta and Jerrim, 2021).
In both Scotland and Wales, councils continue to play a significant role in school funding and spending. This contrasts with England, where schools (particularly academies) have more autonomy.
In 2010, Scotland also adopted the ‘Curriculum for Excellence’, which emphasises cross-cutting areas of learning and gives significant discretion to schools and teachers to shape the precise curriculum. Policymakers in Wales and Northern Ireland have taken a similar approach. In contrast, schools in England must follow the National Curriculum, which has maintained traditional subjects and provides specific guidance on the minimum amount of material expected to be covered at each stage.
Given the differences in the education systems and standardised testing regimes, it is difficult to compare educational performance across the nations. We therefore use data from the Programme for International Student Assessment (PISA), which provide a useful tool for comparing educational performance across countries. PISA assesses a broadly representative selection of 15-year-old pupils across a wide range of countries on a range of areas including maths, science and reading ability. It aims to test students on what they should be expected to know at their age.
Figure 18 shows that PISA scores suggest that educational performance in Scotland has declined over time. In the 2000s, overall scores in Scotland were relatively high and above the average across OECD countries. Since around 2012, there has been a significant decline in PISA scores. While Scotland generally outperformed England and Wales on PISA scores over the 2000s, the steady decline since 2012 means Scotland now scores below England (but still above Wales). This trend of declining performance in Scotland relative to England is seen in both the maths and science domains of PISA scores, although performance has remained much more stable for reading.
Figure 18. Average PISA performance by nation

Note: Average is from authors’ calculations based on subject score in maths, reading and science.
Source: Programme for International Student Assessment, 2022.
PISA scores provide the most consistent measures of skills across time and nations over time. However, it is also instructive to examine the qualifications of Scottish school leavers over time (see Figure 19). Following a rise in the qualification levels of school leavers up to 2014–15, we see a broad picture of no significant net change in the qualifications of school leavers over the last decade (with the exception of changes during the pandemic). The share of school leavers with National 5 qualifications (broadly equivalent to GCSEs in the rest of the UK) has risen very slightly over the last decade, from 25% of school leavers in 2014–15 to 26% in 2024–25. However, the share with lower-level qualifications (below National 5) has also risen, from 15% in 2014–15 to 16% in 2024–25. Looking at higher qualification levels, the share of school leavers with Highers (broadly equivalent to A levels) has fallen from 41% in 2014–15 to 39% in 2024–25. However, the share with Advanced Highers has risen from 19% to 20% over the same period. As a result, we see slightly higher levels of low performance and very high performance, with slightly lower levels in the middle of the distribution.
Figure 19. Percentage of school leavers in Scotland with different qualification levels over time
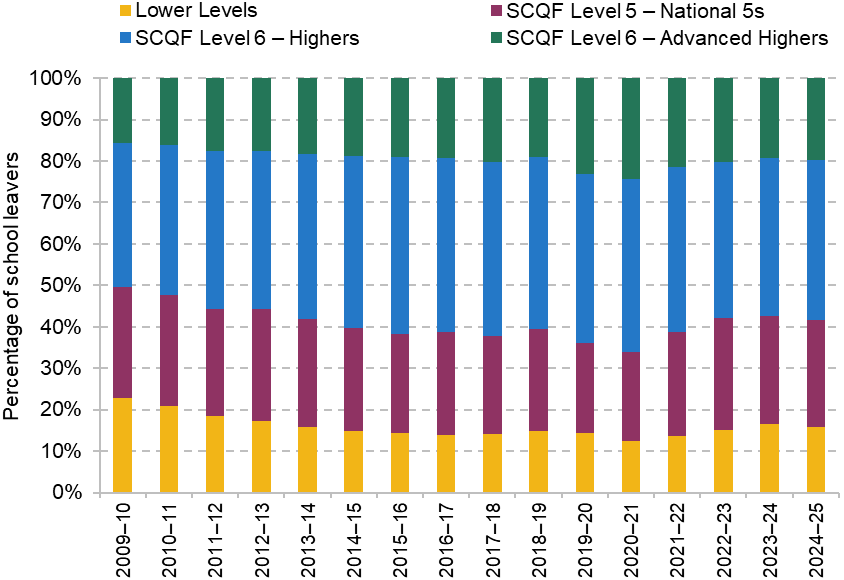
Source: Scottish Government, 2026a.
There is also interest in how pupils from different socio-economic statuses perform within each nation. Figure 20 shows the average PISA score by quintiles of PISA’s index of economic, social and cultural status (ESCS). Importantly, these quintiles are constructed within each nation rather than for the UK as a whole, and so each quintile does not represent pupils of the same socio-economic status for each nation. For 2022, we can see that the socio-economic gradient for Scotland was marginally steeper than that of England, consistent with slightly greater inequality in educational performance in Scotland. This is a change from the last set of PISA results in 2018 where socio-economic gradients were more similar between the two nations (Lester, McKendrick and Sibieta, 2023). This gradient was also steeper for Scotland in 2022 than in previous years (although scores and quintiles are not perfectly comparable across years), perhaps representing a slight increase in educational inequality up to 2022. This contrasts with official Scottish statistics, which suggest a slight narrowing of inequalities over time (Scottish Government, 2025f). As PISA is based on an individual-level measure of socio-economic status, it may be a more reliable measure than the neighbourhood-level measures used in official Scottish statistics (Paterson, 2025).
Figure 20. Average PISA score by socio-economic quintile and nation, 2022

Note: Average is from authors’ calculations based on subject score in maths, reading and science.
Source: Programme for International Student Assessment, 2022.
School attendance
England, Scotland and Wales have all faced similar challenges around a rise in pupil absence since the COVID-19 pandemic. Figure 21 shows the overall pupil absence rate (percentage of half-day sessions missed) for each nation over time. Prior to 2020, all three nations saw generally stable absence rates, with absences consistently higher in Scotland and Wales than in England. Since the full return to in-person schooling following the pandemic, all three nations have seen significantly higher levels of pupil absence: pupils now miss an average of 9% of sessions in Scotland, relative to around 7% pre-pandemic. More recent years have seen a decline from the peak around 2023, but so far this decline has been slow and largely due to falling rates of authorised absences while rates of unauthorised absence remain stable at around double pre-pandemic rates.
Figure 21. Average share of overall sessions absent
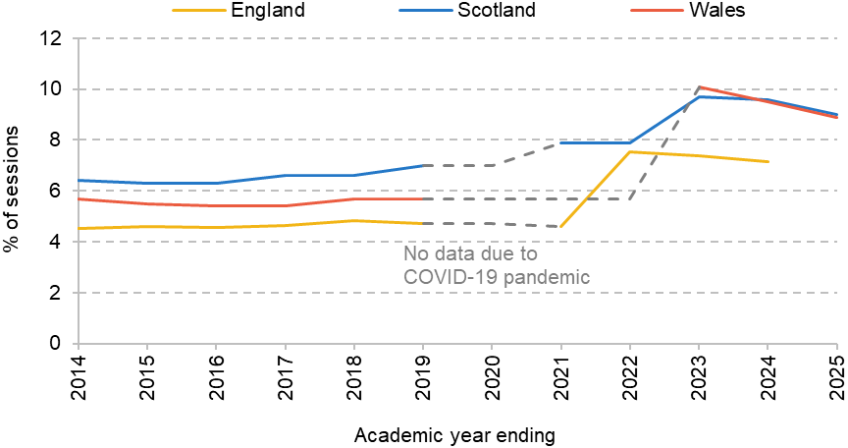
Note: ‘Sessions’ refers to half-days of school. Welsh absences exclude data from the late May bank holiday for secondary school pupils each year and so are not perfectly comparable.
Source: Scottish Government, 2026b; StatsWales, 2025; Department for Education, 2025a.
Rates of persistent absence (the share of pupils who miss at least 10% of sessions) have also risen significantly in both England and Scotland since the pandemic. In 2024–25, 28.5% of pupils in Scotland were persistently absent compared with 21.8% in 2018–19; England saw a similarly large increase: 20.0% were persistently absent in 2023–24, compared with 10.9% in 2018–19.
Part of the difference between Scotland and England is likely due to different rates of exclusion in the two systems. Temporary exclusions from school are much less common in Scotland (15.2 exclusions per 1,000 pupils in 2024–25) than in England (114.4 per 1,000 pupils in 2023–24), and it is plausible that many excluded pupils in England would otherwise have high absence rates (Scottish Government, 2025g; Department for Education, 2025c). However, even regardless of the exact comparison, these absence statistics still present a worrying trend: the roughly 9% of sessions pupils were absent for in Scotland and Wales in 2024–25 translate into about 17 lost days of schooling per pupil. This likely has a meaningful impact on academic attainment, with estimates suggesting that 10 days of absence can reduce attainment by between 0.03 and 0.06 standard deviations (Aucejo and Romano, 2016), with some estimates much higher (Goodman, 2014). Absence rates are also higher for pupils from more deprived backgrounds, and thus contribute to inequality in attainment across socio-economic groups (Scottish Government, 2025g).
Roughly 40% of Scotland’s increase in absences between 2018–19 and 2024–25 can be attributed to higher levels of absence due to sickness. Other significant components of the increase include a rise in unauthorised holidays and a rise in truancy. This mirrors the trends in England, where the majority of the increase in absences has been due to a rise in illness and unexplained unauthorised absences. Part of this may be due to changes in parental attitudes around school attendance as well as a rise in mental health problems and anxiety around attending school (Burtonshaw and Dorrell, 2023).
Additional support needs
Scotland has seen a dramatic rise in the number of pupils who are recorded as having additional support needs (ASN): the share of pupils with ASN has steadily risen from 10.3% in 2010 to 30.9% in 2019 and 43.0% in 2025 (Scottish Government, 2025h). The most common reasons for needing additional support in 2025 were ‘social, emotional and behavioural difficulty’ (11.1% of pupils), English as an additional language (8.8%) and autistic spectrum disorder (5.9%). This is similar to trends that have been seen in England, where the share of pupils with special educational needs (SEND) has risen steeply from 14.4% of pupils in 2016 to 19.5% in 2025.9 However, the picture in Scotland differs from that in England in a few crucial ways.
First, the levels of identified need are significantly different, with the share of pupils registered as having ASN in Scotland more than double the share with SEND in England, as outlined above. Some of this reflects differences in categorisation; a pupil who has English as an additional language does not qualify as having SEND but they do qualify for ASN, for example. However, there is still significant overlap in the type of needs that make up each form of support, and the levels for a given type of need in Scotland are, in general, reported to be higher. For instance, while 5.9% of pupils have autism as a recorded reason for ASN in Scotland, only 3.8% have autism as a recognised SEND need in England. Similarly, 11.1% of Scottish pupils are recognised as having emotional, social and behavioural problems, whereas the comparable figure in England is 5.2% (Department for Education, 2025b). The actual underlying needs are unlikely to differ so significantly, and in general this picture suggests that Scotland takes a different and more expansive approach to identifying pupil needs.
Second, the type of support that pupils with identified needs receive also differs between the two nations. England has seen a particularly steep rise in the most specialist form of support, ‘Education, Health and Care Plans’ (EHCPs) which set out the specific support that pupils are legally entitled to receive. The share of pupils with EHCPs in England has risen from a historical average of just under 3% to 5.3% in 2025, which has led to a significant rise in the amount spent on SEND, putting pressure on school and council budgets. By contrast, although Scotland has a similar form of support in ‘Co-ordinated Support Plans’ (CSPs), which also guarantee pupils with the most complex needs legally binding support, the share of pupils who receive CSPs is tiny (0.2% in 2025) and has been declining over time (Scottish Government, 2025h). This again reflects the more inclusive approach Scotland takes to pupils with ASN, as pupils are more likely to be placed in mainstream schools and support is primarily determined by the school. As a result, although spending on additional support for learning has increased in Scotland, the spending pressure in this area is generally less intense than in England (see Section 2). Indeed, partly as a result of spending pressures, the UK government plans to reform the English SEND system to adopt more inclusive support with lower rates of extremely specialist provision, as is currently the case in Scotland.
Conclusion
Schools in Scotland face a range of challenges, from a rising share of pupils recorded as having additional support needs to significantly higher rates of pupil absence following the COVID-19 pandemic. However, these challenges are not unique to Scotland, and with lower pupil:teacher ratios and higher spending per pupil, it should be in relatively good shape to meet them. Despite this, Scotland’s performance in international PISA tests has been declining relative to England, and rates of absence remain persistently high. This should prompt cause for concern about Scottish educational performance. Given relatively high (and increased) spending per pupil and low pupil:teacher ratios, it is likely that these declines in performance have been driven by wider aspects of the system, such as changes to the curriculum, assessment and accountability.
Policing and justice
Policing and crime
Measuring policing performance presents challenges. Both recorded crime and crime clearance rates depend on reporting behaviour and administrative practices, which can change over time and differ between jurisdictions. For this reason, we draw on two more comparable indicators that capture related inputs and broader outcomes. First, we consider the number of full-time-equivalent police officers per 1,000 inhabitants. Second, we use victimisation rates reported in household surveys as a measure of crime prevalence that is less dependent on reporting to the police. While neither indicator provides a direct measure of policing performance, they are important and comparable indicators of both a key input (police numbers) and a key issue (crime prevalence) that policing (and the wider justice system) is designed to address.
It is also important to emphasise that changes in crime prevalence are shaped by a wide set of social, economic and demographic factors beyond the direct control of the police, justice system or indeed the wider public sector. In addition, the police and justice systems, while aimed in part at discouraging crime, focus on tackling the consequences of crime: higher staffing numbers can be a response to higher crime, as much as they can help reduce crime. Our analysis should therefore be interpreted as a high-level analysis of relevant inputs and outcomes rather than a detailed analysis of short-term policing performance.
Bearing this in mind, we first look at police staffing. Figure 22 shows the number of full-time-equivalent (FTE) police officers per 1,000 inhabitants in Scotland and in England and Wales since 2007.
Figure 22. Full-time-equivalent police officers per 1,000 inhabitants

Source: Scottish Government Justice Analytical Services, 2026a; Home Office, 2025.
Scotland has had a higher number of officers per person than England and Wales over at least the last 20 years, but the trends differ over time. In England and Wales, officer numbers fell substantially during the 2010s, reaching a low point in the late 2010s before rising again in the early 2020s. By contrast, staffing levels in Scotland were comparatively stable through much of the 2010s, followed by a more gradual decline in recent years. This has left the difference in FTE police per 1,000 residents (2.96 in Scotland versus 2.38 in England and Wales) the smallest since the late 2000s – although still not insubstantial (a near 25% difference).
To complement this input measure of policing capacity, we next consider trends in crime prevalence. Specifically, we rely on victimisation surveys rather than police-recorded crime statistics. Victimisation surveys provide a particularly valuable basis for comparison across jurisdictions because they measure crime as experienced by individuals, including incidents that may never be reported to the police. This helps reduce the influence of differences in legal definitions, reporting behaviour and recording practices, which can make police data less directly comparable across nations.
In Scotland, this role is played by the Scottish Crime and Justice Survey (SCJS), while England and Wales use the Crime Survey for England and Wales (CSEW). While the two surveys are closely aligned in purpose, they differ slightly in coverage and frequency: for example, Scotland incorporated fraud and computer misuse later than England and Wales (and for that reason it is not included in our main analysis); and even outside the COVID-19 pandemic, the SCJS has not always been conducted annually. These factors mean that the surveys are most informative for comparing broad trends and patterns over time, while cross-national comparisons should be interpreted with appropriate care. In addition, differences between jurisdictions in any single survey wave may fall within sampling margins of error, and should therefore be interpreted cautiously unless sustained over time.
Looking at trends over time (excluding fraud and computer misuse for consistent comparison over time), Figure 23 shows for both surveys a clear and sustained decline in victimisation. In 2008–09, around 20–25% of people reported being victims of crime (20.4% in Scotland and 23.3% in England and Wales), and by 2023–24 this had fallen to roughly 10–12% (12.1% in Scotland and 10.1% in England and Wales).10
Figure 23. Victimisation rates for Scotland (SCJS) and England and Wales (CSEW), average rates

Note: SCJS is the Scottish Crime and Justice Survey. CSEW is the Crime Survey for England and Wales.
Source: Scottish Government, 2025i; Office for National Statistics, 2024d.
This means victimisation rates have substantially decreased over the past 15 years. For most of the time series, rates were, if anything, slightly lower in Scotland than in England and Wales, although the most recent wave (2023–24) shows the reverse pattern. However, this difference is small overall and based on a single year of data. The next set of SCJS statistics published later this year (covering 2024–25) will provide important information on whether the 2023–24 wave is a ‘one-off’ or the new normal.
Bearing this caveat in mind, we compare victimisation rates in Scotland and in England and Wales in 2023–24 (the most recent survey wave that coincides for both jurisdictions) by demographic group.11 This cross-sectional approach is important because the composition of Scotland’s population differs from that of England and Wales, and comparing like-for-like groups provides a clearer picture of where differences are most pronounced.
The comparable breakdowns, presented in Figure 24, suggest that victimisation rates were higher in Scotland across the reported groups in 2023–24, though the magnitude of the gap varies. The largest difference is observed among young people aged 16–24, who report substantially higher victimisation in Scotland than in England and Wales (20.3% versus 13.9%), while the second-largest difference appears among individuals reporting having disabilities. These are two very important groups, as they are usually more vulnerable populations.
Figure 24. Victimisation rates for Scotland (SCJS) and for England and Wales (CSEW), 2023–24, by personal characteristics
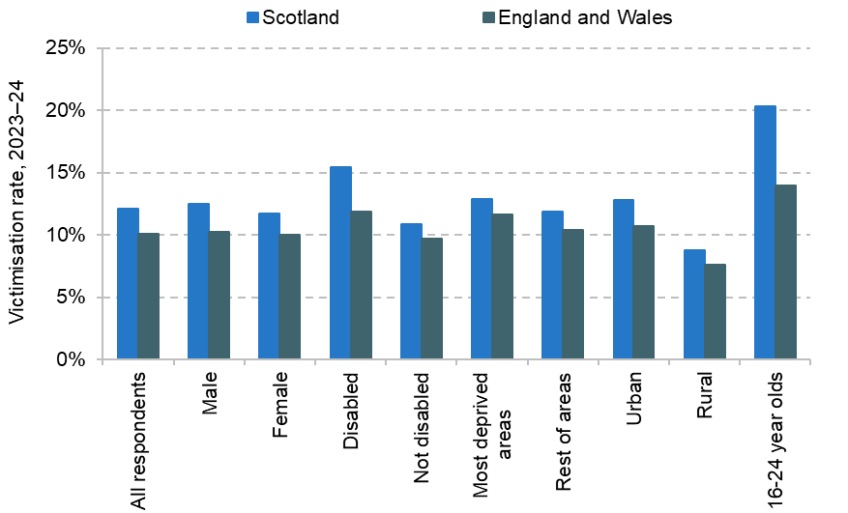
Source: Scottish Government, 2025i; Office for National Statistics, 2024d.
It is worth noting that the victimisation gap between Scotland and England & Wales for those aged 16–24 was not present, for example, in 2019–20 when overall victimisation was lower in Scotland (it was 18.3% in both surveys). And as with all single-wave comparisons, these differences should be interpreted with caution given sampling variation and differences in survey timing. Differences between jurisdictions in reported victimisation rates for other population breakdowns, such as between rural and urban areas, are not so large.
Criminal courts system
Comparing court open caseload (or ‘backlog’) measures across Scotland and England & Wales requires particular care, because court structures and reporting metrics are not directly identical. In Scotland, serious jury cases are divided between the High Court of Justiciary and the Sheriff Court sitting in Solemn Procedure, and the backlog is more commonly presented in terms of the number of scheduled trials outstanding across these courts. In England and Wales, the main jury-trial court is the Crown Court, and the backlog is typically reported as the number of outstanding cases within the Crown Court caseload. For this reason, the closest like-for-like comparison is between the combined High Court plus Sheriff Solemn trial backlog in Scotland and the Crown Court cases awaiting trial in England and Wales, rather than relying on single headline figures that capture different stages of the court system. Among the indicators examined in this subsection, court backlog and duration provide the closest approximation to system performance, as they directly reflect the relationship between case inflow and case completion capacity.
Absolute backlog figures, or backlogs expressed per person, are not directly comparable across Scotland and England & Wales because the two systems differ in structure, case allocation and charging practices. The number of cases entering the jury-trial courts depends not only on population size but also on prosecutorial discretion, diversion policies and the threshold for allocating cases to Solemn or Crown Court procedure. In addition, the volume and complexity of cases handled at each tier differ between jurisdictions. As a result, headline backlog levels per person risk conflating structural design and upstream policy choices with court performance. For this reason, we focus on changes over time within each system rather than absolute or per-person comparisons across them, and provide indexed measures to a common baseline (2019 Q4).12 This approach provides a clearer view of how pressures have changed within each system relative to pre-pandemic conditions.
The indexed trends in Figure 25 show that the two systems evolved in broadly similar ways prior to the COVID-19 pandemic, but diverged sharply in the aftermath of the pandemic.
Figure 25. Outstanding caseload (‘backlog’) for Scotland and for England and Wales
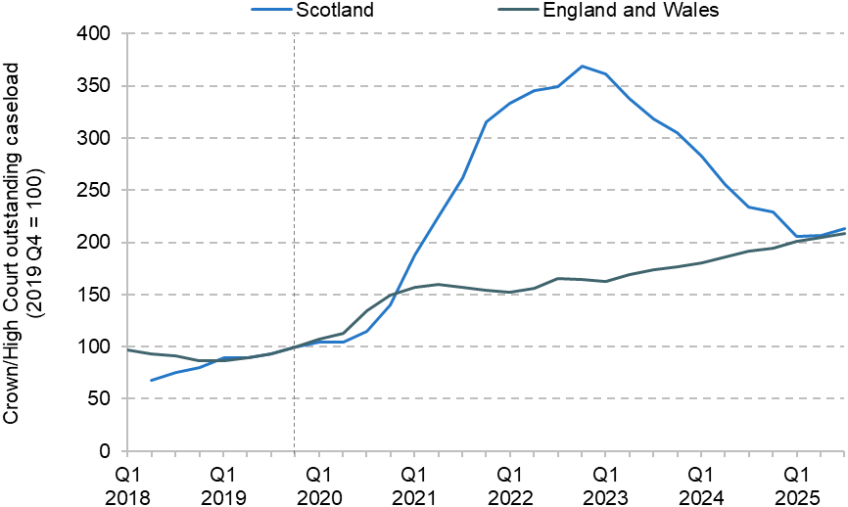
Source: Scottish Courts and Tribunals Service, 2025; Ministry of Justice, 2025a.
Backlogs increased in both jurisdictions, but the rise was much more pronounced in Scotland, where the number of scheduled trials outstanding worsened significantly until the end of 2022. From that point onwards, Scotland began to reduce its backlog at a sustained pace. England and Wales, by contrast, have experienced a steadier and more persistent increase in backlogs throughout the post-pandemic period. As a result, despite these different trajectories, the systems are currently operating at broadly similar levels relative to their pre-COVID baseline, with backlogs remaining around twice as high as they were in late 2019, albeit having followed different paths to reach that position. It is also worth noting that pandemic restrictions and court recovery strategies differed across UK nations, which may have influenced both the scale of disruption and the pace of recovery.
Having examined trends in outstanding caseloads, we now turn to measures of case duration. While the backlog provides a snapshot of the stock of open cases at a given point in time, duration statistics capture how long cases take to progress through the courts once they have entered the system. Considering these measures alongside the backlog helps to assess whether changes in outstanding caseload reflect temporary accumulation or more sustained shifts in court capacity and case progression.
To ensure once again the closest possible comparison across jurisdictions, we focus on court-stage duration only. For Scotland, this corresponds to the median time from court registration to verdict in High Court and Sheriff Solemn cases. For England and Wales, we use the median time from receipt at the Crown Court to completion. Although procedural pathways differ across the two systems, these measures both capture the time that serious cases spend within the trial court itself, excluding earlier stages such as police investigation, charging decisions or prosecutorial preparation. Given structural differences in pre-court processes, this court-stage measure provides the most comparable indicator of how long cases take to progress once they enter the jury-trial system.13
Since 2019–20, the duration of cases in both Scotland’s High Court and England’s Crown Court has increased relative to pre-pandemic levels, though the trajectories differ. In Scotland, median time from court registration to verdict rose sharply, from 161 days in the High Court and 43 days in Sheriff Solemn Procedure in the last quarter of 2019 to peaks of 414 days in the High Court in mid 2021 and 139 days for Sheriff Solemn cases in early 2023 (Scottish Government Justice Analytical Services, 2026b). Durations have since declined to around 292 days and 83 days respectively (latest available figures are for end-2024). In England, median time from court receipt to completion at the Crown Court increased more gradually, from 97 days pre-COVID to a peak of 171 days, since when it has remained at approximately 160 days, well above its pre-pandemic baseline (Ministry of Justice, 2025b). The Scottish pattern therefore reflects a sharp rise followed by a marked easing, while England’s shows a steadier increase with durations remaining persistently above pre-pandemic levels.
The reasons for these contrasting trajectories in backlog and duration are not fully clear – but a range of factors, including longer-term and structural factors, rather than any individual policy difference, likely play a role. It is clear though that the suspension of jury trials at the height of the COVID-19 pandemic led to a large spike in backlogs and delays in Scotland. Subsequent recovery measures, including expanded temporary trial capacity, intensified court programming and coordinated case prioritisation, enabled outflow to rise above inflow, allowing the Scottish backlog to fall (Audit Scotland, 2023; Scottish Courts and Tribunals Service, 2023).
Conclusion
Taken together, the evidence points to a distinction between trends in crime and pressures within the justice system.
Victimisation surveys show that crime as experienced by the public fell substantially in Scotland and in England and Wales during the 2010s, before levelling off more recently. Historically, reported victimisation rates were lower in Scotland than in England and Wales. While this changed in the most recent year of data for Scotland (2023–24), more years of data are needed to conclude that this is a real change in relative crime rates. And the broad long-term trends are very similar across Great Britain.
In contrast, court backlogs and case durations for serious jury cases have followed markedly different paths since the COVID-19 pandemic. Scotland experienced a sharper increase in both court backlogs and case duration, followed by a period of significant but partial recovery as the number of cases handled increased. England and Wales, by contrast, have seen a more gradual but sustained rise in both backlog and court-stage duration, with no sign of improvement as yet. Despite these differing trajectories, both Scotland and England & Wales continue to operate with backlogs and case durations well above their pre-pandemic baselines.
Overall, the comparative picture indicates that long-run crime trends are broadly similar across jurisdictions (with the exception of victimisation rates among young people, which are higher for Scotland in the most recent comparable data), while justice system pressures have evolved differently in the post-pandemic phase but remain elevated in both jurisdictions.
4. What is the outlook for public service spending?
Alongside its Budget for 2026–27, the Scottish Government (2026c and 2026d) published outline budgets for the following two years too as part of its Spending Review. These are likely to be revised as the amount of funding available evolves and as a potentially new government post-election updates plans to reflect its priorities. But taking these at face value for now: what do the plans tell us about the priorities of the current Scottish Government for the future of public service spending, and how does this compare with UK government priorities? What might these plans mean for different service areas? And what revisions could be seen post-election?
The 2026–27 Budget and Spending Review
We looked in detail at the 2026–27 Scottish Budget and Scottish Spending Review in the annual IFS Scottish Budget Report (Boileau, Brogaard and Phillips, 2026). Here we provide a summary of the key points.
The 2026–27 Budget sets out public service spending plans which represent a 0.6% real-terms increase in resource spending compared with the final plans for the current financial year, 2025–26. The increase planned for the Scottish Government’s Health & Social Care portfolio (0.2%) is in fact below average. Indeed, after accounting for planned transfers from this portfolio part way through the year to councils to pay for higher pay for social care workers, the remainder of the Health & Social Care portfolio is set to see a real-terms reduction in funding (–0.6%). As we discuss below, this is simply inconsistent with the pay deals offered to NHS staff, meaning in-year top-ups will be vital if the next Scottish Government wants to avoid cuts to NHS staff and services.
On the other hand, local government was a relative winner from the Scottish Budget – at least after accounting for transfers from other portfolios to pay for higher wages for social care and childcare workers. Accounting for these transfers, funding is set to increase by 1.3% in real terms compared with the current financial year. Even so, increases in council tax averaging 6.5% would be needed for Scottish councils to match the overall rate of increase in English councils’ funding (including for schools).
Looking further to the future, the current Scottish Government proposes a change in tack. Based on published plans in the Scottish Spending Review, the Health & Social Care portfolio would see increases in resource spending averaging 2.4% a year in real terms in 2027–28 and 2028–29. In contrast, other areas would see cuts averaging 1.7% a year in real terms over the same period. This includes the Justice & Home Affairs portfolio (–2.0% a year, on average) and the Finance & Local Government portfolio (–2.1% a year, on average). The precise numbers could change due to some small changes to the outlook for Scottish Government funding discussed below. But cuts in funding for the police and fire services will bite harder in Scotland than they would in England and Wales because there are no police or fire ‘precepts’ in council tax: that means the Scottish police and fire services cannot offset cuts in Scottish Government funding as their counterparts south of the border can.
The outlook for councils will depend crucially on how much of the increase in the Health & Social Care portfolio’s funding is transferred to them to help pay for social care costs. In turn, that will depend on whether the next Scottish Government is able to make the big shift in funding from hospitals to primary care and social care that is set out in the Scottish Government Spending Review. Even if it does (which will be something of a tall order), and half of the (large) increase in funding for non-hospital funding goes to increased transfers to councils to help fund social care services, Scottish councils would still need to increase council tax by an average of 8% a year to match increases in overall council funding in England. Without an increase in these social care transfers, Scottish councils might need to increase council tax by around 14% a year to match increases in English council funding.
In contrast to the resource spending outlook, which is more difficult than the headline figures suggest, the outlook for capital spending is perhaps less bad. This is because while overall capital funding is set to fall from 2026–27 onwards, the winding-up of major prison construction programmes will free up funding for investment in other areas.
Risks to the spending outlook
There are several risks to the spending outlook – some of the Scottish Government’s own making and some related to external factors.
Scottish Government budgeting
The first relates to the Scottish Government’s approach to budgeting.
As highlighted by the Fraser of Allander Institute (2026), the Scottish Government has in several recent years utilised borrowing and non-recurring funding to help fund recurring spending pressures. For resource spending, these one-off sources amounted to around £1 billion in 2022–2314 and around £200 million in 2023–2415 and, on current forecasts, they are set to amount to almost £900 million in the current financial year, 2025–26.16 Indeed, this reliance on one-off funding in 2025–26 is one reason why there is now set to be a bigger slowdown in funding increases than in England (Brogaard and Phillips, 2026): this funding will not be available in future years.
This habit began during the pandemic, when temporary COVID-19 funding was used, in part, to pay for the first year costs of several long-term spending measures, including an expansion of free school meals, increased mental health funding, a boost to council funding and part of the cost of public sector pay increases (Phillips, 2021). Funding for such commitments had to be found from within non-COVID budgets from 2022–23 onwards – perhaps contributing to spending pressures which have increased reliance on one-off sources in subsequent years.
It is worth noting that the Scottish Government has limited ability to carry forward one-off funding into later years given limits on how much can be held in the Scotland Reserve – it is, to some extent, ‘use it or lose it’.17 But the Scottish Government could use the funding to pay for expenditure that is more one-off in nature instead, including boosting capital budgets to expedite the construction of new facilities or infrastructure, or to purchase new equipment or technology. This could help reduce future budgetary pressures (for example, if new facilities or technology is more efficient), rather than add to them as is often the case for many increases in resource spending (such as higher pay rises, which increase future base salaries).
Turning to pay, the last decade has seen bigger increases in public sector pay in Scotland than in the rest of the UK. This is a legitimate choice which could help meet several objectives – including better employment relations, and better recruitment and retention (although Cribb, Domínguez and O’Brien (2025) could not detect an effect on retention rates). But even as inflation has fallen back from its 2022 and 2023 highs over the last two years, the Scottish Government has agreed pay deals which look inconsistent with its stated pay policy and the initial budgets it sets for departments. For instance, as discussed in Scottish Fiscal Commission (2026), pay deals for 2025–26 and 2026–27 have already averaged 8%, implying an increase of just 1% in 2027–28 to remain within a three-year 9% average pay increase target. And, while the 2026–27 Scottish Budget implies a 1.6% cash-terms increase in the Health & Social Care portfolio’s resource budget compared with the final budget for the current financial year,18 nurses and other staff covered by the ‘Agenda for Change’ pay deal are due to receive an average increase in pay of 3.75%, while resident doctors are set to see an increase in pay of 9.4% on average. Paying for these increases from within the currently allocated budget would likely necessitate cutbacks in service provision and perhaps in staffing. Perhaps more likely is substantial in-year top-ups to Scottish NHS funding.
The UK government may have come to the rescue in that regard. Since the Scottish Budget and Spending Review, it has announced top-ups to the Scottish Government’s funding in 2026–27 and 2028–29 as a result of additional spending in England on special educational needs and disabilities (SEND) costs, and the write-off of associated council deficits. Alongside some other small measures, this has generated an additional £542 million in funding in 2026–27, £13 million in 2027–28 and £345 million in 2028–29. If the Scottish Government were to allocate £470 million of the amount available in 2026–27 to the Health & Social Care portfolio, that would be sufficient to move from a –0.6% to a +1.7% real-terms change (after subtracting funding to be transferred to councils for social care wage increases), in line with the increase planned by the UK government for England. £72 million would still be available to further top up the Health & Social Care portfolio or other portfolios.
With this top-up in UK government funding, it may therefore be possible for the next Scottish Government to avoid in-year cuts to other services to top up health and social care spending as part of post-election budget revisions. Without this top-up, unless the Scottish Government had been able to carry forward substantially more funding via the Scotland Reserve than it currently plans to (£150 million), such in-year cuts to other services would have been almost inevitable. And money carried forward in reserves can be used only once, and programmes of in-year cuts also often include one-off savings through delaying planned activities.19 On the other hand, money to address health spending pressures and for higher pay needs to be found in subsequent years too.
Similarly, the top-up in UK government funding in 2026–27 only delays the budgetary reckoning – funding is due to fall back in 2027–28. Indeed, there is a case for the next Scottish Government to still look for savings from other portfolios, so that funding can be carried forward into 2027–28 to ease the particular fiscal pressures it will likely face in that year. More generally though, it should try to reduce its reliance on one-off funding. Ultimately, recurring costs need to be paid for by recurring revenues (e.g. from tax rises) or recurring reductions in other spending.
Upside and downside risks to Scottish Government funding
As well as the challenge of weaning itself off using one-off funding for recurring spending, the next Scottish Government still faces uncertainty about the funding it will receive from the UK government and from devolved taxes (Brogaard and Phillips, 2026) – which could see it able to top up current spending plans or could see it needing to cut them back.
On the one hand, IFS researchers have previously highlighted how tight UK government plans in 2028–29 and indicative overall spending totals in 2029–30 look, especially in the context of a UK general election taking place in Summer 2029 at the latest.20 That remains true even after the Spring Statement announcements on SEND funding. If the UK government topped up its spending plans, that would allow the Scottish Government to top up its spending again (or reduce taxes) too.
On the other hand, official forecasts likely overstate the contribution devolved revenues will make to the Scottish Government’s resource funding over the next few years – by around £500 million in 2028–29, for instance, if average earnings grow in line with the rest of the UK rather than outpace them as official forecasts implicitly assume.
Figure 26 illustrates the difference such upside and downside scenarios to funding could make to the funding available to different Scottish services. For the upside scenario, we assume that the UK government tops up planned spending on comparable services in England in 2028–29 by £10.5 billion (around 2%), generating £1 billion in additional funding for the Scottish Government. In our downside scenario, we assume that not only do Scottish earnings not outpace those in the rest of the UK, they in fact lag them by the equivalent of 0.4% a year over the next three years (the amount official forecasts currently implicitly assume Scottish earnings will outpace earnings in the rest of the UK by). This would reduce Scottish Government funding by £1 billion in 2028–29 relative to current official forecasts. The future could differ even more from official forecasts than these scenarios do and/or may include elements of both scenarios (e.g. both higher UK government funding and lower devolved income tax revenues). But they provide plausible more optimistic and more pessimistic scenarios for funding, and so for the potential changes to spending plans.
Figure 26. Upside and downside scenarios for resource spending on other services if health and social care spending is insulated from changes in the funding outlook (2026–27 = 100)

Source: Authors’ calculations using HM Treasury correspondence, Scottish Fiscal Commission (2026) and Scottish Government (2026d).
Figure 26 shows the implications for the average change in resource spending for all other services from these upside and downside scenarios if the Health & Social Care portfolio’s resource spending is assumed to be unaffected – i.e. protected from any cuts, but also not benefiting from any top-ups.21 In doing this, we assume that £470 million of the additional funding made available by the UK government in 2026–27 is used to top up health and social care spending (to an increase of 1.7% in real terms), with the remainder allocated to other services (raising the average increase from 0.3% in real terms under current plans to 0.6%). We assume that the additional UK government funding confirmed for 2027–28 (£13 million) and 2028–29 (£345 million) is allocated in full to the Health & Social Care portfolio. This would mean real-terms increases in funding of 0.3% and 3.8% for the Health & Social Care portfolio in each of these years (2.0% a year on average).
The graph shows that given these assumptions on health and social care spending, resource budgets for other portfolios would fall by an average of 1.8% a year in real terms in 2027–28 and 2028–29 under our baseline funding projections (with the biggest falls in 2027–28). Under our upside scenario, the resource funding for all other portfolios (including housing and local government) would grow by 0.2% a year, on average, in 2027–28 and 2028–29. In contrast, under our downside scenario, the average cut to other portfolios (including housing and local government) would need to be 3.9% to protect spending on the Health & Social Care portfolio.
This illustrates that upside and downside risks to the Scottish Government’s funding could mean quite significant top-ups or reductions to planned spending on different public services. However, even in the upside scenario, services outside the Health & Social Care portfolio would still barely increase, on average – making cutbacks in service provision and quality likely for at least some services unless the efficiency of delivery can be improved.
Rather than change public service spending plans, a future Scottish Government could also choose to change devolved taxes or social security benefit policies – including if funding is higher or lower than current official forecasts imply. For example, £1 billion would be equivalent to around a 1.4 percentage point change in all devolved income tax rates in 2028–29. It is also equivalent to around 12% of forecast devolved benefit expenditure in that year.
Thus, if income tax was cut by the equivalent of a 1.4 percentage point reduction in all tax rates (with a revenue cost of around £1 billion), and health and social care spending protected, then all else equal, the average cut to other services in 2027–28 and 2028–29 would need to more than double (from 1.8% to 3.9% a year, in real terms). Conversely, an increase in income tax of that scale would be sufficient to avoid real-terms cuts to other services, on average – but still entail tough choices over service provision.
5. Concluding remarks
Public spending in Scotland – by both the UK and Scottish governments – was 18.5% higher per person than in England in 2024–25. This extra spending was not spread equally across all areas of spending: health spending per person was only 2% higher, but adult social care spending per person was 36% higher and recreation, culture and religion spending per person 87% higher.
Service performance for three key service areas – the NHS, schools and the police and justice systems – is currently poor on a historical basis, and in some instances relative to England. The factors underlying this are likely to be complex, with many outside of direct Scottish Government control. But improving performance and outcomes will be one of the key challenges for the next Scottish Government.
For health, despite recent falls in waiting lists and waiting times, NHS performance remains substantially poorer than before the COVID-19 pandemic, despite significant increases in staffing. Concerningly, hospital activity has yet to return above pre-pandemic levels, unlike in either England or Wales – although increases there have relied on even bigger increases in staffing. More positively, Scotland does have shorter A&E waiting times than either England or Wales.
For schools, Scottish students’ performance in international tests has fallen from above English levels up until 2012 to significantly below it over the last 10 years. School absences are higher than in England, with the share of pupils absent on any given day up from 7% to 9% since 2019 – with likely negative consequences for learning.
It is also worth noting evidence that health and educational inequalities are worse in Scotland than in the rest of the UK. Whereas, conditional upon average income, average local life expectancy is similar in England and Wales, it is not only lower in Scotland, but the relationship between average local income and life expectancy is stronger than elsewhere in Great Britain. In addition, whereas domestic examinations suggest a narrowing of socio-economic gaps in educational attainment, international tests suggest these gaps have increased – and, if anything, are slightly wider in Scotland than in England and Wales.
Turning to policing, crime and justice, police officer numbers are relatively higher in Scotland than in England and Wales, although this gap has narrowed in recent years. And while crime victimisation has fallen significantly over the last 15 years, and has historically been lower in Scotland than in England and Wales, the reverse was true in the most recent year of data (2023–24). Given year-to-year volatility and sampling margins of error, this shift should be interpreted cautiously, but it represents a notable change in the relative position and is something worth monitoring. In addition, Scotland experienced a sharper deterioration in court performance during the pandemic than England and Wales, but has since recorded a significant, albeit partial, recovery. In contrast, in England and Wales, court system performance continues to deteriorate.
Looking to the future, the next Scottish Government will need to address these public service challenges in a difficult fiscal context. The current government’s Scottish Spending Review illustrates the tough trade-offs involved, with resource spending outside health and social care currently planned to fall by 1.7% a year in 2027–28 and 2028–29. Changes to the funding outlook since the Scottish Spending Review mean those numbers are already likely to change somewhat. A new government could also change plans to reflect different priorities – not only between services, but also between public services, devolved benefits and devolved taxes. But it will still face difficult trade-offs.
There are also risks to the spending outlook. Some of these are of the current Scottish Government’s own making – including a tendency to rely on one-off funding pots to help fund permanent spending over the last few years, and to agree bigger pay increases than the UK government and scrabble to find the money afterwards, neither of which is sustainable. But there is also uncertainty about the total amount that will be available to spend, given that UK government spending plans may change and that devolved tax revenues may evolve differently from current forecasts. This means the next Scottish Government will almost certainly have to revise the public service spending plans it inherits. And after recent improvements in some measures of public service performance, performance may decline again without increases in revenues and/or significant improvements in the efficiency of service delivery.
References
Aucejo, E. M. and Romano, T. F., 2016. Assessing the effect of school days and absences on test score performance. Economics of Education Review, 55, 70–87, https://doi.org/10.1016/j.econedurev.2016.08.007.
Audit Scotland, 2023. Criminal courts backlog. https://audit.scot/publications/criminal-courts-backlog.
Audit Scotland, 2025. NHS in Scotland 2025: finance and performance. https://audit.scot/uploads/2025-11/nr_251204_NHS_in_Scotland_2025.pdf.
Boileau, B., Brogaard, M. and Phillips, D., 2026. The IFS Scottish Budget Report 2026–27. IFS Report, https://ifs.org.uk/publications/ifs-scottish-budget-report-2026-27.
Brogaard, M. and Phillips, D., 2026. Recent changes and the future outlook for Scottish Government funding. IFS Report, https://ifs.org.uk/publications/recent-changes-and-future-outlook-scottish-government-funding.
Burtonshaw, S. and Dorrell, E., 2023. Listening to, and learning from, parents in the attendance crisis. Public First, https://impetus-org.files.svdcdn.com/production/assets/publications/Listening-to-and-learning-from-parents-in-the-attendance-crisis.pdf.
Carnegie UK, 2025. Life in the UK 2025: Scotland. https://carnegieuk.org/publication/life-in-the-uk-2025-scotland/.
Cribb, J., Domínguez, M. and O’Brien, L., 2025. Scottish public sector employment and pay. In D. Phillips (ed.), The IFS Scottish Budget Report 2025–26. https://ifs.org.uk/publications/scottish-public-sector-employment-and-pay.
Department for Education, 2025a. Pupil absence in schools in England: 2023 to 2024. https://www.gov.uk/government/statistics/pupil-absence-in-schools-in-england-2023-to-2024.
Department for Education, 2025b. Special educational needs in England: January 2025. https://www.gov.uk/government/statistics/special-educational-needs-in-england-january-2025.
Department for Education, 2025c. Suspensions and permanent exclusions in England. https://explore-education-statistics.service.gov.uk/find-statistics/suspensions-and-permanent-exclusions-in-england/2023-24.
Department for Work and Pensions, 2025. Benefit expenditure and caseload tables 2025. https://www.gov.uk/government/publications/benefit-expenditure-and-caseload-tables-2025.
Digital Health and Care Wales, 2026. Secondary Care Activity Dashboard. https://dhcw.nhs.wales/data/statistical-publications-data-products-and-open-data/hospital-data/secondary-care-activity-dashboard22/.
Farquharson, C., Ogden, K., Ornadel, N., Ridpath, N., Sibieta, L., Snape, D. and Tahir, I., 2026. Annual report on education spending in England: 2025–26. IFS Report, https://ifs.org.uk/publications/annual-report-education-spending-england-2025-26.
Farquharson, C., Phillips, D. and Zaranko, B., 2021. Public service spending in Scotland: trends and key issues. IFS Report, https://ifs.org.uk/publications/public-service-spending-scotland-trends-and-key-issues.
Fraser of Allander Institute, 2026. Scotland’s Budget Report 2026–27. https://fraserofallander.org/publications/scotlands-budget-report-2026-27/.
Goodman, J., 2014. Flaking out: student absences and snow days as disruptions of instructional time. National Bureau of Economic Research, Working Paper 20221, http://www.nber.org/papers/w20221.
Health Foundation, 2025. Trends in adults who are overweight or obese. https://www.health.org.uk/evidence-hub/risk-factors/trends-in-adults-who-are-overweight-or-obese.
HMRC, 2024. Personal incomes statistics for the tax year 2022 to 2023. https://www.gov.uk/government/statistics/personal-incomes-statistics-for-the-tax-year-2022-to-2023.
HM Treasury, 2024. Country and regional analysis: 2024. https://www.gov.uk/government/statistics/country-and-regional-analysis-2024.
HM Treasury, 2025. Country and regional analysis: 2025. https://www.gov.uk/government/statistics/country-and-regional-analysis-2025.
Home Office, 2025. Police workforce, England and Wales: 30 September 2025: data tables. Available at https://www.gov.uk/government/statistics/police-workforce-england-and-wales-30-september-2025#documents.
Latimer, E., Sibieta, L. and Snape, D., 2025. Support for children with disabilities and special educational needs. IFS Report, https://ifs.org.uk/publications/support-children-disabilities-and-special-educational-needs.
Lester, J., McKendrick, A. and Sibieta, L., 2023. Socio-economic inequality in Scottish education. IFS Report, https://ifs.org.uk/publications/socio-economic-inequality-scottish-education.
Ministry of Justice, 2025a. Criminal court statistics quarterly: July to September 2025 (tables). Available at https://www.gov.uk/government/statistics/criminal-court-statistics-quarterly-july-to-september-2025.
Ministry of Justice, 2025b. End-to-end timeliness tool (Crown Court). Available at https://www.gov.uk/government/statistics/criminal-court-statistics-quarterly-july-to-september-2025.
National Records of Scotland, 2025. Healthy life expectancy, 2021-2023. https://www.nrscotland.gov.uk/publications/healthy-life-expectancy-2021-2023/.
NHS England, 2024. NHS productivity. https://www.england.nhs.uk/long-read/nhs-productivity/.
NHS England, 2026a. Referral to treatment (RTT) waiting times. https://www.england.nhs.uk/statistics/statistical-work-areas/rtt-waiting-times/.
NHS England, 2026b. A&E attendances and emergency admissions. https://www.england.nhs.uk/statistics/statistical-work-areas/ae-waiting-times-and-activity/.
NHS England, 2026c. Provisional monthly Hospital Episode Statistics for admitted patient care, outpatient and Accident and Emergency data. https://digital.nhs.uk/data-and-information/publications/statistical/provisional-monthly-hospital-episode-statistics-for-admitted-patient-care-outpatient-and-accident-and-emergency-data.
NHS England, 2026d. NHS workforce statistics. https://digital.nhs.uk/data-and-information/publications/statistical/nhs-workforce-statistics.
NHS England, 2026e. Productivity plan – update. https://www.england.nhs.uk/long-read/productivity-plan-update/.
Office for National Statistics, 2024a. Country and regional public sector finances expenditure tables 2023. https://www.ons.gov.uk/economy/governmentpublicsectorandtaxes/publicsectorfinance/datasets/countryandregionalpublicsectorfinancesexpendituretables.
Office for National Statistics, 2024b. NHS planned care waiting times across the UK. https://www.ons.gov.uk/peoplepopulationandcommunity/healthandsocialcare/healthcaresystem/articles/nhsplannedcarewaitingtimesacrosstheuk/2024-06-18.
Office for National Statistics, 2024c. Accident and Emergency wait times across the UK: 2024. https://www.ons.gov.uk/peoplepopulationandcommunity/healthandsocialcare/healthcaresystem/articles/accidentandemergencywaittimesacrosstheuk/2024-02-28.
Office for National Statistics, 2024d. Crime in England and Wales: annual trend and demographic tables. https://www.ons.gov.uk/peoplepopulationandcommunity/crimeandjustice/datasets/crimeinenglandandwalesannualtrendanddemographictables/current.
Office for National Statistics, 2025a. Estimates of the population for the UK, England, Wales, Scotland, and Northern Ireland. https://www.ons.gov.uk/peoplepopulationandcommunity/populationandmigration/populationestimates/datasets/populationestimatesforukenglandandwalesscotlandandnorthernireland.
Office for National Statistics, 2025b. Period expectation of life (ex), by single year of age. https://www.ons.gov.uk/peoplepopulationandcommunity/birthsdeathsandmarriages/lifeexpectancies/datasets/periodexpectationoflifeexbysingleyearofage.
Office for National Statistics, 2026. Healthy life expectancy, UK: between 2011 to 2013 and 2022 to 2024. https://www.ons.gov.uk/peoplepopulationandcommunity/healthandsocialcare/healthandlifeexpectancies/bulletins/healthstatelifeexpectanciesuk/between2011to2013and2022to2024#healthy-life-expectancy-at-national-and-regional-levels.
Paterson, L., 2025. Misleading educational statistics. Enlighten, https://www.enlighten.scot/misleading-educational-statistics/.
Phillips, D., 2021. How and why has the Scottish Government’s funding changed in recent years? IFS Report, https://ifs.org.uk/publications/how-and-why-has-scottish-governments-funding-changed-recent-years.
Programme for International Student Assessment, 2022. PISA databases 2000-2022. https://www.oecd.org/en/about/programmes/pisa/pisa-data.html.
Public Health Scotland, 2025. PHS impact assessment – 2023: waiting times guidance. https://www.publichealthscotland.scot/media/37425/phs-impact-assessment-2023-waiting-times-guidance.pdf.
Public Health Scotland, 2026a. NHS waiting times - stage of treatment. https://publichealthscotland.scot/publications/nhs-waiting-times-stage-of-treatment/stage-of-treatment-waiting-times-inpatients-day-cases-and-new-outpatients-3-february-2026/.
Public Health Scotland, 2026b. Accident and Emergency. https://publichealthscotland.scot/healthcare-system/urgent-and-unscheduled-care/accident-and-emergency/downloads-and-open-data/our-downloads/.
Public Health Scotland, 2026c. Acute hospital activity and NHS beds information (quarterly). https://publichealthscotland.scot/publications/acute-hospital-activity-and-nhs-beds-information-quarterly/acute-hospital-activity-and-nhs-beds-information-quarterly-quarter-ending-30-september-2025/data-summary/.
Schofield, L., Walsh, D., Bendel, N., and Piroddi, R., 2021. Excess mortality in Glasgow: further evidence of ‘political effects’ on population health. Public Health, 201, 61–68, https://doi.org/10.1016/j.puhe.2021.10.004.
Scotland’s Census, 2025. Scotland’s Census 2022 - health, disability and unpaid care. https://www.scotlandscensus.gov.uk/2022-reports/scotland-s-census-2022-health-disability-and-unpaid-care/.
Scottish Courts and Tribunals Service, 2023. Criminal court recovery modelling. scts-modelling-report-12-23-final.pdf.
Scottish Courts and Tribunals Service, 2025. Quarterly criminal courts data (edition 28). Available at https://www.scotcourts.gov.uk/about-us/scts-statistics/courts-data-scotland-criminal-cdsc/.
Scottish Fiscal Commission, 2025. Fiscal Update – August 2025. https://fiscalcommission.scot/publications/fiscal-update-august-2025/.
Scottish Fiscal Commission, 2026. Scotland’s Economic and Fiscal Forecasts – January 2026. https://fiscalcommission.scot/publications/scotlands-economic-and-fiscal-forecasts-january-2026/.
Scottish Government, 2021. NHS Recovery Plan 2021-2026. https://www.gov.scot/binaries/content/documents/govscot/publications/strategy-plan/2021/08/nhs-recovery-plan/documents/nhs-recovery-plan-2021-2026/nhs-recovery-plan-2021-2026/govscot%3Adocument/nhs-recovery-plan-2021-2026.pdf.
Scottish Government, 2022. New national targets to tackle long waits for planned care. https://www.gov.scot/news/new-national-targets-to-tackle-long-waits-for-planned-care/.
Scottish Government, 2024. Programme for Government 2024-25: serving Scotland. https://www.gov.scot/publications/programme-government-2024-25-serving-scotland/pages/2/.
Scottish Government, 2025a. Government expenditure & revenue Scotland 2024-25. https://www.gov.scot/publications/government-expenditure-revenue-scotland-2024-25/.
Scottish Government, 2025b. Health and Social Care Service Renewal Framework. https://www.gov.scot/publications/health-social-care-service-renewal-framework/.
Scottish Government, 2025c. Population Health Framework: evidence paper. https://www.gov.scot/binaries/content/documents/govscot/publications/research-and-analysis/2025/06/population-health-framework-evidence-paper/documents/population-health-framework-evidence-paper/population-health-framework-evidence-paper/govscot%3Adocument/population-health-framework-evidence-paper.pdf.
Scottish Government, 2025d. Scotland’s Population Health Framework 2025-2035. https://www.gov.scot/binaries/content/documents/govscot/publications/strategy-plan/2025/06/scotlands-population-health-framework/documents/scotlands-population-health-framework-2025-2035/scotlands-population-health-framework-2025-2035/govscot%3Adocument/scotlands-population-health-framework-2025-2035.pdf.
Scottish Government, 2025e. NHS Scotland operational improvement plan. https://www.gov.scot/publications/nhs-scotland-operational-improvement-plan/.
Scottish Government, 2025f. Achievement of Curriculum for Excellence (CfE) levels 2024-25. https://www.gov.scot/publications/achievement-of-curriculum-for-excellence-cfe-levels-2024-25/pages/chapter-2-achievement-of-cfe-levels-by-deprivation/.
Scottish Government, 2025g. School attendance, absence and exclusions statistics 2024-25. https://www.gov.scot/publications/school-attendance-absence-and-exclusions-statistics-2024-25/.
Scottish Government, 2025h. Pupil census supplementary statistics. https://www.gov.scot/publications/pupil-census-supplementary-statistics/.
Scottish Government, 2025i. Scottish Crime and Justice Survey 2023/24: associated data tables. https://www.gov.scot/publications/scottish-crime-and-justice-survey-2023-24-associated-data-tables/.
Scottish Government, 2026a. Summary statistics for attainment and initial leaver destinations, no. 8: 2026 edition. https://www.gov.scot/publications/summary-statistics-for-attainment-and-initial-leaver-destinations-no-8-2026-edition/.
Scottish Government, 2026b. School attendance and absence statistics. https://www.gov.scot/publications/school-attendance-and-absence-statistics/.
Scottish Government, 2026c. Scottish Budget 2026 to 2027. https://www.gov.scot/publications/scottish-budget-2026-2027/.
Scottish Government, 2026d. Scottish Spending Review 2026. https://www.gov.scot/publications/scottish-spending-review-2026/.
Scottish Government Justice Analytical Services, 2026a. Police officer quarterly strength statistics Scotland, 31 December 2025. Available at https://www.gov.scot/collections/police-officer-quarterly-strength-statistics-scotland/.
Scottish Government Justice Analytical Services, 2026b. Journey times in the Scottish Criminal Justice System, published 3 February 2026. Available at https://www.gov.scot/collections/journey-times-in-the-scottish-criminal-justice-system/ and https://scotland.shinyapps.io/sg-scottish-criminal-justice-system-journey-times-dashboard/.
Sibieta, L. and Jerrim, J., 2021. A comparison of school institutions and policies across the UK. Education Policy Institute, https://epi.org.uk/publications-and-research/a-comparison-of-school-institutions-and-policies-across-the-uk/.
StatsWales, 2025. Attendance and absence from schools: September 2024 to August 2025. https://www.gov.wales/attendance-and-absence-schools-september-2024-august-2025.
StatsWales, 2026a. NHS waiting lists: pathways waiting 26 weeks, 36 weeks, one year and two years, September 2011 onwards. https://stats.gov.wales/en-GB/3ef3a1d8-1467-4afe-ad60-4fc3d92228a1#data.
StatsWales, 2026b. Emergency departments: performance against waiting times targets, October 2009 onwards. https://stats.gov.wales/en-GB/d9cf3aca-7476-499e-a64a-287885aa67e5.
StatsWales, 2026c. NHS workforce: staff directly employed by NHS Wales. https://www.gov.wales/nhs-workforce-staff-directly-employed-nhs-wales-30-september-2025-html.
TURAS Data Intelligence, 2025. NHS Scotland official workforce statistics. https://turasdata.nes.nhs.scot/data-and-reports/official-workforce-statistics/?pageid=1243.
Walsh, D., McCartney, G., Minton, J., Parkinson, J., Shipton, D. and Whyte, B., 2021. Deaths from ‘diseases of despair’ in Britain: comparing suicide, alcohol-related and drug-related mortality for birth cohorts in Scotland, England and Wales, and selected cities. Journal of Epidemiology and Community Health, 75, 1195–201, https://jech.bmj.com/content/75/12/1195.info.
Acknowledgements
This report is the second in a series of Scottish election briefings funded by the Nuffield Foundation (grant reference WEL /FR-000026348) and Robertson Trust (grant reference PROG-7220). Co-funding from the Economic and Social Research Council (ESRC) through the Centre for the Microeconomic Analysis of Public Policy is also gratefully acknowledged (grant reference ES/Z504634/1).
The Nuffield Foundation is an independent charitable trust with a mission to advance social well-being. It funds and undertakes rigorous research, encourages innovation and supports the use of sound evidence to inform social and economic policy, and improve people’s lives. The Nuffield Foundation is the founder and co-funder of the Nuffield Council on Bioethics, the Ada Lovelace Institute and the Nuffield Family Justice Observatory. Find out more at www.nuffieldfoundation.org. The Robertson Trust is an independent grant-making trust in Scotland. Established in 1961, the Trust’s mission is to prevent and reduce poverty and trauma in Scotland by funding, supporting and influencing solutions to drive social change. Its work focuses on four key themes: Financial Security, Work Pathways, Education Pathways, and Nurturing Relationships.
The authors thank Nina Ballantyne and Russell Gunson (Robertson Trust), Anvar Sarygulov (Nuffield Foundation) and Ben Zaranko (IFS) for helpful comments and suggestions. All views expressed and any errors or omissions are the responsibility of the authors alone, and not necessarily representative of the views of the Nuffield Foundation, Robertson Trust or their trustees or staff.
Endnotes
Authors

Martin Brogaard
Martin joined the IFS in 2025 and works in the IOD sector, researching consumer behaviour and nutrition. He also works on devolved government policy.

Magdalena Domínguez
Magdalena is a Senior Research Economist at the IFS. Her research focuses on issues related to the economics of crime, networks & place-based policies

Olly Harvey-Rich
Olly joined the IFS in 2024 and works in the Healthcare sector.

David Phillips
David is Head of Devolved and Local Government Finance. He also works on tax in developing countries as part of our TaxDev centre.

Luke Sibieta
Luke is a Research Fellow at the IFS and his general research interests include education policy, political economy and poverty and inequality.

Darcey Snape
Darcey joined the IFS in 2024 as a research economist in the Education and Skills sector.

Max Warner
Max joined the IFS in 2020. His work covers health and social care, public spending and public sector productivity.
More from IFS
Understand this issue


Policy analysis


Academic research