
Ahead of today’s parliamentary debate on the childcare system, results from a poll by a group of early years advocates contain some eye-popping numbers: the poll finds that 96% of working parents felt that the government is not doing enough to support families with the cost of childcare. While the poll is not necessarily representative of working parents as a whole, it does suggest that there is substantial frustration with the current system of childcare support in the UK. This is despite reforms over the past decade that have substantially expanded eligibility to – and spending on – the free entitlement to a funded childcare place.
In this observation, we set out the key facts on how England’s childcare system is structured, how it has changed over time, and some of the pressures it faces over the course of the coming Spending Review. To do this, we draw on recent IFS research, funded by the Nuffield Foundation.
Support for childcare in England is a patchwork of programmes
There are currently at least 8 programmes that support childcare in England, spread across three different departments. The largest, and probably best-known, are the trio of ‘free entitlements’ to funded early education places supported by the Department for Education. As it stands, all children are entitled to 15 hours a week of funded childcare from the term after they turn 3; those in working families can get up to 30 hours. Children in the poorest 40% of families, or who are otherwise vulnerable, start their 15-hour entitlement at age 2.
For working families, there is also support available through the tax system: families can opt in to tax-free childcare (which is gradually replacing employer-sponsored vouchers for childcare). These programmes effectively allow parents to pay for childcare out of pre-tax income (at least as long as they are basic rate payers – and there is no allowance for National Insurance contributions).
Lower-income working families can instead receive support for childcare expenses through the benefits system. The size of the subsidy varies depending on families’ exact circumstances, but those on universal credit could have 85% of their childcare costs paid for by the government. For families who remain on legacy benefits, the maximum subsidy is 70%.
Separately, many childcare providers are also exempt from VAT – a subsidy worth 15 to 20% of the price of childcare, depending on the provider’s circumstances.
Childcare is expensive for middle-class families in the UK – but lower-income families get more help with the cost
According to OECD figures, the UK spent around 0.7% of national income on early childhood education and care in 2015 – exactly the same as the OECD average. But the overall cost of childcare in the UK is far higher than in many other countries, leaving many families paying substantial fees out of pocket. Because the UK’s system of childcare relies on a range of different policies with different goals, however, the balance between public and private costs – and the burden that childcare puts on household finances – depends to a large extent on a family’s circumstances.
Figure 1 shows the share of household income that families spend on childcare (based on statistics from the OECD). A middle-class family with two earners, each on the average wage, spends nearly 30% of their after-tax income on childcare – more than in any other country save Australia and Switzerland. But a single parent earnings just two-thirds of the average wage gets substantially more support, and so spends only half as much of his or her (much lower) household income on out-of-pocket childcare costs.
Figure 1. Childcare spending as a share of net household income
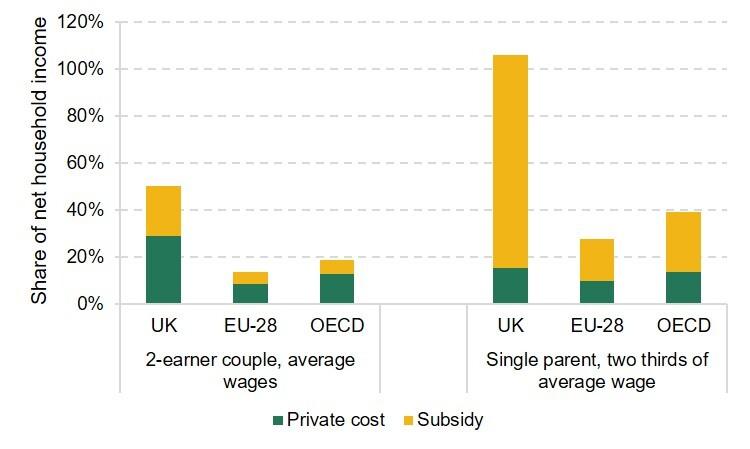
Note: Total costs refer to the amount paid for parents with two children, aged 2 and 3, in full-time care (40 hours a week) at a ‘typical’ centre-based childcare facility. See here for more details about the OECD’s methodology.
Source: Adapted from Figure 4 of Farquharson (2019). Underlying data from OECD.Stat, ‘Net childcare cost for parents using childcare’, accessed 7 November 2019.
Funded childcare hours make up an ever-increasing share of childcare support
While the childcare system continues to offer extra support to families on lower incomes, the past decade has seen a substantial shift, with far more focus on the free entitlement. In 2009-10, spending through the free entitlement roughly equalled spending through the benefits system. Since then, the two programmes have dramatically diverged: spending on the free entitlement grew by around 250% in real terms, while spending on childcare subsidies for benefit recipients fell by more than a third.
Figure 2. Spending on childcare subsidies through different programmes
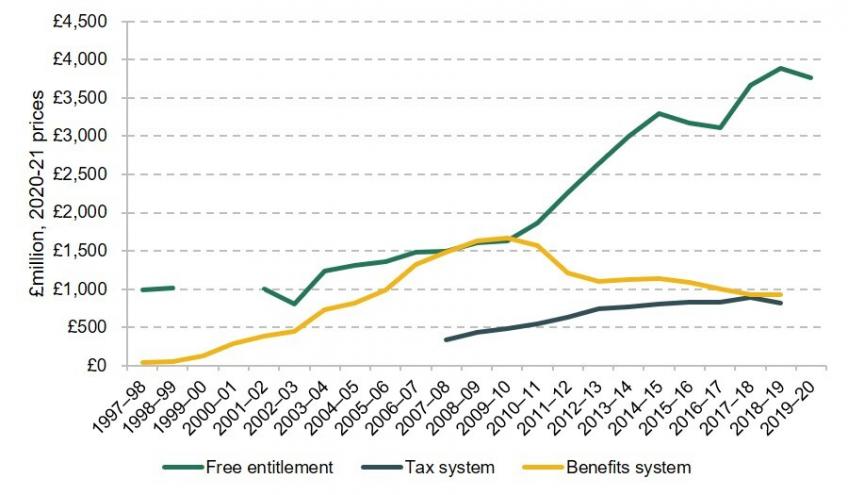
Source: Figure 2.1, Britton et al. (2020). See source for figure notes.
This has consequences for how spending is targeted. The introduction of the 2-year-old offer for vulnerable children and the 30-hour offer for working families have changed the shape of the childcare system: while spending explicitly targeted at low-income families (working or not) made up 45% of the childcare budget in 2007-08, it stood at just 27% a decade later.
Figure 3. Share of childcare subsidies targeted at different groups
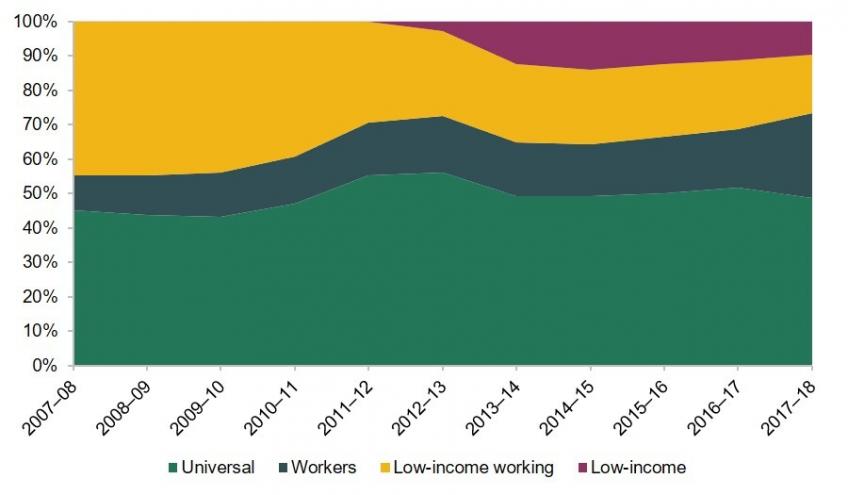
Note: ‘Universal’ refers to spending on the universal 3- and 4-year-old free entitlement. Childcare support targeted at low-income families includes the 2-year-old free entitlement, and support for low-income working families comprises childcare subsidies in the benefit system. Support targeted at working families includes the extended entitlement for 3- and 4-year-olds and the cost of employer-supported childcare and tax-free childcare.
Source: Figure 5, Farquharson (2019).
Funding for free entitlement hours looks increasingly tight
Virtually all of the huge growth in total spending has been driven by successive decisions to provide more hours for more weeks to more children. Spending per hour of childcare remains just 15% above its 2004-05 level in real terms (though this level of growth means that the early years sector still fared substantially better than other parts of the education system).
Childcare providers did enjoy a bump in spending per hour back in 2017-18 – part of a package designed to help them implement the new 30-hour entitlement for working families. But inflation since then saw all of that increase eroded by 2019-20. In 2020-21, spending per hour looks to have risen slightly – but this is mostly driven by the unusual behaviour of official measures of inflation around the COVID-19 pandemic.
Figure 4. Growth in real-terms spending on the 3- and 4-year-old free entitlements (2004-05=100)
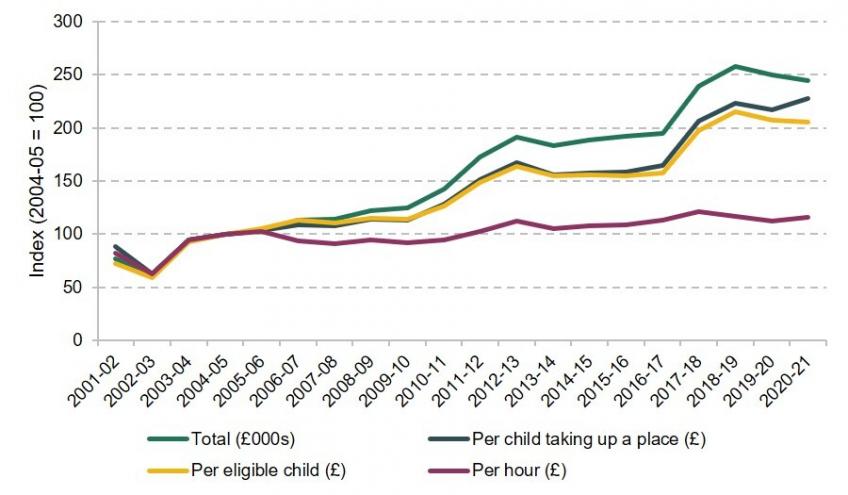
Note: Spending on universal and (from 2017) extended entitlements for 3- and 4-year-olds. Spending per place is spending per part-time equivalent place (15 hours) across both entitlements, so a child accessing their full universal and extended entitlement would count towards two PTE places. 2020-21 data is based on the Dedicated Schools Grant, since Section 251 budget returns were not collected in this year.
Sources: See Appendix A, Britton et al. (2020).
Whatever ends up happening to economy-wide inflation, it’s clear that the early years sector faces a range of additional funding pressures. Over 70% of providers’ costs go on staffing; with the adult minimum wage rising from £7.50 to £8.91 since 2017-18, providers are facing a substantially higher wage bill – even before the employer contributions for the new Health & Social Care levy are factored in. And, while the government largely protected free entitlement funding through the COVID-19 crisis, many providers will have faced a substantial hit to their income from parents paying out of pocket, which was only partly offset by schemes like the furlough programme or income support for the self-employed.
Compensating providers for some of these costs is expensive. Offering real-terms protection to hourly childcare spending at 2019-20 levels for 3- and 4-year-olds would cost around £250 million by 2024-25 (in today’s prices). Protecting hourly spending at its 2017 high-water mark would cost around twice as much. And compensating providers for the minimum wage increases they’ve absorbed since 2017 – not including any future rise – would require around £685 million.
Where next from here?
Today’s debate on the childcare system is unlikely to change much in the short term – the government has already declined to open an independent review into childcare funding and availability. But the debate does offer a rare chance to step back and consider the system as a whole, and how it supports families in the UK.
At the moment, navigating childcare in England is complicated and costly for families. The growth in the number of funded hours has been popular with parents, but it’s also put pressure on providers and contributed to a shift away from support targeted at low-income working families. And the breathing room from the rise in hourly spending rates in 2017-18 has now been used up, with providers on the hook for meeting rising wage costs.
Ultimately, the complexity of the system stems from trying to meet many goals at the same time. The design of a system that prioritises enriching early learning for children can look quite different from a system that is focused on providing flexible care for working parents. If today’s debate provides an opportunity to step back and reflect on what we want our childcare system to achieve – and whether it is meeting those goals – then it will have accomplished something very significant in the longer run.
Authors

Christine Farquharson
Christine's research examines inequalities in children's education and health, especially in the early education and childcare sector.
More from IFS
Understand this issue


Policy analysis


Academic research

