
Downloads

Download chapter as a PDF
PDF | 1.56 MB
The Autumn Budget will be the new government’s first opportunity to formally revisit inherited departmental spending plans. The Chancellor faces two linked choices: whether to change budgets already allocated to departments over the next few years, and how much to spend on departments as a whole in later years. Overall departmental spending grew relatively quickly over the last two years and continues to do so this year, but under the inherited spending plans it will grow much more slowly over the remainder of the parliament. Pay, productivity and demand pressures are making existing plans harder to deliver, and the government has signalled new spending ambitions in areas such as defence and adult social care.
Decisions about total departmental spending will matter for both the performance of public services and the public finances. This chapter examines pressures against inherited plans, the government’s new spending ambitions, and the choices facing the Chancellor at the Autumn Budget.
Key findings
- The previous Labour government increased departmental spending considerably relative to plans inherited from the Conservatives. But the increase was heavily front-loaded: planned spending growth slows sharply in coming years. The size of the state has grown over this parliament so far, but spending as a share of national income is projected to fall after 2027–28. Day-to-day departmental spending is set to grow by 2.4% in real terms this year, but by an annual average of just 1.0% over 2028–29 to 2030–31. Capital spending is even more front-loaded.
- Over the years for which departmental budgets are already set, 2025–26 to 2028–29, spending increases are heavily concentrated in a few large areas. Planned growth in health and defence spending takes up the bulk of all real-terms growth in spending between 2025–26 and 2028–29; a number of other departments face real-terms cuts. There were therefore already squeezes on some services, before considering a range of pressures that could increase the cost of delivering existing plans beyond what was assumed when budgets were set.
- Public sector pay is running above the path departments appear to have budgeted for, and higher inflation is reducing the real value of non-pay budgets. Staff costs account for roughly half of day-to-day departmental spending, so even relatively small differences in pay growth can have large effects on departments’ costs. Higher public sector pay growth in 2026–27 than was assumed when budgets were initially set could impose pressure of £3 billion against budgets in 2028–29. This is equivalent to around an eighth of the planned real increase in departments’ budgets between 2025–26 and 2028–29. If future pay awards follow recent forecasts for average earnings growth, this pressure could be £7–9 billion. Higher inflation than was forecast when budgets were originally set could reduce the real value of departments’ non-pay day-to-day budgets by £4–8 billion in 2028–29 and capital budgets by £2–4 billion.
- Inherited spending plans also depend on making historically ambitious improvements to public sector productivity. Last year’s Spending Review was accompanied by a detailed set of plans for productivity improvements across public services. The previous government made these plans more ambitious both at the last Autumn Budget and in the recent Defence Investment Plan. Current plans imply around 1.2% annual productivity growth, compared with around 0.2% historically. Achieving only half of planned gains would mean £9 billion of pressure against plans in 2028–29.
- Some services face particular spending risks because costs are particularly uncertain and difficult to control. Spending on special educational needs and disabilities (SEND) has grown rapidly in recent years. Current plans rely on that growth slowing as reforms take effect; if instead recent trends continued, spending could be around £3 billion higher than funding in 2028–29. Asylum spending currently looks on track to fall broadly as planned at last year’s Spending Review, but there remains a risk that it will overshoot expectations.
- The consequences of some of these pressures could persist well beyond 2028–29, the last year for which detailed departmental budgets have been set. Higher-than-expected pay settlements increase the paybill in future years, while failing to achieve planned public sector productivity gains means more resources are needed to deliver the same services in future. These pressures, if realised, would therefore also affect what departments could deliver within the spending totals allocated at the next Spending Review.
- Over the next Spending Review period (2028–29 to 2030–31), existing departmental spending totals imply likely real-terms cuts across a range of services. As an illustrative scenario: if health spending grew by 2.7% a year in real terms between 2027–28 and 2030–31, matching the rate planned at the last Spending Review, and defence spending was held constant at 2.7% of GDP from 2027–28 onwards, the combined budgets of all other departments would be cut in real terms by 0.9% per year. In this scenario, keeping non-health and non-defence spending constant in real terms would require a top-up to total departmental spending of £9 billion in 2030–31. This is before allowing for pay, public sector productivity and other pressures described above.
- On top of delivering existing plans, the government may have ambitions to spend more in some areas. Defence is the clearest example. If the government decided to increase defence spending to 3% of GDP in 2030–31, this could require around £11 billion more spending in that year than if it stayed at 2.7% of GDP. If this increase were delivered within existing spending totals, and health spending grew at 2.7% a year in real terms, total spending outside health and defence would be cut by an annual real average of 2.0% between 2027–28 and 2030–31. Cuts of this scale would imply a sharp reduction in what other departments can deliver.
- Neither spending pressures nor new ambitions translate mechanically into a required top-up to total spending. Absorbing a pressure or funding a new ambition while staying within existing spending totals is possible, but would require the government to pursue some combination of improving public sector productivity beyond its already-ambitious plans, accepting worse public service performance than planned in some areas, and deciding to stop providing some services. The government could also decide to reduce overall departmental spending at the Budget, which would sharpen these trade-offs. In either case, the government should be clear about how it will reconcile its plans and ambitions for public services with the spending totals it sets.
- If the government wanted to increase overall departmental spending to accommodate pressures or ambitions, the price tag could be large. For example, funding a path to 3% of GDP on defence in 2030–31, increasing health budgets in real terms by 2.7% each year and avoiding real-terms cuts to other areas over the next Spending Review period could require a top-up of £20 billion in 2030–31. Additionally compensating departments for plausible pay and productivity pressures against existing budgets could bring this illustrative total to £35 billion.
6.1 Introduction
The new Chancellor, John Healey, faces two linked decisions about departmental spending at the Autumn Budget: how far to revise existing departmental budgets and how much to spend in later years. Departmental spending is around half of total government spending and funds public services such as the NHS, schools, defence and courts. Choices here therefore matter both for the overall public finances and for everyone’s lives.
This government inherits detailed departmental budgets between 2026–27 and 2028–29 for day-to-day spending and up to 2029–30 for capital spending. It also inherits aggregate spending totals (‘envelopes’), which have not yet been allocated to individual departments, up to 2030–31. At the Budget, Healey could reopen departmental settlements and change as-yet-unallocated envelopes in later years. He will also have to set an initial spending total for 2031–32, the new fifth year of the Office for Budget Responsibility (OBR)’s forecast.
Existing plans for public services are likely to be harder to deliver over the next couple of years than anticipated when they were first set. Some risks are cross-cutting: public sector pay is rising faster than departments appear to have budgeted for; inflation is higher than anticipated when budgets were set; spending plans rely on ever more ambitious improvements in public sector productivity. There are also risks from areas where costs are particularly uncertain and hard to control; we examine spending on special educational needs and disabilities (SEND) and asylum as two important examples.
Inherited spending envelopes for 2029–30 and 2030–31 look relatively tight, even before accounting for the emerging pressures discussed above. While total departmental spending is set to grow in real terms in each of the next four years, this growth is set to slow sharply, and departmental spending to begin falling as a share of national income after 2026–27. How to allocate this slowing growth to individual departments in these future years will be the central challenge of next year’s Spending Review – keeping to current totals almost certainly implies real-terms cuts to a set of departmental budgets.
The government may also decide to spend more in some areas. Defence is the clearest example: there is substantial pressure to go further and faster with increases in defence spending, as John Healey himself argued for when he resigned as Defence Secretary earlier this year. The government also plans to introduce significant adult social care reform in the next parliament. This could affect spending settlements from 2029–30, although we do not expect to have details confirmed at this Budget.
None of these spending pressures or ambitions automatically requires higher levels of overall departmental spending. Departments can absorb higher costs, through reducing public service performance or potentially finding efficiencies. Ministers can also reprioritise between programmes. Indeed, the government could also decide to cut back total spending plans at the Budget, as Rachel Reeves did at the Budget last year. But these responses are not cost-free, and will be particularly challenging given existing plans for slowing spending growth. When past governments have been faced with allocating slowing spending growth to departments, they have often instead decided to top up budgets (Boileau, Warner and Zaranko, 2024). But the outlook for the public finances – discussed in Chapter 2 of this Green Budget – will place constraints on the Chancellor’s room to accommodate higher levels of departmental spending.
Under the framework set by Rachel Reeves, this Budget would be the last clear opportunity to make changes to the total amount of planned departmental spending between 2028–29 and 2030–31, which is due to be allocated to departments at the Spending Review next year. John Healey could depart from this framework and instead revise plans for total departmental spending next year, either at a second fiscal event or by conducting the Spending Review alongside the Autumn Budget.
There are good reasons for the government not to settle every detail about departmental spending this autumn – not least that a new Chancellor and Prime Minister may still be deciding their precise priorities for public services. But the totals published at this Budget should be ones within which the Chancellor could credibly conduct the Spending Review. If he already expects to allocate budgets at the Spending Review that would exceed existing totals, postponing the increase in spending plans until next year would flatter the outlook for the public finances at the Budget. Of course, he could also choose to keep inherited totals, or even cut them back, if he is prepared to make the resulting choices between services.
This chapter evaluates pressures on and ambitions for departmental spending plans over the next few years and sets out the Chancellor’s options at the Budget. Section 6.2 sets out the departmental spending plans the government has inherited. Section 6.3 examines sources of pressure against those plans: cross-cutting pay, inflation and public sector productivity risks, and risks for specific services that are particularly exposed to uncertain levels of demand. Section 6.4 considers new ambitions the government has which may require additional spending, while Section 6.5 considers the resulting trade-offs and decisions that must be made at the Budget and next year’s Spending Review. Section 6.6 concludes.
6.2 Inherited spending plans
The departmental spending framework
The UK government is set to spend £1.4 trillion in 2026–27: approximately 45% of national income. Around half of this spending is managed through departmental budgets – which cover most spending on public services, including the NHS, schools, defence and the justice system – and classified as departmental expenditure limits (DEL) spending. Departments are set fixed annual DEL budgets, generally over multi-year periods at Spending Reviews. The other half of government spending is classified as annually managed expenditure (AME spending). This covers areas where spending is argued to be harder to control, volatile or demand-led, making it challenging to set fixed multi-year budgets – for example, all benefit spending (including the state pension) and debt interest spending.1 Our focus in this chapter is DEL spending.
Both DEL and AME spending are divided into day-to-day and capital spending. Day-to-day, or resource, spending covers recurring expenses – for example, on staff (RDEL spending) or on benefits (RAME spending).2 Capital, or investment, spending covers things expected to produce an enduring asset – for example, central government spending on new buildings (CDEL spending) or councils’ locally financed spending on council housing (CAME spending). Day-to-day spending is by far the larger of these components, set to represent around 89% of total government spending in 2026–27.
At Spending Reviews, aggregate resource and capital DEL totals – ‘envelopes’ – are allocated to individual departments, generally over a multi-year period. These departmental budgets are specified as annual cash limits, and are not automatically adjusted if inflation or other cost pressures turn out differently from forecast. While Spending Reviews sometimes coincide with Budgets (as was the case for the 2021 and 2024 Spending Reviews), more often aggregate RDEL and CDEL envelopes are fixed at Budgets before being allocated to departments at a subsequent Spending Review. This top-down approach is intended to impose a hard budget constraint on HM Treasury negotiations with departments (Crawford, Johnson and Zaranko, 2018).
Once Spending Review settlements are set, departments have some flexibility to move money between programmes within their resource and capital budgets in each year. They cannot as easily move money between years, or between the two budgets; moves from CDEL to RDEL are particularly discouraged. Both types of changes, though, have often occurred in practice. A cross-government ‘Reserve’ for both resource and capital spending is usually set for each year, within overall DEL totals and alongside departmental allocations. This is an unallocated pot of money to cover unforeseen and unavoidable pressures that departments may face in each year.
On coming into office, following a review of inherited spending plans and pressures, Rachel Reeves made some adjustments to the spending control system. She returned to a system of overlapping Spending Reviews, whereby a Spending Review would be held every two years, and set spending over three years. The last Spending Review took place in June 2025, and set resource budgets between 2025–26 and 2028–29, with an additional year set for capital budgets. Currently, 2028–29 is the overlapping year for day-to-day spending (with 2029–30 also overlapping for capital spending). If the government retains this framework and the commitment to hold only one fiscal event each year, the upcoming Autumn Budget would be the moment to set the aggregate spending envelopes within which the 2027 Spending Review will be conducted.
Departmental spending envelopes
The new government inherits overall departmental spending envelopes going to 2030–31, with detailed departmental budgets to 2028–29 for day-to-day spending and to 2029–30 for capital spending. These plans have changed substantially over the past few years:
- Spring Budget 2024. The Sunak government set provisional totals for departmental spending for 2026–27 to 2028–29 but did not specify how these would be allocated between departments. These plans implied sharp real-terms cuts to some areas of day-to-day spending and falls in overall capital spending (Emmerson, Johnson and Zaranko, 2024).
- Autumn Budget 2024. Chancellor Rachel Reeves substantially raised both day-to-day and capital spending, increasing day-to-day spending totals by £50 billion and capital spending totals by £26 billion in 2028–29.
- Spending Review 2025. The government allocated these higher spending totals to departments, setting day-to-day budgets through 2028–29 and capital budgets through 2029–30.
- Autumn Budget 2025 and Spring Forecast 2026. There were small revisions to spending plans at subsequent fiscal events. At the Autumn Budget, the government reduced planned departmental spending from 2028–29 onwards, describing these reductions as a set of departmental efficiencies. At the Spring Forecast, the government topped up Department for Education (DfE) budgets in 2028–29 (and increased envelopes thereafter), reflecting a package of SEND reforms.
The Spring Forecast provides the latest complete set of spending plans used in this chapter.3
Figure 6.1 shows what these changes have meant for growth in departmental spending. The March 2026 plans are expressed using the OBR’s inflation forecast from March 2026; we discuss in Section 6.3 how changes to inflation expectations since then could impact the real-terms generosity of existing spending plans. Spending is substantially higher than was envisaged in March 2024, but fast spending growth is confined to earlier years, with much slower growth pencilled in for later years. Real-terms day-to-day spending is set to grow by 2.4% this year, falling to 0.9% next year, then 1.2% in 2028–29, the final year for which we have detailed department-level allocations. Real-terms capital spending growth will slow from 6.6% this year to 1.4% next year, before essentially staying flat for the following two years.
Figure 6.1. Planned annual real-terms spending growth, March 2024 and Spring Forecast 2026
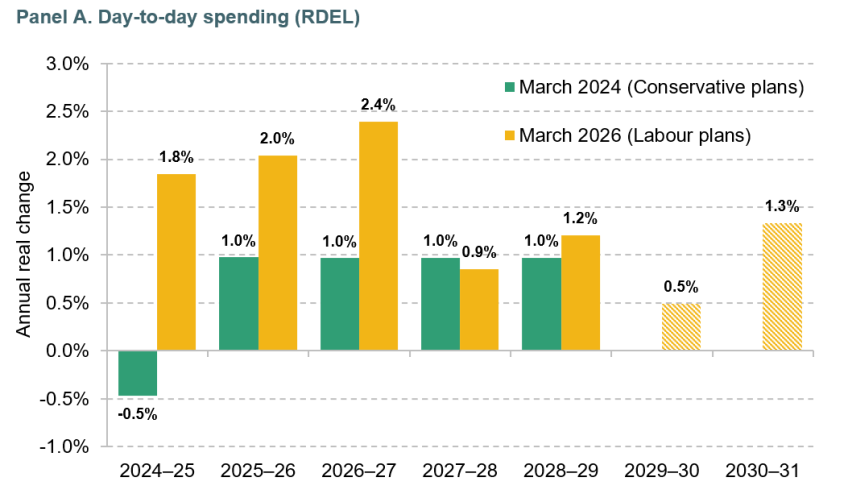
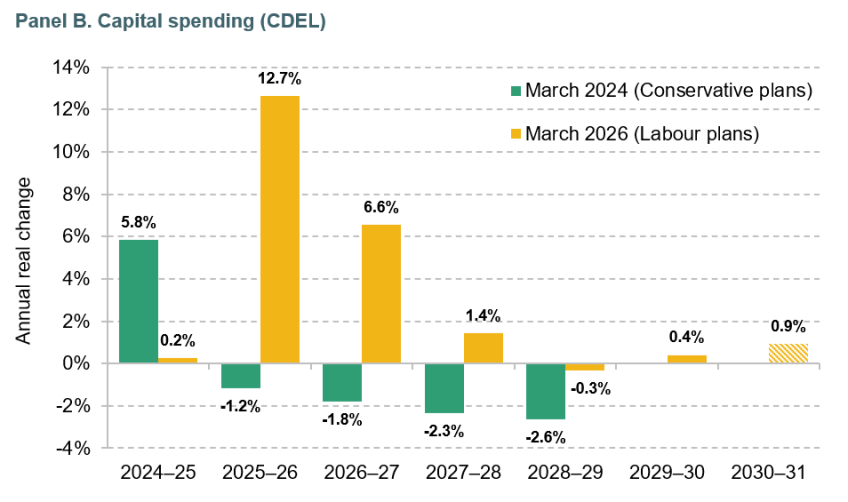
Note: 2024–25 RDEL growth rate is adjusted for the impact of SCAPE (superannuation contributions adjusted for past experience) changes and employer NICs (National Insurance contributions) compensation. 2025–26 RDEL growth rate is adjusted for the impact of employer NICs. Figures in 2024–25 and 2025–26 are based on out-turn spending; figures in 2026–27 onwards are based on plans. CDEL growth rates are adjusted for the 2026–27 reclassification of Sizewell C from DEL to AME. Numbers do not account for any changes implied by the Defence Investment Plan. Real-terms growth is calculated using the GDP deflator when plans were set. Dashed bars are those for which spending has not yet been allocated to departments.
Source: Authors’ calculations using HM Treasury’s Spring Budget 2024 and Spending Review June 2025, and Office for Budget Responsibility’s Economic and fiscal outlook March 2026.
Slower growth in departmental spending is also currently set to continue in the years where the government has only set overall envelopes, shown by the dashed bars. Real-terms day-to-day spending is set to grow by just 0.5% in 2029–30 and 1.3% in 2030–31, while capital spending is set to grow by 0.9% in 2030–31. This front-loaded profile means that, while the size of the state will stay high relative to historical levels, departmental spending is forecast to peak as a share of national income in 2026–27, and slightly fall thereafter, as Figure 6.2 shows. The path of total government spending looks very similar, peaking in 2027–28.
Figure 6.2. Total government spending and total departmental spending as a share of national income, 1998–99 to 2030–31
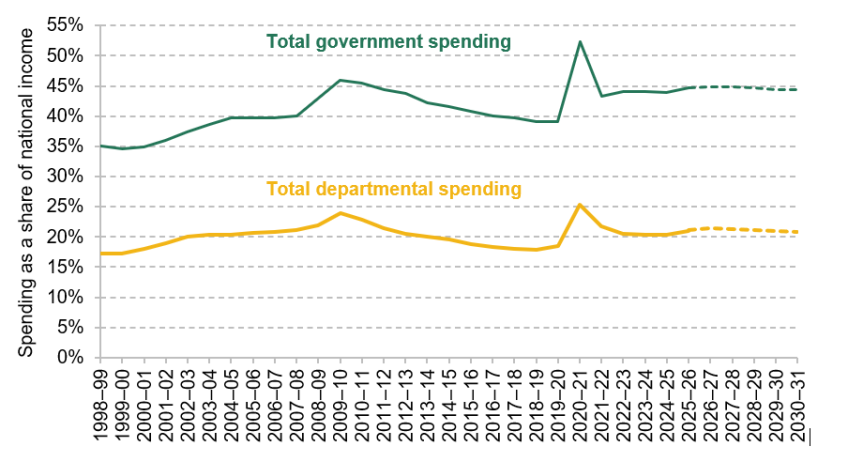
Note: Datapoints after 2025–26 are forecasts.
Source: Authors’ calculations using the Office for Budget Responsibility’s Public finances databank and Economic and fiscal outlook March 2026.
There can be good reasons for larger spending increases to come earlier in a time period. Faster increases earlier on can help services address backlogs or meet the up-front costs of reforms. But moving from relatively rapid increases to much slower growth can also be challenging, particularly where earlier growth has supported recurrent commitments or where costs and demands continue to rise. Relatively low growth at the end of the parliament leaves limited room to substantially increase spending in priority areas without making cuts elsewhere; we return to these trade-offs in Section 6.5.
Departmental budgets
Departments – and areas of spending – differ substantially in size: Figure 6.3 shows the planned split of total DEL (TDEL) between different departments in 2026–27. The Department of Health and Social Care (DHSC) alone accounts for a third of departmental spending; DHSC and the Department for Education together represent around half. Spending by the Ministry of Defence is another 10%.
Figure 6.3. Planned components of total departmental expenditure limits (TDEL) in 2026–27
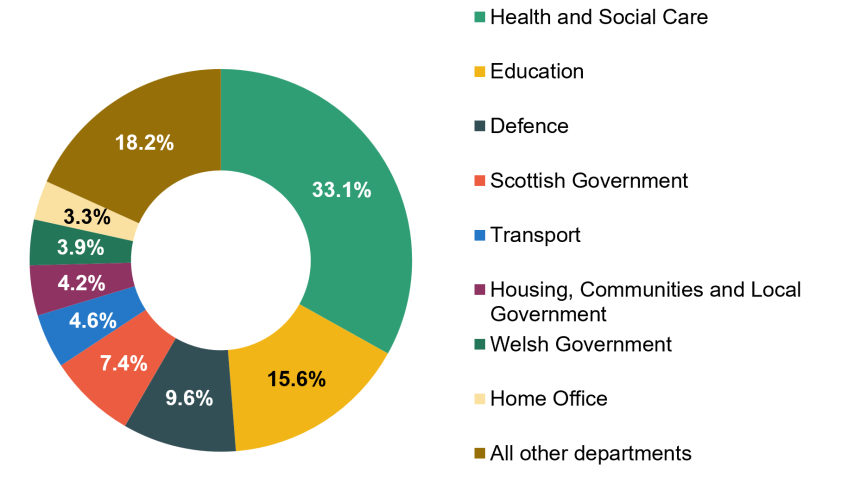
Note: Scottish and Welsh Government figures refer to the portion of devolved governments’ funding that comes directly from Westminster (so does not include, for example, devolved and retained tax revenues). Welsh Government figure is adjusted to add back tax block grant adjustments. Housing, Communities and Local Government funding includes the bulk of central grants to local government but does not include local tax revenues (e.g. business rates, council tax). This decomposition does not account for small changes to departmental budgets made alongside the Defence Investment Plan, or for Machinery of Government changes introduced by the new Prime Minister on taking office.
Source: Authors’ calculations using the Office for Budget Responsibility’s Economic and fiscal outlook March 2026.
Not all of the spending shown in Figure 6.3 maps straightforwardly onto services delivered by UK government departments. A substantial share of DEL is transferred to the devolved governments through block grants: funding for the Scottish, Welsh and Northern Irish Governments accounts for around 14% of the TDEL shown. These block grants are only one source of devolved government funding, alongside revenues from devolved taxes and other sources. Analysis in this chapter largely focuses on budgets controlled directly by UK government departments (‘non-devolved spending’), since these are the allocations over which the Chancellor makes the most direct choices.4 These cover UK-wide public services (e.g. defence) and the provision in England of devolved public services (e.g. the NHS and schools in England).
The same qualification applies to local government. The Ministry of Housing, Communities and Local Government (MHCLG) budget, which includes the bulk of central grants to councils, accounts for a further 4% of TDEL. As with devolved governments, these grants make up only part of councils’ funding; Box 6.1 describes local government funding in more detail.
Box 6.1. Local government funding and spending
Local government is somewhat different from most of the central government departments shown in Figures 6.3 and 6.4. Spending Reviews determine most of the central government grants to councils, but this central funding is only one part of what determines councils’ finances. Revenues from local taxes – in particular, council tax and retained business rates – are another important source of funding for English councils, and are expected to account for around 45% of councils’ overall resource funding in 2026–27.a Spending funded through local revenues does not appear in MHCLG DEL totals (it is instead part of AME).
The outlook for councils’ finances therefore depends heavily on what happens to council tax. Across England, councils’ core spending power is set to increase by around 2.9% a year on average in real terms between 2025–26 and 2028–29 if council tax rises in each year by the maximum amount permitted, compared with 1.2% if council tax instead rises with inflation (Phillips, 2026). This is likely to differ significantly across different councils.
The boundary between central and local government finances may also change over time – for instance, as responsibilities are moved between different tiers of government. Alongside the Autumn Budget, the government plans to replace more of local authorities’ grants with retained business rates revenues. In addition, it will publish more details of plans to assign a share of income tax revenues to strategic authorities (see Chapter 9 of this Green Budget). While it intends these reforms to be fiscally neutral overall, they could change the balance of spending managed through departments and as locally financed annually managed expenditure.
a See Appendix 9A of Chapter 9 for details of how councils’ overall resource funding has been estimated based on budget/forecast data published by MHCLG.
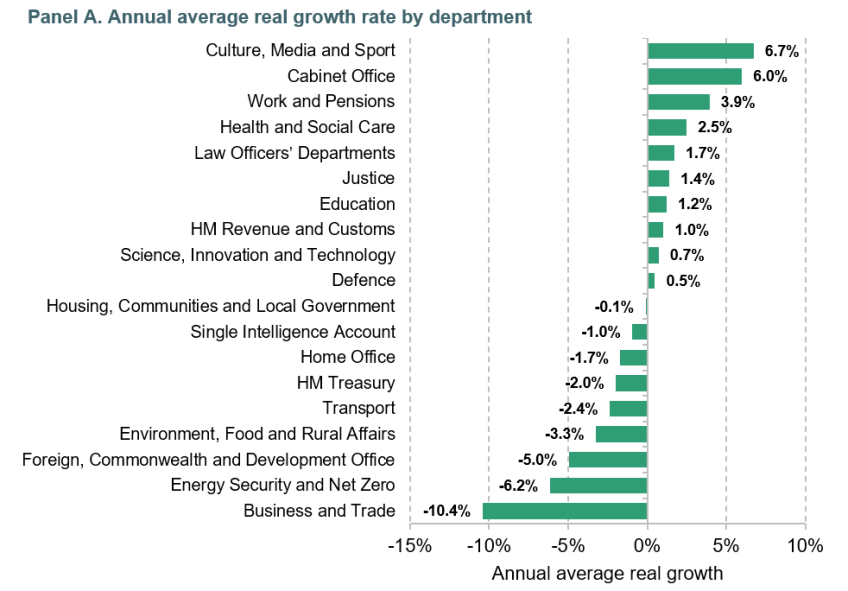
Planned growth in departmental spending also differs considerably between departments. Panel A of Figure 6.4 shows annual average real-terms growth in day-to-day spending across different departments. Some relatively small departments are set to see very fast real-terms increases in their day-to-day budgets over this period: for example, day-to-day spending by the Department for Culture, Media and Sport and the Cabinet Office is set to grow particularly quickly between 2025–26 and 2028–29. At the other end, a number of departments face real-terms cuts, including the Department for Energy Security and Net Zero and the Department for Business and Trade.
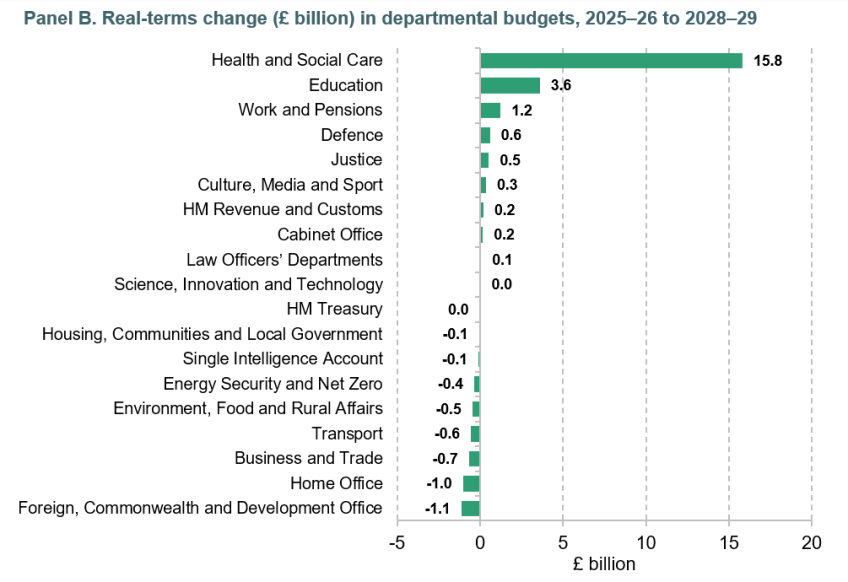
Figure 6.4. Day-to-day spending growth over the Spending Review period, 2025–26 to 2028–29
Note: This does not account for spending changes made alongside the Defence Investment Plan, or for Machinery of Government changes introduced by the new Prime Minister on taking office. Block grant allocations are not shown. Health and Social Care and Home Office budgets are adjusted for a budget control transfer in 2025–26.
Source: Authors’ calculations using the Office for Budget Responsibility’s Economic and fiscal outlook March 2026.
But these budgets are vastly different in size, as Figure 6.3 shows, so growth rates in spending alone do not give the full impression of where additional resources are going. Health is the clearest example: day-to-day DHSC spending is set to grow by a real-terms average of 2.5% each year between 2025–26 and 2028–29, but accounts for the vast majority of total real-terms spending growth. Panel B of Figure 6.4 shows that the DHSC budget is set to be £16 billion higher in real terms in 2028–29 than in 2025–26. In contrast, spending on the fastest-growing department – Culture, Media and Sport – will only be £0.3 billion higher, because its initial budget is much smaller.
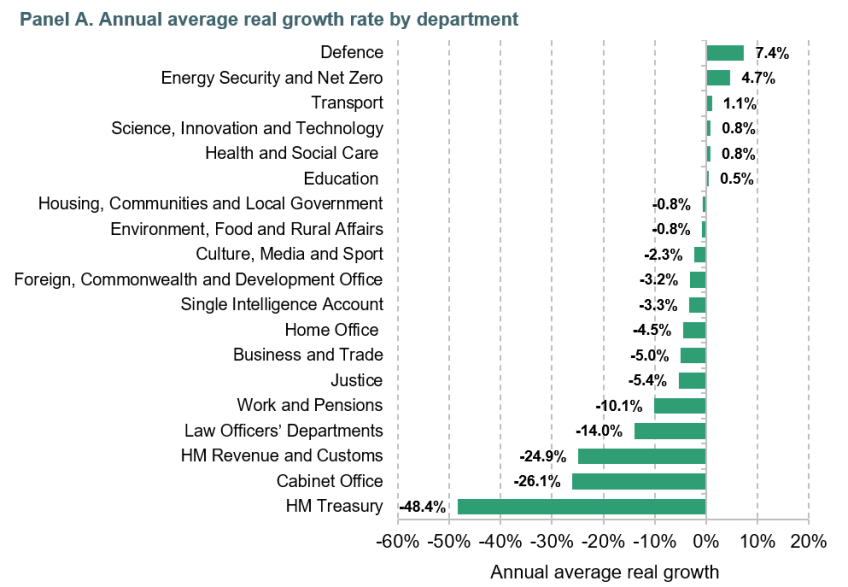
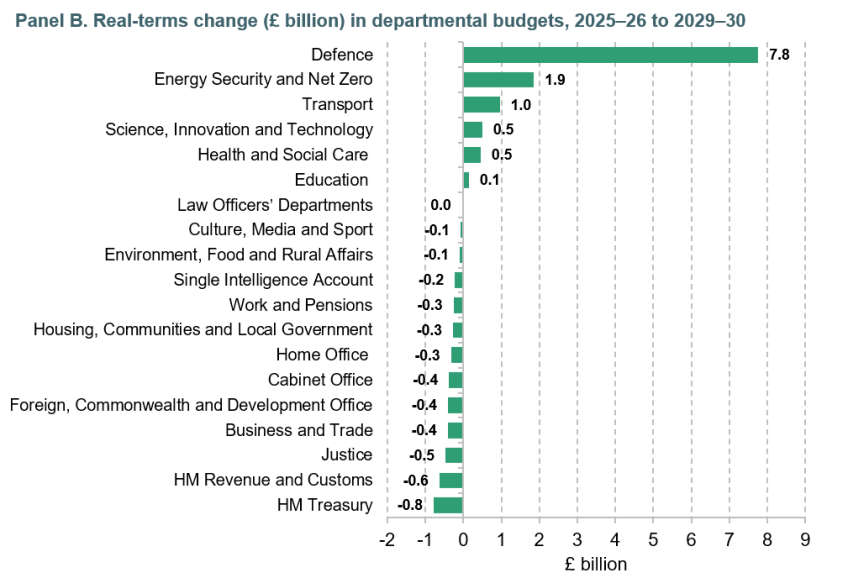
The allocation of capital spending increases is even more concentrated. Figure 6.5 shows annual average real-terms growth in capital spending (Panel A) and total changes in capital budgets (Panel B) by department. Defence capital spending is set to grow by around 7.4% a year in real terms between 2025–26 and 2029–30, considerably faster than other large capital budgets, even before accounting for top-ups to defence spending made alongside the Defence Investment Plan (DIP) earlier this year (which would bring its growth to around 8.4% a year).
Figure 6.5. Capital spending growth over the Spending Review period, 2025–26 to 2029–30
Note: This does not account for spending changes made alongside the Defence Investment Plan, or for Machinery of Government changes introduced by the new Prime Minister on taking office. Energy Security and Net Zero growth is adjusted for the reclassification of Sizewell C in 2026–27.
Source: Authors’ calculations using the Office for Budget Responsibility’s Economic and fiscal outlook March 2026.
Unlike day-to-day spending, the departments for which capital spending is growing fastest tend also to be the largest departments. As the Ministry of Defence (MoD) has the largest capital budget, this translates into an even more concentrated picture when considering real-terms changes. The MoD budget is set to be £7.8 billion higher in real terms in 2029–30 than in 2025–26 (£9.0 billion after accounting for top-ups made alongside the DIP). This is most of the real-terms increase in the overall capital budget, and most other departments are seeing real-terms cuts to their capital budgets over this period.
Both day-to-day and capital spending increases are therefore concentrated in some large and important areas – health, education and defence – while other areas of spending are set to see slower growth and, in some cases, real-terms cuts. Decisions over these three areas of spending are therefore by far the most important for total departmental spending. And despite current plans, even these areas do not look entirely insulated from further pressure, as will be described in the next section.
6.3 Pressures against existing spending plans
The existing departmental budgets for the next few years could come under pressure in various different ways; we consider these in this section. First, there are cross-cutting challenges affecting public services. Public sector pay appears likely to rise faster than departments have budgeted for and inflation is higher than was expected when budgets were set, while existing plans assume very ambitious improvements in public sector productivity. Second, there are service-specific risks to areas where spending may be particularly difficult to control within fixed budgets. We focus here on spending on special educational needs and disabilities (SEND) and asylum support. While this is clearly not an exhaustive list of public service pressures – other services, such as prisons, tribunals and childcare, face important pressures of their own – they illustrate important mechanisms and risks affecting existing budgets.5
We do not attempt to assess whether budgets set at the last Spending Review were sufficient to achieve the government’s wider ambitions for public service performance. Instead, and as an illustration of the scale of the pressures, we use existing budgets as our baseline, and ask how much more it would cost to implement the plans implied by these budgets if assumptions about pay, productivity or demand turned out differently from what was assumed when plans were first set.6
The government faces a choice in how to respond to pressures against spending plans. It could choose to top up funding to maintain planned public service performance, or alternatively to leave funding unchanged and accept a deterioration in public service performance (or reduce what services the government offers). We come back to this choice in Section 6.5.
Cross-cutting challenges
Higher-than-anticipated public sector pay
Public sector pay makes up roughly half of day-to-day departmental spending, so even relatively small changes in pay settlements for public sector workers can have large effects on departments’ overall budgets. Departmental budgets are set in cash terms over a multi-year period, while public sector pay awards are generally determined annually through the Pay Review Body (PRB) process. Pay awards will be driven by a number of factors, including what departments say they can afford, inflation and private sector earnings growth. If awards turn out higher than expected when budgets were initially set, the effect is likely to persist: a higher pay award in one year will raise the level of pay, and so the cost of employing the same workforce, in every subsequent year.
Departments’ assumptions about how public sector pay will grow were not made public when budgets were agreed at the last Spending Review.7 As our best publicly available proxy, we use the path for general government pay per head provided to the OBR by the Treasury in March 2025, shortly before the Spending Review. This path implied that pay per worker was expected to grow by 2.2% in 2026–27.
Pay now looks likely to grow substantially faster this year. Headline pay awards in the public sector have averaged around 3.4% in 2026–27.8 Headline awards are not quite the same as growth in average pay per worker, which also tends to rise because of progression and other compositional changes within the workforce. Adding an additional assumption on this ‘pay drift’ gives an estimate of around 3.9% growth in average pay per worker in 2026–27.9 If pay per head grew at this rate in 2026–27, and then grew with the OBR’s March 2026 assumptions for general government pay in future years, holding employment growth unchanged, this could mean the paybill across non-devolved areas of spending rising by around £3 billion more than our illustrative baseline by 2028–29.
There are signs that pay awards in future years may also turn out higher than was expected in March 2026. We do not have forecasts specifically for public sector pay growth beyond 2026-27, so we use forecasts for overall economy wage growth as a guide to the likely trajectory of public sector pay growth. A range of evidence from independent forecasters implies that average earnings growth across the economy is now expected to be much higher over the next few years than the OBR expected in March (HM Treasury, 2026). Independent forecasts collated by the Treasury in August were for average annual earnings growth of around 2.8–3.3% in 2027 to 2029, compared with an average of 2.2% in the OBR’s March forecast.
If public sector pay grew with our estimate of public sector pay growth in 2026–27, then grew in line with the most recent forecasts for economy-wide pay growth from 2027–28 to 2028–29, the paybill across non-devolved areas could rise by £7–9 billion more than our baseline in 2028–29.10
Higher-than-anticipated non-pay inflation
Higher-than-expected non-pay costs can also put pressure on departmental budgets. Departments spend much of the remainder of their budgets on purchasing goods and services. Since budgets are fixed in cash terms, higher-than-expected prices affect how much departments can purchase. There are signs that the GDP deflator – the standard measure of inflation used to assess departmental budgets’ real value – may turn out higher than was expected at last year’s Spending Review. This will, of course, affect tax revenues too, as discussed in Chapter 2 of this Green Budget.
In March 2025, the OBR expected the GDP deflator to cumulatively increase by 8.5% between 2024–25 and 2028–29 (Figure 6.6). By March 2026, this was 9.4%, largely reflecting higher-than-expected inflation in 2025–26. More recent independent forecasts imply cumulative growth of around 10.5% to 12.1% over the same period. This is a relatively substantial rise in inflation, and in inflation expectations, although over the 2021 Spending Review period there was a much larger rise in inflation relative to what was expected when budgets were set (Boileau, Warner and Zaranko, 2024).
Figure 6.6. Successive forecasts for cumulative GDP deflator growth between 2024–25 and 2028–29
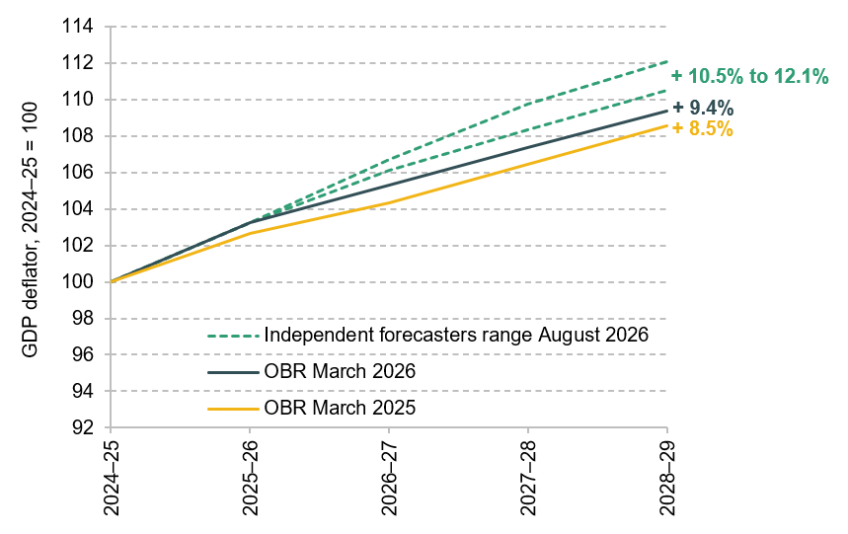
Note: Range from independent forecasters based on second-highest and second-lowest forecast in the database for each financial year.
Source: Authors’ calculations using HM Treasury’s independent forecasts August 2026 and the Office for Budget Responsibility’s Economic and fiscal outlooks March 2025 and March 2026.
Settlements in 2025–26 were therefore less generous in real terms than originally planned and, based on current forecasts, future settlements will also be less generous than originally planned.
To distinguish pressures from higher inflation on non-pay elements of departmental budgets from the pay pressures discussed above, we apply these alternative inflation paths to non-pay day-to-day spending in non-devolved areas and to total capital spending in non-devolved areas. Table 6.1 shows our estimates of the implied non-pay pressures.11 The increase in inflation between the March 2025 and March 2026 OBR forecasts implies that non-pay day-to-day budgets would be worth around £2 billion less in real terms in 2028–29. Under the scenarios constructed from the August 2026 independent forecasts, the reduction compared with the March 2025 OBR forecast would be between £4 and £8 billion. Higher inflation also erodes capital budgets. Relative to the March 2025 forecast, the August 2026 forecasts imply a reduction in their real-terms value of around £2 to £4 billion by 2028–29.
Table 6.1. Estimates of non-pay pressures from higher-than-expected inflation in 2028–29
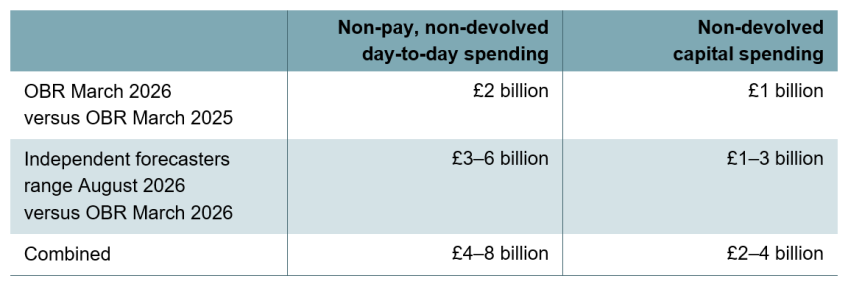
Note: Top-ups to offset these pressures would have to be slightly larger because of Barnett consequentials to devolved governments – this is discussed in Section 6.5. Figures are expressed in cash terms, and may not sum due to rounding.
Source: Authors’ calculations using HM Treasury’s independent forecasts August 2026 and the Office for Budget Responsibility’s Economic and fiscal outlooks March 2025 and March 2026.
Ambitious plans for departmental efficiencies
At the 2025 Spending Review, the government set out a wide-ranging set of plans to improve the productivity of public services. Departments published detailed breakdowns of how they intended to make ‘efficiency savings’ over the course of the parliament, including by procuring inputs more cheaply, investing in digitising and automating processes, and reallocating funding towards more effective programmes. Cuts to central administration budgets were also set out. For more on these plans and their implications, see Harvey-Rich and Warner (2025).
These were large, ambitious plans. Achieving them would mean delivering an average of 1.0% productivity growth in each year of this parliament, compared with a historical average of 0.2% between 1997 and 2019.12 Disappointing productivity growth would make it more expensive than was anticipated at the Spending Review to deliver the same performance from public services, placing pressure on departmental budgets.
Since then, the government has set out two additional sets of savings from further productivity growth. First, at the 2025 Autumn Budget, plans to ‘go further on efficiencies’ included further savings of £2.8 billion in 2028–29 (around 0.5% of departmental budgets), as well as the first set of intended savings for 2029–30 and 2030–31. Second, the recent Defence Investment Plan (Ministry of Defence, 2026) increased the level of savings intended to be made from the MoD’s budget over this parliament. In 2028–29, the department now intends to make £2.1 billion of efficiency savings from its day-to-day budget of £43.7 billion, compared with a £0.9 billion saving for the same year set out at the 2025 Spending Review.
Taken together, changes since the Spending Review have increased the level of annual public sector productivity growth implicit in spending plans from 1.0% to 1.2%. Savings from defence have also become a more significant component of the overall total (although starting from a relatively low base, partly in acknowledgement of further announcements to come).13 Departmental spending plans were already reliant on productivity growth being significantly above the historical average, and now assume even stronger growth.
There are some reasons to be optimistic about the deliverability of these plans. Productivity growth has recently been fairly strong in the English NHS (NHS England, 2026; Office for National Statistics, 2026),14 where a large share of the overall efficiency gains are intended to be made. If this trend continues, productivity growth could meet – or even exceed – the rates that current spending plans rely on.
Yet a number of important risks remain. Potential productivity growth is very uncertain in other departments, and has frequently been negative in the past. For example, more than three-quarters of the efficiency savings for the MoD confirmed in the Defence Investment Plan for 2028–29 are classed as ‘low maturity’, implying that they are not on the verge of being delivered, and that there is substantial risk attached to their successful delivery (Public Accounts Committee, 2026).
Further efficiency plans announced since the Spending Review also came with almost no operational detail on how they are intended to be delivered, in stark contrast to those published at the Spending Review. It is striking that departments were asked to find further savings at the 2025 Autumn Budget less than six months after agreeing detailed three-year plans for productivity improvements. It seems plausible that some of the new planned efficiency gains were a way to rationalise cuts to budgets, rather than assessments of what productivity improvements could realistically be made. If, for whatever reason, these productivity improvements are not made, the government will need to either reduce its level of ambition for public service delivery or increase budgets.
We consider two scenarios. First, if the government delivers only half of its intended savings – which would still mean strong productivity growth by historical standards – current plans for public services would be around £9 billion more expensive to deliver than previously anticipated in 2028–29. If instead, in an even more adverse scenario, public sector productivity grows at its historical rate over this parliament, the corresponding pressure would be around £25 billion. Public sector productivity could also exceed current expectations (such as in a scenario where artificial intelligence can be applied widely and adopted rapidly in the public sector), which would reduce pressure on budgets. But given the level of ambition in existing productivity plans, the risks are mostly on the downside.
Volatile and uncertain areas of spending
SEND demand and implementation risks
Policy – and spending – relating to young people with special educational needs and disabilities (SEND) is one of the areas where the government’s plans have changed most since the Spending Review.
Under the current system, there is a disconnect between the funding local councils receive for SEND and their spending on SEND. Councils receive pre-set funding for SEND provision as part of their annual schools grant and then allocate this funding to schools in order to meet pupils’ needs. Their spending, however, is largely determined by statutory entitlements, rather than the value of the funding received. Many pupils with special educational needs have Education, Health and Care Plans (EHCPs), which give them legal entitlements to specific forms of support.15 Providing this support can require councils to spend more than the funding they receive.
In 2026–27, spending on SEND provision is set to be over £16 billion, a real-terms doubling from its 2015–16 level; the number of young people with EHCPs has grown even faster over the same period. Funding for SEND costs has not kept pace, leading councils to accumulate substantial deficits between SEND spending and funding received16 (see Latimer, Sibieta and Snape (2025) for more detail). The government has committed to cover 90% of deficits accumulated up to March 2026, but arrangements for deficits arising in 2026–27 and 2027–28 – expected to total around £10 billion over these two years – have not yet been confirmed.
From 2028–29, responsibility for meeting all SEND costs will move from councils to the Department for Education (DfE). Ahead of this, around £4 billion of DfE’s existing budget is being reallocated to improve mainstream schools’ baseline SEND provision (e.g. teacher training on SEND). Importantly, this funding is not intended to go towards the costs of delivering support outlined in EHCPs; the intention is to better meet pupils’ needs without them requiring an EHCP. In 2028–29, when SEND costs become DfE’s responsibility, there will be a £3.5 billion top-up to DfE’s day-to-day budget, which we assume will fully go towards meeting the costs of EHCP provision. From 2029–30, a planned set of statutory reforms to EHCPs, with the aim of tightening eligibility and reducing costs, will begin to kick in.
An important question is therefore whether the combined impact of additional mainstream support and the extra £3.5 billion in funding will be sufficient to meet the costs of SEND support in 2028–29, before the main statutory reforms take effect.
One key uncertainty is how the share of pupils with an EHCP will evolve until 2028–29. DfE projects that investment in mainstream schools’ SEND provision will slow down the rise in the share of pupils with EHCPs as more pupils have their needs met by mainstream support. It forecasts that the share of pupils with EHCPs will reach 7.3% in 2028–29 and 7.7% in 2029–30, before falling thereafter (Department for Education, 2026b). We estimate that, if EHCP numbers grow in line with these projections, SEND spending growth will slow between now and 2028–29 (the green line in Figure 6.7).
Figure 6.7. SEND funding and spending, actual and forecast
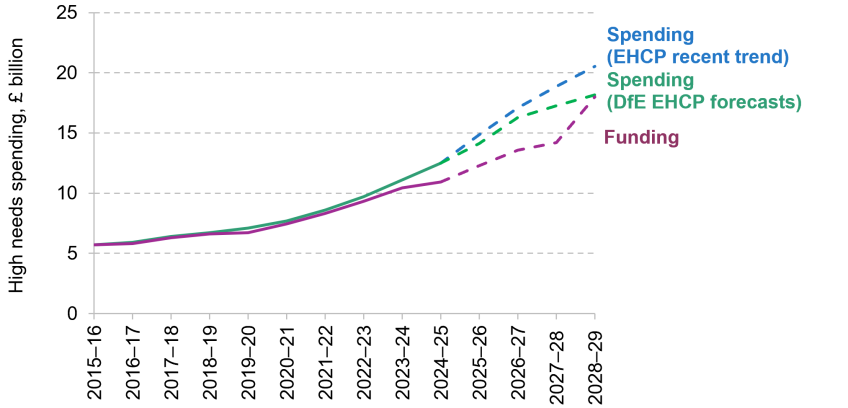
Note: Spending projections are authors’ calculations. The green line combines DfE projections for the share of pupils with an EHCP with our projections of pupil numbers. The blue line instead projects EHCP rates using age-specific cohort trends since 2019 (based on Latimer, Sibieta and Snape (2025)). Both scenarios assume that per-EHCP spending continues to decline slightly in line with recent trends.
Source: Baseline funding is taken from the funding amounts implied by OBR forecasts of SEND spending and deficits, from the Office for Budget Responsibility’s Economic and fiscal outlook – March 2026 for 2015–16 to 2027–28 and November 2025 for 2028–29 – along with an additional £3.5 billion in funding for 2028–29 and the allocated amounts from the Inclusive Mainstream Fund and Experts at Hand grant announced in the SEND White Paper (Department for Education, 2026a).
There are some reasons to think that growth in pupils with EHCPs will not necessarily slow over the next few years. First, more people may rush to secure an EHCP before changes to eligibility are made – there is some early evidence that this may be the case (Adams, 2026). Second, councils have slightly weaker incentives to control SEND spending over the next two years as it is likely that they will not have to bear the costs of SEND deficits (see Farquharson et al. (2025) for more discussion). If EHCP rates were instead to increase at their average pace since 2019, we would expect roughly 8.3% of pupils to have an EHCP in 2028–29. Assuming per-EHCP spending follows its recent trend, the costs of EHCP provision in 2028–29 would be around £20.5 billion in this case (the blue line in Figure 6.7).17
School funding allocations have not yet been set past 2026–27, but if baseline high needs funding18 were to stay flat in real terms, as in the OBR’s projections, then in 2028–29 total high needs funding would come to around £18 billion, shown by the purple line in Figure 6.7. This would be enough to meet forecast spending under DfE’s EHCP projections in 2028–29 (green line). But if EHCP rates grew at their recent pace (blue line), spending could exceed this level of funding by around £3 billion in 2028–29.
Uncertainties over asylum costs falling
Another area of DEL spending where it is difficult to predict and control costs is asylum. The number of people claiming asylum in the UK has risen steeply in recent years, from 45,000 in 2019–20 to 96,000 in 2025–26. Home Office spending on asylum support rose from £0.7 billion in 2019–20 to £4.7 billion in 2023–24 and is budgeted to fall back to £3.6 billion for 2025–26. Spending Review plans assume a further substantial fall in spending to £2.5 billion by 2028–29. This is a particularly difficult area on which to cut spending since the government has relatively few levers to control asylum costs: it can be difficult to control the number of people claiming asylum, and the Home Office has statutory duties towards people seeking asylum in the UK.
Whether plans to substantially decrease asylum spending in the coming years are delivered depends on two key factors: the number of people who have to be supported and the cost of supporting each asylum seeker.
The number of asylum seekers who have to be supported. Figure 6.8 shows how the number of asylum seekers receiving support from the Home Office or awaiting claim decisions has changed over time. The total number of asylum seekers the Home Office is responsible for supporting has fallen from its late 2023 peak, but remains much higher than levels pre-2022. Many of those the Home Office supports are waiting for the results of their asylum claim. Investment in processing capacity has reduced the backlog of claims awaiting an initial decision from the Home Office to less than a quarter of its peak (see yellow line in Figure 6.8). But because many whose claims are initially refused subsequently appeal that decision, pressure has been shifted into the appeals system, with the number awaiting an appeal decision rising sharply (blue line in Figure 6.8). Consequently, the overall number of people supported has been slow to fall and backlogs in the tribunal system have grown (Rizzotti and Tomlinson, 2026).
Figure 6.8. Number of asylum seekers by claim status and accommodation type
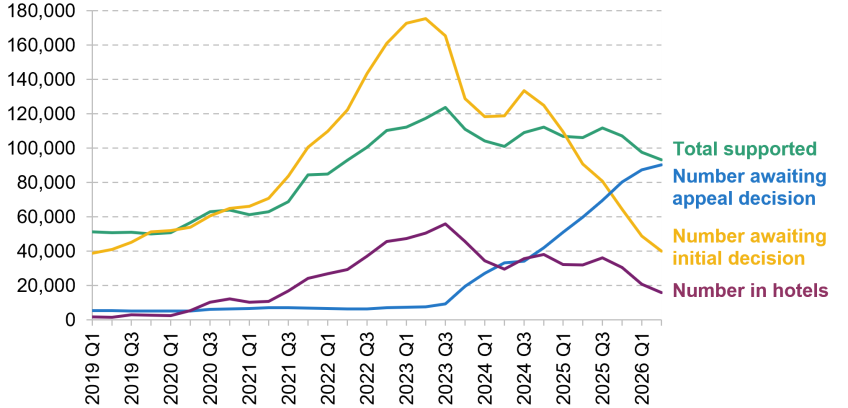
Note: ‘Hotel accommodation’ before 2022 Q4 refers to section 98 accommodation. The Home Office only has a duty to support asylum seekers who would otherwise be destitute, and as such the number supported will be lower than the total number of asylum seekers in the system.
Source: https://www.gov.uk/government/statistical-data-sets/immigration-system-statistics-data-tables#asylum. Tribunal statistics are taken from Asylum and Protection cases in the First-Tier Immigration and Asylum tribunal: https://www.gov.uk/government/statistics/tribunals-statistics-quarterly-april-to-june-2026.
As the Home Office has now largely worked through the backlog of initial decisions that built up in 2022, the number of new appeals is likely to fall over coming quarters, and as a result the tribunals backlog is likely to grow more slowly. Even without an expansion of tribunal capacity, we would therefore expect the total number of asylum seekers requiring support to grow relatively slowly over the next few years, reaching around 95,000 in 2028–29 if arrivals and other features of the asylum system remain at current levels.
The cost of supporting each asylum seeker. Asylum accommodation in hotels, used when the Home Office’s traditional accommodation reaches capacity, is particularly expensive. In 2025, it cost £144 per night to house an asylum seeker in a hotel, compared with around £23 in standard asylum accommodation. Accordingly, in 2024–25, the Home Office spent £2.1 billion on hotels compared with £600 million on other forms of accommodation (National Audit Office, 2025), despite hotels housing only around a third of supported asylum seekers. A central assumption behind the Spending Review settlement was that hotel use will end by 2029.
There has been consistent progress in recent years on both expanding non-hotel accommodation and increasing the number of asylum tribunal decisions. The Home Office has already been able to achieve substantial spending reductions by reducing the use of hotels (see purple line in Figure 6.8). The average number of asylum seekers housed in hotels in 2025–26 was around 30,000, down from 47,000 in 2023–24, due to a combination of fewer people requiring support and more spaces in non-hotel accommodation. The asylum support budget in 2026–27 is also broadly in line with – indeed, slightly below – Spending Review plans.19 If tribunal and non-hotel accommodation capacity were to continue growing at their recent pace, we project that all asylum seekers requiring accommodation could be housed in non-hotel accommodation by 2028–29. There is therefore little evidence so far of significant pressure against the asylum support budget set at the Spending Review.20
There nevertheless remain clear risks. In particular, the number of people who claim asylum remains difficult for the government to control, while tribunal and non-hotel accommodation capacity take time to expand. Housing an additional 10,000 people for a full year would cost around £85 million if in standard accommodation, compared with around £530 million if in hotel accommodation. A sudden increase in arrivals would likely increase the numbers of people housed in hotels, pushing spending up rapidly and creating pressures that would take time to unwind. In addition, faster processing does not necessarily eliminate pressures on spending altogether: some people leaving Home Office accommodation may instead require accommodation support from local authorities, shifting rather than eliminating some costs. Migration also has implications for public spending beyond the asylum system, as discussed in Chapter 5 of this Green Budget.
6.4 Additional spending ambitions
Beyond the pressures against existing budgets and plans for public services, the government may decide to increase some areas of departmental spending or responsibilities beyond what was envisaged at the last Spending Review. In this section, we discuss two important examples: defence and adult social care. Chapter 2 also considers public investment ambitions.
In both these cases, the government has signalled that final decisions about the path of spending are unlikely to be made at the Budget. The Prime Minister has said that the government will determine and announce a path for defence spending to reach 3% of GDP at next year’s Spending Review, and has said that adult social care reform will be introduced in the next parliament, with detail awaiting the Casey Review’s report next summer. While the government need not settle all the details of its public service plans at this Budget – particularly for adult social care – it should set spending totals within which it could credibly conduct the next Spending Review.
Defence ambitions and the path to 3% of GDP
Successive governments have increased defence spending considerably in the last few years: NATO-qualifying defence spending was around 2.1% of national income in 2023–24, and is set to be 2.6% this year.21 As part of the Defence Investment Plan published earlier this year, defence spending was topped up relative to Spending Review plans by an average of £3 billion each year, meaning that spending will reach 2.7% of national income from 2027–28 and stay there until 2029–30. Much of this increase was funded by cutting departmental capital spending elsewhere, but part of this increase (an average of £1 billion each year) is currently unfunded, representing money that the new Chancellor will have to find at the next Budget, whether from tax, borrowing or other spending, if he sticks to existing plans.
But there is evidently domestic and international political pressure to move further and faster on defence spending. John Healey, now Chancellor, resigned as Defence Secretary in June over disagreements with the top-ups to defence spending that would be made alongside the DIP, arguing that the amount of money committed to the defence budget was too small, and writing that ‘I am certain that a headmark date for 3% of GDP on defence in 2030 is what Britain must set’. While the UK has topped up defence spending substantially, other NATO members have recently increased spending as a share of national income more rapidly (Boileau and Warner, 2025).
The previous Labour government committed to spending 3.5% of national income on defence by 2035, alongside NATO allies. This would imply spending around an additional £25 billion each year in today’s terms relative to existing plans (Boileau and Warner, 2026). Since becoming Chancellor, John Healey has said that at next year’s Spending Review he will set out ‘a clear path about how we will meet that NATO commitment in 2035, of 3.5% of GDP. And as part of setting out that clear path, we will set that target date for 3%’ (Reuters, 2026).
The fact that defence spending is currently set to remain at around 2.7% of national income between 2027–28 and 2029–30 (as shown by the green line in Figure 6.9) means that, if the 3.5% commitment is to be reached by 2035 and if current plans are retained over this parliament, increases in defence spending in the next parliament would have to be much faster than in this parliament.
Figure 6.9. Defence spending out-turn, plans and scenarios
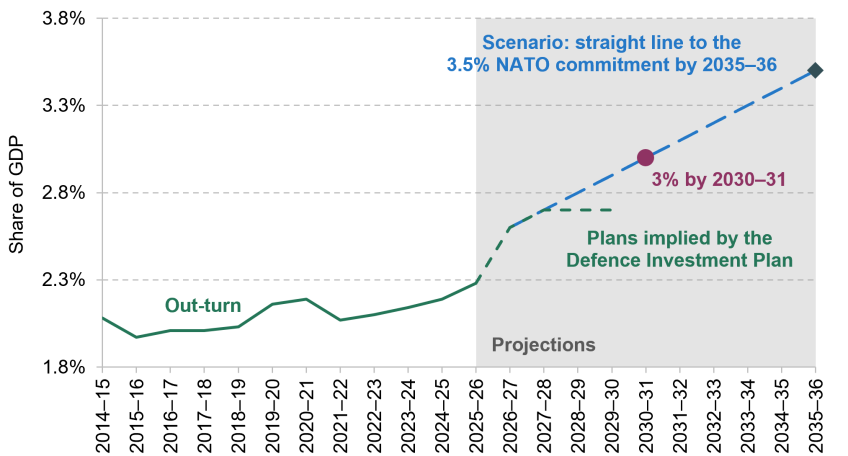
Note: Defence spending here refers to NATO-qualifying defence spending, a broader measure than Ministry of Defence funding alone. DIP plans are rounded to one decimal place, in line with the wording in the DIP funding plan document. Scenario shows a linear path of defence spending to 3% of national income by 2030–31 and to 3.5% of national income by 2035–36.
Source: Authors’ calculations using NATO figures, Defence Investment Plan funding explainer (https://www.gov.uk/government/publications/the-defence-investment-plan/the-defence-investment-plan-funding-explainer) and Office for Budget Responsibility’s Economic and fiscal outlook March 2026.
The government might instead decide to increase defence spending steadily from 2026–27 to 3% of national income by 2030–31; this potential path of spending is illustrated by the blue dashed line in Figure 6.9. This would be in line with the current Chancellor’s stated aims when he resigned as Defence Secretary. This rate of growth in spending as a share of national income would also be consistent with reaching 3.5% of national income spent on defence in 2035–36. This scenario would imply spending around £3 billion more than current plans in 2028–29, £7 billion more in 2029–30 and £11 billion more in 2030–31 than if spending had stayed at 2.7% of national income.
Adult social care reform
In July, one of the Prime Minister’s first announcements on taking office was to emphasise his commitment to improving the quality and accessibility of social care, and to announce that Baroness Casey’s review of the social care system would be brought forward by a year (Prime Minister’s Office, 2026). In his speech to the Labour Party Conference in September, he went further and announced plans to ‘start laying the ground now for the National Care Service’, to be introduced in the next parliament.
The details – and potential spending implications – of what this service could look like remain highly uncertain. Its design will be informed by the recommendations of the Casey Review, due in Summer 2027. Costs could vary significantly depending on the services in scope (such as whether residential as well as home-based care would be covered), the eligibility requirements, and any further bundled reforms (such as higher pay for care workers).
For a sense of scale, local authorities in England currently spend around £30 billion on publicly funded adult social care each year. Alderwick and Allen (2026) estimate that free provision of personal, home-based care (as is currently available in Scotland) to those aged 65 and older could cost around £7.5 billion per year. A broader ‘NHS-style’ system, under which the government covers all care and support costs, could cost closer to £18.5 billion. Such estimates are inherently uncertain, as they will depend in part on how take-up responds to changes in the price and quality of social care available, as well as how population health changes, but are a useful reference point for the potential costs of significant reforms to the adult social care system.
Given the Prime Minister’s stated timeline for the introduction of reforms, these costs provide only a limited guide to how much the government will choose to spend on social care over the next five years. If the government intends to begin introducing the service immediately in the next parliament, spending settlements from 2029–30 would be affected, with exact amounts dependent on what the government chooses to provide, when provision starts and expands, and how take-up responds. But much detail is yet to be worked out, and we should not expect this to take place at this year’s Budget.
6.5 Implications for the Autumn Budget and 2027 Spending Review
At the Autumn Budget, the Chancellor will have to decide whether to revisit detailed departmental budgets between 2026–27 and 2028–29. He could choose to do nothing, letting departments absorb all pressures that materialise; he could keep overall spending totals unchanged, but reopen settlements and move money between departments; or he could top up some or all departmental budgets, increasing total departmental spending.
The Budget would also be a natural time to consider spending envelopes that will be allocated for the first time at next year’s Spending Review. While the Chancellor will not make detailed departmental allocations this autumn, the totals he sets should be consistent with a set of plans that he would be willing to allocate to departments next year and deliver.
Keep plans for total departmental spending unchanged
One option within an unchanged overall spending total is to keep individual departmental budgets the same as inherited plans, and require departments to absorb any pressures that materialise in the years up to 2028–29 within their existing budgets. The Treasury has explicitly indicated that it expects departments to fund pay awards from existing budgets, for example (HM Treasury, 2025). Departments can adjust to a pressure within budgets by reducing the quantity or quality of services they provide, or by finding productivity improvements (beyond the ambitious improvements already assumed in current plans) to allow them to provide the same services with fewer resources. One example of such adaptation is how the NHS in England slowed down growth in hospital activity to stay within budget in 2025–26 (Harvey-Rich and Warner, 2026).
For more demand-led spending where statutory responsibilities exist – on areas such as SEND and asylum – departments have less scope to reduce spending directly. Staying within the relevant budget (the Department for Education, after 2027–28, for SEND; the Home Office for asylum) in the face of growing costs would mean reallocating spending from other programmes within the department. Pupil numbers are expected to fall in the coming years, which could allow DfE to increase SEND funding while keeping per-pupil core schools funding flat in real terms (Sibieta, 2026). This is what has repeatedly occurred over the last decade (Farquharson et al., 2026) and what is likely to occur again when funding allocations are set for 2027–28 onwards. It could be harder for the Home Office to reprioritise within its budget given its other statutory duties – overspends in the early 2020s were mainly funded instead through the Treasury Reserve (Warner and Zaranko, 2024).
There is a strong rationale for requiring departments to manage some pressures that emerge within fixed budgets without top-ups. Doing so avoids reopening departmental spending settlements and the associated bargaining process, maintains the credibility of multi-year budgets, and preserves incentives for departments to control costs. But this does not make the underlying pressure disappear. Instead, public services in those departments hit by larger pressures bear more of the adjustment, rather than the government explicitly reconsidering exactly where any worsening of public service performance is to take place between departments.
The adjustment need not be left concentrated in the departments where pressures arise. Other options – while keeping unchanged the overall spending totals that were set for the years up to 2028–29 – are to reallocate money between departments, or increase individual departmental budgets using the Treasury Reserve. This would allow the government to choose more explicitly which services to protect, weighing reductions in other DfE activities (e.g. schools) to accommodate higher SEND costs, for example, against reductions elsewhere in government. That flexibility comes at the cost of some of the planning certainty and incentives provided by firm departmental budgets. Reallocation between departments could be more challenging for broad-based pay, inflation and public sector productivity pressures, which affect many departments simultaneously. The stated purpose of the Reserve – and its size – makes it inappropriate as a tool for meeting most of these pressures.
The nature of the problem changes after 2028–29. Detailed departmental allocations have not yet been set, so there are no existing departmental budgets to absorb a pressure. Instead, the government is yet to decide how to divide a fixed total between departments. Even before considering any of the pay, productivity or service-specific pressures discussed above, existing totals imply a squeeze for many public services.
Growth in existing departmental envelopes is planned to slow in later years, with annual real-terms growth in total departmental spending between 2027–28 and 2030–31 set to average 0.9%. This relatively slow growth rate in spending will be challenging to allocate between different areas: health spending has tended to grow much more rapidly than this in recent history (Stoye, Warner and Zaranko, 2024); and as discussed in the previous section, there is clear pressure on defence spending in particular.
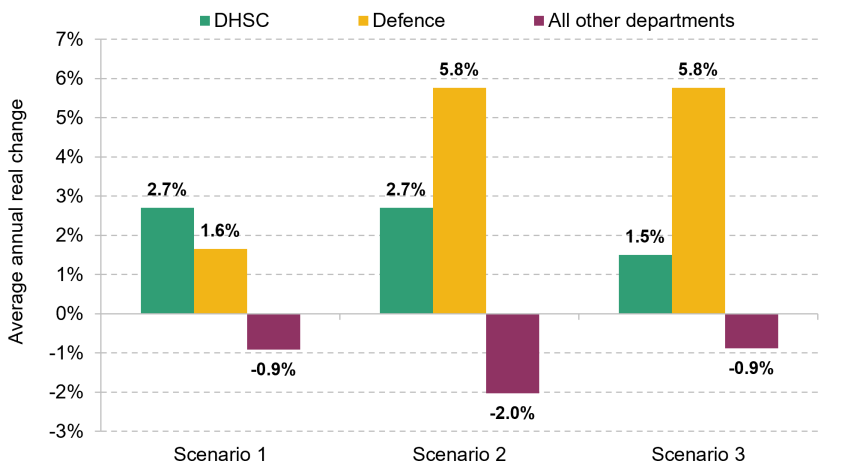
To illustrate the potential challenges posed by this relatively slow growth rate in overall departmental spending, we consider three broad spending scenarios. Figure 6.10 shows average annual real-terms growth rates between 2027–28 and 2030–31 in budgets for DHSC, defence and other areas under these scenarios.22 In all cases, this is total departmental spending (both day-to-day and investment).
Figure 6.10. Scenarios for real-terms growth in departmental budgets between 2027–28 and 2030–31
Note: We here top up total Ministry of Defence spending by the amount implied in the Defence Investment Plan, and keep total departmental spending unchanged. ‘Defence’ refers to the Ministry of Defence and Single Intelligence Account (SIA) combined. Devolved spending through block grants is excluded from ‘All other departments’, as is the Reserve. Real-terms growth rates are calculated using the OBR’s GDP deflator forecast from March 2026.
Source: Authors’ calculations using the Office for Budget Responsibility’s Economic and fiscal outlook March 2026.
In Scenario 1, we assume that Department of Health and Social Care spending grows at 2.7% each year in real terms, in line with its settlement at the last Spending Review.23 We also assume that spending on defence is held flat as a share of national income, consistent with plans in the Defence Investment Plan up to 2029–30 (implying average annual real-terms growth of 1.6%, in line with the OBR’s real GDP forecast). In this scenario, the combined budgets of other departments would need to be cut by an annual average of 0.9% in real terms. Some departments would likely still see budget increases, leading to even steeper real-terms cuts in other areas.
The squeeze on other areas would be greater if the government chose to increase defence spending faster. In Scenario 2, we assume that defence spending instead grows in line with the illustrative linear path discussed in Section 6.4, such that it reaches 3% of national income by 2030–31. This would mean annual average spending growth of 5.8% in real terms between 2027–28 and 2030–31.24 If we continue to assume that real-terms health spending grows by 2.7% per year, the combined budgets of other departments face a much steeper average real-terms cut of 2.0% per year between 2027–28 and 2030–31.
Of course, the government could choose to slow health spending growth to help accommodate higher defence spending. Scenario 3 shows one way in which this could happen. In this scenario, the government increases health spending by only 1.5% per year in real terms between 2027–28 and 2030–31. This growth rate would be very low by recent historical standards, and would make the government’s existing targets for NHS performance harder to achieve. Even with slower health spending growth, rising spending on defence would still leave other departments facing real-terms cuts on average from 2027–28 to 2030–31.25
These scenarios illustrate the broader fiscal challenge entailed in increasing both health and defence spending simultaneously. For much of the post-war period, defence spending fell as a share of national income, a decline often referred to as a ‘peace dividend’ (Boileau and Warner, 2025). This fall allowed health spending to rise substantially over the same period without corresponding increases in the overall size of the state. If both health and defence spending are now to rise together, other areas are likely to be squeezed, or further upward pressure be placed on the size of the state.
Change planned total departmental spending
The Chancellor could instead choose to increase total departmental spending. This could be financed through lower spending elsewhere (e.g. cuts to benefits), higher taxes or additional borrowing. These choices are described further in Chapter 2 of this Green Budget. Top-ups could be motivated by various factors: in order to preserve public service performance as envisaged at last year’s Spending Review in the face of cost or public sector productivity pressures; in order to fund new ambitions, such as for defence or social care; or in order to avoid the squeeze on public services towards the end of the parliament. Of course, the government could instead decide to cut departmental spending totals, as Rachel Reeves did at the Autumn Budget last year. If it did this, the government should set out where it expects departments to do less, or how existing pressures can be mitigated through other means.
Table 6.2 brings together estimates of the additional departmental spending that could be required to compensate departments for the pressures discussed above or to fund new government ambitions. These are not forecasts of how much spending needs to increase, and the rows cannot simply be added together (as some are alternative scenarios and some overlap). Rather, they illustrate the scale of the choices facing the Chancellor at this Budget and at the next Spending Review. Some of these top-ups would fall on capital rather than day-to-day budgets – parts of the inflation and defence top-ups, in particular. They therefore would not translate one-for-one into a reduction in headroom against the government’s fiscal rule that it must be running a current budget surplus in 2029–30 (i.e. that revenues must exceed day-to-day spending).
Table 6.2. Illustrative top-ups to total departmental spending to compensate for emerging pressures or to fund new ambitions, 2028–29 to 2030–31
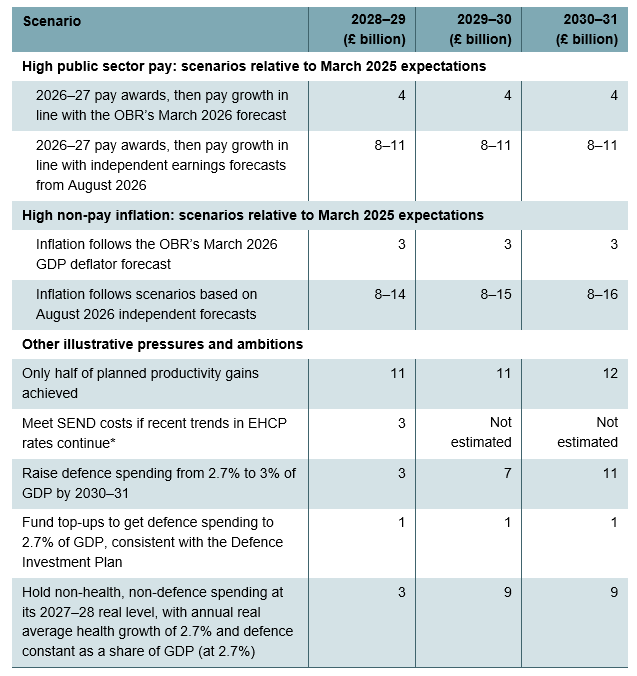
* SEND pressures are not estimated after 2028–29, as policy changes significantly at this point (see Section 6.3).
Note: 2028–29 figures are generally higher than the numbers quoted in earlier sections as Barnett consequentials of top-ups are included. Illustrative totals cannot be derived from the table information alone, as some compensation for public sector pay and productivity pressures would go to defence budgets, and so reduce the additional funding required to reach the illustrative defence target. Inflation here refers to the GDP deflator. Productivity and public sector pay pressures are grown with RDEL growth to estimate figures in 2029–30 and 2030–31. Inflation pressures are calculated in each year using the OBR’s March 2025 long-term economic determinants (available at https://obr.uk/efo/economic-and-fiscal-outlook-march-2025/). Social care reform is not included in the table as the precise design of reform is not yet known and has large implications for cost.
Source: Authors’ calculations.
Potential top-ups could be sizeable in the final year for which detailed budgets are allocated, 2028–29. Compensating departments if only half of planned productivity improvements materialised could require around £11 billion. For non-pay inflation, compensation for the increase forecast by the OBR between March 2025 and March 2026 could require £3 billion; under more recent forecasts for inflation, this could rise to between £8 and £14 billion.26 Higher-than-anticipated public sector pay growth in 2026–27 could require £4 billion in compensation if subsequent pay grew according to the OBR’s March 2026 forecast, or between £8 and £11 billion if it followed more recent forecasts for whole-economy earnings growth. Compensating DfE for faster growth in SEND spending than expected could add around £3 billion.
Many of these pressures would carry into 2029–30 and 2030–31. A higher level of public sector pay permanently raises the paybill; a failure to achieve planned productivity improvements leaves departments needing more inputs to deliver a given level of public services; a permanently higher price level reduces cash budgets’ purchasing power in future years. In later years, the Chancellor also faces the planned slowdown in departmental spending growth. If the government wanted to keep defence spending constant at 2.7% of GDP, increase health spending by 2.7% per year in real terms (in line with its settlement at the last Spending Review), and avoid real-terms cuts to other departments, it could need to top up overall departmental spending by £9 billion in 2030–31. Funding a rise in defence spending to 3% of GDP in 2030–31 could mean a further £11 billion of departmental spending in 2030–31.
While these different pressures and ambitions cannot all straightforwardly be added together, illustrative combinations show how quickly the numbers can grow. Increasing defence spending to 3% of GDP in 2030–31 could require around £11 billion more defence spending in that year relative to holding spending constant as a share of national income (Scenario A in Figure 6.11). If health spending were additionally increased in real terms by 2.7% per year, holding the combined budgets of other departments flat in real terms over the next Spending Review period would require a further £9 billion. Together, these choices imply around £20 billion of additional spending in 2030–31 (Scenario B in Figure 6.11).
Figure 6.11. Scenarios for departmental top-ups in 2030–31
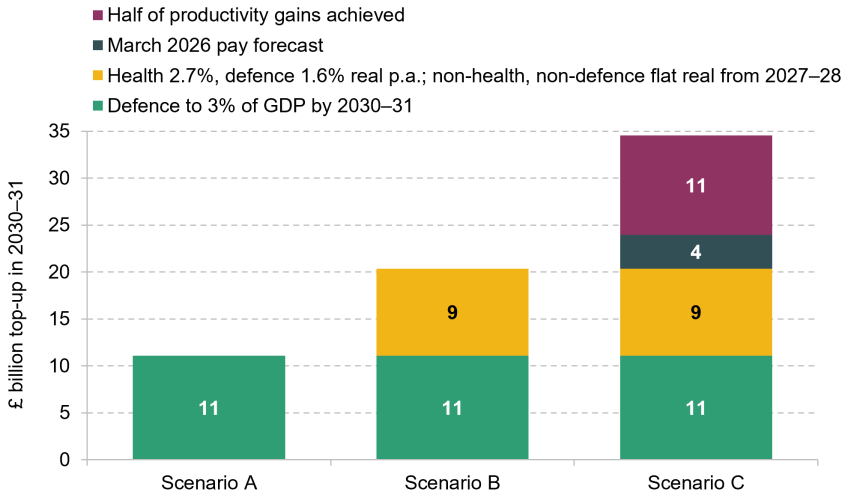
Note: As for Table 6.2. Pay and productivity numbers are slightly lower as they exclude parts of the top-up that would otherwise go to the Ministry of Defence or Single Intelligence Account budgets. The 1.6% average annual real growth for defence is consistent with spending on defence being held flat at 2.7% of national income.
Source: Authors’ calculations.
That would still leave departments to absorb the pay, price and productivity pressures examined in Section 6.3. The government could also choose to compensate departments for higher-than-expected pay growth, which would imply an additional £4 billion in 2030–31 if pay were to grow by the 2026–27 pay awards, then as forecast by the OBR in March 2026. If departments only achieved half of planned productivity gains, the government would need to top spending up by an additional £11 billion in 2030–31 to keep service quality unchanged. Other combinations of pressures could justify top-ups of a similar order of magnitude to this £15 billion figure for pay and productivity: for example, compensating departments for a higher pay scenario combined with non-pay inflation changes between March 2025 and 2026, or just for the higher end of August 2026 inflation forecasts alone. Additional top-ups of this size, on top of the defence and health scenarios above, would imply a total top-up of around £35 billion (Scenario C in Figure 6.11).
Topping up departmental budgets to compensate them for emerging pressures and new policy priorities could therefore amount to tens of billions of pounds by 2030–31. Even top-ups of this scale would not leave departmental spending growing particularly fast between 2025–26 and 2030–31 by historical standards. Topping up total departmental spending by £35 billion in 2030–31 would mean average annual real growth over this period of 2.3%, very close to average annual growth in total departmental spending between 1998–99 and 2025–26 of 2.4%.
6.6 Conclusion
The Chancellor faces difficult choices at the Autumn Budget. Emerging pressures against departmental budgets, the sharp slowdown in planned spending growth in later years, and the costs of new ambitions all make inherited plans harder to deliver. He must decide how far to revise existing departmental budgets in response, and what day-to-day and capital spending totals to set up to 2031–32. If the inherited spending framework is retained, this Budget will finalise the spending totals which next year’s Spending Review will allocate to departments, making these choices particularly consequential.
The Chancellor need not settle every detail about departmental spending this autumn. But he should explain how the government’s broad ambitions for public services can be delivered within the spending totals set. If inherited spending totals are not revised, he should signal where he intends the resulting squeeze to fall in the coming years. If he already expects to increase spending for next year’s Spending Review, that increase should be reflected in the totals set at the Budget. Postponing the increase until next year would understate future spending and present an unduly favourable picture of the public finances. Plans for the public finances that rest on spending totals inconsistent with the government’s own ambitions for public services are unlikely to be seen as credible.
The amounts at stake are potentially large. Under our illustrative scenarios, raising defence spending to 3% of national income by 2030–31, increasing health spending by 2.7% annually in real terms, and avoiding a real-terms squeeze on departments outside defence and health over the next Spending Review period could require a top-up of around £20 billion in 2030–31. The number rises to around £35 billion if departments were also compensated for plausible pay and productivity pressures. A top-up of this size is not inevitable: the government could instead ask departments to absorb pressures or reprioritise within services, or it could scale back ambitions for public services. But the underlying trade-offs cannot be avoided. The central choice, and one that the Chancellor should make explicitly in the autumn, is where the adjustment should fall: within public services, elsewhere in government spending, or through higher taxes or borrowing.
References
Adams, R., 2026. Pupils with Send plans in England likely to double to one in 10 in rush for support. Guardian, 6 September, https://www.theguardian.com/education/2026/sep/06/schools-england-report-surge-send-applications.
Alderwick, H. and Allen, L., 2026. Social care funding: options for reform. Health Foundation, https://www.health.org.uk/features-and-opinion/blogs/social-care-funding-options-for-reform.
Boileau, B. and Warner, M., 2025. UK defence spending: composition, commitments and challenges. IFS report, https://ifs.org.uk/publications/uk-defence-spending-composition-commitments-and-challenges.
Boileau, B. and Warner, M., 2026. Initial response to the Defence Investment Plan. IFS comment, https://ifs.org.uk/articles/initial-response-defence-investment-plan.
Boileau, B., Warner, M. and Zaranko, B., 2024. Options for the 2024 Spending Review and beyond. IFS report, https://ifs.org.uk/publications/options-2024-spending-review-and-beyond.
Cattan, S., d’Este, R., Domínguez, M., Facchetti, E., Logani, I., Macchiavello, R., Pesenti, O., Rasul, I., Rizzotti, L., Tomlinson, J. and Villa, C., 2026. Resources and the justice system. IFS report, https://ifs.org.uk/publications/resources-and-justice-system.
Crawford, R., Johnson, P. and Zaranko, B., 2018. The planning and control of UK public expenditure, 1993−2015. IFS report, https://ifs.org.uk/publications/planning-and-control-uk-public-expenditure-1993-2015.
Department for Education, 2026a. Every child achieving and thriving. https://www.gov.uk/government/publications/every-child-achieving-and-thriving/every-child-achieving-and-thriving-html-version.
Department for Education, 2026b. Annex – background on projections. https://assets.publishing.service.gov.uk/media/69987b40bfdab2546272c096/Background_on_projections.pdf.
Emmerson, C., Johnson, P. and Zaranko, B., 2024. Public finances and the 2024 general election. IFS comment, https://ifs.org.uk/articles/public-finances-and-2024-general-election.
Farquharson, C., 2025. Popularity of new childcare entitlements could leave spending much higher than initially forecast. IFS comment, https://ifs.org.uk/articles/popularity-new-childcare-entitlements-could-leave-spending-much-higher-initially-forecast.
Farquharson, C., Ogden, K., Phillips, D., Sibieta, L. and Snape, D., 2025. The hardest questions for SEND are still to be answered. IFS comment, https://ifs.org.uk/articles/hardest-questions-send-are-still-be-answered.
Farquharson, C., Ogden, K., Ornadel, N., Ridpath, N., Sibieta, L., Snape, D. and Tahir, I., 2026. Annual report on education spending in England: 2025–26. IFS report, https://ifs.org.uk/publications/annual-report-education-spending-england-2025-26.
Harvey-Rich, O. and Warner, M., 2025. The outlook for public sector productivity. IFS report, https://ifs.org.uk/publications/outlook-public-sector-productivity.
Harvey-Rich, O. and Warner, M., 2026. Is the era of annual NHS top-ups over? IFS comment, https://ifs.org.uk/articles/era-annual-nhs-top-ups-over.
HM Treasury, 2025. Economic evidence to the Pay Review Bodies 2026-27 pay round. https://www.gov.uk/government/publications/economic-evidence-to-the-pay-review-bodies-2026-27-pay-round/economic-evidence-to-the-pay-review-bodies-2026-27-pay-round.
HM Treasury, 2026. Forecasts for the UK economy: August 2026. https://www.gov.uk/government/statistics/forecasts-for-the-uk-economy-august-2026.
Latimer, E., Sibieta, L. and Snape, D., 2025. Support for children with disabilities and special educational needs. IFS report, https://ifs.org.uk/publications/support-children-disabilities-and-special-educational-needs.
Ministry of Defence, 2026. The Defence Investment Plan. https://www.gov.uk/government/publications/the-defence-investment-plan.
National Audit Office, 2025. Data visualisation: an analysis of the asylum system. https://nao-mesh.shinyapps.io/Asylum_Systems_Data_Visualisation/.
NHS England, 2026. NHS productivity growth estimates - March 2026 (final revised). https://digital.nhs.uk/data-and-information/publications/statistical/mi-nhs-productivity-growth-estimates/march-2026-final-revised.
Northern Ireland Office, 2026. UK Government offers over £1.5bn to the Northern Ireland Executive. https://www.gov.uk/government/news/uk-government-offers-over-15bn-to-the-northern-ireland-executive.
O’Brien, L. and Zaranko, B., 2023. A reduced discount rate for public sector pensions will add billions to employer costs. IFS comment, https://ifs.org.uk/articles/reduced-discount-rate-public-sector-pensions-will-add-billions-employer-costs.
Office for National Statistics, 2026. Public service productivity, quarterly, UK: January to March 2026. https://www.ons.gov.uk/economy/economicoutputandproductivity/publicservicesproductivity/bulletins/publicserviceproductivityquarterlyuk/januarytomarch2026.
Phillips, D., 2026. New councillors, same old challenges. IFS comment, https://ifs.org.uk/articles/new-councillors-same-old-challenges.
Prime Minister’s Office, 2026. Prime Minister’s speech on social care – 29 July 2026. https://www.gov.uk/government/speeches/prime-ministers-speech-on-social-care-29-july-2026.
Public Accounts Committee, 2026. Oral evidence: affordability of the Defence Investment Plan. https://committees.parliament.uk/oralevidence/18004/html/.
Reuters, 2026. UK finance minister to set out ‘clear path’ to higher defence spending in spring. https://www.reuters.com/business/aerospace-defense/uk-finance-minister-set-out-clear-path-higher-defence-spending-spring-2026-09-01/.
Rizzotti, L. and Tomlinson, J., 2026. What is driving increases in tribunal backlogs? IFS report, https://ifs.org.uk/publications/what-driving-increases-tribunal-backlogs.
Sibieta, L., 2026. The outlook on school funding in England. IFS report, https://ifs.org.uk/publications/outlook-school-funding-england.
Stoye, G., Warner, M. and Zaranko, B., 2024. The past and future of UK health spending. IFS report, https://ifs.org.uk/publications/past-and-future-uk-health-spending.
Warner, M. and Zaranko, B., 2024. Home Office budgeting and asylum overspends. IFS comment, https://ifs.org.uk/articles/home-office-budgeting-and-asylum-overspends.
Acknowledgements
This chapter has been produced as part of the IFS Green Budget 2026. The 2026 edition of the IFS Green Budget is funded by the Nuffield Foundation, Barclays and the Economic and Social Research Council (ESRC) through the Centre for Microeconomic Analysis of Public Policy (CPP). IFS is an independent Research Institute. As with all pieces of work, IFS has full editorial control over its analysis and conclusions. In addition to providing funding, Barclays authors will write chapters for the 2026 Green Budget, covering topics (the macroeconomic outlook, Asset Purchase Facility and bond markets) where their expertise complements that of IFS.
Endnotes
Authors

Bee Boileau
Bee joined the IFS in 2021 as a Research Economist and works in the Retirement, Saving and Ageing sector.

Olly Harvey-Rich
Olly joined the IFS in 2024 and works in the Healthcare sector.

Darcey Snape
Darcey joined the IFS in 2024 as a research economist in the Education and Skills sector.
More from IFS
Understand this issue


Policy analysis


Academic research


