Downloads
Download the report as a PDF
PDF | 1.79 MB
This government – like its predecessor – has set out ambitious plans to increase UK defence spending. If met, these plans will have a major impact on the public finances, both in this parliament and in the longer term, and have the potential to reshape the British state. In this chapter, we examine the past and future of defence spending, and consider the fiscal and economic consequences of the government’s commitments.
Key findings
- In 2024–25, the UK spent £66 billion (2.3% of national income) on defence. Defence spending has risen substantially in real terms over time, but by less than economic growth, and so has declined as a share of national income in the decades after the Second World War – a decline often referred to as the ‘peace dividend’. In 1955–56, for example, the UK spent 7.6% of GDP on defence, and in 1990–91 it spent 3.2%. A sustained increase in defence spending as a share of national income would be a break from this historical decline.
- The composition of the defence budget is changing. The proportion of funding allocated to capital investment, rather than day-to-day spending, stayed constant at around 25% between 2002–03 and 2019–20. It then climbed to 35% in 2023–24, and is set to rise to 43% by 2028–29. This is reflected in the growing share of total funding allocated to military equipment and the declining share going towards personnel.
- For a long time, the UK had the second-largest defence budget in NATO, but in 2024 the UK was overtaken by Germany. The US spends around ten times more than the UK or Germany: US spending represented almost two-thirds of the total amount spent by NATO allies in 2024. The UK spent a larger share of GDP on defence (2.3%) than France (2.0%), Germany (2.0%) and the non-US NATO average (2.0%) in 2024. The UK also spends a larger share of its defence budget on major equipment than many countries – including the US – though this is in part due to the costs of the nuclear deterrent. Around half of spending on defence equipment was on the nuclear deterrent in 2023–24. The UK spends a smaller share of its defence budget on personnel than many other countries.
- The government has committed – as part of a NATO agreement – to increasing defence spending to 3.5% of GDP by 2035, and has already set out the path to hit 2.6% by 2027. This increase is equivalent to £36 billion, or £500 per person, a year in current terms. The Strategic Defence Review, published in June, set out a number of ambitions to improve and reform military capabilities, arguing that they could be delivered within this planned increase in defence spending. Many European countries – including Germany and Poland – have set out plans to increase spending as a share of national income further and faster, often from lower starting points.
- At the Spending Review (before the 3.5% commitment was made), the government set out plans for the level of day-to-day defence spending to 2028–29 and capital spending to 2029–30. Current plans imply that defence spending will stay flat as a share of GDP (at 2.6%) between 2027–28 and 2028–29. There is a case for continuing to increase defence spending steadily towards the 3.5% target for 2035 over time, rather than delaying any further increases until the 2030s – not least due to the higher perceived risk of conflict and the challenges of ramping up spending very rapidly. That would, however, add to the government’s fiscal challenges during this parliament.
- Falling defence spending in recent decades has allowed spending to increase in other areas – such as health and social security – without the size of the state increasing as much as it otherwise would have. But we are now likely to see health and defence spending rising simultaneously. When defence spending was last at 3.5% of GDP, in 1987–88, health spending stood at 4.0% of GDP. We project that by 2035 – when defence spending is planned to return to 3.5% of GDP – health spending could stand at 9.2% of GDP.
- Future governments have three broad options to pay for higher defence spending by 2035. The first is to reduce spending on other areas, in order to limit the increase in the overall size of the state. The second is to increase tax revenues to fund the increased spending. The third option is to borrow to fund the increased spending on defence. Borrowing for a permanent increase in defence spending is unlikely to be sustainable, and would be hard to justify on the grounds that defence spending will boost long-term economic growth. There could be a case for using increased borrowing in the short term as a means of delivering immediate increases in spending while more gradually increasing taxes or cutting non-defence spending, but this would need to be weighed against the risks of borrowing more in a delicate, febrile fiscal environment. Alternatively, future governments may decide to scale down plans for defence spending.
- In practice, the government may struggle to spend all of the announced increase in defence budgets – and particularly may struggle to spend it well given past procurement challenges. Ultimately, the goal is an increase in defence capabilities, and the link between an increased budget and the resulting capabilities is not automatic. Increased international competition, as other countries simultaneously increase their own levels of defence spending, may mean that prices for defence procurement increase if production capacity cannot increase sufficiently fast.
- The government has emphasised the growth opportunities from higher defence spending. These could come through higher spending on defence research and development (R&D), or – given that the UK is a major defence exporter – higher overseas demand for UK defence firms’ output. But given the size of defence R&D and exports relative to the total size of the economy, neither of these channels is likely to be transformative for growth. Some regions might particularly benefit: the South West, South East and North West of England currently receive the highest per-person levels of UK defence spending with industry. But it is far from obvious that defence spending is more growth-friendly than other areas where public money could otherwise be spent, such as transport or education. Impacts on growth will also depend on how higher defence spending is funded.
7.1 Introduction
For decades, UK defence spending has fallen as a share of public spending and national income. But that trend is now set to reverse, with both the last and current governments making commitments to increase defence spending substantially. This reversal is a major fiscal issue: it will add to the numerous pressures on the public finances, both within this parliament and in future parliaments.
The UK spent 2.3% of national income on defence in 2024–25. This is set to rise to 2.5% (2.6% including the security services) by 2027–28. At the NATO (North Atlantic Treaty Organisation) Summit in June, the Prime Minister announced that ‘core’ defence spending will reach 3.5% of national income by 2035. NATO allies also committed to spending 1.5% of national income on wider ‘resilience and security’. We have less detail on this spending, but the government has suggested it will be met within pre-existing spending plans. Throughout this chapter, we focus on ‘core’ defence spending.
Much of this increase in defence spending has been motivated by a perceived increase in the risk of conflict – most notably following the full-scale invasion of Ukraine by Russia – and a perceived weakening of support for NATO from the US. In February 2025, when the increase in defence spending to 2.5% of GDP by 2027 was announced, Keir Starmer described ‘a world where everything has changed’. The government’s Strategic Defence Review, published in June 2025, argued that ‘for the first time since the end of the Cold War, the UK faces multiple, direct threats to its security, prosperity, and democratic values’. There remains clear pressure on the government to go further and faster than current plans, as many European countries are doing.
In this chapter, we examine the fiscal consequences of the government’s plans and ambitions for defence spending. We start in Section 7.2 by considering how the level and composition of defence spending have changed over time, before looking at how the UK compares internationally on defence spending – both within and outside of NATO.
We next consider the government’s plans for defence spending and military capabilities in Section 7.3. At the Spending Review, the government set out plans for defence spending up to 2028–29 for day-to-day spending and 2029–30 for capital spending. These plans imply that defence spending will stay flat as a share of national income between 2027–28 and 2028–29. Therefore there will very likely be pressure on the government to top up defence spending plans for 2028–29 at the 2027 Spending Review, and at that point it will also need to set out more of the pathway to 3.5% by 2035. With this in mind, we then consider how the government’s plans for defence spending over the next decade compare with those set out by other countries.
Next, we look at the longer-run fiscal consequences of higher defence spending in Section 7.4, taking government policy as stated. In recent decades, the fall in defence spending as a share of GDP has allowed successive governments to increase spending on other areas without increasing the size of the state as much – the so-called ‘peace dividend’. But this is set to reverse, with defence spending growing at the same time as other areas such as health spending. To deliver the 3.5% commitment, future governments will need to either reduce spending on other areas or increase the size of the state – funding the latter through increasing taxes or borrowing. We discuss the merits of these options, with a particular focus on the merits of arguments for funding higher defence spending through higher borrowing.
Finally, we discuss further challenges and opportunities associated with increased defence spending in Section 7.5. A first challenge is the difficulty of translating higher planned spending into increased military capabilities. A second issue – both challenge and opportunity – is the link between higher defence spending and economic growth, which has been emphasised by this government. Section 7.6 concludes.
7.2 A beginner's guide to defence spending
How much do we spend on defence, and how has that changed over time?
The question of how much the UK government spends on defence is not entirely straightforward to answer. There are various definitions of defence spending that are suited for different purposes and are often used in different contexts. In this section, we examine several common definitions of defence spending and consider how spending has changed over time on these measures.
One natural measure of defence spending in the UK is the amount spent by the Ministry of Defence (MoD), the government department responsible for defence policy and the armed forces. In 2024–25, this was £60.3 billion. Throughout, we refer to this as the departmental definition of defence spending.1
The United Nations (UN) sets out guidelines for an internationally comparable classification of spending into different categories, called the Classification of the Functions of Government (COFOG). Under this system, the definition of defence spending is slightly different from the departmental definition: it includes some items not part of MoD, such as security and intelligence spending and civil defence, and excludes some components of the MoD budget, such as spending on war museums and some war pensions spending. According to this definition, the UK spent £63.6 billion on defence in 2024–25, £3.3 billion more than the departmental definition. Throughout, we refer to this as the functional definition of defence spending.
Another definition of defence spending is ‘NATO-qualifying’ defence spending, a measure of defence spending common across NATO allies and used to assess performance against NATO spending commitments. This is currently a broader definition than the departmental and functional definitions of defence spending, as it includes additional items (in particular, all spending on the pensions of military personnel). According to this definition, the UK spent £65.8 billion on defence in 2024–25, £2.2 billion more than under the functional definition and £5.5 billion more than under the departmental definition. It is this measure that is the subject of government commitments to increase defence spending to 2.5% or 3.5% of national income. Throughout, we refer to this measure as the NATO definition of defence spending (or NATO-qualifying defence spending).
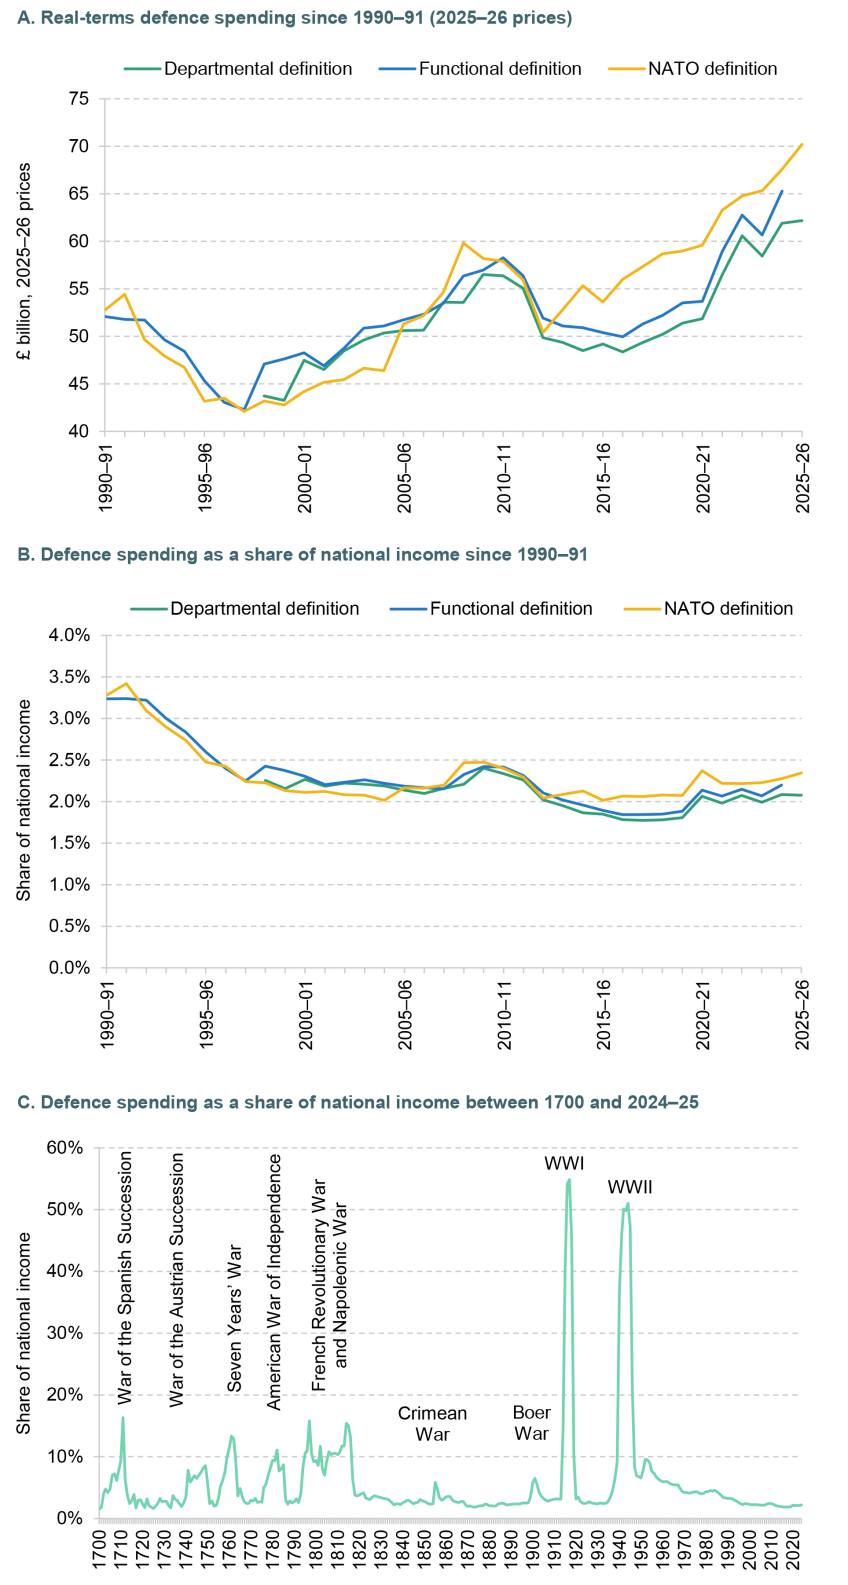
Figure 7.1 shows how defence spending on these different definitions has changed over time. Panel A shows the real-terms value of defence spending since the 1990s. Defence spending has mostly increased in real terms since the 1990s, with falls in the early and mid 1990s, rapid increases during the 2000s (during which the UK was involved in conflicts in Afghanistan and Iraq), falls in the early 2010s and then increases again in the second half of the 2010s (with larger increases under the NATO definition). In other words, the UK spends much more on defence than it has in the past in real terms.
Figure 7.1. Defence spending over time
Note: Departmental definition is for MoD only and takes plans as of Spending Review 2025 and adjusts spending backwards using growth rates from old Public Expenditure Statistical Analyses (PESAs). MoD spending is adjusted to account for changes to employer National Insurance contributions, Machinery of Government changes, increased pension contributions (SCAPE), and budget cover transfers in 2023–24. Functional line takes out-turns directly from PESAs (various). NATO line is drawn from various NATO documents; figures for 2024–25 and 2025–26 are estimates on 3 June 2025. The definition of NATO-qualifying defence spending most notably shifted in 2005, when military pensions began to be included. Panel C uses the functional definition of defence spending.
Source: Authors’ calculations using: HM Treasury, PESAs (various), Autumn Budget 2024, Spring Statement 2025 and Spending Review 2025; GDP deflator as of 30 June 2025; Office for Budget Responsibility, Fiscal Risks and Sustainability – July 2022; and NATO, Defence Expenditure of NATO Countries (2014–25).
However, the size of the economy has also grown in real terms over time, meaning that the trends in defence spending as a share of national income – the proportion of available resources in the UK economy that are allocated to defence – look rather different. These are shown in Panel B. Although defence spending has tended to rise in real terms over time, this has mostly been offset by a rapidly growing economy, and so defence spending has tended to fall as a share of GDP. In 1990–91, just after the Berlin Wall fell, NATO-qualifying defence spending stood at 3.3% of GDP, while in 2024–25 it stood at 2.3%.
For more historical context, Panel C shows defence spending (using the functional definition) as a share of national income over a much longer time horizon, starting in 1700. There have been large changes in defence spending over time, with significant increases in wartime, particularly during the two World Wars. There is a clear decline in defence spending as a share of national income since World War II – this is often termed the ‘peace dividend’.
What is the defence budget spent on?
Beyond the total level of spending, what really matters is what defence budgets are spent on and how that translates into defence capabilities. In this subsection, we consider various ways of decomposing UK defence spending.
Capital versus day-to-day spending
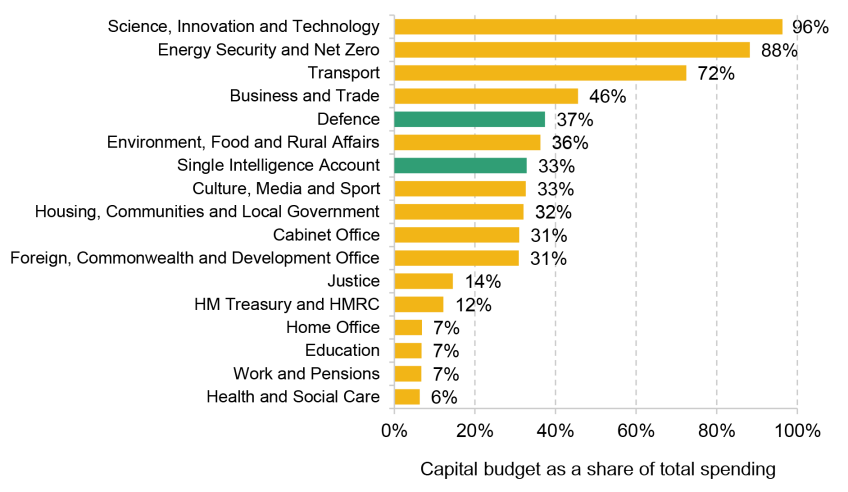
One important distinction in the UK public spending framework is between capital and day-to-day spending, with budgets set separately for each. Both the Single Intelligence Account (SIA), which funds the UK’s security and intelligence agencies, and the Ministry of Defence are relatively capital intensive, in that a large share of their total spending is on investment (e.g. purchasing new aircraft carriers or submarines) rather than day-to-day spending (e.g. paying soldiers’ wages). Figure 7.2 shows the planned capital intensity – the fraction of the total budget going towards capital – of each government department in 2025–26. As shown, the SIA is the seventh-highest department by capital intensity and the MoD is the fifth-highest.
Figure 7.2. Planned capital intensity by department in 2025–26
Source: Authors’ calculations based on HM Treasury, Spending Review 2025.
In absolute terms, the MoD has the largest capital budget of any government department. In 2025–26, its capital budget is planned to be £23.2 billion, followed by £21.8 billion for the Department for Transport and £14.7 billion for the Department for Science, Innovation and Technology. The capital budget of the SIA is set to be £1.5 billion in 2025–26.
Because defence spending is so capital intensive, the history of defence spending is particularly important, rather than the level of spending in one single year. The amount of currently usable equipment depends not just on capital spending this year, but also on the level of capital spending in many previous years (as well as how equipment loses value, or depreciates, over time).
Figure 7.3 shows the real-terms accounting value of total fixed assets owned by the MoD between 2009–10 and 2023–24. This accounts for annual investment spending on assets and the rate at which different assets are assumed to lose value. The real-terms value of total assets fell during the 2010s, not regaining its 2009–10 level until 2019–20. In recent years, the value of fixed assets has risen, reflecting higher capital investment.
Figure 7.3. Real-terms value of MoD’s total non-current assets and property, plant and equipment, 2009–10 to 2023–24

Source: Authors’ calculations using Ministry of Defence accounts (various) and the GDP deflator as of June 2025.
This measure of total fixed assets includes a range of assets, including intangible assets – primarily the development costs of major equipment – and leases for property, mostly housing for service personnel. The chart also shows a particularly relevant set of assets: property, plant and equipment. This is the largest subset of fixed assets (representing 74% of fixed assets in 2023–24), and includes items such as aircraft, submarines, buildings and weaponry. The patterns for these assets look similar to those for total assets, with an initial decline in value in the first half of the 2010s and an increase thereafter.
NATO breakdown
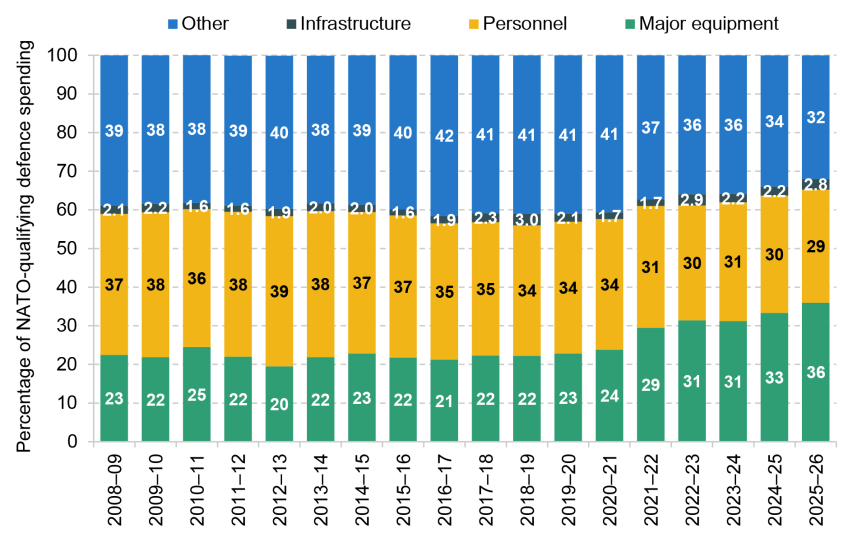
NATO also produces a breakdown of defence spending (using its definition of total defence spending) into four broad categories: major equipment, personnel, infrastructure and other costs. Major equipment was planned, as of June 2025, to account for the largest share of the UK’s defence spending (36% of spending) in 2025–26 and personnel a further 29%. Infrastructure is planned to be 3% of spending, and ‘other’ items – including operations and maintenance costs, non-major-equipment R&D (research and development) and a residual – represent the remaining 32%.
Figure 7.4 shows how the allocation of the UK’s NATO-qualifying defence spending has changed over time. The share of spending on personnel has fallen substantially, from 37% of total spending in 2014–15 to 29% in 2025–26. ‘Other’ spending has also fallen. Offsetting these falls has been a rise in infrastructure spend as a share of total spend, from 2.0% to 2.8%, and a substantial increase in spend on major equipment, from 23% to 36% of total spending.
Figure 7.4. Breakdown of NATO-qualifying defence spending, 2008–09 to 2025–26
Note: ‘Major equipment’ includes missiles and missile systems, nuclear weapons, aircraft, artillery, combat vehicles, engineering equipment, weapons and small arms, transport vehicles, ships and harbour craft, electronic and communications equipment, and R&D. ‘Personnel’ includes remuneration of military and civilian personnel, as well as pensions in payment. ‘Infrastructure’ includes national military construction and NATO common infrastructure payments. ‘Other’ includes operations and maintenance costs, non-major-equipment R&D and a residual. Figures for 2024–25 and 2025–26 are estimates made in June 2025.
Source: NATO, Defence Expenditures of NATO Countries.
Prioritising major equipment spend has been a subsidiary goal of NATO since the commitment was made in 2014 for member countries to spend at least 2% of national income on defence. At this point, it was also agreed that at least 20% of defence spending should be in the form of equipment spending within a decade. Figure 7.4 shows that the UK has met this commitment from its inception.
A large share of the UK’s equipment spending goes on maintaining the nuclear deterrent, though, which is not the case for most other NATO countries (only the US, the UK and France have nuclear weapons amongst NATO countries). In 2023–24, defence nuclear spending was around £9.4 billion (0.3% of GDP); around half of the UK’s equipment spending was devoted to the nuclear programme. Excluding nuclear spending, the UK spent 1.9% of GDP on NATO-qualifying defence in 2023–24, 19% of which was on (non-nuclear) equipment.
Ministry of Defence breakdown
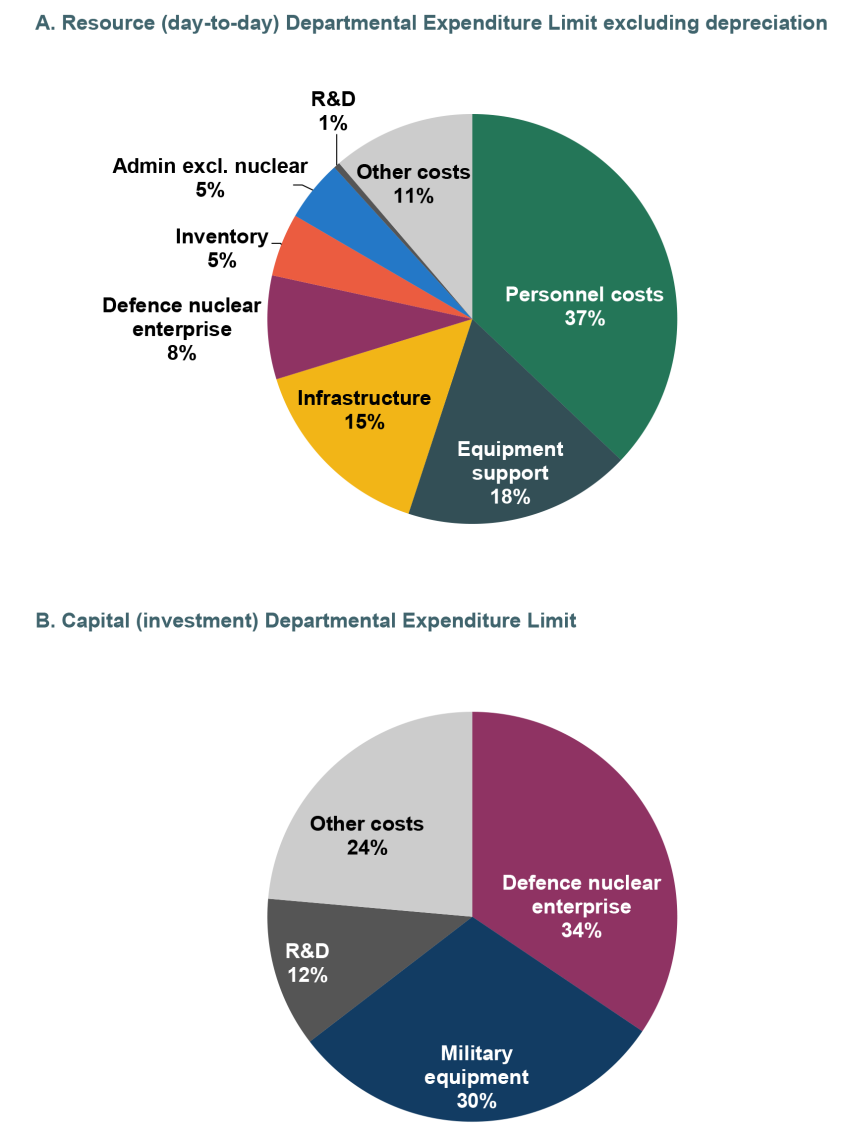
We can also use the departmental definition of defence spending to examine in more detail how UK defence spending is allocated. Figure 7.5 shows how day-to-day and capital spending by the Ministry of Defence were split in 2023–24 (the latest year for which we have out-turn spending). The largest component of day-to-day MoD spending was personnel costs. Equipment support costs were the second-largest component, followed by infrastructure costs.2 The nuclear programme made up 8% of day-to-day spending. Within capital spending, the largest component was the defence nuclear enterprise, making up around a third of all capital spending (total departmental spending on the nuclear programme made up 17% of total spending).
Figure 7.5. MoD Departmental Expenditure Limit split in 2023–24
Note: ‘Other costs’ includes items such as the war pension benefits programme costs, the costs of non-departmental public bodies, and the Conflict, Stability and Security Fund. ‘Military equipment’ refers to single-use military equipment, which can be used for military purposes only (rather than referring to only being able to be used a single time).
Source: Authors’ calculations using Ministry of Defence accounts 2023–24.
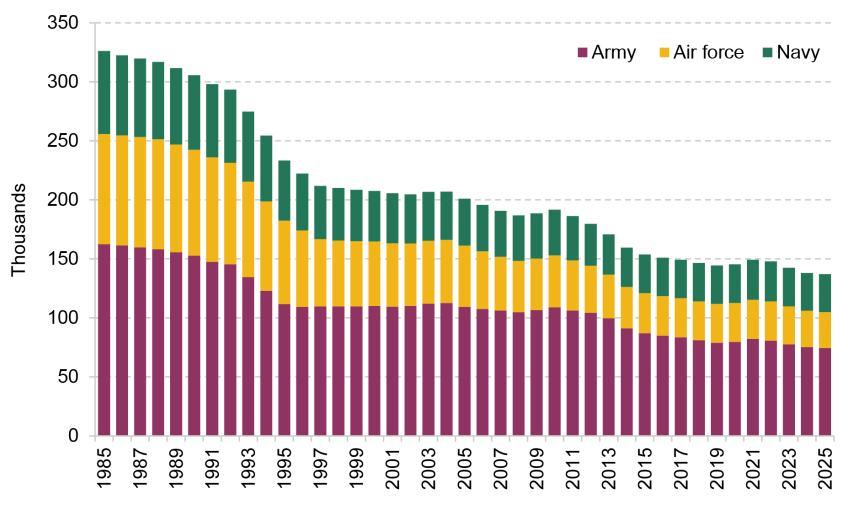
Although personnel costs represent the largest elements of MoD day-to-day spending, Figure 7.4 showed that there has been a decline in the share of defence spending going on personnel in recent years. Alongside the decline in personnel spending, there has been a decline in armed forces numbers, as Figure 7.6 illustrates. The numbers of regular personnel of the army, air force and navy have all more than halved since 1985 – with the air force falling particularly steeply, to only around a third of its size in 1985.
Figure 7.6. UK regular armed forces personnel, 1985–2025
Source: Authors’ calculations using Office for Budget Responsibility, Fiscal Risks and Sustainability – July 2022, and Ministry of Defence, Quarterly Service Personnel Statistics, April 2025 (https://www.gov.uk/government/collections/quarterly-service-personnel-statistics-index).
We are not able to say much about how Single Intelligence Account spending is allocated, other than the split between day-to-day and capital spending (around a third of total SIA spending was capital spending in 2024–25), as more detail on departmental spending allocation is not released for reasons of national security (Cabinet Office, 2023).
Summary
There have been large changes in the composition of defence spending over time (alongside changes in the amount spent). An ongoing trend is spending becoming much more investment-heavy. Correspondingly, there has been an increase in equipment spending and a reduction in personnel spending, with a large reduction in the number of UK regular armed forces personnel over time.
How does our spending compare internationally?
It matters not just how much the UK spends on defence, and how that money is allocated, but also how much the UK’s allies – and potential adversaries – spend (and on what).3
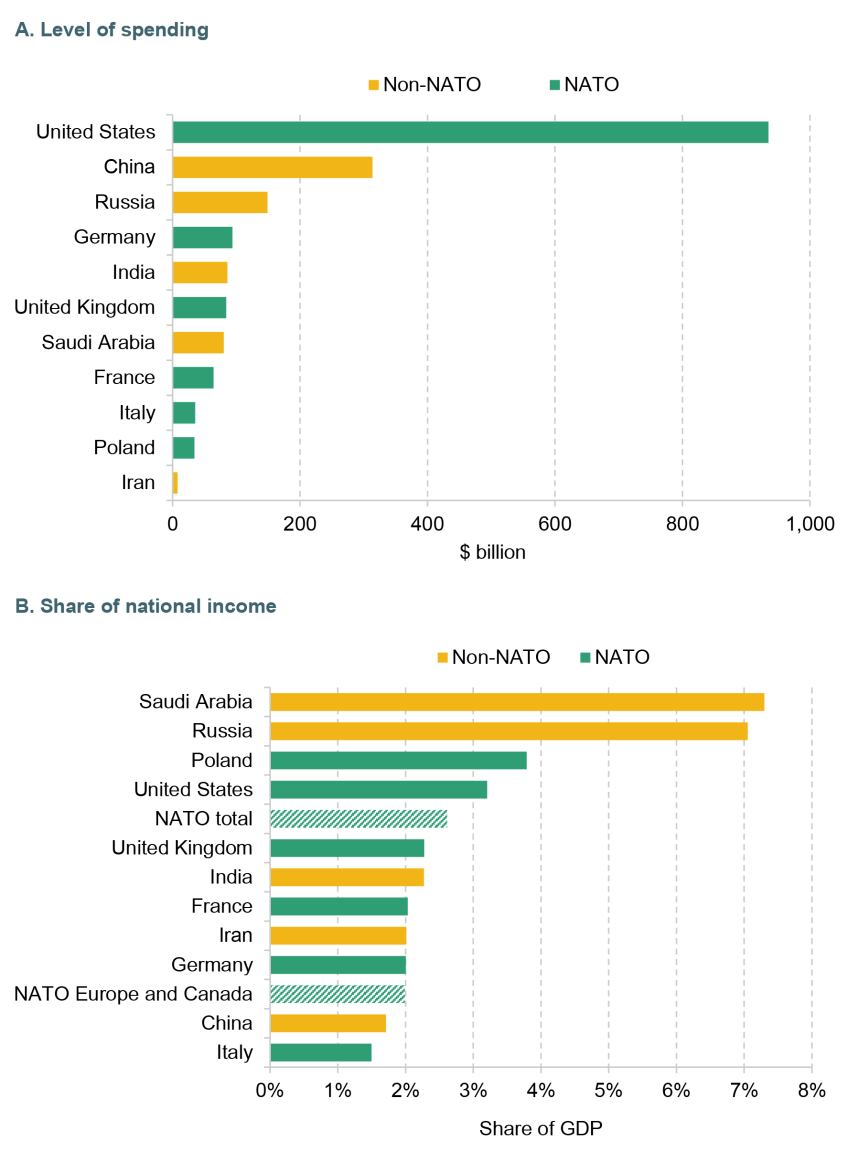
Panel A of Figure 7.7 shows the level of defence spending in 2024 in selected NATO and non-NATO countries. The US has by far the largest defence budget, standing at $935 billion. This is followed by China, at 34% of the US level, and Russia, at around 16% of the US level. The UK is lower down, spending slightly less than India and Germany, and slightly more than France and Saudi Arabia.
Figure 7.7. Defence spending for selected countries, 2024
Note: Defence spending for NATO countries refers to spending in the fiscal year that most overlaps 2024. Defence spending for non-NATO countries refers to spending levels in the calendar year 2024. Spending as a share of national income for the United Kingdom is calculated using Office for Budget Responsibility forecasts for nominal GDP as of August 2025.
Source: NATO, Defence Expenditures of NATO Countries; SIPRI (Stockholm International Peace Research Institute); OBR databank, August 2025.
Panel B shows spending as a share of national income in 2024. The UK spent a higher share of national income on defence than Germany or France, and indeed than the NATO average excluding the US (i.e. Europe and Canada). However, the US spent considerably more as a share of GDP (3.2%), bringing up the total NATO average to 2.6%, 0.3% of GDP above the UK level. The UK also spent more as a share of national income on defence than China, Iran or India in 2024, while both Russia – in active combat in 2024 – and Saudi Arabia spent considerably more.
We now focus on the defence spending of NATO countries. Figure 7.8 shows how their defence spending has changed over time. Panel A shows spending as a share of national income. Since 2014, countries in NATO have tended to increase defence spending as a share of national income. Amongst the highest-spending countries, the increase in spending as a share of national income has been notably large in Germany, where spending has increased from 1.2% of national income in 2014 to 2.0% in 2024, but has taken place in France and the UK as well. Poland has seen an even larger increase, from 1.9% in 2014 to 3.8% in 2024. For the US, in contrast, defence spending as a share of national income has declined over time, falling from 3.7% of national income in 2014 to 3.2% in 2024. The combined effect of higher spending in Europe and lower spending in the US has been for total NATO spending to remain broadly flat as a share of total (i.e. NATO-wide) national income between 2014 and 2024.
Figure 7.8. Defence spending among NATO countries over time
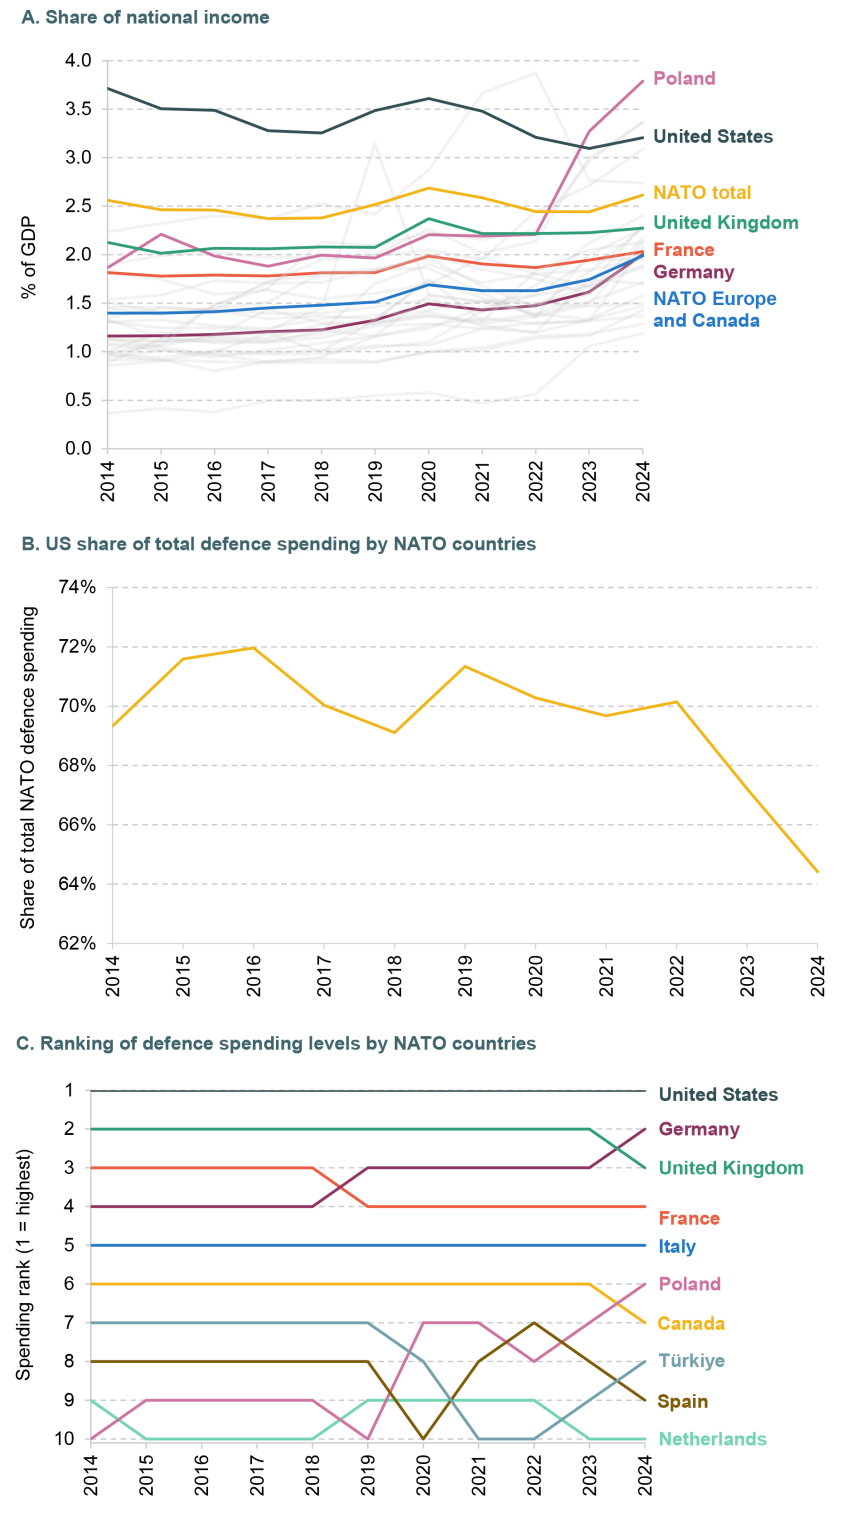
Note: Countries in Panel C are ranked by the amount spent on NATO-qualifying defence (converted to US dollars) in each year.
Source: Authors’ calculations using NATO, Defence Expenditures of NATO Countries, 2025; OBR databank, August 2025.
Another consequence of these trends has been that the share of defence spending in NATO spent by the US has fallen substantially over the period, as shown by Panel B. US defence spending made up 69% of defence spending by NATO countries in 2014 and 64% in 2024. Nonetheless, the US remains by far the largest defence spender in NATO. But there have also been changes among European NATO members. Panel C shows how the rank of defence spending in NATO has changed over time amongst the highest-spending countries. The UK has long been the second-highest spender on defence in NATO, but in 2024 it was overtaken by Germany, which had previously overtaken France in 2019. Similarly, Poland has moved rapidly up the ranks in recent years. For most other countries, rankings in 2024 are broadly unchanged from 2014.
Moving beyond differences in total defence spending, Figure 7.9 shows how the UK’s composition of NATO-qualifying defence spending compared with other NATO countries’ in 2024. A relatively high share of the UK’s defence spending is on major equipment. This includes the nuclear deterrent, which most NATO countries will not be spending on. But both the US and France – the two other NATO countries with nuclear weapons – also spend a smaller fraction of their overall budget on equipment than the UK.
Figure 7.9. Breakdown of defence spending by NATO countries, 2024
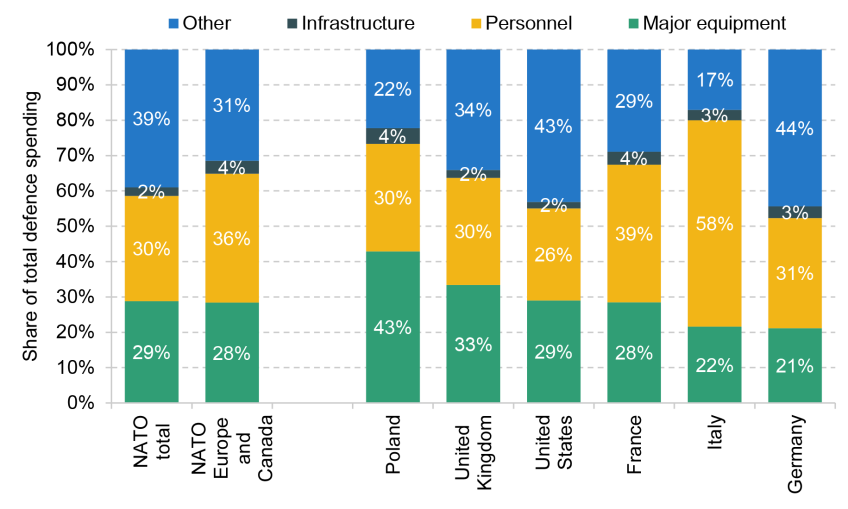
Note:‘Major equipment’ includes missiles and missile systems, nuclear weapons, aircraft, artillery, combat vehicles, engineering equipment, weapons and small arms, transport vehicles, ships and harbour craft, electronic and communications equipment, and R&D. ‘Personnel’ includes remuneration of military and civilian personnel, as well as pensions in payment. ‘Infrastructure’ includes national military construction and NATO common infrastructure payments. ‘Other’ includes operations and maintenance costs, non-major-equipment R&D and a residual. Figures for 2024–25 and 2025–26 are estimates made in June 2025.
Source: NATO, Defence Expenditures of NATO Countries, 2025.
The share of UK defence spending spent on personnel is similar to the NATO average (around 30%) and significantly lower than the average excluding the US (36%). Italy, on the other hand, spent almost twice as large a share of spending on personnel, at 58%. The Italian armed forces were the sixth biggest in NATO in 2024 (after the US, Türkiye, Poland, France and Germany), at 171,000.
Summary
Taken together, focusing on the past, there are three important trends that stand out for UK defence spending. First, after staying relatively stable at just above 2% of national income in recent years, UK defence spending is beginning to rise, and reached around 2.3% of GDP in 2024–25. Second, an increasing share of spending is spent on major equipment (including the nuclear deterrent), while personnel spending has fallen (with a concurrent decline in the size of the UK armed forces). Third, the UK has long had the second-highest defence spending of NATO countries, but has recently been overtaken by Germany. Many European countries – most notably Poland and Germany – have recently started to increase their defence spending substantially.
7.3 Outlook for defence spending
UK defence spending commitments
As shown in Figure 7.1, NATO-qualifying defence spending in 2024–25 was 2.3% of GDP. In February 2025, the Prime Minister announced that the UK would spend 2.5% of GDP on defence in 2027, as well as an ambition – ‘subject to economic and fiscal conditions’ – for defence spending to rise to 3% of GDP in the next parliament (Prime Minister’s Office, 2025a). He also announced that all activities of the security and intelligence agencies would, by 2027, be classified as defence spending, and as a result defence spending on this updated definition would hit 2.6% of GDP by 2027 (Prime Minister’s Office, 2025c).
As part of the NATO Summit in June 2025, the government further committed to spending 3.5% of GDP on defence, with a target date of 2035 (Prime Minister’s Office, 2025b). At the same time, it committed to spending an additional 1.5% of GDP on wider resilience and security. Both these commitments were made alongside all other NATO allies. It is not yet clear what the wider resilience commitment will include – the NATO declaration described its aim as ‘to inter alia protect our critical infrastructure, defend our networks, ensure our civil preparedness and resilience, unleash innovation, and strengthen our defence industrial base’ (NATO, 2025). The UK government announcement implied that this wider resilience commitment would be achieved by 2027–28 under pre-existing Spending Review plans. This suggests that, at least for the UK, meeting the commitment will not require an increase in total spending, although it may affect how individual departments’ budgets are allocated. Through the rest of this chapter, we continue to focus on core defence spending rather than this wider definition, on the assumption that this component of the wider NATO commitment will be met by the UK in any case.
At the Spring Statement, the government set out implied paths for day-to-day defence spending and investment spending in order to achieve the 2.5% target by 2027–28, and at the Spending Review (prior to the 3.5% commitment) more detailed Ministry of Defence and Single Intelligence Account budgets were provided, with day-to-day budgets set until 2028–29 and capital budgets until 2029–30 (in line with all other departments).
Figure 7.10 summarises these plans, showing defence spending as a share of GDP from 2014–15 to 2035–36. The markers show the points at which defence spending is due to hit 2.5% of GDP (by 2027) and 3.5% of GDP (by 2035). The dotted line then shows the implied plans for defence spending from the Spending Review, with no plan yet set for the path of spending after 2028–29 (shown by the large gap between 2028–29 and 2035–36).4
Figure 7.10. Defence spending out-turn and plans
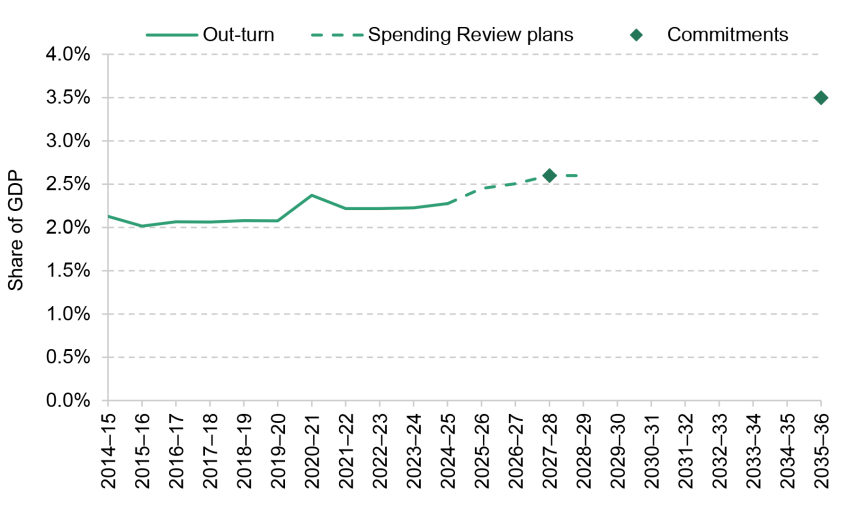
Note: The ‘Spending Review plans’ line shows Ministry of Defence and Single Intelligence Account Total Departmental Expenditure Limits (TDEL), adjusted so that plans in 2027–28 match the 2.6% commitment. We assume that the gap between MoD and SIA TDEL and NATO-qualifying defence spending in 2027–28 remains consistent over the Spending Review period.
Source: Authors’ calculations using: HM Treasury, Spring Statement 2025 and Spending Review 2025; NATO, Defence Expenditures of NATO Countries; OBR databank, August 2025; and June 2025 government announcement.
There are two notable features of recent defence spending announcements. The first is that current plans imply defence spending will stay flat as a share of GDP, at 2.6%, in 2028–29. Given the ambition, set after the Spending Review, to increase defence spending to 3.5% of GDP by 2035, there is likely to be pressure at the 2027 Spending Review to top up the level of defence spending in 2028–29. In Section 7.4, we discuss the plausible profiles of defence spending over this period in more detail.
The second notable feature is how much of the increase in defence spending over the Spending Review period is planned to be in capital spending, rather than day-to-day spending. Between 2025–26 and 2028–29, day-to-day MoD spending is set to grow at 0.7% per year in real terms on average, while capital spending is set to grow at 8.6%: of the overall £11 billion cash-terms increase, around three-quarters is capital. If those plans are delivered, capital spending will become a much larger share of total MoD spending, as Figure 7.11 shows, continuing a rise in the capital intensity of MoD spending that began in 2019–20. By 2028–29, capital spending is set to reach 43% of total spending, far higher than in any year since at least 2002–03 (the earliest year for which we can construct comparable records).
Figure 7.11. Ministry of Defence capital budget as a share of total spending
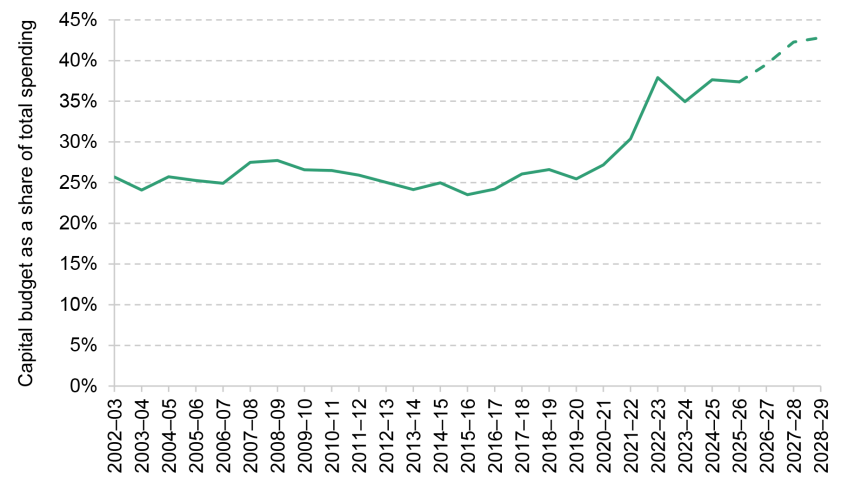
Note: Total spending here refers to Ministry of Defence Total Departmental Expenditure Limits (TDEL), and capital budget to Capital Departmental Expenditure Limits (CDEL).
Source: Authors’ calculations using HM Treasury, Spending Review 2025 and various Public Expenditure Statistical Analyses.
This change in the composition of the defence budget could be the result of strategic priorities: investment in equipment, for example, may have been deemed most necessary for the armed forces, particularly in a context where equipment has been donated to Ukraine from UK stockpiles. We discuss the government’s performance ambitions in more detail in Box 7.1. It may also be that capital defence spending is more likely to deliver growth: the government has said that boosting growth is one goal of the increase in defence spending, driving its aims to invest in defence innovation and new technology. We discuss this in more detail in Section 7.5.
Box 7.1. What ambitions does the government have for military performance?
The ambitions the government has for military capabilities and performance – beyond its commitments to the level of defence spending – have been most comprehensively set out in the Strategic Defence Review, an external review launched by the government upon taking office and published in June 2025. The government has accepted all of the review’s recommendations.
The Strategic Defence Review defined the three core roles of defence as to:
defend, protect and enhance the resilience of the UK, its Overseas Territories and Crown Dependencies;
deter and defend in the Euro-Atlantic;
shape the global security environment.
In order for the UK to play these roles, the review focused on changes needed within a range of defence areas. We consider three areas in turn: defence personnel, equipment and capabilities, and nuclear.
The Strategic Defence Review recommended that there should be no reduction in the number of regular personnel across all three services. Indeed, it envisioned an expansion in the number of regular personnel when funding allows, with the priority being to increase army regulars. This would be a substantial change in the trend – shown earlier in Figure 7.6 – of a consistent decline in regular personnel over time. The separate summary document of the review (but not the main report) described an aim to increase full-time British Army troops to at least 76,000 in the next parliament (from 70,640 in July 2025). The review also argued for an increase in the number of active reserves by 20%, also when funding allows, but likely in the 2030s.
After the publication of the plan, John Healey, the Secretary of State for Defence, confirmed that the focus during this parliament would be to stop the decrease in personnel, while increases in the number of soldiers would likely only take place in the next parliament (Sabbagh, 2025). The numbers of personnel in all three branches of the armed forces are currently below the target sizes set in the 2021 Defence Command Paper (Kirk-Wade, 2025), and the review referred to a longstanding recruitment and retention crisis in the MoD.
On equipment and capabilities, the Strategic Defence Review recommended that the armed forces should accelerate their transition to a high–low mix of high-end and lower-cost equipment. As discussed in Section 7.2, the UK has long allocated a substantial portion of its defence spending to equipment. The government has committed to creating a New Hybrid Navy, building new warships and support ships, introducing new autonomous vessels and developing existing aircraft carriers into the first European hybrid air wings. For the army, the review recommended accelerating the development of its new Recce-Strike approach and aiming for a tenfold increase in lethality relative to a conventional armoured brigade model. For the air force, it recommended that the RAF increasingly move to using uncrewed and autonomous platforms, as well as start developing next-generation jets.
Turning next to nuclear, the review stated that the nuclear deterrent should remain the top priority for defence. The government is building new Dreadnought class ballistic missile submarines, which will replace Vanguard as the platform for the UK’s strategic nuclear deterrent from the early 2030s. The review called on the government to start planning this parliament for the eventual replacement of the Dreadnought class submarine, and to confirm its planned number of new nuclear-powered attack submarines. In his response to the Review, John Healey MP committed to a 15 billion pound investment programme in the nuclear warhead programme over the parliament (Ministry of Defence, 2025b).
The Strategic Defence Review therefore laid out an ambitious set of improvements to be made across a range of aspects of defence: it itself acknowledged that prudent sequencing of its recommendations would be necessary. The review’s terms of reference noted that recommendations should be deliverable and affordable within the resources available to Defence within the trajectory to 2.5% (Ministry of Defence, 2024). That the commitment for defence spending is now 3.5% by 2035 suggests that delivering the review’s recommendations should be affordable. However, as we discuss in more detail in Section 7.5, it is likely that delivering on many of the planned increases in capabilities will take much longer than a decade, and therefore will be dependent on future funding decisions as well.
The government’s fiscal rules could also be playing a part in determining the composition and profile of defence spending. The rule currently binding the government specifies that day-to-day spending must be met out of revenues in the medium term, but allows borrowing for capital spending (subject to a requirement for debt, defined as public sector net financial liabilities, to be forecast to fall in the medium term). Higher capital defence spending therefore does not affect performance against the currently binding fiscal rule in a way that higher day-to-day defence spending would, which could conceivably have influenced the decision to increase the capital intensity of the defence budget (although, as shown in Figure 7.11, this increase has been taking place since 2019, and the rule allowing borrowing for capital spending was only put in place under the current government).
Beyond its spending commitments, the government has a set of ambitions for military capabilities. The exact nature of these capabilities, and the plausibility of achieving them within the funding increases set out, is beyond the scope of this chapter, but Box 7.1 provides a short summary of ambitions set out in the recent Strategic Defence Review (Ministry of Defence, 2025a).
International defence spending commitments
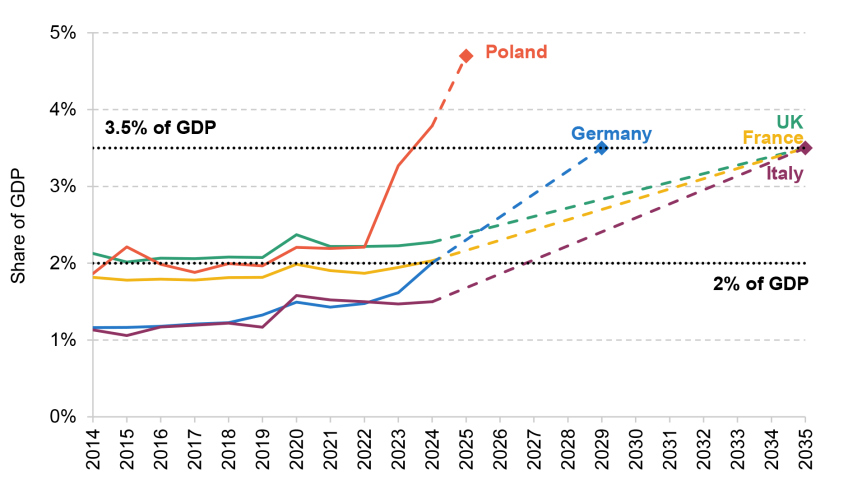
The UK is not the only country to have set out plans to increase defence spending. At the NATO Summit in The Hague in June 2025, all NATO allies committed ‘to invest 5% of GDP annually on core defence requirements as well as defence-and security-related spending by 2035’ (NATO, 2025). They also agreed to ‘allocate at least 3.5% of GDP annually based on the agreed definition of NATO defence expenditure by 2035 to resource core defence requirements, and to meet the NATO Capability Targets’. Allies further agreed to ‘submit annual plans showing a credible, incremental path to reach this goal’. This subsection focuses on Germany, France, Italy and Poland, the four largest NATO countries by defence spending in 2024 aside from the US (the highest-spending country) and the UK (the third-highest-spending country). Figure 7.12 summarises current plans for each country.
Figure 7.12. Defence spending out-turn and commitments for the UK, France, Germany, Italy and Poland
Note: Dotted lines connect current spending and the planned end point, rather than showing planned paths.
Source: Authors’ calculations using NATO, Defence Expenditure of NATO Countries (2014–25); IMF GDP forecasts; and OBR databank, August 2025.
Germany aims to hit the 3.5% goal much faster than the UK, aiming to do so by 2029 (Holler, 2025). Notably, Germany also has a much lower starting point – defence spending as a share of GDP has long been lower in Germany than in the UK and than the NATO average. In 2024–25, for the first time in three decades, Germany met the previous NATO commitment of spending 2% of GDP on defence. Higher spending will be financed by higher levels of borrowing, made possible by an amendment to Germany’s constitutional debt brake in March, allowing higher deficits to be run for defence spending, and by Germany’s activation of the EU’s national escape clause to allow for higher defence spending within EU fiscal rules (Council of the European Union, 2025a; Zettelmeyer, 2025). This takes advantage of Germany’s relatively strong fiscal position, which we discuss in more detail at the end of Section 7.4.
France has yet to set out a detailed plan to reach the 3.5% goal – like the UK – although it has committed to the 2035 target date alongside other allies. In July, President Macron announced that French defence spending would reach 64 billion euros by 2027, saying that additional funding would not come from borrowing (Kayali, 2025). Using IMF forecasts for French GDP, this would be equivalent to maintaining France’s defence spending as a share of GDP at a roughly constant level of 2.0% (International Monetary Fund, 2025b). However, at the time of writing, the French government has proved unable to pass a budget through parliament, owing to objections to its proposed spending cuts (Perelman, 2025). Given the difficulty of passing a budget that implies defence spending staying constant as a share of GDP, it remains to be seen how further increases in defence spending to the 3.5% commitment will be funded or politically feasible.
Italy, like France and the UK, has committed to reaching 3.5% of GDP on core defence spending by 2035, but has not set out how this commitment will be achieved. As Figure 7.12 shows, Italy has consistently spent much less than the 2% commitment on defence spending, spending around just 1.5% of national income on defence in 2024. The Italian government has announced that the 2% commitment will be reached this year, with the Defence Minister describing this as a starting point (Giordano and Kayali, 2025). Italy has not at the time of writing taken advantage of the EU national escape clause activated by other EU countries, such as Germany, to borrow for defence, and indeed has criticised this practice for increasing national debt (Kington, 2025). Reaching 3.5% of GDP by 2035 would, as Figure 7.12 shows, require relatively fast increases over time.
Finally, Poland has already rapidly increased defence spending. In 2022, Poland spent 2.2% of GDP on defence, similar to the UK’s level of spending. In 2024, it is estimated that Poland will spend 3.8% of GDP on defence, and the previous President, Andrzej Duda, announced in February plans to spend 4.7% in 2025 (Euronews, 2025). This swift increase in defence spending – far faster than the increase planned by Germany, never mind the UK – means that Poland has already achieved the new 3.5% NATO commitment. Like Germany, much of this is being enabled through additional borrowing, with a new bond-issuing fund introduced, the Armed Forces Support Fund (Oleksiejuk, 2025).
Taken together, the UK in 2022 had higher defence spending – as a share of national income and in absolute terms – than Germany, France, Italy or Poland. But Poland has already delivered a much faster increase than the UK as a share of GDP. Germany, too, has begun to increase defence spending rapidly, and plans to continue at this rapid pace – in 2024, it had become the second-biggest spender in NATO, overtaking the UK. As it stands, it seems that the UK, France and Italy will increase defence spending considerably more slowly.
Some NATO countries – most notably Spain – have not committed to hitting 3.5% by 2035 (Jopson and Foy, 2025). Even for those who have committed to 3.5%, it is far from certain that this level of spending will be reached in 2035. In 2014, when the previous NATO guideline of spending 2% of GDP on defence was strengthened, NATO countries spending less than 2% on GDP committed to increase their spending to 2% by 2024 (NATO, 2014). In 2024, though, despite the rapid increases in spending among many countries after Russia’s invasion of Ukraine, 14 of the 32 NATO countries were spending less than 2% of GDP on defence.
7.4 The fiscal challenge of higher defence spending
Impacts of defence spending commitments this parliament
As discussed in the previous section, the government has already set out detailed spending plans for the next few years and committed to spending 3.5% of national income on defence in 2035. What has not yet been stated is how spending will move from its planned level of 2.6% of national income in 2028–29 to 3.5% of national income in 2035–36. This is not unreasonable, given the length of the commitment, and it will likely be up to governments in future parliaments to set out much of this path.
The government may also decide to change the plans it has already set out. In particular, at the 2027 Spending Review, it will revisit the departmental budgets for 2028–29 and 2029–30 that were set at the last Spending Review. The commitment to increase defence spending to 3.5% of national income by 2035–36 was made after departmental spending plans had already been set at the recent Spending Review. It is therefore plausible that spending plans in the final years covered by the last Spending Review might be increased, given geopolitical risks and the case for increasing spending gradually rather than all at once, which we discuss in more detail later in this section. Indeed, it is common for total spending plans to be topped up at Spending Reviews (Crawford, Johnson and Zaranko, 2018; Boileau, 2025).
Scenarios for reaching the 3.5% commitment
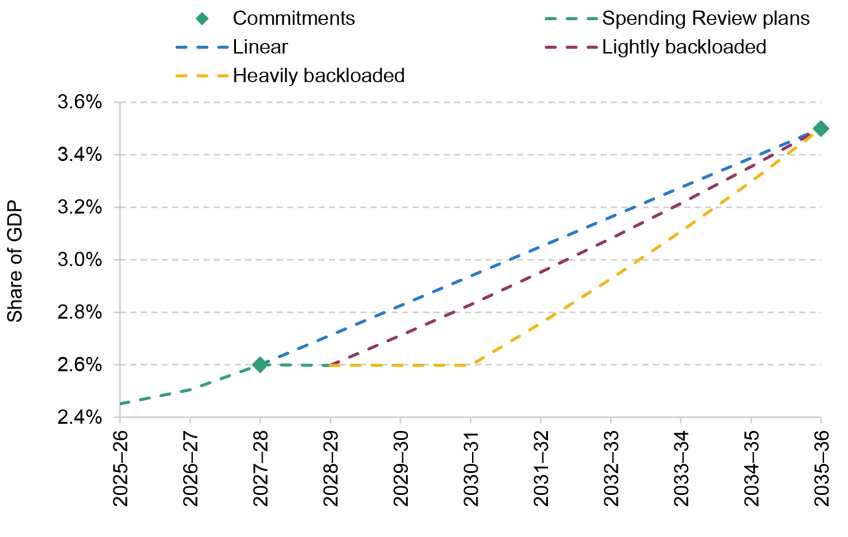
Figure 7.13 shows three illustrative ways in which this and future governments might choose to increase defence spending to 3.5% of national income by 2035–36. In two of our scenarios, we assume that the government keeps to its stated Spending Review plans until 2028–29, which imply defence spending remains at 2.6% of national income in 2027–28 and 2028–29, rather than increasing further. In the ‘lightly backloaded’ scenario, we assume spending is then increased as a share of national income at a constant growth rate after 2028–29 in order to reach 3.5% of national income by 2035–36. In the ‘heavily backloaded’ scenario, we assume that the government chooses to maintain defence spending at 2.6% of national income through to 2030–31, meaning no further increase in spending as a share of national income until the next parliament. After that, we assume defence spending increases at a constant growth rate to reach 3.5% by 2035–36. In the ‘linear scenario’, we assume that the government amends Spending Review plans for 2028–29, instead increasing spending as a share of national income linearly to reach 3.5% by 2035–36.
Figure 7.13. Scenarios for defence spending increases
Note: Defence spending is here defined as NATO-qualifying defence spending. We here assume that combined MoD and SIA spending remains at its 2027–28 share of NATO-qualifying defence spending in 2028–29.
Source: Authors’ calculations using HM Treasury, Spending Review 2025.
Since the start and end points are the same in all three scenarios, the main difference is the extent to which the increase in defence spending is backloaded, i.e. concentrated in later years. In the linear scenario, defence spending increases consistently over time, while in the other two scenarios the increases are more backloaded into the next parliament.
Of course, these are just three scenarios for defence spending – in theory, since we have only been told the planned level for NATO-qualifying defence spending in 2027–28 and 2035–36, spending could follow any path between these years. There are different advantages and disadvantages to different paths, which we discuss in the rest of this section.
Impacts of defence spending on other areas of spending
Amending Spending Review plans in 2028–29 and 2029–30 to increase spending on defence would pose fiscal challenges this parliament. Existing plans for the increase in defence spending to 2.6% of national income by 2027–28 are already set to squeeze budgets for other departments.5 While non-defence departmental spending (including the NHS and schools in England) is planned to increase in real terms by 2.7% between 2025–26 and 2026–27, it is planned to be almost flat between 2026–27 and 2027–28 (reflecting both much slower real growth in total departmental spending and even more rapid growth in planned defence spending between those two years).
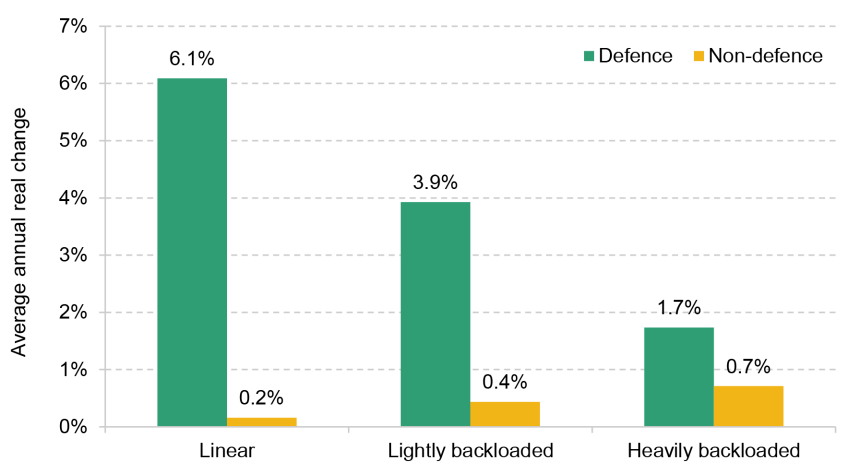
If defence spending were increased more rapidly after 2027–28, and total spending envelopes were not topped up, non-defence departmental spending would be further squeezed. Figure 7.14 shows how defence and non-defence departmental spending might change over the rest of the Spending Review period under our three scenarios if the government stuck to plans for total departmental spending.
Figure 7.14. Illustrative increases to defence spending and non-defence departmental spending, 2027–28 to 2029–30
Note: Assumes no changes to current plans for total departmental spending.
Source: Authors’ calculations using HM Treasury, Spending Review 2025.
In our ‘lightly backloaded’ scenario, average annual real growth in non-defence spending between 2027–28 (when the 2.6% goal is reached) and 2029–30 (when departmental spending plans end) is 0.4%. This would more than halve, to below 0.2%, if defence spending is increased linearly from 2027–28 as in our ‘linear’ scenario. In our ‘heavily backloaded’ scenario, average annual real growth in non-defence spending would be higher at 0.7% between 2027–28 and 2029–30. This demonstrates that even taking the government’s 3.5% of GDP commitment as given, the speed at which the government seeks to deliver it will have consequences for spending elsewhere.
Within non-defence departmental spending, some areas will likely be relatively protected. Health spending in England, in particular, is unlikely to grow by just 0.2%, 0.4% or 0.7% per year. Between 2023–24 and 2028–29, the average annual real growth rate for Department of Health and Social Care (DHSC) spending is set to be 2.7%. If this were maintained for one more year, to 2029–30, non-defence non-health spending would fall in real terms in all three of the scenarios considered in Figure 7.14 (in the ‘heavily backloaded’ scenario, by an annual average of 0.6% between 2027–28 and 2029–30; in the ‘lightly backloaded’ scenario, by an annual average of 1.1%; and in the ‘linear’ scenario, by an annual average of 1.5%).
Of course, total spending envelopes could be topped up to avoid this squeeze. As the next subsection describes, though, funding additional spending through borrowing or tax is not entirely straightforward.
The case for and against backloading spending increases
Backloading the increase in defence spending would be attractive for the government in part because it eases the fiscal trade-offs in this parliament. As just discussed, maintaining defence spending as a constant share of GDP from 2027–28, while keeping to the government’s current plans for overall spending, would allow non-defence spending to grow more rapidly than if defence spending were increased as a share of GDP. Delaying funding increases until the next parliament would also mean a lower amount of cumulative defence spending, in some sense lowering the cost of meeting the 3.5% NATO commitment.
But although it would lead to more difficult fiscal trade-offs in this parliament, there are also strong arguments for increasing defence spending at a linear (or even frontloaded), rather than backloaded, rate from 2027–28.
First, one of the main motivations the government has given for increasing defence spending is a higher perceived risk of conflict and the need for European defence self-sufficiency. This line of reasoning would suggest that higher defence spending is needed now, rather than just in 2035–36. Moreover, if the goal is to replenish stocks and increase capabilities, it is the accumulated spending over this period that matters as much as – if not more than – what we end up spending in 2035–36. For example, cumulative defence spending would be £22.5 billion higher in the ‘linear’ scenario than in the ‘lightly backloaded’ scenario, and £32.4 billion lower in the ‘heavily backloaded’ scenario than in the ‘lightly backloaded’ scenario. (As discussed earlier, though, higher spending in the ‘linear’ and ‘lightly backloaded’ scenarios would correspondingly mean that the overall increase to 3.5% of GDP by 2035–36 would be more expensive to finance.)
Backloading spending increases means that in later years spending must increase more rapidly. In our ‘lightly backloaded’ scenario, after this parliament defence spending must grow much more rapidly in order to reach 3.5% of national income by 2035–36, at an average annual real rate between 2028–29 and 2035–36 of 6.4%. In our ‘heavily backloaded’ scenario, defence spending would grow at an average annual real rate of 8.3% between 2030–31 and 2035–36. This is lower, at 5.8% between 2027–28 and 2035–36, under the ‘linear’ scenario. In Section 7.5, we set out some reasons to think that rapidly increasing spending on one area – particularly on a capital-intensive area, such as defence – might be challenging to do well.
Maintaining defence spending at a constant share of GDP between 2027–28 and 2028–29 – as implied by the government’s existing plans for defence spending – eases fiscal trade-offs during this parliament. But taking the 3.5% commitment as given, the government’s own arguments for why defence spending should increase to 3.5% would suggest that there is a case for spending plans to be amended, and for defence spending to continue to increase after 2027–28.
Impacts of defence spending in future parliaments
So far, we have considered how different pathways of defence spending could matter for fiscal policy this parliament. Looking further ahead, meeting the commitment to increase defence spending to 3.5% of GDP by 2035 would have large impacts on public spending and potentially the size of the state in the medium and longer term. In this subsection, we focus on the challenge at the end point, in 2035, when core NATO-qualifying defence spending is set to reach 3.5% of GDP.
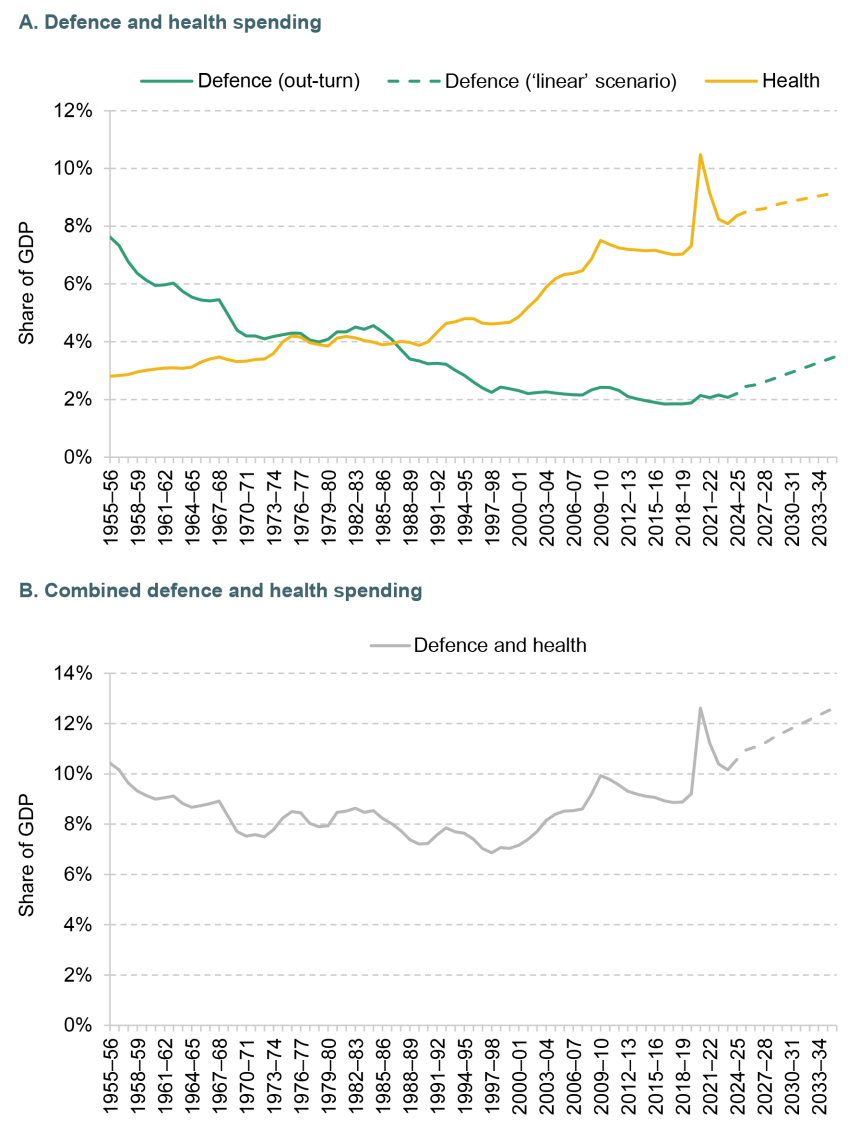
To illustrate the fiscal challenge, Panel A of Figure 7.15 shows how the commitment to increase defence spending to 3.5% of GDP by 2035 compares with the historical path of defence spending (we here only show the ‘linear’ scenario for defence spending between 2027–28 and 2035–36 for ease of interpretation; the end point is the same under any of our scenarios). By 2035–36, defence spending will have returned to a level last seen in 1987–88 (under the functional definition of defence spending), reversing more than three decades of declining defence spending as a share of GDP.
Figure 7.15. Defence and health spending scenarios
Note: Defence spending out-turn uses the functional definition of defence spending, while the linear scenario uses the NATO definition; hence the small gap in the series between out-turn and scenario. Only the linear scenario is illustrated for ease of interpretation. Health spending uses the functional definition throughout. We project that health spending grows at the same rate that DHSC total spending has grown over this parliament in real terms. See footnote 6 for more details.
Source: Authors’ calculations using HM Treasury, Public Expenditure Statistical Analyses (various), Spending Review 2025 and Spring Statement 2025.
For comparison, the graph also shows how health spending has changed over the same period, as well as a relatively conservative projection for the path of health spending up to 2035.6 Defence spending is set to return to its level in 1987–88, but health spending is likely to be more than twice as high as it was then: if it continues to grow at the same rate that is planned for this parliament, we project that health spending will reach 9.2% of GDP by 2035–36, compared with 4.0% in 1987–88.
This is a stark reversal of the post-war ‘peace dividend’, where increases in health and other welfare spending were partly offset by falls in defence spending as a share of national income. Simultaneously increasing health and defence spending will be an abrupt change and an enormous fiscal challenge. The only other post-war period with a consistent increase in both was in the 1970s and early 1980s, when the UK followed a NATO commitment to increase defence spending by 3% a year in real terms for five years. But during this period, the increase in defence spending as a share of GDP was much smaller (rising from 4.2% in 1970–71 to 4.5% in 1982–83) and health spending was at a much lower level (at 4.1% of GDP in 1982–83). The likely increase in both defence and health spending in the 2020s and early 2030s will put considerable upward pressure on the size of the state. Indeed, we project that combined health and defence spending (shown by Panel b) will be around the same level in 2035–36 as seen at the height of the pandemic (at 12.7%, compared with 12.6% in 2020–21), well above any level in any other year since at least 1955–56.
If we take the level of defence spending in 2024–25, 2.3% of GDP, as a baseline, current defence spending commitments create a 1.2% of GDP pressure on the public finances by 2035–36, equivalent to £36 billion of additional spending in current terms.
Future governments will have three options to fund this substantial increase in defence spending. We discuss each in turn, although the government could also pursue some combination of the three.
Reducing spending elsewhere to fund increased defence spending
The first option is to reduce government spending on other areas. This is the approach that the government has taken so far to increase defence spending to 2.6%, and the approach that the French government has proposed for the short term. Other countries – in particular, the US – manage to spend a much larger share of national income on defence while having a smaller state overall.
Reducing spending on other areas would limit the extent to which the state becomes larger, instead reprioritising existing spending towards defence. The challenge is that the increase in defence spending is sufficiently large that serious cuts would need to be made to other areas. One way to understand the magnitude of this sum is that it is close to the combined amount currently spent on the Home Office (which covers the police, border force and administration of the immigration system) and Ministry of Justice (which covers prisons, probation, courts and legal aid). It would not be possible to ‘salami slice’ existing budgets and make sufficient numbers of small savings to offset the increase. Instead, future governments would need to be willing to make large changes to the offering of the state.
Increasing taxes to fund increased defence spending
The second option is to fund the increase in defence spending through increased tax revenues. Tax revenues are already high by UK historical standards, at 35% of GDP in 2024–25 (Office for Budget Responsibility, 2025b), and are forecast to rise further. Further increases in tax to pay for higher defence spending would be in addition to this forecast rise, and would pose both political and economic challenges. Any negative economic impacts of higher tax revenues would reduce any positive impacts of higher defence spending on growth (discussed in Section 7.5). And the increase in defence spending is sufficiently large that future governments would likely be unable to raise sufficient amounts through taxing small groups alone (e.g. the ultra-wealthy). Instead, broad-based tax rises – affecting a large share of the population – would likely be needed. For example, in current terms, the increase in defence spending could require putting 3–4p on all rates of income tax or 4p on the standard rate of VAT. It is worth noting, though, that many of our Western European neighbours do sustain substantially higher tax revenue as a share of GDP than the UK (Institute for Fiscal Studies, 2024).
Borrowing to fund increased defence spending
The final option is to fund the increase in defence spending through higher borrowing. This is the approach taken by some European countries, as discussed in Section 7.3: the European Union has created a €150 billion borrowing scheme to fund defence investment and allows member states to apply for a national escape clause to exempt defence spending from EU fiscal rules, and Germany has relaxed its fiscal rules to allow borrowing for defence spending (European Commission, 2025; Council of the European Union, 2025b). In the UK, former Labour Chancellor Gordon Brown has argued that Rachel Reeves should exempt additional defence spending from the fiscal rules as ‘exceptional’ and that borrowing and costs should be shared across NATO or Europe (Lloyd, 2025). There are, however, several considerations which weigh against the UK using increased borrowing to fund the planned increase in defence spending.
First, permanently increasing borrowing to fund a substantial increase in defence spending is unlikely to be sustainable. While borrowing to fund a temporary increase in defence spending during a crisis can be justified, and would often be the sensible course of action, it is not clear that that is the situation the UK is currently in – we are considering a 10-year commitment to increase defence spending on an indefinite basis. Additional borrowing in the short or medium run could be used to smooth the path to a new equilibrium of higher spending funded by higher taxation or lower spending elsewhere, if there are costs of rapid adjustments, but borrowing an extra 1.2% of GDP each year in perpetuity would only make the UK’s (already parlous) long-run fiscal position weaker.
There is some nuance when it comes to the distinction between borrowing for day-to-day and capital spending, which is worth considering – not least because the current government’s fiscal rules give it more capacity to borrow to invest. Indeed, in some sense, much of the additional defence spending announced for the next few years is already being funded by borrowing, as it is mostly additional capital spending. Borrowing for capital investment is often justified on the grounds that it will boost economic growth in the future. As discussed in more detail in the following section, there are some potential growth benefits from defence spending, although these are not particularly strong. Borrowing for increased defence spending could also be justified on the grounds that future generations stand to benefit – especially in a wartime scenario. The strength of this argument is less clear-cut in the present scenario, given indications that increases in defence spending are an adjustment to a new higher equilibrium level of spending, rather than a temporary adjustment to a time-limited threat.
Second, the coming years are unlikely to be a particularly good time for the government to increase borrowing – the UK is already borrowing a lot, borrowing costs remain elevated, the Bank of England is selling bonds via quantitative tightening, and lots of other countries are borrowing lots too (leading to what Schnabel (2025) has described as a ‘global bond glut’).
Third, while Germany and Poland are funding defence spending with higher borrowing, the UK starts from a very different fiscal position. Both those countries have a lower debt to GDP ratio (at 48% for Germany and 44% for Poland in 2024, compared with 94% for the UK (International Monetary Fund, 2025a)). Germany also has much stronger political limits on running a deficit, and lower borrowing costs, than the UK. Germany and Poland are also increasing defence spending much more quickly than the UK (see Figure 7.12), and so there is a stronger case to smooth any longer-run adjustments in tax or spending plans through borrowing in the short run. Therefore the fact that Germany and Poland plan to borrow to fund much of the increase in defence spending does not necessarily mean that the UK could or should do the same.
Borrowing to fund increased defence spending
In conclusion, the commitment to increase defence spending represents a major fiscal challenge. It will mean that future governments – to the extent to which they maintain the pledge – will either have to reduce other types of spending, increase taxes or increase borrowing by a substantial amount, or do some combination of the three.
7.5 Further opportunities and challenges
In this section, we consider some wider opportunities and challenges associated with an increase in defence spending. First, we discuss the difficulties of translating higher planned spending into higher defence capabilities. We then evaluate the links between higher defence spending and faster economic growth.
Challenges of ramping spending up quickly
Rapidly increasing planned spending on any area comes with the risk that additional money will not be spent well – or, indeed, at all. In this case, higher defence spending in the UK is coupled with a concurrent increase in defence spending in many other European countries (as Section 7.3 describes in more detail). Moreover, defence spending is relatively capital intensive. Both of these factors mean that ramping up defence spending rapidly could prove particularly challenging.
It is notable, however, that Germany and Poland are both planning to increase defence spending much faster than the UK – indeed, Poland has recently delivered a larger increase in defence spending in two years than the UK plans over the next decade.
Underspends
Increasing planned defence spending does not necessarily or automatically mean increasing actual defence spending. Plans for departmental spending, including the Ministry of Defence, are set as spending limits rather than as central spending targets. This means departments tend to underspend against plans, both for day-to-day and for capital spending. This underspend has historically been greater (in proportional terms) for capital spending, and has tended in the past to be particularly large at points when plans for capital spending are being increased (Crawford, Johnson and Zaranko, 2018; Office for Budget Responsibility, 2020).
As shown in Section 7.2, defence spending is relatively capital intensive, and the top-up to defence spending plans is even more capital-heavy. This means that underspends against plans are especially likely: it is possible that the government will struggle actually to spend all of the planned increases in defence spending. For example, there may not be sufficient (available) domestic and international manufacturing capacity to meet the UK’s needs. Projects may also have large lead times before they can start, limiting the government’s ability to spend money on capital in the short to medium term.
International competition and higher prices
The government is increasing defence spending in part to increase military capabilities. As Box 7.1 in Section 7.3 describes, the government has a set of ambitions for defence performance beyond spending levels. However, the link between spending and military capabilities is not automatic.
Since many other countries are also planning to increase their defence spending, much international – and perhaps domestic – military manufacturing capacity will be going towards other countries’ plans rather than the UK’s. If manufacturing capacity cannot easily or rapidly increase, then without considerable pre-existing slack in capacity, rapidly increased domestic and international demand would push up the prices of equipment and consumables. This would mean that an increase in spending would not result in a proportional increase in purchases. That said, if the government can provide a clear and stable funding commitment, one would expect private providers to respond and increase manufacturing capacity accordingly – though perhaps not as quickly as the government might like, with bottlenecks possible. This would be one advantage of setting out a clear, credible path to spending 3.5% of national income on defence in 2035–36 earlier rather than later.
The COVID-19 pandemic provides a clear – albeit rather extreme – example of this phenomenon, where prices for much-needed medical equipment rose dramatically. For example, the prices paid by the UK government for respirators were 166% higher in February to July 2020 compared with 2019. Had the cost of personal protective equipment (PPE) items for health and social care workers not risen, UK government purchases would have cost £2.5 billion instead of £12.5 billion over this period (National Audit Office, 2020). Rising prices from international competition and limited supply therefore made the UK’s pandemic response much more expensive.
The government no longer produces measures of defence inflation, and many details on prices are commercially sensitive, so it is not possible to examine directly whether defence prices for the UK government are yet increasing. It is worth noting that in the US so far, defence inflation has actually grown at a slightly slower rate than economy-wide inflation since the end of 2021, suggesting this is yet to be a problem in the US at least (US Bureau of Labor Statistics, 2025; Federal Reserve Bank of St. Louis, 2025). It may be, for example, that production of military equipment can expand sufficiently fast to meet increased demand. The Strategic Defence Review proposes developing ‘a thriving, resilient innovation and industrial base that can scale in support of the Integrated Force’, the government is investing in expanding munitions manufacturing in the UK, and a new National Armaments Director will be responsible for developing industrial capacity. Europe is also rapidly expanding military manufacturing capacity. Nonetheless, it is possible that in coming years defence prices will rise, reducing the increase in purchasing power from higher budgets.
A related challenge comes from exchange rates. The Ministry of Defence makes many purchases in foreign currencies, particularly US dollars and euros, from international suppliers. But the plan to increase defence spending is in terms of pounds sterling. The department takes a number of steps to reduce exchange rate risk through forward currency contracts, but it estimated in 2023 that a 20% weakening of sterling would still increase the costs of its 10-year equipment plans by around 3% of its central estimate (Ministry of Defence, 2023b). A strengthening of sterling would have the opposite effect. Currency fluctuations could therefore also significantly change the link between how much is spent and what each pound delivers.
Delivering major projects
In many cases, there is likely to be a large lag between spending and capabilities. One reason for this is that it is the stock, not the flow, of investment in capital projects which determines military capabilities: increased investment in capital projects will take time to feed through into a higher stock of capital investment. Moreover, these large-scale capital projects typically take many years to deliver. Figure 7.16 shows the planned timescale of a range of major projects the Ministry of Defence was in the process of delivering in August 2025, along with the delivery confidence ratings assigned by the government. These are all substantial projects: the average whole-life cost of military capability projects was £7.3 billion in 2024–25, and some projects had costs well above this level (e.g. the whole-life cost of NSIGN, a project to support Royal Navy warships and submarines as well as maintain naval bases, is £20.3 billion).
Figure 7.16. Selected ongoing major Ministry of Defence projects in August 2025
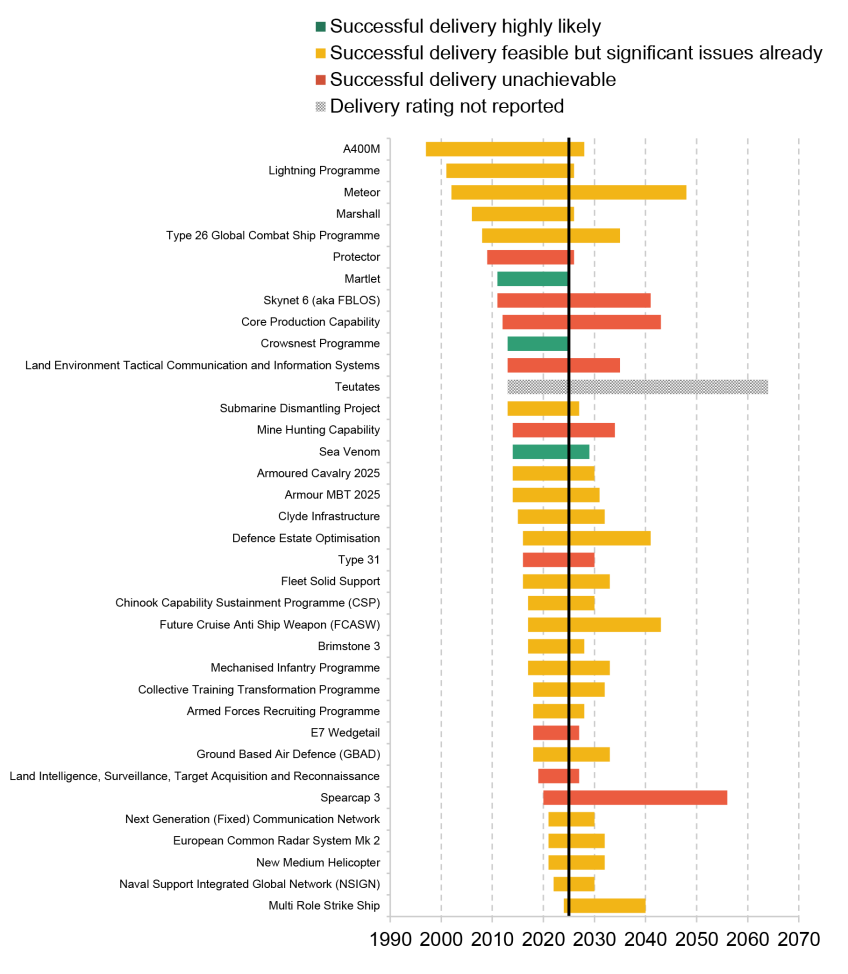
Note: Only includes ‘military capability’ projects with given start and end years. If projects have a range given for their end date, the mid-range date is used. Colour of bar refers to delivery confidence assessment (one delivery rating is not reported due to being sensitive for international relations). Vertical line reflects current year.
Source: National Infrastructure and Service Transformation Authority, 2025.
On average, the included projects are planned to run for 19 years, although there is considerable variation: some projects, such as the Naval Support Integrated Global Network (NSIGN) programme, are planned to be delivered over a shorter time horizon (between 2022 and 2030), while others are considerably longer. The longest project with a delivery rating, the Meteor programme – developing a long-range air-to-air missile – has been running since 2002, and will continue until 2048 on current plans.
As described in Section 7.4, increasing defence spending to 3.5% of GDP by 2035 will not result in the same military capabilities in 2035 as for a country that has consistently spent the same amount on defence, since defence spending – and capabilities – are so investment-heavy, reliant on a stock of equipment and infrastructure. The long lag between the start and end of a project is a further reason that higher spending levels will take time to feed through into improved capabilities. At least for these major projects, it may take at least a decade for the increase in defence spending to start to feed through into capabilities. And it may take further decades to have completed a sufficient number of these projects to have accumulated a capability to match a country that has consistently spent at this level over time.
There have long been challenges with defence procurement, and it could be argued that the importance of the commitment to a particular level of spending might worsen the MoD’s procurement problems – by prioritising money being spent at all rather than money being spent well.
In 2021, the National Audit Office reported that ‘the [Ministry of Defence’s] performance in delivering major defence programmes has been mixed’. The NAO has warned that there are frequent delays and cost increases to major equipment contracts – of the 13 programmes considered by the NAO, eight were forecast to be delayed and the average delay (including programmes on track or ahead of schedule) was 20 months (National Audit Office, 2021). The projects included in Figure 7.16 are given a delivery confidence assessment, either by the National Infrastructure and Service Transformation Authority or by the senior official responsible. As shown, most projects are rated amber – meaning that while successful delivery is possible, ‘significant issues already exist’ – and nine are rated red, meaning that ‘successful delivery of the project appears to be unachievable’ (National Infrastructure and Service Transformation Authority, 2025). These delivery issues are a further obstacle in the pathway from increasing spending to increasing defence capabilities.
Indeed, while major projects are challenging to deliver across government, the MoD appears to struggle with delivery even relative to other government departments. Figure 7.17 illustrates how major projects are rated in terms of delivery confidence across the seven departments currently delivering the most major projects (the MoD is currently delivering by far the most ratable projects, at 42; the Home Office, delivering the second-most projects, is delivering 19 ratable projects). As shown, only 7% of ratable MoD projects are rated green (for successful delivery appearing to be highly likely), compared with 12% of Department for Transport projects and 33% of Department for Energy Security and Net Zero projects. Only the Department for Environment, Food and Rural Affairs has a set of major projects rated worse than the MoD in terms of delivery confidence. Of course, it might be that defence projects are particularly challenging to deliver, rather than that the MoD is particularly poor at delivering them. Regardless, improving the MoD’s approach to procurement and project management could allow for greater capabilities to be delivered within the same funding envelope.
Figure 7.17. Delivery confidence assessment for major government projects in August 2025, split by department
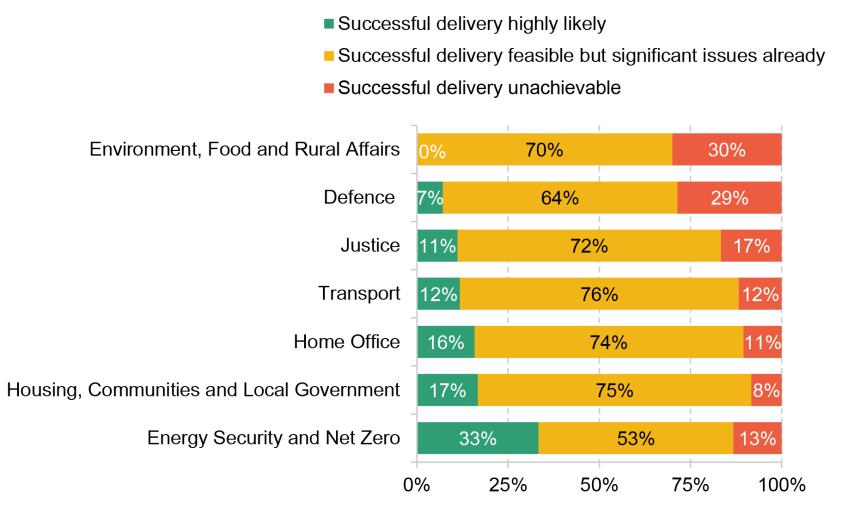
Note: Only includes projects with a ratable delivery confidence assessment. Only departments with more than 10 ratable projects are included.
Source: Authors’ calculations using National Infrastructure and Service Transformation Authority (2025).
Defence productivity
A related challenge when it comes to capability is defence productivity. Defence productivity broadly captures the relationship between inputs – in terms of either spending or the number of personnel and amount of equipment – and the capability of the military. As with all areas of spending, there is a risk that as spending increases rapidly, productivity will fall.
Measuring the productivity of defence spending is conceptually challenging, which makes it hard to understand how productivity is changing over time. In the past, the Office for National Statistics has not measured defence productivity when it measures public sector productivity, instead assuming that there is no change in productivity (by estimating defence outputs as equalling the inputs into defence). However, the ONS’s recent public sector productivity review started to develop new ways to do so and the MoD is also working on improved measures of defence output and efficiency (UK Statistics Authority, 2025). Although there will likely never be a perfect measure of productivity, these developments are welcome.
The government has set a range of productivity targets for government departments, discussed in more detail in Harvey-Rich and Warner (2025). At the 2025 Spending Review, the MoD committed to delivering £905 million of efficiencies per year by 2028–29 (HM Treasury, 2025b). A Defence Reform and Efficiency Plan will be published in the autumn, aiming to deliver nearly £6 billion additional efficiencies. The government also plans to cut the administration budget of the MoD by 15% in real terms between 2025–26 and 2029–30 – the Strategic Defence Review argued that MoD civil service costs should be reduced by at least 10% by 2030 (HM Treasury, 2025a; Ministry of Defence, 2025a). This will be particularly challenging given the considerable planned rise in the MoD’s budget over this period.
Growth opportunities
The government has made much of the potential growth opportunities from increasing defence spending. When pledging to increase defence spending to the new NATO goal of 5% of GDP, for example, the government argued that this would deliver ‘jobs, wages and growth for the British people to raise living standards and put more money in working people’s pockets’ (Prime Minister’s Office, 2025b). The Strategic Defence Review argued that defence ‘has significant untapped potential to be a new engine for growth’ (Ministry of Defence, 2025a). The government has welcomed the launch of a Defence and Economic Growth Taskforce, explicitly coupling the two, which has made a number of recommendations to ‘drive growth and create jobs’ (HM Treasury and Ministry of Defence, 2025).
The effect of increased defence spending on economic growth – like any increase in public spending – depends in part on how it is funded. The potential options for funding the increase are discussed in Section 7.4. If the government decides to fund increases in defence spending through lower spending on other areas, defence spending will only increase growth if it has a larger positive growth effect than spending on the services that are being cut back. It might be that defence spending has greater growth impacts from research and development spending (R&D, discussed in more detail below) than other public services, or that defence spending is more investment-focused than the spending that it replaces. However, health and education – the two largest other public services – also have growth benefits through R&D and increasing human capital.
If the government instead funds higher defence spending through higher taxes, the growth benefits of defence spending would have to offset the reduction in economic activity in the private sector resulting from higher taxes. Taxes reduce investment and consumption in the private sector directly, as that money is transferred to government, and can also introduce economic distortions that can further reduce growth.
If the government instead funds increased defence spending through higher borrowing, this fiscal loosening would provide a demand stimulus in the short term. By taking up ‘slack’, or spare capacity, in the economy, this stimulus could conceivably lead to higher growth. This might be particularly the case if the additional defence spending is investment-heavy: the Office for Budget Responsibility tends to use higher short-term ‘fiscal multipliers’ for investment than for day-to-day spending. But, by assumption, these fade to zero five years out. It is also possible that any meaningful demand stimulus would be offset by the Bank of England in the form of monetary policy being tighter than it otherwise would have been – for example, through Bank Rate being cut more slowly.
In the longer term, the key question is whether higher defence spending can boost the UK’s growth potential – the ‘supply side’ of the economy – through improvements in productivity. Here, it matters not just what impacts military investments might have, but also what impacts they might have relative to alternative investment opportunities. Increases in government investment spending on transport or science and technology, for example, have the potential to increase total factor productivity throughout the economy, while increases in spending on education have the potential to increase human capital and labour productivity.
In the rest of this section, we consider three specific ways in which defence spending could affect growth that differ from a general increase in public spending. These are the impact of defence R&D spending, the potential for increased defence exports to other countries also increasing their defence spending, and the impact of higher defence spending on regional growth.
Growth opportunities
One way in which defence spending could affect growth is via spillovers from R&D spending. If innovations made in the defence sector can also be applied to other sectors of the economy (so-called ‘dual-use’ technologies), this could increase economy-wide productivity and growth. The Strategic Defence Review focused extensively on the opportunities stemming from technological innovation. It proposed the creation of UK Defence Innovation, an organisation that will focus on ‘harnessing commercial innovation, including dual-use technologies’ and suggested that at least 10% of the MoD’s equipment budget should be spent on novel technologies each year (Ministry of Defence, 2025a).
Figure 7.18 shows government plans for R&D spending within departmental capital budgets. Overall R&D spending is set to rise slightly in real terms over this period, by an average of 0.7% per year in real terms, as shown in Panel A. But the MoD will see its R&D spending rise much faster than total R&D spending, at an average annual real increase of 7% (from £1.7 billion in 2025–26 to £2.2 billion in 2029–30 in 2025–26 prices).
Figure 7.18. R&D spending within departmental capital budgets
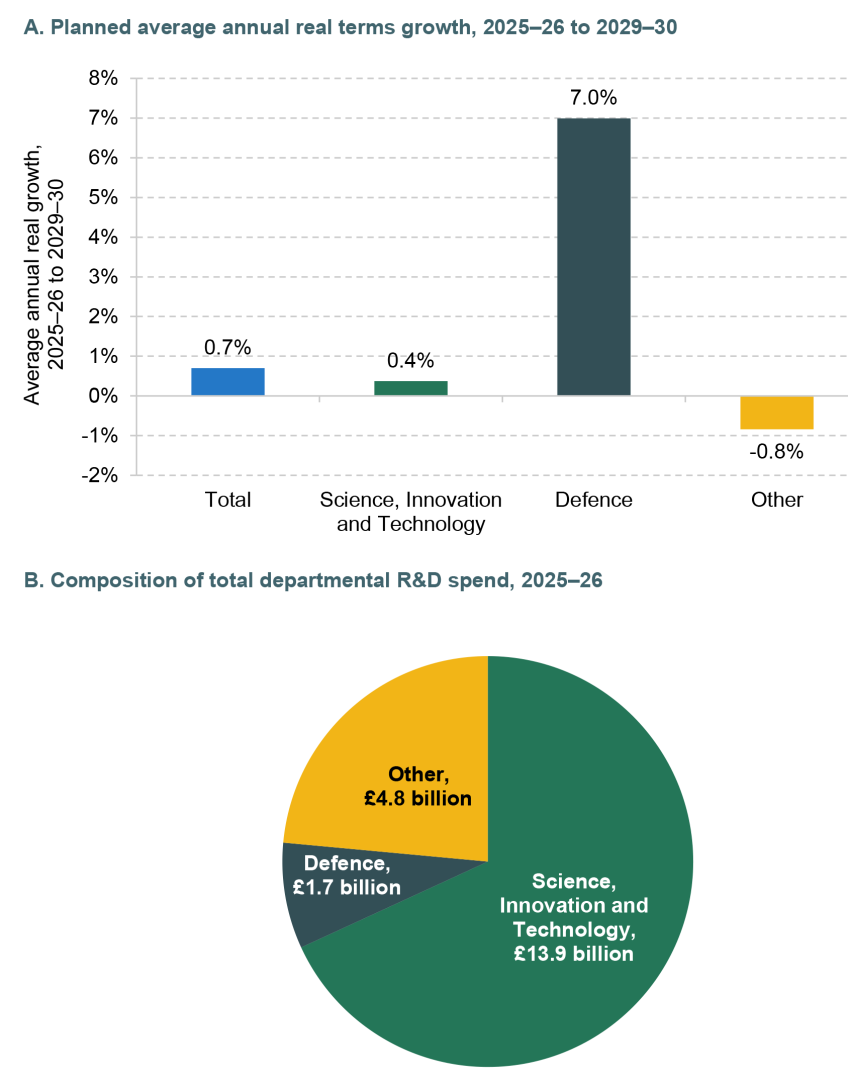
Source: Authors’ calculations using HM Treasury, Spending Review 2025.
While government defence R&D spending over the current Spending Review period has increased relatively fast, it is a small part of overall government R&D spending, as Panel B shows. In 2025–26, defence R&D is set to represent around 8% of total government R&D spending. Even rapid increases in defence R&D will therefore have a limited effect on total R&D spending.
It may also be that the increase in government defence spending encourages greater R&D investment by the private sector in a bid to win government contracts. The size and long time frame of the spending increase, as well as the emphasis on capital and equipment, make this particularly likely.
There is a range of academic evidence finding that government defence R&D expenditure can have positive effects on growth (although it is worth noting that there is no clear evidence that government defence R&D has larger spillovers than government non-defence R&D). Many high-profile examples of R&D spillovers from defence come from the World Wars – such as the development of radar – but there is also evidence of effects in later periods.
Moretti, Steinwender and Van Reenen (2025), for example, find that a 10% increase in government R&D spending leads to a 5–6% increase in privately funded R&D in the following year, using data from France and the OECD. The authors also find increases in R&D spending then have a modest positive effect on economy-wide productivity and that there are positive R&D spending spillovers across OECD countries, suggesting that UK R&D spending may also increase as other countries increase their R&D spending.
Relatedly, Antolin-Diaz and Surico (2025) find that increases in defence spending in the US persistently stimulate economic activity when they move more public spending towards R&D. These increases in R&D spending have persistent and growing impacts on both GDP and economy-wide productivity. Increases in R&D spending also have larger and longer effects than increases in overall government investment and government consumption. While the authors find that higher public R&D spending crowds out private investment and innovation in the short run (for around the first five years), they find it increases them in the medium run, increasing the impact of public R&D spending on growth.
The effect of defence R&D spending on growth could well be positive. But while increases in UK defence R&D are set to be rapid, defence R&D is currently a small part of total government R&D. The fact that the commitment to increase defence spending is both large and over a long time horizon makes it perhaps particularly likely to encourage much more private sector R&D investment. But existing plans would likely not have transformative effects on economic growth.
Potential for increased defence exports
While other countries’ planned increases to defence spending may lead to some challenges with rising prices, as described earlier, it also comes with a set of potential benefits for UK defence firms. Particularly relevant for this subsection is the potential for a boost to UK growth via an increase in defence exports to other countries. The UK is a significant defence exporter: between 2012 and 2021, one estimate puts the UK as the second-largest defence exporter after the US, with Russia and France also both at similar levels (UK Defence and Security Exports, 2023). As part of the Strategic Defence Review, the government committed to creating a new Defence Exports Office (Ministry of Defence, 2025a). Of course, some of the UK’s increase in defence spending will likely be spent on imports, which could offset the growth benefits of increased exports.
Figure 7.19 shows the estimated real-terms value of UK defence export orders by destination region. The lines on the chart fluctuate over time in part because the data capture the value of contracts signed in a given year, rather than exports delivered in that year. The especially large spike in the value of export orders to the Middle East in 2018, in particular, can be explained by contracts for supplying Typhoon aircraft and Brimstone missiles to Qatar entered into in that year (BAE Systems, 2017). These data should be treated with caution given the difficulty of measuring defence exports – they are collected by surveying defence firms, and the data for 2023, for example, had a company-level response rate of 17% (65% for the most important firms).
Figure 7.19. Value of UK defence export orders by destination region
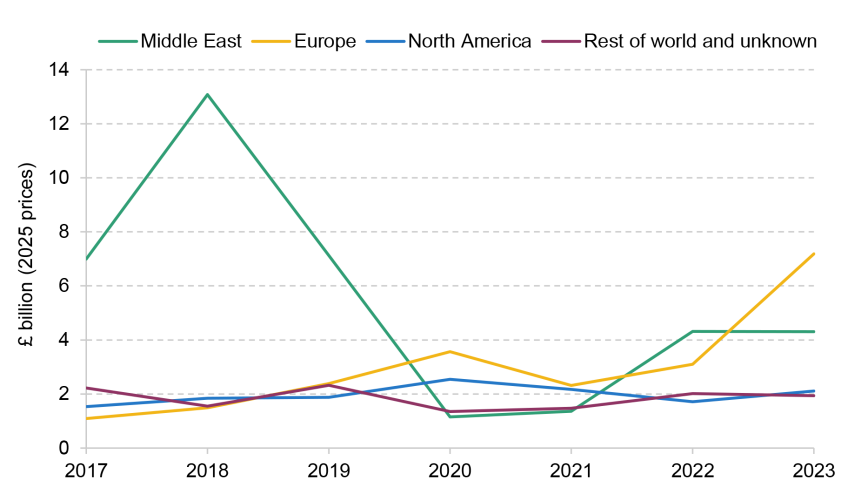
Note: Figure shows the full value of contracts on the years they were signed, regardless of when the delivery took place. Figures are adjusted for inflation using the GDP deflator as of June 2025. These data are not adjusted for firm non-response, so should be treated with caution.
Source: UK Defence and Security Exports, UK defence export statistics 2023, https://www.gov.uk/government/statistics/uk-defence-export-statistics-2023/uk-defence-export-statistics-2023; HM Treasury, GDP deflators at market prices, and money GDP June 2025, https://www.gov.uk/government/statistics/gdp-deflators-at-market-prices-and-money-gdp-june-2025-quarterly-national-accounts.
These data suggest that in 2023 total international defence orders were £14 billion (in cash terms). For comparison, total UK exports of goods and services in 2023 were £844 billion (Office for Budget Responsibility, 2025a). Therefore although the UK is a significant defence exporter relative to other countries, defence exports still make up a small share of the UK’s total exports. This limits the potential economic benefits of increased defence exports.
The three largest areas of UK defence exports are Europe, the Middle East and North America. There has been a clear increase in orders to European countries since Russia’s full-scale invasion of Ukraine in 2022, increasing from £2.3 billion in 2021 to £7.2 billion in 2023 (both in 2025 prices). Much of the rise in 2023 can be explained by large contracts signed with Poland (Prime Minister’s Office, 2023; Ministry of Defence, 2023a); we describe the rapid rise in Polish defence spending over this period in Section 7.3.
Further increases in defence spending by some of these countries could represent a meaningful export opportunity for UK defence firms. We are already seeing this to an extent: in August, for example, the UK and Norway agreed a deal under which UK firms would supply Norway with at least five new warships (Beale and Rawnsley, 2025). But many other countries are also seeking to develop their own domestic military industries, and there has been a large expansion of military factories in Europe in recent years (Dubois, Djambazov and Cook, 2025), likely increasing the degree of competition facing UK exporters. The Middle East is also currently the UK’s largest defence export market and, unlike with NATO countries, it is less clear how the demands of Middle Eastern countries – or the UK’s willingness to supply them – will evolve in the coming years.
Regional growth impacts
Even if defence spending does not increase UK-wide economic growth, it could still shift economic activity within the UK. As with the effects on total growth, the shift in economic activity will depend on how the increase to defence spending is funded. If funded through cuts to other spending, the effect will depend on the regional distribution of that other spending, and if funded through increases to tax, the effect will depend on the regional effects of the tax rises. As a simple example, if defence spending is funded through raising a tax that reduces consumption approximately equally per household across the UK and this revenue is spent on building new warships in Scotland, this will increase growth in Scotland at the expense of other regions. As shown below, defence spending and defence manufacturing are unequally distributed across the UK, which could have substantial impacts on regional growth.
The Ministry of Defence estimates the regional impact of its spending with industry – the amount spent on contracts with defence firms based in different regions – and the share of jobs that are supported by this spending. Figure 7.20 shows these estimates for 2023–24. Panel A shows the MoD’s expenditure with industry in per-person terms, while Panel B shows the estimated share of jobs in each region directly supported by MoD spending. These are defined as jobs supported within companies receiving payments for goods and services directly from MoD, so do not include either those directly employed by the MoD or those indirectly employed through supply chains.7
The South West is the region that currently directly benefits the most per person from UK defence spending. The Royal Navy has important bases in the South West, with HMNB Devonport – one of three Royal Navy operating bases and the only nuclear repair facility for the Royal Navy – in Plymouth, and a Royal Navy air station in Culdrose (Royal Navy, 2025). Major defence employers are concentrated in the region: for example, Babcock operates much of HMNB Devonport, maintaining Royal Navy submarines; the UK’s only helicopter plant is headquartered in Yeovil (Jolly, 2024); and there is a Rolls-Royce base in Filton. In 2023–24, defence expenditure with industry was equivalent to £1,190 per person in the South West, directly supporting 1.7% of jobs. The South East is next, with spending of £750 per person supporting 1.1% of jobs, followed by the North West, with spending of £500 per person supporting 0.7% of jobs. At the other end, Northern Ireland, Yorkshire & the Humber and the North East are the least impacted. For example, Yorkshire & the Humber has MoD industry spending of £110 per person, supporting just 0.15% of jobs (less than a tenth of the South West level).
If these patterns remain similar in the coming years, then the expansion of UK defence spending would likely alter regional patterns of growth in such a way as to benefit particularly the South West, South East and North West of England. Of course, these patterns may not remain constant over time, but are likely to at most change relatively slowly given existing manufacturing infrastructure and workforce skills, and the potential for new or expanding firms to locate around existing clusters of those skills.
7.6 Conclusion
Plans to increase defence spending substantially pose a major fiscal challenge for the UK. This challenge is unlikely to be significantly alleviated by any positive impacts higher defence spending might have on economic growth. The current government has been forced to grapple with this challenge, and has already set out how it will increase defence spending up to the end of this parliament and how this increase will be paid for. But it seems likely to face pressure to move further and faster. Defence spending will be an even greater challenge for future governments, who will have to increase defence spending further if they are to hit the new NATO commitment of 3.5% of GDP by 2035. Importantly, they will have to decide how any increase is to be funded.
If future governments decide to fund additional spending on defence through cuts to other areas of public spending, this will reshape the state: ‘salami slicing’ areas to make small savings, without paring back what those services are expected to deliver, will not be sufficient to offset an increase in spending of 1.2% of GDP, or £36 billion a year in current terms. If future governments instead decide to increase tax revenues to fund additional spending, the changes that will be needed are also substantive, and likely to require broad-based tax rises rather than small tweaks. Borrowing could help smooth the path to a new equilibrium – especially if spending needs to rise much more quickly than currently anticipated – but borrowing to fund a permanent increase in defence spending is unlikely to be sustainable, and would be difficult to justify on the sole grounds of its beneficial impact on economic growth.
It is, of course, not certain that defence spending will reach 3.5% of national income in 2035 – the current government cannot commit future governments in this way, and a lot can change in a decade. While it is a NATO commitment, these do not always strictly bind governments: more than a third of NATO allies were not meeting the previous 2% commitment in 2024. But it is not clear which direction of deviation is more likely. It seems possible that UK governments will have to go further and faster with defence spending, like Germany and Poland. But it is also possible that defence spending will not reach 3.5% of GDP, either because it proves too fiscally challenging or because of changes in the perceived need for defence spending.
Increasing defence spending is just one of many fiscal pressures facing the UK in the medium term. There are also challenges from, for example, an ageing population pushing up spending on the state pension and health and social care (absent large policy changes), and declining revenues from fuel duties as electric vehicles become more widespread. Higher defence spending is a medium-term challenge, and is likely particularly to fall on the next few governments if they maintain the current NATO spending commitment. But unlike some of these other challenges, major parties currently look broadly aligned on the need for more defence spending.
The level of defence spending matters for fiscal policy, and has been the focus of both the UK government and its allies. But what ultimately matters for the UK’s security is defence capabilities. Ensuring that defence money is spent well, and that procurement challenges are overcome, will be critical in the years ahead. The importance of investment within defence spending – on things such as weaponry, aircraft and R&D – means that defence capabilities will increase more slowly than defence spending.
Looking even further ahead, a key question is whether the current rise in defence spending as a share of national income – reversing decades of falling spending, which has offset our rising spending on health and other areas – will be a permanent increase or a temporary fluctuation. The answer to this question will have enormous implications for the size and shape of the UK state in decades to come.
References
Antolin-Diaz, J. and Surico, P., 2025. The long-run effects of government spending. American Economic Review, 115, 2376–413, https://doi.org/10.1257/aer.20231278.
BAE Systems, 2017. Qatar agrees contract for Typhoon aircraft. https://www.baesystems.com/en-uk/article/qatar-agrees-contract-for-typhoon-aircraft.
Beale, J. and Rawnsley, J., 2025. UK secures £10bn deal to supply Norway with warships. https://www.bbc.co.uk/news/articles/cr5rgdpvn63o.
Boileau, B., 2025. Public service spending: small changes, big challenges. https://ifs.org.uk/sites/default/files/2025-03/Public_service_spending_small_changes_big_challenges_BB.pdf.
Cabinet Office, 2023. Security and Intelligence Agencies Financial Statements 2022-23. https://www.gov.uk/government/publications/security-and-intelligence-agencies-financial-statement-2022-2023/security-and-intelligence-agencies-financial-statements-2022-23-html.
Council of the European Union, 2025a. Coordinated activation of the national escape clause. https://www.consilium.europa.eu/en/press/press-releases/2025/04/30/coordinated-activation-of-the-national-escape-clause/.
Council of the European Union, 2025b. National escape clause for defence expenditure. https://www.consilium.europa.eu/en/policies/national-escape-clause-for-defence-expenditure-nec/.
Crawford, R., Johnson, P. and Zaranko, B., 2018. The planning and control of UK public expenditure, 1993−2015. Institute for Fiscal Studies, report, https://ifs.org.uk/publications/planning-and-control-uk-public-expenditure-1993-2015.
Dubois, L., Djambazov, D. and Cook, C., 2025. Europe builds for war as arms factories expand at triple speed. https://www.ft.com/content/ce617187-43ed-4bec-aebf-b1b346c4cfb1.
Euronews, 2025. Poland’s president vows to spend 4.7% of GDP on defence this year. https://www.euronews.com/my-europe/2025/02/05/polands-president-vows-to-spend-47-of-gdp-on-defence-this-year.
European Commission, 2025. EU Member States endorse €150 billion SAFE defence loan instrument to boost European defence capabilities. https://ec.europa.eu/commission/presscorner/detail/en/ip_25_1340.
Federal Reserve Bank of St. Louis, 2025. Gross domestic product: implicit price deflator. https://fred.stlouisfed.org/series/GDPDEF.
Giordano, E. and Kayali, L., 2025. Italy to hit NATO target this year as Meloni preps for Trump meeting. https://www.politico.eu/article/italy-will-meet-nato-defense-spending-target-this-year/.
Harvey-Rich, O. and Warner, M., 2025. The outlook for public sector productivity. Institute for Fiscal Studies, Green Budget chapter, https://ifs.org.uk/publications/outlook-public-sector-productivity.
HM Treasury, 2025a. Spending Review 2025. https://assets.publishing.service.gov.uk/media/68627094354985706f111adc/E03349913_HMT_Spending_Review_June_2025_TEXT_CS_Accessible__002_.pdf.
HM Treasury, 2025b. Spending Review 2025: Departmental Efficiency Plans. https://assets.publishing.service.gov.uk/media/68492799d0ca5d7801e4e709/Efficiency_delivery_plans_-_supplementary_document_-_FINAL.pdf.
HM Treasury and Ministry of Defence, 2025. Government and business put forward ‘Team UK’ approach to unleash defence sector’s potential. https://www.gov.uk/government/news/government-and-business-put-forward-team-uk-approach-to-unleash-defence-sectors-potential.
Höller, L., 2025. Germany plans to double its defense spending within five years. https://www.defensenews.com/global/europe/2025/06/26/germany-plans-to-double-its-defense-spending-within-five-years/.
Infrastructure and Projects Authority, 2025. Infrastructure and Projects Authority Annual Report 2023-24. https://www.gov.uk/government/publications/infrastructure-and-projects-authority-annual-report-2023-24/infrastructure-and-projects-authority-annual-report-2023-24-html.
Institute for Fiscal Studies, 2024. How do UK tax revenues compare internationally? https://ifs.org.uk/taxlab/taxlab-key-questions/how-do-uk-tax-revenues-compare-internationally.
International Monetary Fund, 2025a. World Economic Outlook Database. https://www.imf.org/en/Publications/WEO/weo-database/2025/april.
International Monetary Fund, 2025b. GDP, current prices. https://www.imf.org/external/datamapper/NGDPD@WEO/OEMDC/ADVEC/WEOWORLD/FRA.
Johnson, P., 2025a. Spring Statement 2025, Paul Johnson opening remarks - 27 March 2025. https://ifs.org.uk/collections/spring-statement-2025.
Johnson, P., 2025b. Cut aid and benefits to boost defence? The sums don’t quite add up. https://ifs.org.uk/articles/cut-aid-and-benefits-boost-defence-sums-dont-quite-add.
Jolly, J., 2024. Live and let fly: James Bond helicopter firm awaits UK decision on £1bn deal. https://www.theguardian.com/business/2024/sep/20/james-bond-helicopter-uk-yeovil-leonardo.
Jopson, B. and Foy, H., 2025. Spain secures opt-out from new Nato spending goal, says Sánchez. https://www.ft.com/content/24a449fc-51ad-4b51-88cb-dd1e9df4deed.
Kayali, L., 2025. Macron promises billions more for French defense budget. https://www.politico.eu/article/emmanuel-macron-france-defense-budget/.
Kington, T., 2025. Italy opposes EU defense-spending scheme, checking bloc’s momentum. https://www.defensenews.com/global/europe/2025/03/20/italy-opposes-eu-defense-spending-scheme-checking-blocs-momentum/.
Kirk-Wade, E., 2025. UK defence personnel statistics. House of Commons Library, research briefing, https://commonslibrary.parliament.uk/research-briefings/cbp-7930/.
Lloyd, N., 2025. Rachel Reeves should exempt defence pledge from budget rules, says Gordon Brown. https://www.independent.co.uk/news/business/rachel-reeves-gordon-brown-gdp-nato-national-institute-of-economic-and-social-research-b2803515.html.
Ministry of Defence, 2023a. £4 billion UK-Poland air defence deal strengthens European security. https://www.gov.uk/government/news/4-billion-uk-poland-air-defence-deal-strengthens-european-security.
Ministry of Defence, 2023b. Equipment Plan 2023-2033: update on affordability. https://assets.publishing.service.gov.uk/media/65a16ef469fbd3001325c067/PUS_to_PAC_Equipment_Plan_23-33_Corrected.pdf.
Ministry of Defence, 2024. Strategic Defence Review 2024-2025: terms of reference. https://www.gov.uk/government/publications/strategic-defence-review-2024-2025-terms-of-reference/strategic-defence-review-2024-2025-terms-of-reference.
Ministry of Defence, 2025a. Strategic Defence Review. https://www.gov.uk/government/publications/the-strategic-defence-review-2025-making-britain-safer-secure-at-home-strong-abroad.
Ministry of Defence, 2025b. UK to expand submarine programme in response to Strategic Defence Review. https://www.gov.uk/government/news/uk-to-expand-submarine-programme-in-response-to-strategic-defence-review.
Moretti, E., Steinwender, C. and Van Reenen, J., 2025. The intellectual spoils of war? Defense R&D, productivity, and international spillovers. The Review of Economics and Statistics, 107, 14–27, https://doi.org/10.1162/rest_a_01293.
National Audit Office, 2020. The supply of personal protective equipment (PPE) during the COVID-19 pandemic. https://www.nao.org.uk/wp-content/uploads/2020/11/The-supply-of-personal-protective-equipment-PPE-during-the-COVID-19-pandemic.pdf.
National Audit Office, 2021. Improving the performance of major equipment contracts. https://www.nao.org.uk/wp-content/uploads/2021/06/Improving-the-performance-of-major-equipment-contracts.pdf.
National Infrastructure and Service Transformation Authority, 2025. NISTA annual report 2024-2025. https://www.gov.uk/government/publications/nista-annual-report-2024-2025.
NATO, 2014. Wales Summit Declaration. https://www.nato.int/cps/en/natohq/official_texts_112964.htm.
NATO, 2025. The Hague Summit Declaration. https://www.nato.int/cps/en/natohq/official_texts_236705.htm.
Office for Budget Responsibility, 2020. Capital spending plans: how much will actually be spent? https://obr.uk/box/capital-spending-plans-how-much-will-actually-be-spent/.
Office for Budget Responsibility, 2024. Fiscal risks and sustainability – September 2024. https://obr.uk/frs/fiscal-risks-and-sustainability-september-2024/.
Office for Budget Responsibility, 2025a. Economic and fiscal outlook – March 2025. https://obr.uk/efo/economic-and-fiscal-outlook-march-2025/.
Office for Budget Responsibility, 2025b. Public finances databank 2024-25. https://obr.uk/public-finances-databank-2024-25/.
Oleksiejuk, M., 2025. Sharing the burden: how Poland and Germany are shifting the dial on European defence expenditure. NATO Review, https://www.nato.int/docu/review/articles/2025/04/14/sharing-the-burden-how-poland-and-germany-are-shifting-the-dial-on-european-defence-expenditure/index.html.
Perelman, M., 2025. French budget crisis: PM Bayrou floats abolishing two national holidays as part of spending cuts. https://www.france24.com/en/france/20250715-french-pm-unveils-budget-expected-to-slash-govt-spending-by-%E2%82%AC40-billion.
Prime Minister’s Office, 2023. Record £1.9 billion UK-Poland missile export deal set to bolster European security. https://www.gov.uk/government/news/record-19-billion-uk-poland-missile-export-deal-set-to-bolster-european-security.
Prime Minister’s Office, 2025a. PM statement on defence spending: 25 February 2025. https://www.gov.uk/government/speeches/pm-statement-on-defence-spending-25-february-2025.
Prime Minister’s Office, 2025b. UK to deliver on 5% NATO pledge as Government drives greater security for working people. https://www.gov.uk/government/news/uk-to-deliver-on-5-nato-pledge-as-government-drives-greater-security-for-working-people.
Prime Minister’s Office, 2025c. Prime Minister sets out biggest sustained increase in defence spending since the Cold War, protecting British people in new era for national security. https://www.gov.uk/government/news/prime-minister-sets-out-biggest-sustained-increase-in-defence-spending-since-the-cold-war-protecting-british-people-in-new-era-for-national-security.
Royal Navy, 2025. Bulldozers and builders move in as Culdrose’s £135m transformation begins. https://www.royalnavy.mod.uk/news/2025/august/13/20250813-bulldozers-and-builders-move-in-as-culdroses-135m-transformation-begins.
Sabbagh, D., 2025. British Army will not be increased in size this parliament, John Healey says. https://www.theguardian.com/uk-news/2025/jun/01/british-army-will-not-be-increased-in-size-this-parliament-john-healey-says.
Schnabel, I., 2025. No longer convenient? Safe asset abundance and r*. European Central Bank, https://www.ecb.europa.eu/press/key/date/2025/html/ecb.sp250225~49a8dd911a.en.html.
UK Defence and Security Exports, 2023. UK defence and security export statistics: 2021. https://www.gov.uk/government/statistics/uk-defence-and-security-exports-for-2021/uk-defence-and-security-export-statistics-2021.
UK Statistics Authority, 2025. National Statistician’s Independent Review of the Measurement of Public Services Productivity. https://uksa.statisticsauthority.gov.uk/publication/national-statisticians-independent-review-of-the-measurement-of-public-services-productivity/.
US Bureau of Labor Statistics, 2025. PPI commodity data for final demand-government purchases, defense, seasonally adjusted. https://data.bls.gov/dataViewer/view/timeseries/WPSFD49405.
Zettelmeyer, J., 2025. What does German debt brake reform mean for Europe? https://www.bruegel.org/newsletter/what-does-german-debt-brake-reform-mean-europe.
Endnotes
Authors

Bee Boileau
Bee joined the IFS in 2021 as a Research Economist and works in the Retirement, Saving and Ageing sector.

Max Warner
Max joined the IFS in 2020. His work covers health and social care, public spending and public sector productivity.
More from IFS
Understand this issue


Policy analysis


Academic research