
Downloads
Download chapter PDF
PDF | 1.78 MB
Like many previous governments, this government has made improving public sector productivity a key focus. In the June Spending Review, it set out ambitious plans for improving productivity and efficiency over the rest of the parliament. Whether it can deliver these improvements will matter for public service performance, the public finances and broader economic growth. In this chapter, we examine and evaluate the government’s plans to reduce central administration spending and improve the productivity of public service delivery. We then consider what different scenarios for public sector productivity could mean for public services, public spending and GDP.
Key findings
- At the 2025 Spending Review, the government set out plans for all government departments to deliver at least 5% ‘savings and efficiencies’ by 2028–29. This includes making almost £14 billion of efficiency gains in the delivery of public services by 2028–29 (£9 billion of which are planned to be from the NHS) and cutting central administration budgets by another £2 billion. This government is far from the first to set out such ambitions – the 2021 Spending Review, for example, also planned to make 5% departmental efficiencies over a three-year period.
- Cutting central administration budgets could improve productivity – but it will not automatically do so. Administration budgets are a small part of what government spends its money on – making up 1% of total public spending and 2.0% of departmental spending in 2024–25. A risk is that seeking savings from (relatively small) administration budgets could prove counterproductive, if those cuts have adverse consequences for broader public service performance. Reductions in the quality of central IT or procurement systems, for example, could easily restrict what front-line services can deliver. Delivering this scale of cuts to administration budgets is certainly possible: the coalition government delivered larger cuts in the early 2010s. But the plans to make almost identical cuts across departments make little sense, and will likely make it more difficult than is necessary to deliver the savings.
- There is much more scope to improve public sector productivity by improving the day-to-day delivery of public services. It makes sense, therefore, that the government has provided detailed implementation plans and targets for public services. The government’s plans include a Transformation Fund for up-front investment in specific productivity improvements: a welcome step. It may be that artificial intelligence – an area of focus for the government – will deliver productivity improvements, though there is considerable uncertainty around how big these will prove to be. But many of the other themes in the government’s plans, such as digitising services or reducing the size of the government estate, have appeared in numerous similar strategies under recent governments.
- Almost two-thirds of the planned public service productivity gains are set to come from the NHS in England, where plans imply that hospitals will only return to pre-pandemic levels of productivity by 2028–29. The fact that productivity remains below pre-pandemic levels for many services would indicate there is still some scope for catch-up growth, though provisional Office for National Statistics (ONS) productivity data for recent years suggest that catch-up growth has stalled, or at least slowed down – raising the fear that the pandemic dealt an enduring hit to public service productivity. It is notable that these plans do not include targets for some important public services, such as schools and local government in England.
- If the government can deliver its productivity plans, we estimate that public service funding productivity – the ratio of the outputs of public services to funding – will be 2.3% higher by 2028–29. In other words, providing the same level of public services will be 2.3% cheaper than if the plans were not delivered. That would be a big change from the historical pattern, where estimates suggest that between 1997 and 2019 public services tended to become more expensive to provide over time, not less (i.e. funding productivity was falling).
- This 2.3% improvement in funding productivity in 2028–29 – like all of the numbers in the government’s productivity plans – should not be directly compared to the ONS measure of public sector productivity, which is a measure of input productivity – the relationship between public service inputs (such as staffing and equipment) and public service outputs. We estimate that by 2028–29 the government’s plans imply a 2.9% increase in input productivity, equivalent to 1.0% per year. That is more than four times faster than the estimated average annual growth rate between 1997 and 2019 (0.2% per year). It is closer to, but still significantly faster than, the average annual growth rate between 2009 and 2019 (0.7% per year). The government’s plans are therefore ambitious compared with the recent past.
- If the government fails to achieve its planned increase in public service productivity, it would face a choice between settling for public service performance falling short of plans or topping up spending plans. If it decides to maintain current spending plans, this would increase the risk of falling short of ambitious targets for improved service performance. If the government instead decides to top up spending, this would need to be financed, with potential consequences for adherence to the fiscal rules. If the government only delivers half of its planned productivity improvements, then achieving the same level of public sector performance as currently implied would require a £9 billion top-up to spending in 2028–29. If funding productivity stays flat, this would double to an £18 billion top-up.
- Public sector productivity also matters for economy-wide growth. Higher public sector productivity can increase GDP, via an increase in the production of public services, a sizeable chunk of the economy. The direct benefits to the exchequer from this increase in GDP would be limited, at least in the short run, because it would not lead to higher tax revenues (unlike a similarly sized boost to private sector productivity).
6.1 Introduction
The government has made improving productivity in the public sector a key objective, and one which underpins many of its other domestic objectives for this parliament. Whether the government can successfully deliver on its productivity targets will influence whether it achieves its ambitious plans for public service performance. It will also influence whether current spending plans – set at the recent Spending Review – can be stuck to, or will need to be topped up. Given the role the public sector plays in the economy, it also matters for the UK’s broader macroeconomic performance.
At the Spending Review, Rachel Reeves argued that the government is making ‘reforms that will make public services more efficient, more productive and more focused on the user’ (Reeves, 2025). The government has asked all government departments to ‘deliver at least 5% savings and efficiencies by 2028–29’ (HM Treasury, 2025a) and set out plans to reduce central administration costs and to increase efficiency in the delivery of public services. This government, however, is far from the first to want to improve public sector productivity. Initiatives to improve government efficiency have been set out under a wide range of governments, including the 1979–83 Efficiency Unit (National Audit Office, 1986) and the 2004 Gershon Review of public sector efficiency. More recently, the 2021 Spending Review also set out a commitment to make efficiency savings of 5% of day-to-day departmental budgets over the three years to 2024–25 (HM Treasury, 2021).
Wanting to improve public sector productivity is a sensible ambition. Higher productivity means that better public services can be delivered for the same level of spending. This will be particularly desirable for a government with big aspirations for public services but little fiscal headroom or appetite to raise taxes further. Since the public sector is also a substantial part of the total economy, higher public sector productivity will also boost overall GDP.
In this chapter, we consider the government’s plans for public sector productivity improvements and assess some of the potential consequences if they are – or are not – achieved. After setting out the basics of public sector productivity, we go on to analyse the government’s plans for cuts to central administration costs, including the civil service. We then examine plans to increase the productivity of public service delivery, like the NHS. Throughout, we examine what past governments have achieved and discuss the merits of the current government’s delivery plans. We then estimate what combined impact these plans would have – if delivered – on public sector productivity, and compare this with historical public sector productivity trends.
Our analysis shows that the government’s planned productivity improvements are highly ambitious compared with the recent past. For this reason, it is far from guaranteed that the government will achieve them. We therefore produce a range of alternative scenarios to set out what changes to productivity could mean both for the performance of public services and for the public finances. If public sector productivity grows by less than the government is aiming for, it will be forced to decide whether to allow public service performance to fall short of plans or whether to top up planned spending. This could put considerable pressure on spending plans by the end of the parliament. We also consider the impact of changes to public sector productivity on economy-wide GDP and productivity growth.
Throughout this chapter, we focus on the UK government’s plans for productivity. These concern UK-wide plans in matters reserved for the UK parliament, such as defence, and plans for specific nations for other public services, such as for the NHS (England) and policing (England and Wales). This means we do not consider productivity plans that devolved governments have. While these plans are important for public service delivery in the devolved nations, they do not affect UK government spending plans (at least directly).1 Moreover, the UK government has not set out detailed productivity plans or targets for schools or local councils in England. This means we are unable to account for the impacts of planned productivity improvements in these areas.
The rest of this chapter is organised as follows. In Section 6.2, we set out the basics of public sector productivity: we define what it is, describe different types, consider why it matters, outline the challenges of measuring it, and summarise what has happened to public sector productivity in recent decades. In Section 6.3, we discuss the government’s plans for administration and civil service savings. In Section 6.4, we discuss its plans for improving the productivity of public service delivery. In Section 6.5, we estimate the total impact of the government’s plans on public sector productivity. In Section 6.6, we consider the fiscal and economic impacts of scenarios for public sector productivity. Section 6.7 concludes.
6.2 A beginner’s guide to public sector productivity
What is productivity?
Productivity captures the relationship between the outputs or outcomes of a system and the inputs that system uses. For example, for the NHS, productivity could capture the relationship between the number of patients treated and their health (outputs and outcomes), and the number of staff working in the NHS and the equipment that they utilise (inputs). Broadly, a system becomes more productive if it can produce more or better output or outcomes from the same level of inputs or if the same level of outputs or outcomes can be produced with a lower level of inputs.
In any system, including the public sector, productivity is affected by almost every aspect of how the process is organised. Which factors matter the most can often depend on the exact type of productivity we are interested in, as discussed later in this section. However, common sources of productivity improvements can include advances in and better utilisation of technology, higher-quality organisation and management, and changes in the way services are designed or delivered (van Ark, Hoskins and Jörden, 2023; HM Treasury, 2023).
The different ways of thinking about productivity
There are a range of inputs, outputs and outcomes that might be relevant when we consider the productivity of a system, including public services. Take again the example of the NHS. Doctors are one important input, but there are also nurses, medical equipment, medicines, hospital buildings and ultimately the funding that NHS organisations receive from government. The NHS produces surgery and MRI scans, but the ultimate objective is to improve the health of the population.
There is therefore a range of possible types of public sector productivity, depending on which types of inputs and outputs we measure. This matters because these different types of productivity can often display different trends and will often by affected by different factors.
Starting with inputs, there are three common ways of measuring the inputs used to produce public services:
- Funding. The broadest approach is to measure the funding that a public service receives. Using funding as a measure of input produces measures that we term funding productivity, and this is close to the concept of value for money and efficiency (HM Treasury, 2023). This is often what the government cares about when it thinks about productivity.
- Quantities of all inputs. An alternative measure is to consider the quantity of all types of inputs that are used in production. Typically, inputs are split into workforce (e.g. teachers), intermediate goods and services (e.g. textbooks) and capital services (e.g. the use of a school building), which is the approach that the Office for National Statistics takes to measure inputs when it measures public service productivity. Ideally, this would also take into account differences in the types and qualities of inputs (e.g. the difference between more- and less-skilled staff). Using the quantity of all inputs produces measures that we term input productivity. Because the inputs are measured in quantities, the main difference between this approach and using funding is that funding productivity is affected by the price of inputs, while this approach is not.2
- Workforce. Another common measure of inputs is to use the quantity of staff used by the public service. This is similar to the previous approach but does not include intermediate goods and services and capital services. Using workforce as the measure of input produces labour productivity measures. The difference between input and labour productivity is that increases in these other (non-labour) inputs can increase labour productivity but may not increase input productivity. For example, if a hospital has more medical equipment, that may make staff more productive, but it may not make the whole hospital more productive since the increase in medical equipment represents an increase in total inputs.
Turning to the output side, there are a range of approaches to measuring the output and outcomes of public services. Ideally, we might wish to measure the output of public services by the improvement they lead to in people’s health, skills, well-being and other outcomes we value, and which these services are aiming to improve. In practice, it is often more feasible to look at the quantity of outputs of public services – such as the number of patients treated or pupils taught – and adjust where possible for the quality of those outputs. Later in this section, we discuss the practical limitations with measuring both outcomes and outputs.
The distinction between outputs and outcomes is also important for different types of productivity. This leads to another categorisation of productivity:
- Technical efficiency. This measures how quantities of inputs are translated into quantities of outputs. For example, how productively can a hospital deliver appointments with a given number of staff? This is an important type of productivity – all else equal, we want to produce the most outputs we can with the inputs available.
- Allocative efficiency. But a broader type of productivity comes when we focus more on outcomes than outputs of public services. This is closer to a concept of allocative efficiency. We should not just care about how much output public services can deliver, but also whether these are the right outputs. For example, it may be that hospitals can provide lots of outpatient appointments, but if these are not actually improving health, in a broader sense they should not contribute to higher measured productivity. The government might achieve more for people’s health outcomes by deploying that funding and those staff members elsewhere – for example, providing care in the community. When we consider the outcomes of public services, the mix of different types of outputs, and their quality, matter just as much as how productively public services can produce individual outputs.
Figure 6.1 summarises the different types of productivity that we have discussed in this subsection. In practice, there is not one single approach to productivity that is best: each tells you something different. For example, we want public services to be technically efficient, allocatively efficient, and have good funding productivity by keeping input prices low. The differences between these different approaches are also often informative to understanding the different drivers of productivity changes.
Figure 6.1. Types of public service productivity
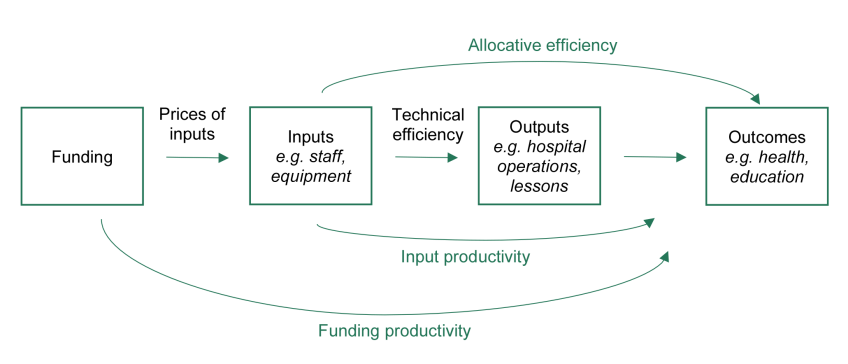
Note: See also van Ark (2022) for a similar approach to decomposing types of productivity.
Why does productivity matter?
There are a number of reasons that higher public service productivity is desirable. All else equal, higher productivity means delivering more or better public services with the same resources, or the same level and quality of public services with fewer resources. That means some combination of higher-performing public services and/or lower taxes or public borrowing. Higher public service productivity therefore loosens the fiscal trade-off facing the government between higher quality of public services and lower levels of tax and/or borrowing.
Public service productivity matters not only for public services and the public finances now, but also in the future. As the spending pressures of an ageing population mount in the decades to come, the productivity of the public sector – and in particular the health and social care systems – will be an important determinant of how manageable those pressures are. For example, Figure 6.2 shows the Office for Budget Responsibility’s 2024 projections for health spending under alternative scenarios for the productivity of the NHS. Different levels of NHS productivity make a dramatic difference in health spending over the coming decades, with health spending as a share of GDP ranging from 10.7% in 2073–74 in the higher health productivity scenario to almost double, at 20.1% of GDP, in the lower health productivity scenario.
Figure 6.2. Office for Budget Responsibility projections for government health spending under different health productivity assumptions
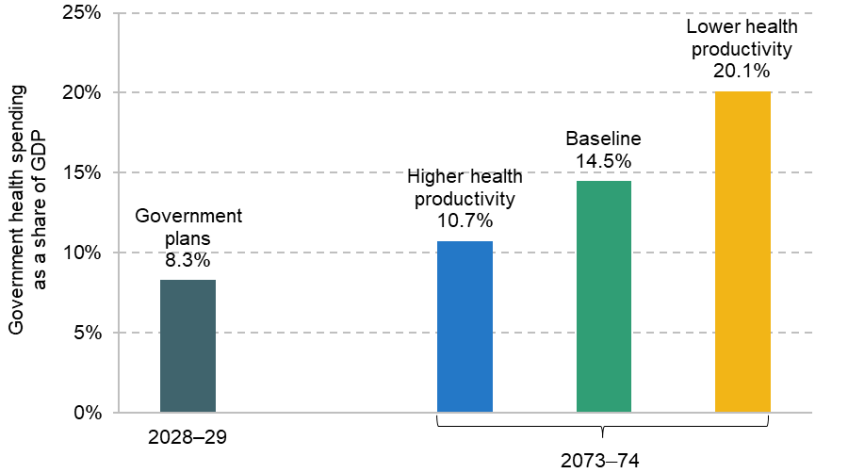
Source: Chart 3.15 of Office for Budget Responsibility (2024).
While these numbers are projections far into the future, and should not be taken as precise forecasts of what will actually happen, it is striking that differences in productivity are potentially enough to change future health spending by a factor of two. It is a first-order fiscal issue.
Moreover, the public sector is an important part of the wider economy, and so higher public sector productivity will increase both economy-wide productivity and GDP (something we discuss in more detail in Section 6.6).
The main challenges in measuring public sector productivity
In practice, measuring public sector productivity is difficult. Measuring the inputs to public services – whether workforce, quantities of all inputs or funding – is relatively straightforward. But measuring the outputs – and especially outcomes – of public services is much more challenging.
The key challenge is that public services produce many different types of outputs. For example, a hospital provides thousands of different types of treatments, schools equip pupils with many different qualifications and skills, and police arrest people suspected of committing many types of crime. To measure productivity properly, these outputs need to be valued in some way so they can be aggregated into a single total measure of output. For example, how should a hip replacement surgery be valued compared with an MRI scan? What is the value of providing education in a small local rural school relative to doing it in a larger school which many pupils have to travel for longer to get to? How should an arrest for assault be valued relative to an arrest for shoplifting – or a police patrol which may or may not deter a crime from occurring? Ideally, the value assigned to each kind of output would take into account its quality and the impact it has on the outcomes that the government (and service users) value.
When measuring private sector productivity, this issue of valuing different outputs and aggregating them together is more straightforward. We can use the market prices of goods and services to value them and, in many cases, these market prices should be good signals of the underlying value to (marginal) consumers of different types of goods. But in the public sector, most services are provided free at the point of use, and so we do not have market prices that we can use to value outputs.
Instead, alternative approaches need to be taken to value public sector outputs. Outputs may be weighted by their cost – since a hip replacement surgery has a higher cost than a physiotherapy session, an additional hip replacement would be treated as increasing a hospital’s output by more than an additional physiotherapy session. But cost is often not a good proxy of the true value of an item. Sometimes it is also possible to adjust for the quality of a service – for example, by using patient satisfaction or waiting times. For some services, these quality adjustments may get close to measuring the value of a service, such as when research studies have estimated the health benefits of a new medical treatment. For others, quality is much more difficult to measure, and there can often be lags between changes to actual output and observed quality measures. Student attainment, for example, is a useful way to measure education quality, but changes to teaching quality may not immediately affect exam grades, which are a product of many years of schooling. Therefore, whilst we have useful proxies for the value of many public services, some aspects will inevitably not be captured.
So far, we have assumed that the outputs of public services can at least be counted. This is broadly the case in healthcare and education, for example, but is certainly not the case for all public services. It is not clear how you would measure the output of the military, for instance – it could be defined as the ability to conduct military operations, based on the perceived or actual safety of citizens from conflict, or measured in numerous other ways. In this case, output is often measured as equal to the value of inputs used to produce the service. This means that productivity is assumed by construction not to change over time.
For more details on the challenges in measuring productivity and service outputs in particular, and potential solutions, we refer readers to Somani (2021) and O’Mahony, Viernes and Weale (2025). Given the challenges of making perfect productivity measures, we should be careful not to reject measures that provide some signal of true productivity just because they have deficiencies. The perfect should not be the enemy of the good. We now turn to outlining some of the actual measures of public service productivity produced and used in the UK.
A short history of public service productivity
The Office for National Statistics (ONS) produces a measure of public sector productivity that gives us the most comprehensive available picture of changes in the recent past. This measure is shown in Figure 6.3 from 1997 to 2024. In the terms defined earlier, this is an input productivity measure – the ONS measures the quantity of workforce, intermediate goods and services and capital services used by public services and compares this with a measure of the output of services. For some services, the ONS uses quality-adjusted output measures (such as GCSE grades or waiting times for operations); for others, it uses the quantity of outputs; and in some cases where outputs are difficult to define or measure, the quantity of outputs is measured as equal to the inputs used (allowing for no changes to productivity).3
Figure 6.3. Office for National Statistics measure of public sector productivity
A. Overall public service
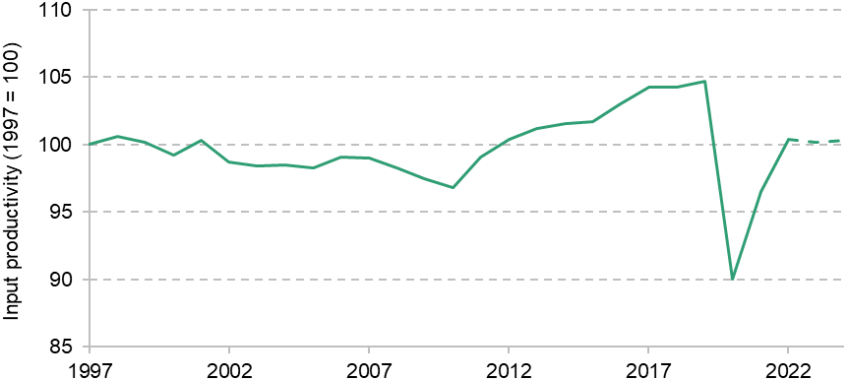
B. Selected service areas
Note: By construction, defence productivity cannot change over time, as defence output is assumed to equal the inputs used to produce it.
Source: Office for National Statistics, 2025a and 2025b.
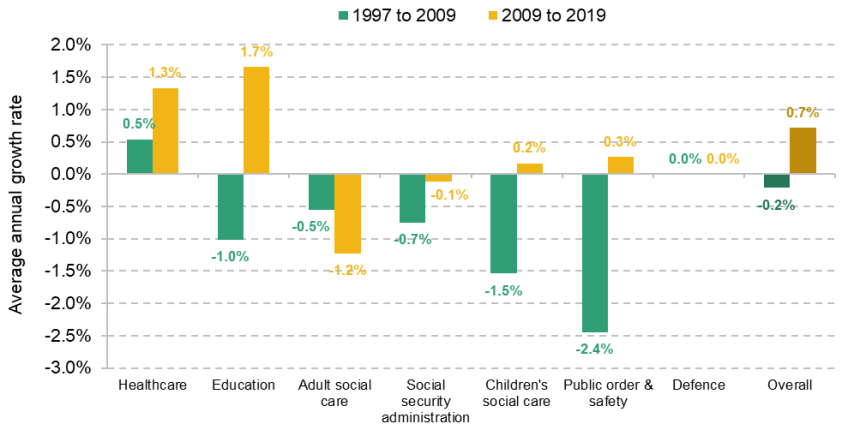
Panel A shows total public service productivity. On this measure, UK public sector productivity has seen three broad periods of change since 1997. It fell gradually between 1997 and 2009 (by an average of 0.2% per year), followed by a marked increase between 2009 and 2019 (by an average of 0.7% per year) and a sharp drop during the pandemic (falling by 14% in 2020). Despite some ‘bounceback’ in 2021 and 2022, initial estimates for 2023 and 2024 suggest that public sector productivity is stagnating and has not yet recovered to its 2019 level.
Panel B shows the ONS estimates of productivity for selected public services up to 2019. The largest productivity gains in this period have come from healthcare. Measured healthcare productivity rose steadily between 1997 and 2019, with an average increase of 0.9% per year. By contrast, some public services, including adult and children’s social care, were – at least on the ONS figures – less productive in 2019 than they were in 1997.
However, it is worth noting that these measures of productivity are far from perfect. In 2023, Jeremy Hunt, then Chancellor, asked the ONS to undertake a review of the measurement of public service productivity. This review completed in early 2025 and made over 100 recommendations to improve the measurement of public service productivity (Office for National Statistics, 2025c), some of which the ONS has now started to implement (and some of which are also reflected in the figures above).4 It is therefore possible that productivity might have increased faster over time than the ONS estimates in Figure 6.3 suggest, if there are growing or improving public services that are currently poorly measured. It is also possible that productivity growth has been slower than estimated, if falls in service quality since the start of the COVID-19 pandemic are not fully captured, for example.
Input productivity is not the only measure of productivity that governments might care about. Funding productivity is what determines whether public services become cheaper to deliver, in real terms, over time. In previous work, we have estimated that funding productivity fell by an average of 0.3% per year between 1997 and 2019 (Warner and Zaranko, 2024) – indicating that despite improvements in input productivity, a given level of public services became more expensive to provide. This is because on average across UK public services, the prices of inputs grew more quickly than input productivity. There were large differences over this period, however, with funding productivity falling by an average of 0.8% per year between 1997 and 2009, and increasing by an average of 0.4% per year between 2009 and 2019.
Other measures of productivity have been produced for particular public services, most notably hospitals and courts. NHS England (2025) estimates that funding productivity in the acute hospital sector has been growing at approximately 2% per year since 2022–23 but, despite this, remains around 8% lower than its pre-pandemic levels. This pattern is broadly reflected in similar estimates of input productivity by the Centre for Health Economics (Arabadzhyan et al., 2023) and our previous work on labour productivity in hospitals (Warner and Zaranko, 2023; Harvey-Rich, Warner and Zaranko, 2024). In the courts system, both the recent Leveson Review (2025) and IFS analysis (Domínguez, Tomlinson and Zaranko, 2025) found that the Crown Court’s productivity in processing cases has fallen sharply since 2019, with a partial recovery in recent years insufficient to return productivity to its pre-pandemic levels.
Looking forwards, these measures suggest two things about how we should expect public sector productivity to evolve. First, there are a number of public services where input productivity improvements have been hard to achieve in the past, and we might expect that to continue – especially in terms of funding productivity. Indeed, as we discuss in Section 6.4, there is a theoretical case that we should expect some public services to become more expensive to provide over time. Second, more positively, there are reasons to think that there is still scope for ‘catch-up’ post-pandemic productivity growth, given that productivity has yet to return to levels seen in 2019. However, the most recent data suggest that this ‘catch-up’ will not happen automatically, with the provisional ONS measure of total public sector productivity showing little improvement in recent years.
6.3 Plans for administration and civil service savings
We now consider the plans that the government has announced to improve public service productivity. In this section, we consider plans for administration and civil service savings. In the next, we consider plans for the efficiency of public service delivery.
Administration spending is a category of spending that does not directly support front-line services, such as policy advice, business support services and office services in departments. It does not include administrative spending that is directly involved in the delivery of front-line services, such as administrative staff in hospitals or GP practices, for example. It is a relatively small part of overall public spending. In 2024–25, administration spending stood at £12 billion (excluding depreciation): around 1.0% of total public spending (Total Managed Expenditure) and 2.0% of total departmental spending (Total Departmental Expenditure Limits). One way the government intends to improve public service productivity is through reducing the amount government departments and their arm’s-length bodies spend on administration.
Reductions in administration budgets do not guarantee improvements to public sector productivity. Let us first consider administrative productivity within departments (i.e. how well administration spending translates into administrative outputs). If departments cut their administrative outputs proportionally to budget cuts – for example, by producing less (or lower-quality) policy advice or by reducing their regulatory responsibilities – this would not be a change in productivity.5 However, if departments are able to produce the same level of administrative outputs with fewer resources, this would be an increase in administrative productivity.
Administrative productivity is important but, as a relatively small share of public spending, it does not make a large difference to total public service productivity. But changes to administrative spending (and productivity) could affect the wider productivity of the public services that departments deliver. This is a second channel through which administration cuts could affect public sector productivity. The quality of administration plays an important role in determining what front-line services can deliver. Cuts to administration budgets could therefore have knock-on effects for the productivity of front-line services. For example, if administrative cuts to the Department of Health and Social Care (DHSC) and NHS England mean that central procurement of drugs and equipment is less efficient, or that the allocation or management of large capital projects is worse, then this may reduce NHS output growth (for the same level of NHS resources) and therefore reduce NHS productivity. On the other hand, if the administrative requirements of DHSC and NHS England are hampering NHS output (as some have suggested, including the Darzi Review (2024)), these cuts could increase NHS productivity. Because delivering public services amounts to a much larger share of spending than administration spending, this second channel is likely more significant for public sector productivity as a whole.
What is the government planning?
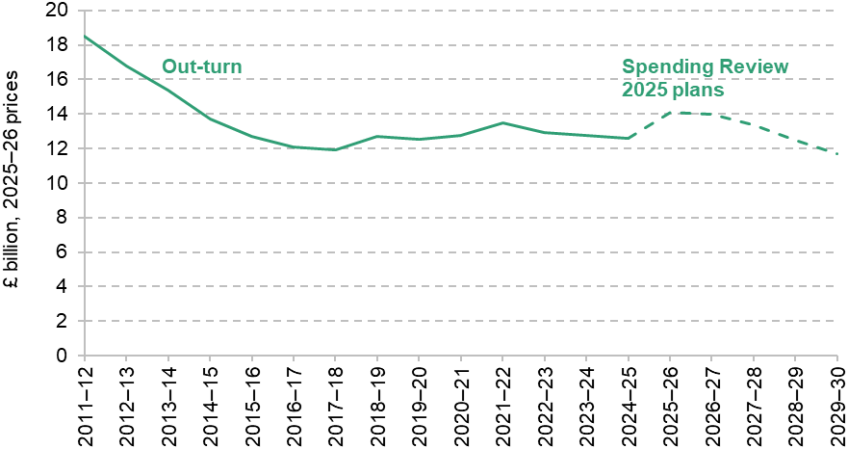
At the 2025 Spending Review, the government set out plans to ‘modernise the civil service and make the public sector more productive’, including by ‘reducing administration costs to rebalance day-to-day spending towards the services on which the public relies’. These plans involve departments reducing their administrative budgets by 16% in real terms by 2029–30, following plans set out to cut total administration spending at the 2025 Spring Statement. This follows plans from many previous governments to cut administration spending.
Figure 6.4 shows the plans from the 2025 Spending Review, as well as administration spending since 2011–12 (prior to which there were a number of changes to definitions). Panel A shows real-terms administration spending. Spending declined in real terms between 2011–12 and 2017–18, reflecting – in part – a significant reduction in civil service numbers in this period (Worlidge, Aiyar-Majeed and Grama, 2025). Although civil service numbers have since risen again, a large part of recent increases have been in ‘operational delivery’ roles, and the pay of many of these staff will not be included in administration spending. Spending has stayed roughly constant in real terms since 2017–18, even as some areas saw increased administrative responsibilities relating to leaving the EU and the COVID-19 pandemic. The Spending Review plans are for spending to fall again in real terms, more than offsetting the rise since 2017–18 and reaching the lowest level seen over this period.
Figure 6.4. Departmental administration spending since 2011–12
A. Real-terms administration spending
B. Administration spending as a share of Total Managed Expenditure and of Total Departmental Expenditure Limits

Note: Does not adjust for changes in employer National Insurance contributions, Machinery of Government changes, increased pension contributions (SCAPE) and budget cover transfers which will affect the numerator and, in Panel B, the denominator. We include depreciation in Total Departmental Expenditure Limits, rather than the standard definition, because administration spending also includes depreciation.
Source: Authors’ analysis of HM Treasury, Public Expenditure Statistical Analyses (various; https://www.gov.uk/government/collections/public-expenditure-statistical-analyses-pesa) and Spending Review 2025 (HM Treasury, 2025a).
Panel B shows administration spending as a share of total government spending (Total Managed Expenditure) and total departmental spending on public services and administration (Total Departmental Expenditure Limits). On both measures, administration spending has seen falls, followed by a plateau, over the last 15 years. The Spending Review plans imply a return to the early 2010s trend of administrative budgets falling as a share of expenditure, with plans implying that the share will reach 0.8% of total spending in 2029–30. That would be the lowest level seen over this period, and half the level of administration spending in 2011–12.
What have past governments achieved?
Many previous governments have planned to cut administration spending by government departments, with mixed success. Figure 6.5 shows planned and out-turn administration spending in cash terms since 2011–12. Broadly, Conservative-led governments between 2011–12 and 2017–18 managed to cut administration spending in line with – and generally exceeding – their plans. The growth in administration spending during EU exit preparation exceeded plans from the 2015 Spending Review (since the Brexit referendum result was not known at that point), but subsequent Spending Review plans were similar to the out-turn. Planned administration savings in the 2010s were therefore broadly delivered.
Figure 6.5. Plans and out-terns for administration spending in cash terms

Note: Definitions of administrative spending prior to 2011–12 are not comparable to measures in this period.
Source: HM Treasury, Public Expenditure Statistical Analyses (various; https://www.gov.uk/government/collections/public-expenditure-statistical-analyses-pesa); HM Treasury, Spending Reviews 2010 to 2025.
However, there was less success in cutting administration spending under Labour governments in the 1990s and 2000s, when plans for cuts to administration spending tended to not be delivered. This was particularly the case in the early 2000s, with administration spending consistently rising despite published plans suggesting it would be cut it as a share of total spending (Emmerson and Goodman, 2004). History therefore shows that planned cuts to administrative budgets are not always delivered.
It is important, however, not to simply judge ‘success’ based on whether planned reductions in spending were delivered, and not to equate reductions in spending with productivity improvements. If the administration spending cuts of the early 2010s led to reductions in service quality, or a reduction in the types of things done by the civil service, it is much less clear that productivity improvements followed. Whilst that period shows that it is possible to deliver cuts to administration budgets, such plans do not guarantee that it is possible to do so without other effects on productivity elsewhere in the public sector.
Are current plans enough to deliver these savings?
Savings from administrative budgets will come either from reducing the output of the civil service or from improvements to its productivity. There are some reasons to think that reductions to output might be possible (and some might argue desirable). If the impacts of leaving the EU and the COVID-19 pandemic have placed additional – but temporary – demands on the civil service in recent years, the required output of the civil service might fall as the impacts of these events recede. But if, for example, there is a permanently higher level of administrative responsibilities for the civil service now that we are no longer in the EU, this will not be the case. Similarly, it may be that future unanticipated crises (such as the COVID-19 pandemic) increase the required output of the civil service. The government has not set out many details of reductions to civil service responsibilities, though plans to reduce ‘unnecessary’ communications spending – to the extent they represent a reduction in the amount of communication to the public – could be viewed in this light. In any case, measuring – or conceptualising – the ‘output’ of the civil service is difficult.
Much of the detail on administrative savings from the government has focused instead on improvements to productivity: finding ways to do the same with less, including through increased use of technology and a focus on improving civil service performance. However, reducing budgets by 16% in real terms over five years without any reduction in output would require a sizeable increase in productivity.
In the rest of this section, we examine the ways in which the government has said it plans to cut administration spending, and the potential implications for civil service productivity.
The distribution of cuts across departments
The 2025 Spending Review set out how cuts to administration budgets would be distributed across government departments. Figure 6.6 shows the cumulative real-terms cuts to administration budgets planned for each department (i.e. the percentage change relative to budgets in 2025–26). It shows both changes between 2025–26 and 2028–29, the period the Spending Review covered for day-to-day departmental budgets, and an additional year of changes to 2029–30.
Figure 6.6. Cumulative planned real-terms cuts to administration budgets by department

Note: ‘Health and Social Care’ figures do not yet reflect the full ambition for the integration of NHS England into the Department of Health and Social Care, as this work is ongoing.
Source: HM Treasury, 2025a, table 1.1.
The figure shows that plans for most departments are identical, with only slight differences for the remaining departments – almost all departments have a planned 10% real-terms cut by 2028–29 and a further 5% by 2029–30. The only substantial exception is small and independent bodies, which are planned to have a much larger 23% real-terms cut by 2028–29 and a further 2% by 2029–30. This covers a number of government and independent bodies including the House of Commons, National Savings and Investments, the Competition and Markets Authority and the Office for National Statistics.
There may be some reasons to think that asking for near-identical cuts across the board makes sense. Many administrative functions – especially things such as finance and HR – will be similar across departments, and so there may be similar scope for savings in these areas. Asking the same of all departments may also help to secure collective buy-in to the exercise. Making sizeable cuts at the centre might make it easier to ask front-line public services to make large efficiency gains (discussed in Section 6.4).
However, the scope for savings will not be identical across departments, and seeking uniform cuts risks making the delivery of those cuts more difficult than it needs to be, and less likely to occur. This is for at least two reasons.
First, departments are facing quite different changes in responsibilities over the Spending Review period. For example, the Ministry of Defence is responsible for delivering a large increase in defence spending and procurement, but will be expected to make the same cut as almost all other departments, including those such as the Department for Culture, Media and Sport (DCMS) and the Department for Environment, Food and Rural Affairs (DEFRA) whose overall programme budgets are being cut. The implicit suggestion is that the Ministry of Defence is expected to increase the productivity of its administration spending by much more than DCMS or DEFRA.
Second, departments have experienced different levels of cuts to administration spending during the 2010s, and different impacts from Brexit and the COVID-19 pandemic. As a result, departments will likely be in different positions when it comes to the amount of administrative capacity that can be further cut back. This, combined with changes in departmental responsibilities over the parliament, makes it implausible that the ‘optimal’ allocation of cuts would be equal across departments and raises some questions about deliverability.
Sources of productivity growth
We have seen that delivering these plans will require large increases in administrative productivity for almost all departments. The government has set out some ways it intends for departments to achieve these improvements. There are four key areas: changes to the size and structure of the workforce; increased use of technology (including artificial intelligence, AI); improvements in the efficiency of property usage; and reforms to arm’s-length bodies. We discuss each in turn.
- Workforce. Staff costs make up the majority of administration spending (79% in 2025– 26), and so delivering these cuts will require changes to the administrative workforce to reduce the overall pay bill. If staffing stays at a similar share of the total administrative budget, these plans imply that the pay bill will also need to fall in real terms by around 16% by 2029–30.
There are two ways to achieve this: cuts to headcount and reductions in pay. The cuts to administration spending made under the 2010–15 coalition government were accompanied by significant real-terms pay cuts at most grades of the civil service (Clyne, Savur and Urban, 2024). Replicating such a scale of cuts would be challenging, and could even reduce productivity if they reduce the morale of civil servants or the talent that can be attracted and retained. The Office for Budget Responsibility (2025) assumes that, instead of falling, public sector pay in this period will grow at 0.5% per year in real terms, following economy-wide earnings growth.
If pay for civil servants follows this OBR forecast, administrative headcount would need to fall by 18% over the period to deliver the planned savings. The government has recognised that headcount reductions are necessary, and at the Spring Statement allocated £150 million in the Transformation Fund for exit schemes for government employees. If this scheme is similar to those of the coalition government, this one-off funding could save approximately £100 million per year from the pay bill (National Audit Office, 2012); this would be less than 1% of the current administrative pay bill. Delivering these savings is therefore likely to require further measures, such as reduced hiring rates. The effects on productivity will importantly depend on which staff leave: if the best-performing staff take redundancy offers, for example, there is a risk that these redundancy programmes could reduce productivity (Thomas, 2025). - Technology. A greater and better use of technology is a clear way that administrative productivity could be improved, and the government has rightly made this a key focus of its productivity strategies. The government’s Transformation Fund includes £323 million to support the Digital Centre of Government and cross-cutting digital priorities. There are good reasons to think that investing in core digital systems that can be used across government could reduce costs and improve productivity across the civil service. The realisable benefits from AI, for which the government has also set out ambitious plans to roll out across the civil service (Cabinet Office, 2025a), remain uncertain.
- Property. Property costs are a third area where departments may be able to make savings. If civil servants can deliver the same (or better) output with less or cheaper office space, this would be a sensible way to improve productivity. There are two main channels by which this could occur: a fall in overall office space (enabled by increased working from home and by falls in total headcount) and a move of civil servants away from expensive central London offices. Many government offices are currently below full occupancy (Cabinet Office, 2025c), suggesting that there is scope for savings here, and the government has announced plans to reduce its central London property footprint (Cabinet Office, 2025d). The overall effect on productivity will depend on whether savings are outweighed by the change to output. The direction of this potential change is not clear. On the one hand, there may be benefits to staff working together in the office or costs of setting up new hubs in other cities. On the other, working from home could attract, retain and motivate more or better staff, and hiring more civil servants outside London could increase the available talent pool, either of which would raise overall productivity. In either case, the largest changes to work-from-home patterns may have already happened, in which case future effects in either direction would be smaller.
- Arm’s-length bodies. Finally, many departments are expected to make reforms to arm’s-length bodies (often called ‘quangos’) to improve their productivity. In April, the Cabinet Office announced that ‘every quango across government will be reviewed, with a view to close, merge or bring functions back into departments if its continued existence cannot be justified’ (Cabinet Office, 2025b). Part of the justification offered was that ‘government should drive out duplication and inefficiency wherever possible’ – that is, output can be maintained with reductions to these inputs: a productivity increase. The highest-profile change announced so far has been the merger of NHS England (the body responsible for much of the day-to-day operations of the NHS in England) back into the Department of Health and Social Care, which could involve around 9,000 job cuts (Palmer, 2025). Other examples include the abolition of Ofwat and the merging of four water regulators into one (Department for Environment, Food and Rural Affairs, 2025). If there is genuine wasteful duplication in and across these organisations, reducing this is a good way to improve productivity. But the risk is that useful output (or checks on the quality of public services, which quasi-autonomous bodies are well placed to provide) will be reduced.
Across these areas, there is scope for improvements to administrative productivity. Some of these opportunities, including AI and the reduced need for office space through greater work from home, are relatively new. We might therefore expect scope for higher administrative productivity growth in this parliament than in previous ones. Other areas have ambiguous effects on productivity, including redundancy schemes and the closure of arm’s-length bodies.
However, the fact that administration budgets are modest in the context of overall public spending (as set out at the start of this section) means that the cash savings available, even under large improvements to administrative productivity, are limited. What happens in the NHS – discussed in the next section – is a much larger factor. A key question here, then, is whether administrative savings backfire by having knock-on effects on what front-line public services can deliver. If cuts worsen public service output, even by a small amount, they could worsen public sector productivity overall.
Indeed, there is an asymmetry: administration budgets are small, and so the savings available are limited. But the potential effects, through an impact on the effectiveness of public service delivery, are much larger. The challenge will therefore be for the government to deliver these changes in a way that does not worsen front-line performance, and ideally improves it, otherwise these cuts could well prove counterproductive.
6.4 Efficiency targets and plans for public services
Beyond making savings to central administration costs, the government has also committed to improving productivity in the delivery of public services by government departments, arm’s-length bodies and other public organisations, such as the NHS and military. The cost of delivering these public services covers the vast majority of day-to-day departmental spending. We examine the government’s plans in this section and what they might mean for productivity in the next one.
What is the government planning?
The government has set a number of targets for public services and departments to improve productivity. The Spending Review set out a minimum expectation of ‘3% efficiency gains by 2028–29’ for all government departments, and ‘bespoke’ targets and plans produced by the Office for Value for Money with each department. This is welcome. As we discussed in the previous section in the case of administration budgets, it is likely that the scope for productivity gains will differ between departments.
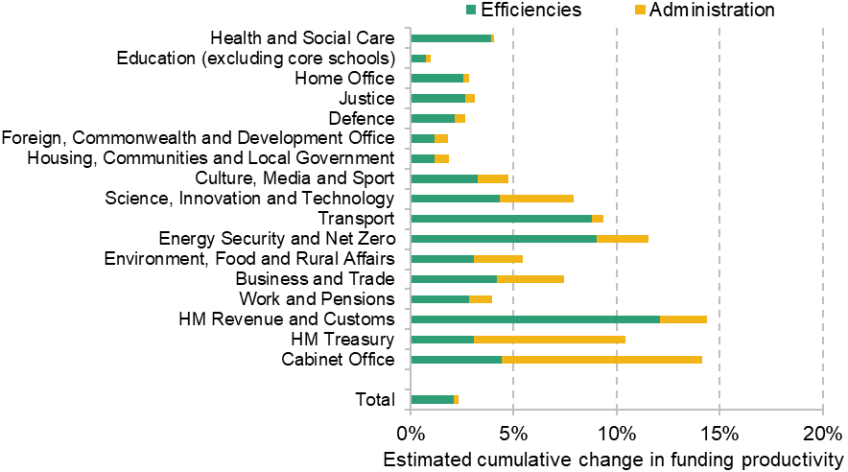
Figure 6.7 illustrates these plans for each department. Panel A shows planned efficiency gains as a share of current spending, while Panel B shows them in cash terms. In all cases, we focus on the planned net efficiency gains, i.e. those over and above spending on delivering the improvements. One laudable aspect of this productivity plan is that some of the plans to improve productivity are connected to specific up-front investment. The government’s Transformation Fund allocates £3.25 billion over three years to invest in ‘transforming’ public services across departments.
Figure 6.7. Plans for efficiency savings by department
A. Efficiency savings as a share of current spending

Savings as a percentage of 2025–26 Resource Departmental Expenditure Limits excluding depreciation and official development assistance (ODA) allocations.
B. Cash-terms efficiency savings in identified plans in 2028–29

Note: See the technical appendix for more details. ‘Small departments’ covers Law Officers’ Departments, Single Intelligence Account, and small and independent bodies.
Source: Authors’ calculations using HM Treasury (2025a and 2025b).
Some departments’ identified efficiency plans are much larger than others’. Four departments have identified savings above 5% of their current budget, including a large digitisation programme by HMRC that aims to deliver net savings worth more than 13% of HMRC’s current budget. As shown in Panel B, however, the savings of these departments are small in cash terms. There are large departments, including the Department for Education and the Ministry of Defence, that have identified less than the 3% expected savings, which make a more significant difference to the overall expected savings in pounds and pence.
Panel B also illustrates the extent to which these efficiency plans depend on the promised productivity improvements in the NHS. Of the £14 billion of identified savings, £9 billion are due to the NHS (as part of the Department of Health and Social Care). This is partly due to the scale of the NHS budget as a share of public service spending and partly because the DHSC has identified a higher proportion of its required savings than other departments. Therefore, what happens in the NHS will in large part determine whether these plans are deliverable. Given that a large share of past productivity improvements have come from healthcare (discussed in Section 6.2), this focus on the NHS makes sense.
It is worth noting that four important areas of spending on public services are excluded from these plans: services provided by devolved governments, local government, the core schools budget for England and official development assistance (also known as aid spending). Together, these make up around two-fifths of day-to-day spending on public services. Each area has some plans set out for improving its productivity, but not in sufficient quantitative detail for us to include them here, in part due to the autonomy of councils and devolved nations in organising their own operations. Improvements in the productivity of devolved public services does not directly affect UK government spending, as UK government transfers to the devolved governments are determined by the Barnett formula which depends on spending on English public services. The discussion below therefore focuses on the set of UK government plans set out at the Spending Review. But improvements in productivity in these areas will, of course, improve total public sector productivity in the UK.
How does the government plan to deliver these efficiencies?
We have seen that by far the largest determinant of whether these plans are delivered is what happens in the NHS. There are reasons for optimism here.
First, the plans for the NHS are not particularly ambitious compared with recent history. The drop in hospital productivity since the pandemic means that, if the target of 2% annual growth in funding productivity is achieved each year, NHS hospitals will be as productive in 2029 as they were in 2019. In some sense, it should be entirely possible to achieve this level of productivity, since it has been recently achieved.
Furthermore, there has been evidence that hospital productivity has been improving in the last two years (Harvey-Rich, Warner and Zaranko, 2024); and NHS England measures suggest that both hospital and non-hospital productivity are growing at more than 2% per year (NHS England, 2025). Much of this might reflect ‘catch-up’ growth as the damaging effects of the pandemic fade, but there is also a much greater focus on improving productivity at all levels of the NHS. The large increase in capital investment this parliament is also likely to help increase productivity in the medium term.
International evidence also suggests that the UK healthcare system is less productive than systems in comparator countries (Productivity Commission, 2024), suggesting there is scope for improvement even without cutting-edge innovations.
Delivering the planned savings across all departments may well be more difficult. Some large departments have not identified all of their intended savings, meaning that full delivery of both current and yet-to-be-decided plans is necessary to deliver their 3% target. It is notable, for example, that the Department for Education – the second-largest department by spending – has not included plans for schools, and for non-schools it has only set out plans for 0.8% efficiency improvements. Moreover, many of these public services have traditionally not delivered substantial productivity improvements over time, as shown in Section 6.2. One area where we might particularly expect this trend to continue is in primary schools in England, where pupil numbers are set to fall over this parliament (Drayton et al., 2025). Since reducing the total number of classrooms and teachers takes time, the immediate effect is likely to be a faster fall in the number of pupils taught than in resources used – a fall in input productivity – unless the quality of education delivered improves by an offsetting amount.
In the rest of this section, we set out the ways in which these departments intend to improve their productivity and we assess the scope for improvements in the areas identified. These efficiency targets are measures of funding productivity: they are ultimately concerned with the cost of delivering public services, not simply the volume of inputs. As illustrated in Figure 6.1, there are three ways to improve funding productivity. Departments could reduce the costs of their inputs; they could improve the efficiency of particular processes; or they could focus on a different set of outputs that produce better outcomes. Different departments have taken strikingly different approaches to how they intend to deliver these savings. We consider each type of saving in turn.
Reducing input prices
For some departments, making their inputs cheaper (in real terms) makes up a significant proportion of their stated efficiency plans. The largest single item in the Ministry of Defence’s plans is the £334 million it intends to save in 2028–29 from reacquiring service family accommodation, through lower rental payments and other costs of leasing.
Other departments discuss improvements to contracting and procurement as sources of savings. Although not part of the government’s ‘bespoke’ efficiency targets, there could well be potential for some high-cost services purchased primarily by councils and education to be organised more cheaply. If the costs of private sector provision can be reduced, this would effectively reflect a reduction in input prices. There is similarly potential for savings in asylum and children’s social care services, another two areas of investment from the Transformation Fund. The government’s Office for Value for Money has, for example, recently conducted a study in how prices for short-term residential accommodation can be reduced (HM Treasury, 2025c).
All of these plans for reducing input prices involve holding processes constant but delivering them more cheaply. If the delivered inputs are indeed unchanged, this type of change will improve funding productivity and deliver savings, even if it does not make any difference to input productivity as measured by the Office for National Statistics. One risk, however, is that if reductions in input prices are driven by reductions in input quality, that may prove counterproductive for productivity.
In recent decades, input prices to public services have tended to rise in real terms. Between 1997 and 2019, the implied input prices in the ONS measure of public sector productivity grew at 0.5% per year in real terms (Warner and Zaranko, 2024). This means that, far from delivering part of the productivity increases in these years, rising input prices counteracted some of the gains made elsewhere. These rises were enough to wipe out any cash savings from the rises in input productivity seen over this period, as inputs became more expensive faster than the rate at which the efficiency of their use improved. This trend might suggest that it would be difficult for any government to get large productivity gains from reducing input prices.
One theoretical reason to think that governments are unlikely to achieve savings through lowering input prices – particularly wages for public sector workers – is the Baumol effect. Baumol and Bowen (1965) noted that, in general, wages tend to rise with economy-wide labour productivity growth, even in sectors where labour productivity is growing slowly or shrinking. This is because these sectors have to compete for workers with other sectors, where labour productivity has risen. In labour-intensive industries such as the arts or education, there may have been relatively little increase in the amount of output an individual worker can produce. But, since they must be paid at least enough to prevent them moving to a different sector, their real wages have risen. Since the public sector contains many labour-intensive services such as education, care work or legislating, this effect is one part of the explanation for the trend of rising real input prices we saw above, and one reason to think the trend will continue.6
Reducing input prices is notably absent from many of the government’s current plans. Neither of the two largest departments (the Department for Education and the Department of Health and Social Care) plans to make substantial savings from its input costs, and real wage increases mean that it is likely that real input prices will continue to rise, on average, rather than fall. In the case of the NHS, there are also long-term pressures from the rising costs of drugs and new medical technologies, and particular pressure at the moment on the prices of drugs produced by American companies (Dayan and Gainsbury, 2025). Improvements in other areas will therefore be needed to counteract this effect, before any overall savings or improvements can be delivered.
Productive efficiencies
Almost all departments place significant weight on delivering productive efficiencies. Digital reform, automation and AI appear in many departments’ plans, often with the aims of reducing wasteful duplication and freeing up staff time from repetitive administrative work. And as noted above, some of these plans are backed up by cross-departmental investment in the Transformation Fund.
Many departments intend to digitise parts of their services and administrative processes. For example, the Department for Work and Pensions (DWP) plans to deliver cumulative efficiency gains of £407 million from digital improvements to services between 2025–26 and 2028–29, while HM Revenue and Customs (HMRC) plans to deliver £549 million of cumulative efficiency gains from moving to digital services and improving and modernising IT. This includes providing a single customer account for those using DWP services, digitising Jobcentre services, and digitising more HMRC services, with an aim for 90% of interactions to be delivered by self-service digital programmes. More generally, the government has set out a blueprint for modern digital government that aims to join up public services, share data and improve digital infrastructure – including GOV.UK (Government Digital Service, 2025).
While aims to increase productivity through digitising and automating processes are welcome, there are clear risks when it comes to delivering large and complex government IT programmes. The government currently has 24 major IT projects (National Infrastructure and Service Transformation Authority, 2025). Of the 22 projects that have assessments of delivery confidence, only four are rated as having successful delivery appearing highly likely. The vast majority of remaining IT projects are rated as having feasible successful delivery but significant existing issues. The National Audit Office (2024) has warned that past HMRC digitisation has not reduced demand for non-digital services as much as expected.
There is also a lot of excitement about the potential of AI to improve public sector productivity. The government has recently signed a Memorandum of Understanding with OpenAI (the creator of ChatGPT), plans to appoint an AI lead for each of its missions, and will pilot, evaluate and scale AI improvements (Department for Science, Innovation and Technology, 2025a and 2025b).
At present, the most we can say with confidence is that the potential benefits from AI could be large but remain highly uncertain. Estimates of the impact of AI on economy-wide productivity vary substantially. For example, the OECD (2024) estimates potential increases of 0.25–0.6 percentage points in annual total factor productivity growth and 0.4–0.9 percentage points in annual labour productivity growth over the next decade (total factor productivity is close to the concept of input productivity). In the context of a UK economy where private sector multifactor productivity growth has averaged 0.8% a year and labour productivity growth 1.0% a year between 1997 and 2019, an increase of this scale would be sizeable and welcome (Office for National Statistics, 2025d and 2025e). And these estimates are only somewhere in the middle of the pack of those produced by other researchers. If AI delivered similar productivity growth for public services, that would be significant. However, the scale of the government’s desired productivity improvements (discussed in the next section) is such that any improvements from AI would likely need to be coupled with improvements from other sources.
There are a range of tasks that public services deliver where AI could be particularly useful. For example, AI tools could assist with detecting patterns in diagnostic scans (Jeong et al. (2025), as cited in the NHS 10 Year Plan), help teachers plan lessons, or generate personalised educational materials for school pupils (Department for Education, 2025). In the case of education, however, it is worth noting that AI may also bring challenges – requiring teaching and assessment approaches to adapt for pupils using, and more specifically misusing, AI.
Another area where departments aim to achieve technical efficiencies is through improving operational practices and management. For example, the NHS has set out detailed plans for reforming the delivery of elective care, including through increased usage of specialist surgical hubs (Department of Health and Social Care, 2025). These reforms aim to deliver economies of scale by specialising in delivering high-volume, low-complexity medical treatments away from the frequent disruptions associated with emergency treatments – and the early evidence suggests that they are succeeding in doing so (Co et al., 2024).
Many departments’ efficiency plans discuss ‘streamlining’ operations or reducing task repetition. The ONS Public Sector Management Practices Survey (Office for National Statistics, 2024a) suggests that the majority of public sector organisations see this as a potential source of efficiency improvements, ahead of automation or hiring support staff. If there is genuine duplication of efforts within or across departments, eliminating it would naturally increase technical productivity. But, unlike the above discussion of AI, this focus is not new. The 2004 Gershon Review of public sector efficiency, for example, discussed ‘significant duplication’ across organisations and set out recommendations to address it that were broadly adopted by departments (National Audit Office, 2007).
Allocative efficiencies
The final way to improve funding productivity is to change the output mix of public services to map better to desired outcomes. For example, if investments in preventative healthcare are a more effective way to improve health than acute hospital care, changing the balance of healthcare outputs towards prevention should make the health service more productive.
It is important to distinguish between allocative efficiencies and other reasons why governments change the balance of public services they deliver. Productivity is not the only objective of public policy. Governments may decide, for other reasons, to introduce new services, reduce other ones, or otherwise change the ‘output mix’. This might be on grounds of accountability, equity or a changing view about the appropriate role of the state. For example, mental health services are a far greater share of healthcare outputs today than they were a few decades ago, reflecting a change to the set of outcomes which the public sector is concerned with or a response to a change in demand for services.
There are two areas of stated plans where changes focused on allocative efficiency appear prominently. First, many departments discuss a shift towards preventive services, and the government has made a general commitment to a ‘preventative approach to public services’. A large share of the government’s Transformation Fund is allocated to the reform of a small number of public services, with a focus on improving what government has termed ‘preventive’ services.7 Reforms to the special educational needs and disabilities (SEND) system and children’s social care alone make up more than 40% of the overall budget (£1.32 billion of £3.25 billion), and there is an additional £87 million for the prevention of homelessness. There is also a focus on prevention in the NHS, with the government’s health mission and NHS 10 Year Plan including a shift from ‘sickness to prevention’.
There are good reasons to think preventive interventions could be cost-effective, especially for those targeted at children. Evidence from a wide range of programmes suggests that well-targeted childhood interventions can have strong effects on later educational, labour market, health and criminal outcomes (Duncan et al., 2023, Carneiro et al., 2025). Similarly, many public health programmes have high estimated returns (Masters et al., 2017), although there is notable variation in which benefits are measured across different evaluations (Turner et al., 2023). In all reviews of preventive programmes, there is a subset of interventions that are not effective, and so such programmes are not automatically desirable – they need to be designed and targeted well. The government should be willing to trial different approaches, evaluate them properly and then scrap, change and scale up programmes according to what the evidence shows.
The other area where departments are planning to make allocative changes is through shifts to delivering services in the community. The NHS is most explicit about this plan, through expanding neighbourhood health centres and primary care provision, but there are also plans to deliver more probation and offenders’ services in the community, for example. These types of changes are the most uncertain in terms of delivering productivity growth. If they deliver a mix of services that delivers better outcomes, that is desirable. But changing the output mix is at least partly untested, so it remains to be seen whether such changes will deliver genuine productivity improvements.
6.5 What do government plans imply for measures of total productivity growth?
In the previous two sections, we examined the government’s plans for making administration and public service efficiency gains. We have so far focused on the anticipated cash savings of these plans, and the proportion of current budgets that they represent. These figures are related to, but distinct from, the measures of productivity defined in Section 6.2. In this section, we estimate what these plans together mean for measures of total public service productivity.
To do this, we must make three important assumptions. In the next section, we consider a range of alternative scenarios, reflecting the uncertainty associated with these assumptions and whether the government can achieve its plans.
First, we assume that cuts to administration budgets do not reduce (or improve) public service performance. As discussed in Section 6.3, if these cuts do change wider performance this could have negative (or further positive) impacts on productivity.
Second, when it comes to public service efficiency gains, we interpret a planned ‘efficiency gain’ of £1 billion to mean that, absent these improvements, an additional £1 billion of funding would be required to deliver the same level and quality of services (though, as discussed in Section 6.6, this does not mean the government would actually top up funding by £1 billion).
Under these two assumptions, the planned improvement in departmental funding productivity over three years can be measured as the cash savings set out in the plans, as a percentage of 2028–29 day-to-day budgets. The technical appendix provides more information on our approach here.
But to consider UK-wide public sector productivity, we must make a third assumption. As discussed in the previous section, some public services, including schools, local government services and devolved government services, are not included in these plans. All of these services do, however, matter for wider public sector productivity and are included in the ONS measure of input productivity. We assume that these services make zero funding productivity improvements, as we want to estimate the impact of central government’s plans. We think a baseline of zero productivity for these other areas is a reasonable starting point. Some areas may see productivity increase over time for some of the reasons discussed in the previous sections. But ONS estimates suggest that adult and children’s social care have seen input productivity (and therefore likely funding productivity) decline over time. Warner and Zaranko (2024) also estimate that education funding productivity has declined over time.8 Of course, if these other services can improve their funding productivity, overall public sector funding productivity would be commensurately higher.
Figure 6.8 illustrates what the government’s combined plans (for both administrative budgets and public service delivery) imply for funding productivity for major government departments. For the largest departments, the vast majority of their planned productivity improvements come from their planned improvements to operational public service productivity. Administration savings, even if fully delivered with no impact on output, have negligible effects on productivity for large departments such as the Department of Health and Social Care, the Department for Education and the Home Office because administration spending is a small share of their total spending. There are smaller departments, including the Cabinet Office and the Department for Science, Innovation and Technology, for which administration costs are more important and which would see correspondingly larger productivity gains from successful delivery of plans for administration savings. Overall, however, the main impacts will come from delivery of operational efficiencies, primarily in the NHS.
Figure 6.8. Cumulative day-to-day planned funding productivity improvements, 2025-26 to 2028-29
A. Funding productivity
B. Cash-terms savings in identified plans in 2028–29

Note: See the technical appendix for more details. Excludes some small departments. Department for Education funding productivity is presented excluding the core schools budget, as schools are not included in government efficiency plans. This means the estimated increase in funding efficiency from administration savings is likely an overestimate because this is for the whole department. Core grants to local authorities are excluded from the Housing, Communities and Local Government budget.
Source: Authors’ calculations using HM Treasury (2025a and 2025b) and Office for Budget Responsibility (2025).
Taken together, these plans imply that public sector funding productivity will grow cumulatively by 2.3% in the three-year period to 2028–29, or by an average of 0.8% per year.9 This would be a higher sustained growth rate in public sector funding productivity than has been achieved in recent decades. Panel A of Figure 6.9 illustrates that the average annual change in funding productivity between 1997 and 2019 was –0.3% per year, compared with an average increase of 0.8% each year under these plans for the next three years. Rising funding productivity is not unprecedented: between 2013 and 2018, it rose at roughly the levels set out in these plans, including a three-year period (from 2013 to 2016) when it grew at a faster average rate of 1.3% per year. However, delivery of these plans would represent a marked break from the longer-run trend of funding efficiency tending to fall over time.
Figure 6.9. Historical and planned productivity improvements, 1997–2029
A. Funding productivity

B. Input productivity

Note: See the technical appendix for more details. Productivity changes in 2020 and 2021 were very large – so that changes in other years are visible, we cap the bars at –5% and +5%; the light green labels give the change in those years. Final figures for productivity changes in 2023 and 2024 have yet to be produced by the Office for National Statistics. Government plans for productivity are in fiscal years, while the historical data are in calendar years.
Source: Office for National Statistics (2025a) and authors’ calculations using HM Treasury (2025b) and Office for Budget Responsibility (2025).
Panel B of Figure 6.9 carries out the same exercise for input productivity. To do this, we must make an assumption about how input prices will change over the period. We assume here that public sector labour costs grow at 0.5% per year in real terms, following the Office for Budget Responsibility’s forecast, and that other input prices rise in line with economy-wide inflation. Under these assumptions (discussed in more detail in the technical appendix), the government’s plans imply an annual increase in input productivity of 1.0% per year. This would be significantly above the average growth rate between 2009 and 2019 (0.7% per year), and much further above the longer-run average of 0.2% per year seen between 1997 and 2019. Indeed, such a growth rate has only been achieved – or exceeded – in five of the 22 years from 1998 to 2019. However, the coalition government did manage to sustain a substantially faster growth rate – of 1.5% per year on average – over a three-year period from 2010 to 2013. The context was very different though: squeezing public sector pay, for example, might have been easier during this period given the hit to private sector pay from the Great Financial Crisis.
This government is therefore aiming to deliver much higher productivity growth in the public sector over the next three years than has been seen on average over the past two decades. But this is from the starting point of lower public sector productivity following the pandemic. The scope for catch-up productivity growth – particularly in the NHS – and new technological developments – particularly AI – may make this fast growth rate more achievable. In our view, the plans therefore strike a reasonable balance between being ambitious and remaining potentially achievable. But there are clear risks that they will not be delivered, especially if productivity improvements in the NHS prove hard to find.
6.6 The fiscal and economic impacts of higher public sector productivity
In Sections 6.1 and 6.2, we argued that public sector productivity is important for the performance of public services, the government’s finances and the broader economy. In this section, we estimate the fiscal and economic impacts of the government’s plans to increase public sector productivity. We first set out a number of scenarios for productivity improvements, building on our estimates of the impacts of the government’s plans in Sections 6.4 and 6.5. We then consider how the government might respond to these scenarios, and outline the potential fiscal consequences and consequences for public services. Finally, we consider the broader economic consequences of higher public sector productivity.
Scenarios for productivity improvements
In the previous two sections, we estimated the potential impacts of the government achieving its plans for productivity. There is a large degree of uncertainty over what productivity improvements could be achieved. As we argued in Section 6.5, the government’s plans are ambitious, and while they might be achieved, there are clear risks that they will not be. We therefore consider a range of scenarios, both above and below our estimates of what is implied by the government’s plans.
Starting with the government’s plans, we estimated earlier that these implied a 2.3% increase in funding productivity between 2025–26 and 2028–29 (or 0.8% per year). Note that this does not account for any potential productivity improvements in schools, aid spending, local government and the devolved governments, as discussed in Section 6.4, because the plans set out at the Spending Review do not cover them. This also assumes that cuts to administration spending do not worsen (or improve) broader public sector performance.
As well as the government plans, we consider four further scenarios. We first consider a lower scenario where the government only manages to make half of the efficiency savings it currently plans, equivalent to a 1.2% increase in funding productivity between 2025–26 and 2028–29. In the previous section, we showed that the government’s plans were ambitious relative to historical improvements, and so it is plausible that the government fails to increase productivity by as much as it plans. This lower scenario would see funding productivity increase at the same rate as the average between 2009 and 2019, which would still be much quicker than the longer-run average between 1997 and 2019.
We also consider a higher scenario, where the government manages to make 50% more efficiency savings than it currently plans, equivalent to a 3.5% increase in funding productivity. This would give an annual growth rate of 1.2% per year, similar to the fastest period of productivity growth experienced in the last two decades (between 2013 and 2016). Such a growth rate would therefore be very high by historical standards, but not unprecedented. This scenario could reflect further improvements in the services the government has considered, such as the NHS, or in other areas such as schools or aid spending.10 While the government’s plans are ambitious, it is possible that radical gains from new technologies can be made and that other areas not covered by the plans also make improvements.
Next we consider a ‘no improvement’ scenario where the government makes no net efficiency savings. This will be a useful comparison to understand the impact of the government’s plans relative to no changes. It is worth noting, though, that even no improvement in funding productivity would be better than what has happened on average in recent decades, as discussed in the previous section.
Therefore we finally consider a scenario in line with historical productivity improvements, where funding productivity follows the 1997–2019 average and declines over time.
Table 6.1 summarises the five scenarios we consider. The first column shows the net cash-terms efficiency savings while the second column shows the estimated increase in funding productivity implied by this. The third column shows our estimates of what the increases in funding productivity imply for input productivity. As discussed in Section 6.2, the difference is that input productivity uses the quantities of inputs, while funding productivity uses the funding for public services – and so changes in the price of inputs affect funding but not input productivity.
Table 6.1. Summary of productivity scenarios
Scenario | Net efficiency gains between 2025–26 and 2028–29 | Estimated annual increase in funding productivity | Estimated annual increase in input productivity |
Historical trends | –£6 billion | –0.3% | –0.1% |
No improvement | £0 billion | 0.0% | 0.2% |
Lower than planned | £8 billion | 0.4% | 0.6% |
Government plans | £15 billion | 0.8% | 1.0% |
Higher than planned | £23 billion | 1.2% | 1.3% |
Note: Growth rates presented here are average annual growth rates; the cash-terms savings are cumulative over the three-year period.
The implied increase in input productivity in each scenario is larger than the increase in funding productivity. This reflects that over this period we expect the real prices of inputs used to produce public services (such as staffing) to increase. Therefore if services are to get cheaper to provide, input productivity must grow faster than input prices. That means that even in the ‘no improvement’ scenario, an increase in input productivity would be required to offset the estimated rise in input prices. The ‘no improvement’ scenario is therefore far from a lower bound of productivity performance. In the ‘historical trends’ scenario, there is a small reduction in input productivity.11
Throughout the rest of this section, we focus on the potential impacts of these productivity scenarios up to 2028–29, the period covered by the Spending Review and the government’s departmental efficiency plans. But differences in productivity growth – to the extent that they are sustained beyond 2028–29 – will have increasingly large effects into future years, as illustrated by Figure 6.2 in Section 6.2.
Scenarios for government responses to productivity changes
The consequences of changes to public sector productivity depend on how the government responds to those changes. In the simplest terms, the government could choose to use the efficiency improvements to increase public service performance, or it could potentially ‘bank’ some of the savings through reduced public spending.
To illustrate this, Figure 6.10 shows a stylised relationship between spending on public services (on the horizontal axis) and the quality-adjusted output of public services (on the vertical axis). The green line is the initial relationship between funding and outputs – as spending increases, so does the quality-adjusted output of public services. An improvement in productivity can be represented as a rotation from the green to the yellow line – for the same level of spending, quality-adjusted output is higher.
Figure 6.10. Stylised relationship between spending and quality-adjusted output

Note: This is a stylised relationship. In practice, the relationship between spending and quality-adjusted output will be non-linear and will differ between different public services and between different circumstances.
Source: Figure 3 of Warner and Zaranko (2024).
Imagine the government starts at point A. Productivity then increases and, theoretically, the government can choose where to move to on the yellow line. Points B and C represent two options. Point B represents the ‘maintain spending’ case – the government decides to spend the same amount of money on public services as it did at point A. Since productivity is higher, this means all of the improvement is reflected in a higher level or quality of public services. Point C represents the ‘maintain output’ case – the government decides to maintain the output and quality of public services at the same level as at point A, but since productivity is higher it can reduce spending.
These are not the only two options the government faces. It could choose a point between B and C to make some savings and also increase the level and quality of public services. It could also increase spending beyond point B – higher productivity may make the returns to public spending higher and so the government may be willing to increase the size of the state.
In practice, it may also be difficult for the government to reduce spending immediately as public sector productivity increases. For example, if it is costly (or impossible) to make some public sector workers redundant, change contracts with suppliers or close organisations (such as schools), it may take time to free up savings. There could also be a concern that responding to efficiency improvements with immediate funding cuts provides the wrong incentives to organisations tasked with finding those improvements. We therefore may expect productivity improvements to show up mainly as increased output and quality in the shorter term, with more potential cash savings in the medium and longer term.
The government therefore has a range of options for how to respond to productivity changes. These choices will affect the public service, fiscal and economic consequences of public service productivity. In the rest of this section, we focus on two illustrative responses: the ‘maintain spending’ case (point B) and the ‘maintain output’ case (point C).
The fiscal and public service consequences of public sector productivity changes
Improvements in public sector productivity may have no fiscal consequences. In our ‘maintain spending’ scenarios, the government would respond to different levels of public sector productivity by holding public spending at the planned level for 2028–29 and allowing public sector performance to vary. Since the government has already set budgets for government departments for the next three years at the Spending Review, this may seem a plausible case in the short term.
However, if the government responds to different levels of public sector productivity by changing public spending, this would have fiscal consequences. In practice, even if the government has set budgets in advance, it often chooses to top them up in response to adverse performance. There is also an opportunity for the government to adjust its spending plans for 2028–29, the final year targeted in some of these plans, at the 2027 Spending Review. In our ‘maintain output’ scenarios, the government would fully offset different levels of public sector productivity via public spending. This would have implications for either tax or borrowing decisions (or both).
Figure 6.11 shows the estimated fiscal consequences of our public sector productivity scenarios. Panel A shows the implications for public spending (in cash terms in 2028–29) while Panel B shows the implications for public service output. In all cases, we present these relative to the plans that the government has already set out – i.e. the ‘government plans’ scenario. That is because the government set budgets at the Spending Review based on these plans for productivity. If productivity turns out to be higher or lower, this could lead to changes to these plans. The technical appendix gives more detail on how we estimate these impacts.
Figure 6.11. Fiscal and public service implications of public sector productivity improvements, relative to government’s stated plans
A. Fiscal implications
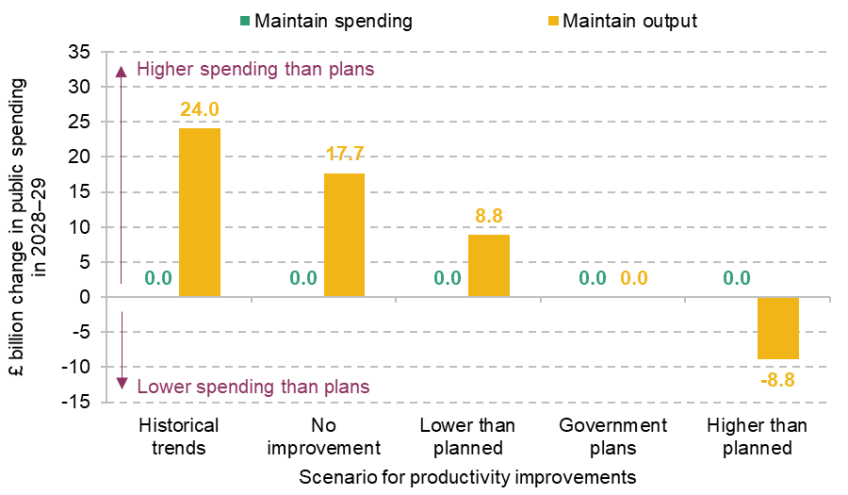
B. Public service quality-adjusted output implications
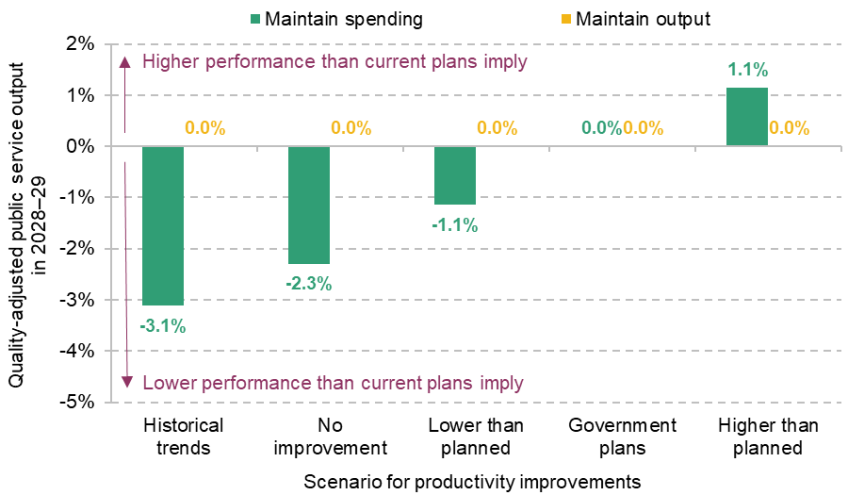
Note: See the technical appendix for notes and sources. The changes in public spending in Panel A differ from the figures in Table 6.1 because we account for the Barnett consequentials of budget changes here.
We start with the ‘maintain spending’ case, shown by the green bars. By definition, this means there are no changes to planned public spending, and so no direct fiscal consequences. However, Panel B shows that there will instead be changes to public sector output. Relative to current plans, we estimate that in our higher productivity scenario, public sector output would be 1.1% higher; in our lower productivity scenario, it would be 1.1% lower; and in our ‘no productivity growth’ scenario, it would be 2.3% lower. If productivity declined over this period in line with the historical trend, public sector output could be 3.1% lower by 2028–29. It is worth stressing that this does not mean public sector output would be falling overall – it will likely still be rising; it just means it would be lower than it otherwise would be, and lower than current budgets imply if productivity plans were achieved. Although relatively small percentages, such changes in public sector output could still make a large difference to public service performance. For context, a 2.3% reduction in public sector output relative to plans would be equivalent to at least 8 million fewer GP appointments in England per year (or one fewer GP appointment for every seven people; NHS Digital, 2025) and four fewer school days per year.
Given the government’s ambitions and commitments to improve performance, lower-than-planned productivity could well put pressure on the government to top up spending plans. Hence, the yellow bars in Figure 6.11 instead show what would happen if the government responded to changes in productivity by changing spending.
In our higher productivity scenario, we estimate the government could save £9 billion from spending (including reductions in Barnett consequentials to devolved governments of £1 billion). This could be used to increase spending on other areas (e.g. social security benefits) or to reduce taxes or borrowing. In practice, however, as we discussed in the previous subsection, it may be difficult to free up these savings quickly. But we would have better-performing public services as a result, and the government may find that, at the least, it is under less pressure to announce new top-ups to spending plans.
In our lower productivity scenario, we estimate the government would have to increase public spending by £9 billion in 2028–29 if it wanted to compensate for lower productivity growth than planned (including £1 billion of Barnett consequentials). If there was no (funding) productivity growth, it would need to increase spending by £18 billion (including £2 billion of Barnett consequentials) if the government was not willing to let public sector performance worsen as a result. And if funding productivity declined over the parliament in line with historical trends, spending could need to be topped up by £24 billion (including £3 billion of Barnett consequentials).
In one sense, these would be relatively small changes in the context of a state that spends more than £1,300 billion each year. But relative to the government’s headroom against its fiscal targets, these are much more significant changes. In March 2025, the government had £10 billion of headroom against its fiscal rule that it should have a forecast current budget surplus in 2029–30. Lower productivity performance than planned could, if it leads to additional pressures on public service spending because the government is unwilling to let service performance fall short, make this fiscal rule harder to meet.
The economic consequences of public sector productivity changes
Finally, we consider the consequences of public sector productivity for GDP. GDP measures the value of goods and services produced in the UK. The outputs of public services, such as healthcare and education services, are part of these goods and services. In 2023, for example, outputs produced directly by the government made up 12% of UK GDP, while outputs from firms in the government, education and healthcare industries made up 19% of GDP.12
If the government maintains its spending plans in the face of different levels of public sector productivity, higher productivity will increase the output of public services while lower productivity will reduce the output of public services. This will directly increase or decrease measured GDP. The effect of plausible changes to public sector productivity will not be large, but nor will they be insignificant. For example, we estimate that our different productivity scenarios could change GDP in 2028–29 by as much as 1%. If the government instead responds to different levels of productivity by maintaining public sector output and changing spending, the economic impacts depend in part on where the government raises the money – whether that is from lower spending elsewhere (e.g. on social security spending), from higher taxes or from more borrowing. There may well also be indirect effects of public sector productivity on GDP – if, for example, better healthcare provision has positive spillover effects on productivity in the private sector.
Although higher public sector productivity could increase GDP, this has a different impact on the public finances from increases in private sector productivity. When productivity rises in the private sector, firms make larger profits and/or pass the gains on to their staff in the form of higher wages. We can therefore expect to see increased revenues from taxes on profits, earnings and consumer spending. In the public sector, on the other hand, there are not profits to tax; nor are there direct links between wage-setting and productivity. Tax revenues will therefore not directly rise as a result of public sector productivity improvements, though the public finances could benefit indirectly from higher public sector performance (most obviously, higher public sector productivity will reduce the need for spending top-ups to meet a given standard of public service delivery).
Therefore, although higher public sector productivity would increase GDP – reflecting a genuine increase in the value of public services produced in the economy – this would not result in many of the fiscal benefits that the government would receive from other types of GDP growth. However, it would still help the government achieve its fiscal target to have debt falling as a share of GDP over the medium term, by increasing the growth in the denominator. Even this effect, however, would depend on how levels of productivity compare with the assumptions made by the Office for Budget Responsibility in its GDP forecasts.
This increase in GDP from higher public sector productivity would also increase measured productivity for the economy as a whole. Again, there may well be further indirect effects on labour productivity from higher-quality public services, such as through improved health, that we do not quantify here.
Taken together, our analysis shows that if the government fails to achieve its plans for public sector productivity – or exceeds them – this will have implications for public sector performance and economic performance, and potentially for fiscal policy depending on how the government responds. In practice, it seems more likely that the government will under- rather than over- perform on its productivity plans, given how much higher they are than historical trend growth in productivity, discussed in Section 6.5. This would mean the government would need to either top up public spending or allow public service performance to fall short of the intended level.
6.7 Conclusion
Raising the productivity of the public sector is a worthy goal for any government. Higher productivity eases the fiscal trade-offs facing a Chancellor, allowing the government to provide more or better-quality public services within the same level of public spending, or to deliver the same services at a lower level of taxes or borrowing. This government has made ambitious pledges to improve public services, but departmental budgets are relatively constrained by the challenging economic situation and the fact that taxes are already at a UK-high, and rising. It is therefore not surprising that the government wants to deliver a period of sustained public sector productivity growth at a rate far above the historical average.
There are some reasons to think that these ambitions could be delivered. Although productivity growth is planned to be well above the historical average, the starting point is still below pre-pandemic levels. The NHS is by far the most important determinant of whether these plans are delivered, and achieving the government’s targets for the NHS merely requires restoring 2019 levels of hospital productivity by 2029. And some of the proposed drivers of productivity improvements are genuinely relatively new – most prominently, innovation in artificial intelligence. If these can be as widely and usefully applied in the public sector as the government intends – or some economists predict for the wider economy – then they could deliver substantial productivity gains. If the government can meet or exceed the plans set out this year, the prize on offer is substantial: marked improvements to public services without the need to increase funding at the same pace.
Yet history suggests that sustained improvements of this size are difficult to achieve. Almost every government since 1997 has had targets to improve efficiency and lower costs, often citing similar levers to the ones this government intends to use. But between 1997 and 2019, while the input productivity of public services grew slightly, public services got more expensive to provide, resulting in a reduction in what we call funding productivity. Provisional estimates suggest a complete stall in input productivity growth in 2023 and 2024, implying that ‘bounceback’ growth from the falls to productivity seen since 2019 will not be automatic. And if cuts to administration budgets have even small negative impacts on the productivity of front-line service delivery, it is possible that some of those cuts will be counterproductive for government-wide productivity growth.
If public sector productivity falls short of the plans set out here, the government will face a tougher set of fiscal trade-offs than it hoped for. Sticking to the departmental budgets it has already set out would imply accepting a lower level or quality of public service delivery. That could well include failing to deliver on some of its key promises on which it was elected. Alternatively, the government could decide to fulfil planned public service improvements, and accept that it will be more expensive than anticipated to do so. The increased costs would not be huge in big-picture fiscal terms: delivering half of the intended productivity gains would leave budgets £9 billion short in 2028–29, if performance is to be maintained at current plans – less than 2% of planned day-to-day departmental spending for that year. However, with the Chancellor currently meeting her fiscal rules by relatively small margins, lacklustre productivity growth could have outsized consequences.
Stepping back, public sector productivity is at least as important for the long-term health of the public finances as it is for the delivery of the current government’s plans. It is one of the few ways to meet growing demands on the state without commensurate increases in funding and therefore taxes or borrowing. And although the impacts of public sector productivity plans on economic growth are likely to be small in this parliament, they could have a much more important effect on the prospects for growth and the size of the state in the longer term. If productivity continues to stagnate over this parliament, future governments will inherit an even more difficult set of fiscal choices.
Technical appendix
Estimating funding productivity improvements from government plans
The government has published two sets of productivity plans which we use throughout this chapter. The first concerns plans for departmental administration budgets (HM Treasury, 2025a, table 1.1) and the second concerns plans for efficiency gains in the delivery of public services (HM Treasury, 2025b, table 1.1).
In both cases, we translate these plans into estimates of funding productivity. As in previous work (Warner and Zaranko, 2024), we define funding productivity in the following way:
We interpret the government’s efficiency savings in the following way: absent these plans, the government would have to increase day-to-day funding by the level of the savings to deliver the same public service output (that does not mean it would – as we discuss later, it could instead allow public service output to fall).
In the case of efficiency gains in the delivery of public services, the government directly provides the cash value of efficiency savings. In the case of administration budgets, the government only provides budgets and a percentage change relative to 2025–26 budgets. Since it states that the baseline is 2025–26 budgets (as is the case for departmental efficiency savings) and presents real-terms savings, we calculate the cash savings from real-terms 2025–26 budgets.
From the information provided by the government, we can calculate the percentage change in funding productivity. Let denote the targeted level of output, and and respectively denote the planned and counterfactual level of funding.
Note that this does not require us to make any assumptions about the government’s desired level of public service output, , in future years, since the public service output term cancels out. We are not assuming, for example, that the government wants to maintain it at the current level or increase it in line with funding.
When producing our estimate of total funding productivity, we must account for public services that are not covered by these plans (discussed in Section 6.4). These include schools, services provided by local authorities, official development assistance, and services provided by devolved governments. When we calculate total productivity changes, we include these in the baseline (i.e. we assume that these areas make 0% productivity improvements). This is one reason we include a ‘higher’ productivity growth scenario in Section 6.6.
Estimating input productivity improvements from government plans
We define input productivity using the same numerator as funding productivity, but a different denominator:
We also consider the following approximation:
This means that the link between changes in each type of productivity is approximately
So changes in funding productivity are driven by changes in input productivity but offset by any rises in the real prices of inputs (or improved by reductions in the prices of inputs).
We have already estimated the implications of the government’s plans for funding productivity. To estimate the implications for input productivity, we therefore need to make assumptions about input prices. As noted in Section 6.4, most big departments are seeking to make improvements to input productivity rather than reducing input prices. We therefore make the following assumptions about input prices:
- For labour inputs, we assume that public sector wages rise in line with the Office for Budget Responsibility’s forecast for public sector wages.
- For non-labour inputs, we assume that prices rise in line with the GDP deflator.
- We assume that the plans to increase productivity do not meaningfully change the input mix in public services, and so weight these two sets of prices by the current labour share of public sector inputs (48% in 2025–26 based on the 2025 Public Expenditure Statistical Analyses).
Estimating the fiscal implications of productivity gains
In our analysis of the fiscal and economic implications of productivity gains, we consider two potential reactions by government:
- Maintain spending. The government decides to respond to higher-than-planned public sector productivity by maintaining spending at the level previously planned. In other words, if the government’s plans for productivity were not achieved, it would maintain spending and allow public sector output to fall.
- Maintain output. The government decides to respond to higher-than-planned public sector productivity by maintaining public sector output at the level that would have occurred otherwise. In other words, if the government’s plans for productivity were not achieved, it would increase spending to maintain public sector outputs constant. Based on the assumptions in the previous subsection, this would be equivalent to increasing spending by the amount of planned savings.
In the ‘maintain spending’ case, there are no fiscal implications of productivity changes, though there are implications for public service performance which we discuss.
In the ‘maintain output’ case, the public sector productivity improvements reduce public spending (or, similarly, failing to achieve the plans increases public spending). We estimate approximate Barnett consequentials from this based on the mix of departments that the savings are planned to be made from.
References
Arabadzhyan, A., Castelli, A., Gaughan, J., Anaya Montes, M. and Chalkley, M., 2023. Productivity of the English National Health Service: 2020/21 update. Centre for Health Economics, Research Paper 190, https://www.york.ac.uk/media/che/documents/papers/researchpapers/NHS%20prod%20update%20202021_20230307-combined%20(1).pdf.
Baumol, W. J. and Bowen, W. G., 1965. On the performing arts: the anatomy of their economic problems. American Economic Review, 55, 495–502, https://www.jstor.org/stable/1816292.
Cabinet Office, 2025a. One Big Thing. https://moderncivilservice.campaign.gov.uk/one-big-thing.
Cabinet Office, 2025b. Hundreds of quangos to be examined for potential closure as Government takes back control. https://www.gov.uk/government/news/hundreds-of-quangos-to-be-examined-for-potential-closure-as-government-takes-back-control.
Cabinet Office, 2025c. Civil Service HQ occupancy data. https://www.gov.uk/government/publications/civil-service-hq-occupancy-data.
Cabinet Office, 2025d. Thousands of civil service roles moved out of London in latest reform to the state. https://www.gov.uk/government/news/thousands-of-civil-service-roles-moved-out-of-london-in-latest-reform-to-the-state.
Carneiro, P., Cattan, S., Conti, G., Crawford, C., Farquharson, C. and Ridpath, N., 2025. The short- and medium-term effects of Sure Start on children’s outcomes. Institute for Fiscal Studies, report, https://ifs.org.uk/publications/short-and-medium-term-impacts-sure-start-educational-outcomes.
Clyne, R., Savur, S. and Urban, J., 2024. Civil service pay. Institute for Government, explainer, https://www.instituteforgovernment.org.uk/explainer/civil-service-pay.
Co, M., Marks, T., Tracey, F., Conti, S. and Clarke, G., 2024. The impact of elective surgical hubs on elective activity in acute hospital trusts in England: a generalised synthetic control study. http://dx.doi.org/10.2139/ssrn.4888136.
Darzi Review, 2024. Independent investigation of the National Health Service in England. https://assets.publishing.service.gov.uk/media/66f42ae630536cb92748271f/Lord-Darzi-Independent-Investigation-of-the-National-Health-Service-in-England-Updated-25-September.pdf.
Dayan, M. and Gainsbury, S., 2025. Trump, medicines and the NHS. Nuffield Trust, blog post, https://www.nuffieldtrust.org.uk/news-item/trump-medicines-and-the-nhs.
Department for Education, 2025. Generative artificial intelligence (AI) in education. https://www.gov.uk/government/publications/generative-artificial-intelligence-in-education/generative-artificial-intelligence-ai-in-education.
Department for Environment, Food and Rural Affairs, 2025. Ofwat to be abolished in biggest overhaul of water since privatisation. https://www.gov.uk/government/news/ofwat-to-be-abolished-in-biggest-overhaul-of-water-since-privatisation.
Department for Science, Innovation and Technology, 2025a. AI Opportunities Action Plan. https://www.gov.uk/government/publications/ai-opportunities-action-plan/ai-opportunities-action-plan.
Department for Science, Innovation and Technology, 2025b. Memorandum of Understanding between UK and OpenAI on AI opportunities. https://www.gov.uk/government/publications/memorandum-of-understanding-between-the-uk-and-openai-on-ai-opportunities.
Department of Health and Social Care, 2025. Reforming elective care for patients. https://www.england.nhs.uk/wp-content/uploads/2023/04/reforming-elective-care-for-patients.pdf.
Domínguez, M., Tomlinson, J. and Zaranko, B., 2025. Productivity in the Crown Court. Institute for Fiscal Studies, report, https://ifs.org.uk/publications/productivity-crown-court.
Drayton, E., Farquharson, C., Ogden, K., Sibieta, L., Snape, D. and Tahir, I., 2025. Annual report on education spending in England: 2024–25. Institute for Fiscal Studies, report, https://ifs.org.uk/publications/annual-report-education-spending-england-2024-25.
Duncan, G., Kalil, A., Mogstad, M. and Rege, M., 2023. Investing in early childhood development in preschool and at home. In E. Hanushek, S. Machin and L. Woessmann (eds), Handbook of the Economics of Education, 6, 1–91.
Emmerson, C. and Goodman, A., 2004. Spending Review 2004: IFS press briefing. Institute for Fiscal Studies, https://ifs.org.uk/sites/default/files/2022-07/SR04.pdf.
Gershon Review, 2004. Releasing resources to the front line: Independent Review of Public Sector Efficiency. https://webarchive.nationalarchives.gov.uk/ukgwa/+/http:/www.hm-treasury.gov.uk/d/efficiency_review120704.pdf.
Government Digital Service, 2025. A blueprint for modern digital government. https://www.gov.uk/government/publications/a-blueprint-for-modern-digital-government/a-blueprint-for-modern-digital-government-html.
Harvey-Rich, O., Warner, M. and Zaranko, B., 2024. NHS hospital productivity: some positive news. Institute for Fiscal Studies, comment, https://ifs.org.uk/articles/nhs-hospital-productivity-some-positive-news.
HM Treasury, 2021. Autumn Budget and Spending Review 2021: documents. https://www.gov.uk/government/publications/autumn-budget-and-spending-review-2021-documents.
HM Treasury, 2023. The Government Efficiency Framework. https://www.gov.uk/government/publications/the-government-efficiency-framework/the-government-efficiency-framework.
HM Treasury, 2025a. Spending Review 2025 document. https://www.gov.uk/government/publications/spending-review-2025-document.
HM Treasury, 2025b. Spending Review 2025: Departmental Efficiency Plans. https://assets.publishing.service.gov.uk/media/68492799d0ca5d7801e4e709/Efficiency_delivery_plans_-_supplementary_document_-_FINAL.pdf.
HM Treasury, 2025c. Value for money (VfM) study on the procurement of short-term residential accommodation. https://www.gov.uk/government/publications/value-for-money-vfm-study-on-the-procurement-of-short-term-residential-accommodation.
Hoddinott, S., Davies, N. and Kim, D., 2024. A preventative approach to public services: how the government can shift its focus and improve lives. Institute for Government, https://www.instituteforgovernment.org.uk/publication/preventative-approach-public-services.
Jeong, J., Kim, S., Pan, L., Hwang, D., Kim, D., Choi, J., Kwon, Y., Yi, P., Jeong, J. and Yoo, S-J., 2025. Reducing the workload of medical diagnosis through artificial intelligence: a narrative review. Medicine, 104, e41470, https://doi.org/10.1097/MD.0000000000041470.
Leveson Review, 2025. Independent Review of the Criminal Courts. https://assets.publishing.service.gov.uk/media/686be85d81dd8f70f5de3c1f/35.49_MOJ_Ind_Review_Criminal_Courts_v8b_FINAL_WEB.pdf.
Masters, R., Anwar, E., Collins, B., Cookson, R. and Capewell, S., 2017. Return on investment of public health interventions: a systematic review. Journal of Epidemiology and Community Health, 71, 827–34, https://doi.org/10.1136/jech-2016-208141.
National Audit Office, 1986. The Rayner Scrutiny Programmes, 1979 to 1983. https://webarchive.nationalarchives.gov.uk/ukgwa/20220801195818mp_/https://www.nao.org.uk/pubsarchive/wp-content/uploads/sites/14/2018/11/The-Rayner-Scrutiny-Programmes-1979-to-1983.pdf.
National Audit Office, 2007. The Efficiency Programme: a second review of progress. https://webarchive.nationalarchives.gov.uk/ukgwa/20170207052351/https://www.nao.org.uk/wp-content/uploads/2007/02/0607156es.pdf.
National Audit Office, 2012. Managing early departures in central government. https://www.nao.org.uk/wp-content/uploads/2012/03/10121795.pdf.
National Audit Office, 2024. Customer service: HM Revenue & Customs. https://www.nao.org.uk/wp-content/uploads/2024/05/hmrc-customer-service.pdf.
National Infrastructure and Service Transformation Authority, 2025. Annual Report 2024/2025. https://ar25.nista.grid.civilservice.gov.uk/headlines.
NHS Digital, 2025. Appointments in general practice, July 2025. https://digital.nhs.uk/data-and-information/publications/statistical/appointments-in-general-practice/july-2025.
NHS England, 2025. NHS productivity update. https://www.england.nhs.uk/long-read/nhs-productivity-update-feb-25/.
OECD, 2024. Miracle or myth? Assessing the macroeconomic productivity gains from artificial intelligence. OECD Artificial Intelligence Paper 29, https://www.oecd.org/content/dam/oecd/en/publications/reports/2024/11/miracle-or-myth-assessing-the-macroeconomic-productivity-gains-from-artificial-intelligence_fde2a597/b524a072-en.pdf.
Office for Budget Responsibility, 2024. Fiscal risks and sustainability report – September 2024. https://obr.uk/frs/fiscal-risks-and-sustainability-september-2024/.
Office for Budget Responsibility, 2025. Economic and fiscal outlook, March 2025. https://obr.uk/efo/economic-and-fiscal-outlook-march-2025/.
Office for National Statistics, 2024a. Public Sector Management Practices Survey pilot, UK: 2023. https://www.ons.gov.uk/economy/economicoutputandproductivity/publicservicesproductivity/bulletins/publicsectormanagementpracticessurveypilotuk/2023.
Office for National Statistics, 2024b. UK National Accounts, The Blue Book: 2024. https://www.ons.gov.uk/economy/grossdomesticproductgdp/compendium/unitedkingdomnationalaccountsthebluebook/2024.
Office for National Statistics, 2025a. Public service productivity estimates: total public service. https://www.ons.gov.uk/economy/economicoutputandproductivity/publicservicesproductivity/datasets/publicserviceproductivityestimatestotalpublicservice.
Office for National Statistics, 2025b, Public service productivity, quarterly, UK. https://www.ons.gov.uk/economy/economicoutputandproductivity/publicservicesproductivity/datasets/publicserviceproductivityquarterlyuk.
Office for National Statistics, 2025c. National Statistician’s independent review of the measurement of public services productivity. https://uksa.statisticsauthority.gov.uk/wp-content/uploads/2025/03/National-Statisticians-Independent-Review-of-the-Measurement-of-Public-Services-Productivity.pdf.
Office for National Statistics, 2025d. Labour productivity time series. https://www.ons.gov.uk/employmentandlabourmarket/peopleinwork/labourproductivity/datasets/labourproductivity.
Office for National Statistics, 2025e. Multi-factor productivity estimates. https://www.ons.gov.uk/economy/economicoutputandproductivity/productivitymeasures/datasets/multifactorproductivityexperimentalestimatesreferencetables.
O’Mahony, M., Viernes, M. and Weale, M., 2025. Review of approaches to the measurement of public sector productivity statistics. ESCoE Technical Report 26, https://escoe-website.s3.amazonaws.com/wp-content/uploads/2025/02/26161536/ESCoE-TR-26.pdf.
Palmer, B., 2025. How will staffing numbers be affected by abolishing NHS England? Nuffield Trust, https://www.nuffieldtrust.org.uk/resource/how-will-staffing-numbers-be-affected-by-abolishing-nhs-england.
Productivity Commission, 2024. Advances in measuring healthcare productivity. https://www.pc.gov.au/research/completed/measuring-healthcare-productivity/measuring-healthcare-productivity.pdf.
Reeves, R., 2025. Spending Review 2025 speech. https://www.gov.uk/government/speeches/spending-review-2025-speech.
Somani, R., 2021. Public-sector productivity (part 1): why is it important and how can we measure it? World Bank, https://documents1.worldbank.org/curated/en/913321612847439794/pdf/Public-Sector-Productivity-Part-One-Why-Is-It-Important-and-How-Can-We-Measure-It.pdf.
Thomas, A., 2025. Pat McFadden is right: the civil service needs to lose poor performers. Institute for Government, comment, https://www.instituteforgovernment.org.uk/comment/civil-service-mcfadden-performance.
Turner, H., Hori, Y., Revill, P., Rattanavipapong, W., Arai, K., Nonvignon, J., Jit, M. and Teerawattananon, Y., 2023. Analyses of the return on investment of public health interventions: a scoping review and recommendations for future studies. BMJ Global Health, 8, e012798, https://doi.org/10.1136/bmjgh-2023-012798.
van Ark, B., 2022. Making public sector productivity practical. Productivity Institute, https://www.productivity.ac.uk/wp-content/uploads/2022/08/Making-Public-Sector-Productivity-Practical-Capita-Report-August-2022-FINAL.pdf.
van Ark, B., Hoskins, J. and Jörden, N., 2023. Public sector productivity – managing the Baumol cost disease. Productivity Institute, Productivity Insights Paper 025, https://www.productivity.ac.uk/wp-content/uploads/2023/11/PIP025-Public-Sector-Productivity-FINAL-Nov-2023.pdf.
Warner, M. and Zaranko, B., 2023. Is there really an NHS productivity crisis? Institute for Fiscal Studies, comment, https://ifs.org.uk/articles/there-really-nhs-productivity-crisis.
Warner, M. and Zaranko, B., 2024. The fiscal implications of public service productivity. Institute for Fiscal Studies, report, https://ifs.org.uk/publications/fiscal-implications-public-service-productivity.
Worlidge, J., Aiyar-Majeed, S. and Grama, T., 2025. Civil service staff numbers. Institute for Government, explainer, https://www.instituteforgovernment.org.uk/explainer/civil-service-staff-numbers.
Endnotes
Authors

Olly Harvey-Rich
Olly joined the IFS in 2024 and works in the Healthcare sector.

Max Warner
Max joined the IFS in 2020. His work covers health and social care, public spending and public sector productivity.
More from IFS
Understand this issue


Policy analysis


Academic research


