Introduction
The Spending Review on 11 June will be the first multi-year Spending Review since 2021, and the first to happen outside of a pandemic since 2015. It could prove to be one of the most significant domestic policy events of this parliament.
The government has already set out what it plans to spend in total in coming years – it has fixed what is known as the overall ‘spending envelope’. These plans are shown in Figure 1. Over the period covered by the Spending Review (shown by the green bars), total day-to-day (resource) spending is planned to grow by an average of 1.2% each year in real terms over the next three years and total investment (capital) spending by 1.3% each year in real terms over the next four years. These growth rates are much lower than earlier in this parliament (in 2024–25 and 2025–26), reflecting the front-loaded nature of the government’s top-ups to public spending. Even over the Spending Review period, plans are also slightly front-loaded, with faster growth in 2026–27 than in subsequent years.
At the Spending Review, these totals will be allocated between departments. Three years of plans for department-level day-to-day spending (covering 2026–27, 2027–28 and 2028–29) and four years of plans for investment spending (extending to 2029–30) will be set out in detail.
Because these headline real growth rates are relatively modest, sharp trade-offs are unavoidable. Achieving stated objectives in some areas will likely require real-terms cuts elsewhere. If the government wishes to reduce the scale of those cuts, or avoid making them altogether, overall spending plans could be topped up. Indeed, historically, Spending Reviews have been a point at which spending envelopes have been topped up, as governments are faced with the need to specify departmental-level cuts (Atkins and Lanskey, 2023). But, importantly, this Spending Review is taking place outside of the fiscal event process. That is, unlike in recent cases (the 2021 Spending Review was concluded alongside the Autumn Budget of that year, for example, and the single-year 2024 Spending Review took place alongside that year’s Autumn Budget), the 2025 Spending Review is not coinciding with a Budget and a new set of forecasts from the Office for Budget Responsibility (OBR). This, combined with the tight fiscal situation more generally, makes a loosening of the overall envelope at the Spending Review less likely. We therefore take the spending envelope as given throughout this comment. Changes to spending plans are of course possible, but if plans are to be topped up, it seems more likely that this will happen further down the line – particularly as the plans for 2028–29 are due to get revisited at the next Spending Review, which is scheduled for 2027.
In this comment, we set out four key decisions that will be made at the Spending Review. This is not by any means an exhaustive list, but covers areas where decisions will be particularly challenging, and particularly informative about the government’s priorities. We first consider the question of how much the NHS will receive: as the largest public service department, the rate at which health spending grows has a major impact on the amount left over for spending on other public services. We then consider defence spending – an increasingly high-profile area of public spending, also with potential to squeeze other areas. In light of the spending pressures from health and defence, we then consider how cuts elsewhere might be made – whether through improved productivity or through ‘actual’ cuts to the scope of the state, including the implications for public sector pay and employment. Finally, we consider decisions over investment spending.
1. How much to spend on health?
The NHS is the largest public service, and the Department of Health and Social Care (DHSC, within which the NHS in England sits) is the biggest spending department. The DHSC’s day-to-day budget (to cover things such as pay, medicines and running costs) is planned to be £202 billion this year (2025–26), or 39% of total day-to-day departmental spending. The vast majority of that, £193 billion, is for the NHS in England. Deciding how much money to give the NHS – and health more broadly – is therefore one of the most consequential decisions of the Spending Review.
Before considering the options at this Spending Review, it is instructive to look to the past. Figure 2 shows the difference between the planned growth rates for day-to-day health spending and for overall day-to-day spending at Spending Reviews, with a positive value indicating that health spending was planned to grow more quickly than the average department. Importantly, these values represent the difference between health and average growth, not the level of spending growth – as the table below the figure shows, there were large differences in planned total and health spending growth rates over this period.
Spending Review | 1998 | 2000 | 2002 | 2004 | 2007 | 2010 |
Planned spending growth for health | 4.6% | 5.9% | 6.7% | 6.4% | 3.0% | 0.3% |
Planned total spending growth | 2.6% | 4.0% | 4.8% | 3.9% | 1.7% | –2.1% |
Spending Review | 2013 | 2015 | 2019 | 2020* | 2021 | 2024 |
Planned spending growth for health | 0.1% | 0.8% | 3.1% | 3.5% | 4.1% | 3.4% |
Planned total spending growth | –2.7% | –0.8% | 4.1% | 3.8% | 3.3% | 3.3% |
Over the period between 1998 (when the first Spending Review was held) and 2015, the health budget did relatively well out of the Spending Review process, receiving higher-than-average funding growth. On average, the day-to-day health budget was planned to grow at 3.5% per year, while the overall day-to-day budget was planned to grow at 1.5% per year.1 That means the day-to-day health budget was planned to grow around 2 percentage points faster than the all-department total. But this pattern has changed in recent years: from the 2019 Spending Review onwards, plans have been for the health budget to grow at around the same rate as, and in some cases more slowly than, the overall departmental total. At the October 2024 Spending Review, the new government announced that, between 2023–24 and 2025–26, day-to-day spending for DHSC would grow at almost the same rate as the overall envelope (3.4% for DHSC day-to-day spending compared with 3.3% for total day-to-day spending).
This is useful framing for a central question at the forthcoming Spending Review: whether to continue the recent approach of giving the health service a settlement in line with that of the average department (which on this occasion would mean real-terms increases of around 1.2% per year) or whether to revert to the ‘traditional’ approach of increasing the health budget at a faster rate. The sheer size of the NHS means that this is – in budgetary terms at least – the most consequential Spending Review choice to be made.
There is no objective level of funding growth that the NHS ‘needs’. The funding the NHS receives will determine the types and quality of services it provides, but these are political decisions, and up to the government to decide. The government’s own plan for the future of the NHS – a 10-Year Plan – is expected to be published around the time of the Spending Review.
Given the wide range of possible paths for health spending, in this section we consider three scenarios. For each, we examine what they could mean for the NHS and what they could mean for other departments, taking into account commitments on defence (discussed in the next section) and Barnett consequentials for devolved governments. These scenarios are summarised by Figure 3. The grey bars show the annual real growth in the total day-to-day spending envelope, of 1.2% per year in all scenarios. The green bars show annual real growth for DHSC, while the yellow bars show annual real growth for all other areas of spending excluding defence and block grants to devolved governments.
In our first scenario, we assume that DHSC day-to-day spending grows at 1.2% per year in real terms, equal to the planned growth in the total spending envelope. That is, DHSC does no better than the average department, as was broadly the case at the last Spending Review (though it is worth noting that at the last Spending Review the total envelope was growing considerably faster than is planned for this Spending Review period, and so the average department – and DHSC – benefited from considerably higher growth rates). In this case, other public services would do ever-so-slightly better, with their day-to-day budgets growing by an average of 1.4% per year in real terms.2
It is important to note that 1.2% annual spending growth for DHSC would be historically low. It would be a third of the long-run average growth rate (3.6%), and a third of the increase that we estimate is consistent with the NHS workforce plan in a central scenario (Warner and Zaranko, 2023).3 It would be only slightly above the growth rate of health spending seen under the coalition government (1.0% between 2009–10 and 2014–15). For context, the Office for National Statistics (ONS) projects that the English population will grow by 0.7% per year over this period and that the population aged 65 and over will grow by 2.0% per year. Accounting for differences in healthcare usage by age (i.e. the fact that older people tend to make greater use of NHS services), these demographic changes could increase demand for NHS services by 1.1% per year – which would in this scenario be similar to the increase in spending.4 Given the likely upward pressures on costs from pay deals and new technologies, that would – without substantial productivity improvements – likely make meaningful improvements in NHS performance unachievable.
In our second scenario, we assume that DHSC spending grows at 2.5% per year in real terms, which would mean, after accounting for defence commitments and the Barnett formula, all other areas of spending stay flat in real terms. Increases of 2.5% per year would still be lower than the long-run average for health spending (3.6%), and similar to the lower estimate of the cost to implement the NHS workforce plan set out in Warner and Zaranko (2023) (2.4% per year).5 If combined with meaningful productivity improvements, it might prove possible for the NHS to improve performance to some extent in this scenario, although the outlook would remain challenging.
In our third scenario, we assume that DHSC spending grows at 3.4% per year in real terms. This would be equivalent to increasing the NHS England budget by 3.6% per year – the central estimate of the cost of implementing the NHS workforce plan in Warner and Zaranko (2023) – while moving funding for other DHSC functions in line with all other (non-defence) departments. It is also close to what DHSC would receive if the government gave the NHS the average ‘premium’ relative to the overall envelope growth that was seen at Spending Reviews between 1998 and 2015 (3.2% per year, 2.0 percentage points above the average of 1.2%), and it is close to what the government planned for DHSC at the 2024 Spending Review (3.4% per year in real terms). In this scenario, the NHS might be able to continue to deliver the current version of the NHS workforce plan and materially improve performance, particularly if recent productivity improvements continue. However, other public services would face real-terms cuts of 1.0% per year, given the overall envelope.
These scenarios do not set the bounds of what DHSC could receive: even a settlement of 3.4% each year would still be below the long-run average of health spending increases, for instance, never mind the increases of more than 6% per year delivered under New Labour governments in the early 2000s. Equally, it is possible (albeit unlikely) that DHSC will do worse than the average department. But the exercise illustrates, given the fixed overall envelope and pre-existing commitments on defence (discussed below), just how important the DHSC settlement will be in determining what happens elsewhere. You can explore these trade-offs in more detail yourself using the IFS Be the Chancellor tool.
In sum, increasing health funding at anything like the historical average rate (or at anything like the rate we judge to be consistent with the official workforce plan) would mean imposing cuts on other departments to stay within the overall spending envelope. Yet increasing health funding by much less could prove incompatible with the government’s ambitions – and the public’s hopes – for meaningful improvements in service performance, even with substantial productivity improvements. This is a central choice for the government at the Spending Review.
2. Defence spending: how much further and how fast?
Unlike most other areas of public spending – including spending on the NHS – the government has already set out a path for defence spending in the years after 2025–26. In February 2025, the government announced that defence spending would rise to 2.5% of GDP by 2027–28. As a result, defence spending in 2027–28 is set to be around £6.4 billion higher than if defence spending had instead remained at 2.3% of GDP (its level in 2023).6 The March 2025 Spring Statement document also included a breakdown of the split of this extra funding between resource (day-to-day) and capital (investment) spending, and an implied path for the Ministry of Defence (MoD) resource and capital budgets between 2025–26 and 2029–30.
Specifically, the Spring Statement suggests that MoD resource departmental expenditure limits (RDEL) will grow by 1.0% per year in real terms between 2025–26 and 2029–30, and MoD capital departmental expenditure limits (CDEL) by 6.8% per year.7 This continues a recent trend towards a more capital-intensive defence budget.8 If delivered, that will take defence spending to 2.5% of GDP in 2027–28 and maintain it at that level thereafter.
A key decision for the Spending Review will be whether increasing defence spending to 2.5% of GDP by April 2027 is ‘enough’, or whether the government feels it necessary to go further or faster. The Prime Minister has already set out an ambition to increase defence spending to 3% of GDP in the next parliament, ‘as economic and fiscal conditions allow’. Donald Trump has called for all NATO members to be spending a floor of 5% of GDP on defence. According to a Reuters report, Mark Rutte, secretary general of NATO, has suggested that alliance members should boost defence spending to 3.5% of GDP (with a further 1.5% committed to broader ‘security-related’ spending). The current state of the UK military has also been called into question: the Financial Times reported in December that the Ministry of Defence had calculated that spending of 3.6% of GDP on defence would be needed to allow the UK to meet its existing military ambitions, as part of its input into the Strategic Defence Review (a report and a claim that should be seen in the context of ongoing spending negotiations). In other words, there is every chance that increasing spending to 2.5% of GDP is only the first step of a longer journey upwards.
It is worth noting that any sustained increase in defence spending would be historically unusual. Since the middle of the last century, defence spending has fallen as a share of national income in the UK. Figure 4 shows how the steady reduction in defence spending since the 1950s – a so-called ‘peace dividend’ – has occurred alongside a steady increase in spending on health and social security. The ‘peace dividend’ allowed for higher spending on these areas without a corresponding increase in the size of the state. A steady, sustained increase in defence spending would put this long-term trend into reverse. This rise would be unlikely to be accompanied by any fall in health spending, and the last time both health and defence spending rose as a share of national income simultaneously for a sustained period was in the early 1980s – more than 40 years ago.
The path for defence spending will be confirmed at the Spending Review. This would be a natural point for the government to put the UK on a path towards spending 3% of GDP on defence, or to speed up the timeline at which the UK will reach 2.5%, if it views this as necessary (though such a decision could always come later with appropriately amended spending plans).
In the scenarios considered in the previous section, we accounted for the commitment to increase defence spending to 2.5% of GDP, mostly through capital spending. We can also consider a ‘defence pressure’ scenario under which the government decided it was necessary to reach the 3% of GDP ambition by 2029–30, at the beginning of the new parliament. We assume that the capital intensity of this additional spending is equal to the share planned for 2029–30 implied by the Spring Statement (around 43%) – a relatively high level by historical standards, which reduces the extent to which higher defence spending squeezes other areas of day-to-day spend. In Figure 5, we show the effect that this additional spending might have on other areas of day-to-day spending, referring back to the three scenarios discussed in the previous section.
Giving more to defence means, all else equal, bigger cuts to something else. In a scenario where defence is increased to 3% of GDP, and DHSC gets 3.4% (around the long-run average), all other departments would face cuts of around 1.8% per year (as shown on the far right-hand side of the graph). Even if DHSC ‘only’ received the average funding growth rate of 1.2% per year, getting defence to 3% of GDP would reduce the growth rate of other areas to 0.6% per year (shown on the far left-hand side). It would, in other words, make the trade-offs at the Spending Review even more acute, and require (even deeper) cuts elsewhere.
3. What to squeeze – and how?
In the previous two sections, we showed that, given the planned rate of growth in total day-to-day spending, and given commitments for defence spending and ambitions for improvements in NHS performance, other public services are likely to face tight settlements. A more generous NHS settlement, or going further and faster on defence spending, would make cuts to other public services even more likely. Moreover, the funding for these other public services is unlikely to be allocated equally across departments. Within the category of ‘unprotected’ departments, larger increases for some areas – prisons, say, which face well-publicised challenges – would mean less (i.e. bigger cuts) for others.
That some areas face budget cuts is, it should be said, perfectly normal and perhaps even desirable: the government should prioritise and deprioritise different areas according to its objectives, preferences and changing circumstances. The question is where those cuts should be made, assuming that overall plans are not topped up to avoid them, and whether the trade-offs will be confronted rather than wished away.
Ultimately, there are two approaches to cutting budgets (which are not mutually exclusive). The first is to make productivity improvements: in other words, to try to deliver the same (or even better) public services within lower budgets. The second is to reduce the range and quality of government services or to tighten criteria for who is eligible to use those services.
Improving the productivity of public services is clearly desirable. This government – like the last one – has made it a priority. There are inevitably improvements that can be made. Indeed, the ONS estimates that total public service productivity remains below pre-pandemic levels, and so even getting this back to its pre-pandemic level would represent a substantial improvement. A range of initiatives have already been announced, including asking departments to make large cuts to administration spending and introducing a £3 billion fund for productivity-enhancing spending programmes (recognising that achieving improvements may require up-front investment). A key question for the Spending Review is what scale of productivity improvements can be made, and whether these improvements can release cash savings (rather than being ploughed back into the delivery of improved services – see Warner and Zaranko (2024)).
Having pushed productivity savings as far as it can, the government may still find itself needing to make ‘actual’ cuts to deliver its desired budgetary savings. Its own framing of the Spending Review as ‘zero-based’ suggests that it is willing to do that. That might mean stopping doing some things (e.g. some types of NHS services), introducing or increasing charges for services (e.g. raising university tuition fees) or means-testing access to some services (something we already do for social care, for instance). Such changes would clearly be politically difficult. But repeatedly squeezing departmental budgets and pretending that everything can stay the same is not a sustainable approach.
A key consideration in any discussion of either productivity savings or ‘actual’ cuts is the evolution of public sector pay and employment. Staff costs account for almost half of departmental day-to-day spending, and so decisions over departmental budgets in the Spending Review are inherently bound up with plans for public sector pay and employment. Increasing the productivity of public services by trying to deliver similar-quality services within lower budgets would almost inevitably involve reductions to either pay or headcount; equally, if the range or quality of services is pared back, this would likely require fewer public sector staff than if services are maintained.
At this Spending Review, departments’ day-to-day budgets are set to grow by an average of 1.2% per year in real terms between 2025–26 and 2028–29. The OBR’s March 2025 forecast suggests that total employment is set to grow by an average of 0.6% each year over the same period: one scenario would be for public sector employment to grow in line with this average (i.e. the government share of total employment stays constant). For the public sector paybill to grow by 1.2% each year in real terms, in line with overall budgets, average pay awards would need to average 2.0% in cash terms each year. This would keep real-terms pay roughly constant (the latest OBR forecasts for household inflation imply an average of 2.0% per year between 2025–26 and 2028–29). But these pay awards would be below the OBR’s forecast for average annual economy-wide earnings growth over this period (2.2% in cash terms) and below the pay awards recently announced for 2025–26 (which were around 4% on average). Given concerns about strikes in the public sector after the high-profile industrial action in 2023 and 2024, and ongoing issues with recruitment and retention across much of the public sector, keeping real-terms pay flat for three years could pose serious challenges.
There are, of course, other options. Smaller increases in non-staffing costs (e.g. for equipment or outsourced services) could create space for larger pay increases. If non-staffing costs were held flat in real terms, then within the same overall spending envelope, the public sector paybill could grow by approximately 2.7% in real terms each year between 2025–26 and 2028–29. With public sector employment growth of 0.6% each year, that implies average public sector pay awards of 3.4% per year in cash terms (1.5% in real terms). Even that could prove a tricky sell to public sector unions and their members – and would require a tight lid to be kept on other types of spending.
Alternatively, employing fewer people in the public sector would, within the same overall paybill, allow those who remain to be paid more. Even just maintaining the current size of the public sector workforce (rather than having it grow year on year) would allow for higher pay awards within the same overall budgets. If public sector employment stayed constant between 2025–26 and 2028–29, and again the paybill grew at 1.2% each year in real terms, pay awards could average 2.6% per year in cash terms (0.8% in real terms). Recent efforts to reduce the numbers employed in NHS England, in NHS Integrated Care Boards, in the civil service and elsewhere can be seen in this light. But constraining the growth of the overall public sector will be tricky in the context of an NHS workforce plan that implies growth in the health service workforce of 3.1–3.4% per year, a manifesto promise to hire 6,500 more teachers, and a likely reluctance to reduce the number of police officers, prison officers or members of HM Forces.
In sum, it is difficult to see how average funding increases of 1.2% per year can be delivered without public sector pay restraint (i.e. public sector pay awards below those expected in the private sector, and in line with inflation), heroic cuts to non-staffing costs, slower-than-expected growth in – or cuts to – public sector employment, or some combination of all of the above. Making these choices will be a key part of Spending Review decisions about where to cut and about where to focus on productivity improvements.
4. More public investment, but in what?
In the previous sections, we have mainly focused on day-to-day departmental spending, which accounts for the majority of spending on the delivery and administration of public services (80% in 2025–26). But the Spending Review will also set departmental capital budgets, for the years between 2025–26 and 2029–30 (for one more year than for day-to-day budgets, which will be set between 2025–26 and 2028–29).
The overall capital envelope is planned to grow slightly more rapidly than the envelope for day-to-day spending – by an average of 1.3% per year in real terms between 2025–26 and 2029–30. This comes after much faster growth of 7.4% per year in real terms between 2023–24 and 2025–26, following a substantial injection of funding in the October 2024 Budget (see Figure 1). As a share of national income, capital spending is set to be sustained at a higher level than has been the norm in recent decades. Over this Spending Review period, public sector net investment – a broader measure than departmental capital spending – is planned to average 2.6% of GDP, compared with an average of 1.7% between 1997–98 and 2019–20.9
In other words, government investment is already at a high level by (recent) UK standards and is set to be maintained there. The questions for the Spending Review are ‘What does the government wish to invest in?’ and ‘Where should that relatively large capital budget be allocated?’.
For context, Figure 6 shows how planned departmental capital spending in 2025–26 is split between departments. Government departments differ greatly in the share of their total budget that goes towards capital (i.e. their capital intensity). This means that the biggest capital-spending departments look quite different from the biggest day-to-day spenders. Defence is the largest area of capital spending (£24 billion in 2025–26), followed by transport (£22 billion) and science, innovation and technology (£15 billion). Although DHSC is by some margin the largest day-to-day spender, it is the fourth-largest capital-spending department (£14 billion), followed by energy, security and net zero (£12 billion) in fifth.
Figure 6. Breakdown of planned departmental capital spending in 2025–26
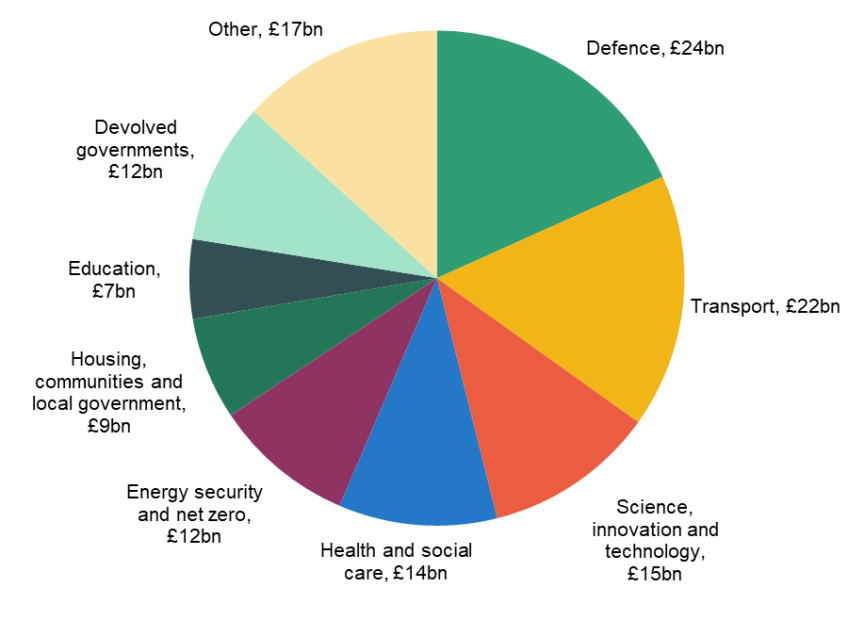
Note: Defence covers Ministry of Defence and Single Intelligence Account. Energy Security and Net Zero includes construction costs for carbon capture and hydrogen projects that are waiting for a spending classification decision from the ONS.
Source: Spring Statement 2025.
As discussed under the question 2 heading, the government has already set out a(n implicit) path for the Ministry of Defence capital budget as part of its plans to increase defence spending to 2.5% of GDP by 2027–28. Figure 7 shows what the implied capital funding commitments to the Ministry of Defence and Single Intelligence Account (discussed earlier) would mean for capital spending on everything else over different periods. The green bars show average growth in total capital budgets, while the yellow bars show defence capital budgets and the grey bars show capital budgets for all other government departments.
Over the forthcoming Spending Review period, the details provided at the Spring Statement suggest that all of the increase in capital spending over the coming years has already been allocated to defence: we estimate capital budgets for everything else will fall by 0.1% per year in real terms between 2025–26 and 2029–30. In other words, the government has already decided that all of the extra capital spending over this Spending Review will go to defence.
Non-defence capital spending will be roughly maintained at its 2025–26 real-terms level.10 It is important to note that in real terms this is some 15% above its 2023–24 level and 41% above its 2019–20 level. So, relative to the past, there will be more to go around. But it means that a real-terms increase for one budget will require a real-terms reduction elsewhere. The government will not be able to do everything it might like. A government that is serious about economic growth might want to increase capital spending in transport and science, innovation & technology. A government that is serious about improving public services might want to increase capital spending on hospitals, schools and prisons. A government that is serious about climate change might want to increase capital spending on energy security and net zero. But within the existing capital budgets, the government will be unable to prioritise increases to all three. The choice of which to prioritise will be revealing.
Conclusion
At last year’s Spending Review, held alongside the Autumn Budget, the government set out a front-loaded path for spending over the course of the parliament, with large boosts in spending in the first couple of years and much slower growth thereafter. At this year’s Spending Review, the consequences of this decision must be confronted.
Absent a top-up to the overall spending envelope – which would be unusual outside of the full fiscal event process, and which would affect performance against the fiscal rules – some areas of spending will almost inevitably face real-terms cuts after this year. The scale of these cuts can be reduced if the NHS gets a low funding growth settlement (by NHS standards), but this will make it much harder to achieve the government’s aspirations for reductions in hospital waiting times and broader service improvements. Increasing defence spending further or faster than currently planned – a real possibility – only makes these cuts elsewhere more likely.
Cuts to public services would not be impossible to make, particularly since they would come after rapid increases in spending on most services in recent years. But they would still be challenging and require ruthless prioritisation. Even if we see improvements in public sector productivity – which should be a focus across government – a combination of reductions in public sector employment, public sector pay and the range of public services the government provides would likely be required. If the government promises cuts without a realistic plan for how to achieve them, this could undermine confidence in the credibility and deliverability of the government’s spending plans and, by extension, the fiscal forecasts.
When it comes to capital spending, government investment is set to be sustained at historically high levels in the coming years. If spent well, this should help contribute to growth and to better public services in years to come. In some sense, there will be more to go around, and the key choice is what to invest in. That said, all of the increase in capital spending over the Spending Review period has already been implicitly allocated to defence. Given that, it will not be possible to also prioritise investments in public services, net zero and growth-friendly areas while staying within the envelope. It is perhaps the decision the government makes here that will give us the clearest sense of its true priorities.
Endnotes
Authors

Bee Boileau
Bee joined the IFS in 2021 as a Research Economist and works in the Retirement, Saving and Ageing sector.

Max Warner
Max joined the IFS in 2020. His work covers health and social care, public spending and public sector productivity.

More from IFS
Understand this issue


Policy analysis


Academic research