Downloads
Download report here
PDF | 444.75 KB
Key findings
1. In June, NHS England published its much-awaited long-term workforce plan, which was welcomed across the political spectrum. The plan aims to increase the number of staff employed by the English NHS from around 1.5 million in 2021–22 to between 2.3 and 2.4 million in 2036–37. This would be equivalent to average growth in the size of the NHS workforce of between 3.1% and 3.4% per year. For context, we estimate that NHS staffing numbers grew by around 1.1% per year between 2009–10 and 2019–20.
2. If this increase in the NHS workforce is delivered, we estimate that almost half (49%) of public sector workers in England will work for the NHS in 2036–37, compared with 38% in 2021–22 and 29% in 2009–10. By 2036–37, we estimate that one in eleven (9%) of all workers in England will work for the NHS, compared with one in seventeen (6%) in 2021–22 and 2009–10.
3. While the plan included £2.4 billion of additional funding for the training of new staff, it did not consider the (much larger) medium-term implications of this large increase in staffing for the NHS paybill, nor the required increase in other inputs if the NHS is to treat substantially more patients. This will mean difficult fiscal decisions at future Spending Reviews.
4. Increasing the size of the workforce so rapidly will likely require NHS wages to become more generous in real terms and – potentially – match or even exceed growth in wages in the rest of the economy. It will also likely require an increase in non-staffing inputs to healthcare (most obviously things such as drugs and equipment).
5. Under a central set of assumptions, the workforce plan implies annual NHS budget increases of around 3.6% per year in real terms (or 70% in total by 2036–37). This would be in line with the long-run average real-terms growth rate in UK health spending (3.6% per year from 1949–50 to 2022–23), but higher than the 2.4% per year seen since 2009–10. In other words, returning to the NHS’s long-run average funding growth rate could be enough to fund the workforce plan, but those increases would need to be delivered in a period when economy-wide productivity growth is expected to be lower than what it has been for much of the NHS’s history.
6. In the central case, spending on the NHS in England would be around 2% of GDP higher by 2036–37, relative to 2021–22 (the starting point for the workforce plan). That is similar to the increase in UK health spending over the 15 years to 2008–09 (2.2% of GDP) and equivalent to around an extra £50 billion in today’s terms. To give a sense of scale, raising that sort of sum would require increasing the standard rate of VAT from 20% to around 27% by 2036–37 or increasing all income tax rates by around 6 percentage points. Other funding options would of course be available.
7. By the NHS’s own estimates, the staffing increases contained in the plan will only be enough to meet NHS demand if productivity can be increased by between 1.5% and 2% per year: an extremely ambitious target well above what the NHS is estimated to have achieved in the past. The Office for National Statistics estimates that quality-adjusted productivity in the NHS increased by an average 0.8% per year between 1995–96 (when the data series starts) and 2019–20, and 1.2% per year between 2009–10 and 2019–20. While not perfectly comparable to the measure of labour productivity used in the workforce plan, this gives a sense of the scale of the ambition – particularly as, since the onset of the pandemic, measured productivity performance in the NHS has been even weaker.
8.1 Introduction
In January 2000, in what was subsequently dubbed ‘the most expensive breakfast in history’, then Prime Minister Tony Blair announced on Sir David Frost’s Sunday morning TV show that UK health spending would be increased to the European Union average. The then Chancellor Gordon Brown was rather displeased, and reportedly raged to the prime minister that ‘you’ve stolen my f***ing budget’ (Rawnsley, 2010).
In June, NHS England published its much-awaited long-term workforce plan (NHS England, 2023). For the first time, the plan sets out official estimates of how many staff the NHS will need in the future and proposes a range of actions and targets to achieve this. Its publication was welcomed across the political spectrum.
Many have discussed the strengths and weaknesses of the plan elsewhere (e.g. Black, 2023; Dixon, 2023; Murray, 2023; Palmer, 2023). But one of the less remarked-upon aspects of the plan is that it has probably stolen more than a decade’s worth of budgets, for funding the plan will require NHS spending in England to increase by around 2% of national income over 15 years, equivalent to around £50 billion in today’s terms. That will set the context and constraints in every Budget and Spending Review for at least the next decade.
Here, we do not seek to evaluate the merits of the plan, its modelling assumptions or its achievability. Instead, we start from the assumption that the plan will be implemented in full and consider the potential implications for the size of the NHS workforce and NHS budget in England. While the plan includes funding for new training places, it does not estimate nor provide for the longer-term increases in funding that will be required to cover the salaries – and other costs – of an expanded workforce.
The plan suggests the number of staff employed by the English NHS will increase from around 1.5 million in 2021–22 to between 2.3 and 2.4 million in 2036–37. This would be equivalent to average growth in the size of the NHS workforce of between 3.1% and 3.4% per year. For context, we estimate that NHS staffing numbers grew by around 1.1% per year between 2009–10 and 2019–20. Meeting the plan would almost certainly see the NHS account for a growing share of not just public sector employment but also the overall workforce. By 2036–37, we estimate that almost half (49%) of public sector workers in England will work for the NHS, compared with 38% in 2021–22 and 29% in 2009–10. Moreover, we estimate that one in eleven (9%) of all workers in England will work for the NHS, compared with one in seventeen (6%) in 2021–22 and 2009–10.
Such an expansion in the workforce has implications for the size of the NHS wage bill. First and most obviously, employing hundreds of thousands of additional people will increase staffing costs. But in addition, to attract and retain this many more workers, it seems likely that – at a minimum – NHS pay will need to keep pace with earnings in the wider economy. Taken together, we estimate that the workforce plan implies real-terms increases in the NHS wage bill of around 4.4% per year. Even if all other NHS spending (on non-staff items) were frozen in real terms for the next 15 years, this implies that the NHS budget would need to increase by around 2.3% per year, over and above inflation, to cover these higher staffing costs alone.
But more staff will surely mean increased spending elsewhere, whether on new hospitals, equipment or medicines. We estimate that under a central set of assumptions, the workforce plan implies annual NHS budget increases of around 3.6% per year in real terms. This would be in line with the long-run average real-terms growth rate in UK health spending (3.6% per year from 1949–50 to 2022–23), but above the 2.4% per year seen since 2009–10. In other words, returning to the NHS’s long-run average funding growth rate could be enough to fund the workforce plan. But with prospects for productivity growth over the next decade weaker than what was realised over the first 60 years of the NHS’s life, continuing to deliver the same real-terms growth rate would mean harder trade-offs elsewhere. It would mean that funding for the NHS in England would increase by around 2.0% of GDP by 2036–37: similar to the increase in UK health spending over the 15 years to 2008–09 (2.2% of GDP) and equivalent to an extra £52 billion in today’s terms. By the NHS’s own estimates, though, this will only be enough to meet demand if productivity can be increased by between 1.5% and 2% per year: an extremely ambitious target.
Stepping back, the publication of the NHS workforce plan is probably as close as any government is ever going to get to explicitly acknowledging the virtual inevitability of big increases in health spending over the medium term. That acknowledgement should be front and centre of the Chancellor’s fiscal event this autumn.
8.2 What is in the plan?
The workforce plan is organised around three themes: training new staff, retaining existing staff and reforms to improve productivity. To train new staff members, the plan proposes large increases in medicine and nursing university places, as well as expansions to apprenticeships and alternative routes into clinical roles. For example, the plan aims to double the number of medical school places, increase the number of GP training places by 50% and almost to double the number of adult nursing training places (an increase of 92%), all by 2031–32. The plan includes additional funding of £2.4 billion over the next six years for this expansion in training. As the domestic supply of staff expands, the plan forecasts that the share of NHS staff recruited from overseas will fall from nearly 25% to around 10% by 2036–37 (specifically between 9% and 10.5%).
To retain existing staff, the plan outlines a range of proposals, including increasing flexible working, improving the health of the workforce, and improving local and national culture and leadership. The objective is to reduce the annual NHS-wide leaver rate from 9.1% to between 7.4% and 8.2%, a target which is dubbed ‘a stretching but realistic trajectory’.
Finally, the plan focuses on increasing productivity. One key part of this is the expansion of new roles – such as physician associates and nursing associates – that aim to free up time for more trained, traditional roles such as doctors and registered nurses. Another part of the plan to increase productivity is through the use of new technology, such as artificial intelligence and robotic assisted surgery. Overall, the plan is based on an ‘ambitious’ assumption that labour productivity will increase by between 1.5% and 2% per year. For context, the Office for National Statistics estimates that (quality-adjusted) productivity in the NHS increased by an average 0.8% per year between 1995–96 (when the data series starts) and 2019–20, and 1.2% per year between 2009–10 and 2019–201.Since the COVID-19 pandemic began, measured productivity has fallen substantially (Warner and Zaranko, 2022). While not perfectly comparable to the labour productivity measure used in the workforce plan, this provides an indication of the degree of ambition of the plan’s assumptions.
Importantly, as well as outlining a range of actions and objectives, the plan includes detailed workforce modelling. For each professional staff group within the NHS, the plan forecasts the full-time-equivalent (FTE) number of staff needed by 2036–37. It then forecasts how supply would change without the workforce plan (counterfactual supply) and how each aspect of the plan will increase or decrease the workforce over time. This leads to forecasts for the total workforce in each staff group in 2026–27, 2031–32 and 2036–37.
Here and throughout, our primary focus is on the number of workers employed by the NHS (defined as ‘substantive’ staff in post, plus those employed on a bank-only contract), as these are the groups relevant for the NHS paybill and the groups the workforce plan aims to increase. Agency staffing is implicitly assumed to fall to almost zero by 2036–37; indeed, reducing dependency on agency staffing is an explicit objective of the plan and one that, if achieved, could reduce budgetary pressures. We therefore exclude agency workers from our analysis of the workforce, but allow for an elimination of agency spending by 2036–37 in our funding projections.
Figure 8.1 shows the plan’s target growth for each staff group between 2021–22 and 2036–37. The starting point includes substantive staff and an estimate for the number of ‘bank-only’ staff in each group. The plan includes a lower bound (the green bars) and an upper bound (the yellow bars) to help highlight the uncertainty over the impacts of actions taken in the plan. The first panel of the figure includes all professional staff groups. It is clear that the two emerging roles – advanced practitioners and nursing associates – are planned to increase dramatically, by far more than other, more traditional roles within the NHS. The number of advanced practitioners is forecast to increase from 8,300 in 2021–22 to 39,000 in 2036–37, an increase of 370%, while the number of nursing associates is forecast to increase from 5,300 to 64,000, an increase of 1,100%.
The second panel of the figure excludes these two emerging staff groups, in order to focus on the changes in other, much larger staff groups. Mental health staff – both psychological professions and mental health and learning disability nurses – are the groups with the largest forecast increases, with increases of 140–160% and 110–120% respectively. The number of consultants is forecast to increase by 51%, while the number of adult nurses is forecast to increase by 43–47%. The two largest staff groups – support to clinical staff, and infrastructure support – are forecast to grow by 55–62% and 52–58% respectively.
Taken together, the plan has two key implications for the NHS workforce. One is a substantial expansion in the numbers in all staff groups. Even the smallest increases are still large: a 29–37% increase in the number of midwives, for instance. The second implication is a change in the composition of the workforce – increasing the number of associate roles, and expanding the mental health sector relative to the acute and community sectors.
8.3 What does the plan mean for the size of the NHS workforce?
We now consider the implications of the plan for the total size of the NHS workforce. The plan includes all of those working in the hospital and community healthcare sectors, as well as GPs working in primary care. We do not include pharmacists or dentists in our analysis, as these were modelled separately in the plan and are not typically employed directly by the NHS. These are relatively small groups of staff and their exclusion will not materially alter our headline conclusions.
Overall, the plan aims to increase the permanent NHS workforce from 1.4 million in 2021–22 to between 2.2 and 2.3 million in 2036–37, an increase of between 57% and 64%.
This measure excludes temporary staff: those employed via an agency, and those employed by the NHS on ‘bank-only’ contracts. As described above, our preferred measure is the sum of ‘substantive’ staff in post and bank-only staff, all of whom are employed by the NHS, but excluding agency staff. On this definition, NHS staffing is planned to grow from about 1.5 million to between 2.3 and 2.4 million over the 15-year period: between 58% and 64%, or between 3.1% and 3.4% per year.
Figure 8.2 shows how the size of the NHS workforce in England has changed since 2009–10, and how it will continue to grow if the workforce plan is met. Crucially, the forecast annual growth rate – between 3.1% and 3.4% per year – is far higher than the pre-pandemic growth rate of 1.1% per year between 2009–10 and 2019–20. Even after including the COVID-19 pandemic, the NHS workforce grew by 1.5% per year between 2009–10 and 2021–22, far lower than the growth rate implied by the workforce plan. The grey dashed line in Figure 8.2 illustrates what would happen to the NHS workforce if it continued to grow at this rate. For context, UK-wide NHS employment grew by 3.0% per year between 1999 and 2009, slightly slower than under the workforce plan (Office for National Statistics, 2023).
This large increase in staffing means that the NHS workforce will almost certainly make up a bigger share of the public sector and economy-wide workforce. In Figure 8.3, we estimate the future path for NHS England employment as a fraction of total public sector employment in England. To do so, we assume that the non-NHS public sector workforce grows in line with the Office for Budget Responsibility (OBR)’s forecasts for general government employment, and that NHS staffing grows in line with the workforce plan.
In 2009–10, NHS staff made up an estimated 29.0% of the public sector workforce in England, and this rose to 38.3% by 2021–22. Under our assumptions, we estimate that by 2036–37, NHS staff will make up between 48.5% and 49.0% of the public sector workforce. The NHS workforce will therefore have risen from just over a quarter of the public sector workforce in England to around half in less than three decades. If anything, this is likely to overstate non-NHS public sector workforce growth, since OBR’s forecasts for general government employment include the NHS, and thus our estimates likely understate the increase in the NHS’s share of the total.
Figure 8.4 repeats this analysis for the economy-wide workforce in England. We assume that the non-NHS workforce grows in line with OBR projections for overall employment until 2027–28 (the end of the forecast period), and that it then grows in line with ONS projections for the working-age population. We estimate that the NHS workforce rose from 5.7% of the economy-wide workforce in England in 2009–10 to 6.0% in 2021–22. This is a much smaller increase than the increase in the NHS as a share of the public sector workforce because, whereas the public sector workforce was reduced in size over the 2010s, the economy-wide workforce increased in size.
If the workforce plan is achieved, we estimate that the NHS England workforce will account for between 8.7% and 9.1% of economy-wide employment in England in 2036–37. This means that, under conservative assumptions, one in eleven working adults could be working for the NHS in 2036–37, compared with one in seventeen in 2021–22. That will clearly increase the importance of the NHS, as an employer, to the wider labour market and macroeconomy. The broader health and social care sector will be more important still. Even if the adult social care workforce only grows in line with the wider workforce in England, by 2036–37 one in seven working adults could be employed in health and social care.
8.4 What does the plan imply for NHS funding?
We now consider what the workforce plan could mean for NHS funding. There are two direct costs of the increase in staffing: the costs associated with training new staff, and the costs of actually employing new staff (and retained existing staff). The plan includes funding for the former (staff training). We focus here on the additional and substantially larger cost of employing a much larger workforce, funding for which will (presumably) need to be provided at future Spending Reviews. We then consider the indirect implications of the workforce plan: if the NHS has between 58% and 64% more staff by 2036–37, it will almost certainly require more spending on other areas. To take one simple example, if the health service employs far more doctors, we might expect an increase in the amount of medicine being prescribed.
In this section, we focus on the impacts of the plan for NHS day-to-day (resource) spending, but the plan will also likely have implications for capital spending: such a large increase in staffing will also likely (at some point) require new equipment and new hospitals. As the plan itself states, to achieve the required productivity assumptions will require ‘a sustained increase in capital investment in the ageing NHS estate … [and] investment in digital infrastructure throughout the NHS’ (NHS England, 2023, page 109).
Staff costs
We first consider the total staffing costs for NHS providers, including NHS hospital and community trusts. In 2021–22, NHS England’s resource budget was £146.5 billion (equivalent to £156.1 billion in 2022–23 prices) and it spent £66.2 billion on staff working for NHS providers, equivalent to 45.2% of its total budget (Department of Health and Social Care, 2023). This does not include staff employed by non-NHS providers, such as those working in primary care, dentistry, or community pharmacy. In our calculations of the wage bill, we therefore exclude the costs of employing the additional GPs (who have been included in our analysis up to this point) included in the plan, as well as dentistry and community pharmacy staff (who have not). Larger staff numbers in these other sectors of the NHS will implicitly be part of the increase in ‘other’ NHS costs that we subsequently consider.
According to the workforce plan, the total number of staff employed by NHS providers will grow by between 3.1% and 3.4% per year from 2021–22 to 2036–37. A very simple forecast, therefore, would be that the NHS wage bill will also grow by between 3.1% and 3.4% per year in real terms. Implicitly, this assumes that both real wages and the mix of professional groups stay constant between 2021–22 and 2036–37.
Neither of these assumptions seems plausible. As Figure 8.1 shows, the largest staffing increases in the plan are for new associate roles, which typically have lower wages than the traditional roles they are designed to be partial substitutes for. This change in professional mix will therefore reduce the real growth rate in the wage bill relative to the growth rate in staff numbers, though only very marginally: we estimate that annual growth in the wage bill might be reduced by around 0.05 percentage points as a result.
More significantly, if the NHS is going to expand its workforce by more than half, it will need a strategy for attracting workers into the sector (and subsequently retaining them). That is almost certain to require real-terms wage increases, and highly likely to require pay increases that match – or perhaps even exceed – economy-wide earnings growth.
The OBR forecasts that between 2024–25 and 2036–37, economy-wide nominal wages will grow on average by 3.3% per year (for the years before 2024–25, we use estimates of NHS pay deals). After accounting for expected inflation (as measured by the GDP deflator – the relevant measure in this case since we are focused on public service spending rather than household spending power), this would equate to average real-terms pay growth of 1.2% per year. We use this as our central scenario for future NHS pay growth. Combined with planned growth in the size of the workforce (taking the midpoint of the NHS’s two scenarios), this would lead to average growth in the real-terms wage bill of around 4.4% per year.
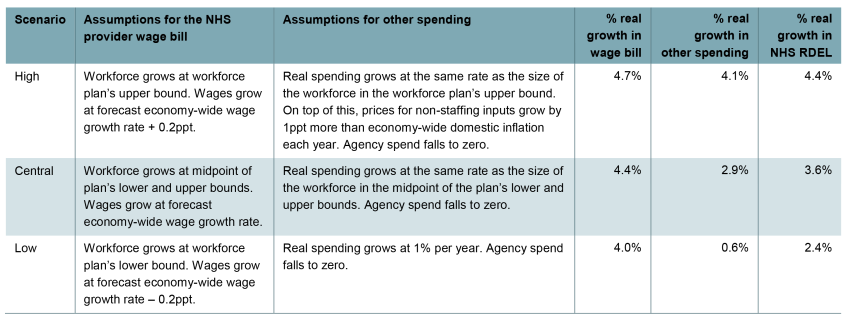
Table 8.1 presents this central scenario, along with two alternatives. (The table also shows scenarios for non-pay spending, which are discussed in the next subsection.) In our ‘low’ scenario, we assume that the size of the NHS workforce grows according to the workforce plan’s lower bound and that wages grow 0.2 percentage points (ppt) slower than forecast economy-wide wages (1.0% per year, rather than 1.2%). This is to reflect the possibility that other aspects of NHS employment – such as job security or a valuable public sector pension – mean that the NHS can continue to recruit staff even as NHS wages fall relative to the average economy wage. In this case, we estimate that the NHS wage bill would grow on average by around 4.0% per year in real terms between 2021–22 and 2036–37.
Table 8.1. Scenarios for estimated NHS funding growth if the workforce plan is achieved
Note: The unit costs of each staff group in 2022–23 are estimated using NHS hospital and community sector average earnings estimates for 2022–23 where possible. For GPs, we use average GP earnings for 2020–21 and scale these by consultant earnings growth between 2020–21 and 2022–23. For staff groups not included in NHS earnings statistics, we estimate earnings using the midpoints of starting Agenda for Change bands in 2022–23 for fully trained members of each group. We assume that all staff groups receive the same nominal earnings growth. We include employer pension contributions and National Insurance contributions. We assume that agency spend goes to zero by 2036–37 and we subtract a counterfactual agency spend (assuming agency spend is proportional to the wage bill) from the level of total spending. We assume that agency spending declines linearly from its level in 2021–22 to zero in 2036–37.
Source: Authors’ calculations using NHS England’s long-term workforce plan (NHS England, 2023), NHS England’s NHS staff earnings estimates (various) (https://digital.nhs.uk/data-and-information/publications/statistical/nhs-staff-earnings-estimates), NHS Digital’s GP earnings and expenses estimates 2020–21 (https://digital.nhs.uk/data-and-information/publications/statistical/gp-earnings-and-expenses-estimates/2020-21), NHS health careers website (https://www.healthcareers.nhs.uk/), OBR long-term economic determinants June 2023 (https://obr.uk/efo/economic-and-fiscal-outlook-march-2023/), HM Treasury’s GDP deflators at market prices June 2023 (https://www.gov.uk/government/statistics/gdp-deflators-at-market-prices-and-money-gdp-june-2023-quarterly-national-accounts) and DHSC’s written evidence to the NHS Pay Review Body for the 2023 to 2024 pay round (Department of Health and Social Care, 2023).
In our ‘high’ scenario, we assume that the size of the NHS workforce grows according to the upper bound of the workforce plan’s forecast. We assume that, to attract such a large number of workers, NHS wages grow 0.2ppt faster than economy-wide wages each year, equivalent to an average 1.4% real growth rate. In this case, we estimate that the NHS wage bill will grow on average by 4.7% per year in real terms.
Under a reasonable range of assumptions, we therefore estimate that the total NHS provider wage bill is likely to grow by between 4.0% and 4.7% per year if the workforce plan is implemented and achieved in full. This reflects both the large expansion in the number of staff and our assumption that real wages will need to increase to deliver such an expansion. For comparison, between 2013–14 and 2021–22, the NHS wage bill grew by 3.6% per year in real terms. Excluding the exceptional COVID-19 period, the average real-terms growth rate between 2013–14 and 2019–20 was 2.7%.
Other costs
We now consider what the workforce plan could mean for other, non-staffing, NHS costs. If the NHS has more staff and is treating more patients, it will likely have higher costs elsewhere. For example, it will likely need to spend more on medicines, food, energy, IT and maintenance. Moreover, some of the higher staff numbers in the plan – such as having more GPs and dentists – will translate into higher spending on primary care and dentistry that is not included in NHS provider staff costs.
However, it is less clear how these costs will change as a result of the NHS workforce plan. In many cases, this comes down to policy decisions about which inputs to prioritise. Given the large degree of uncertainty, we make a wide range of assumptions about how spending on these other inputs could evolve. For each of our three scenarios, the third column of Table 8.1 summarises the assumptions we make for these items, and the fifth column shows the implied average real-terms growth rate in non-staff spending. All of these scenarios allow for an elimination in NHS spending on agency staff by 2036–37 as a result of the workforce plan (which we include in the ‘other spending’ column).
In our central scenario, we assume that the quantities of other inputs grow in line with the overall workforce, but that the real prices of these inputs remain constant. This would result in 2.9% average real-terms growth in non-staffing spending. This is roughly in line with increases over the pre-COVID period (non-staffing costs grew by 2.4% per year between 2013–14 and 2019–20) and is, to a rough approximation, what we might expect to happen if the mix of healthcare inputs remains constant, and the prices of non-staffing costs increase no faster than economy-wide domestic inflation.
It may be that non-staffing costs need to grow substantially less quickly than staffing costs, or that growing staffing costs squeeze out other inputs. In our ‘low’ scenario, we assume that real spending on providers’ non-staffing costs grows at 1.0% per year in real terms (0.6% per year after accounting for lower agency spending). This is a very conservative assumption, at the very lower bound of what seems plausible.
Alternatively, achieving the workforce plan’s ambitious productivity gains might require greater spending on non-staff inputs. In our ‘high’ scenario, we assume that the quantities of other inputs grow at the same rate as staffing in the plan’s upper bound, but also assume that real prices for those inputs grow by 1% per year (i.e. those prices grow by 1ppt more than economy-wide domestic inflation each year). This means that providers’ non-staffing costs would grow by 4.1% per year on average in real terms. These scenarios provide a broad range and are intended to be indicative.
Total NHS funding
With our assumptions about the path of the NHS wage bill and the path of non-staffing costs, we can estimate the implications of the plan for total NHS funding. The final column of Table 8.1 summarises our estimated real growth rate in resource spending (RDEL) between 2021–22 and 2036–37. In our central scenario, we estimate total costs will grow by 3.6% in real terms per year. In our ‘low’ scenario, we estimate that total costs will grow by 2.4% per year. And in our ‘high’ scenario, we estimate that total costs grow will grow by 4.4% per year.
For context, between 2009–10 and 2022–23, UK-wide health spending grew at an average rate of 2.4% per year. Between 2019–20 and 2022–23 (the COVID period), funding grew by 4.7% per year in real terms. Over the full period since the creation of the NHS, funding has grown at an average real rate of 3.6% per year. We estimate that meeting the costs of the NHS workforce plan would require funding increases broadly within this range (though would require considerably larger increases than were seen over the 2010s, when real-terms funding growth averaged 1.7% per year).
Figure 8.5 shows what this could mean for the level of NHS England resource spending if funding does rise to match these higher costs. In 2021–22, NHS England resource spending was £156.1 billion in 2022–23 prices. By 2036–37, we estimate that this will reach £221.5 billion in our low scenario, £265.5 billion in our central scenario and £297.0 billion in our high scenario (all expressed in 2022–23 prices).
Perhaps the most meaningful way to express the additional resources implied for the NHS is as a percentage of national income. We estimate that in our central case, resource (day-to-day) funding for the NHS in England alone could need to increase by 2.0% of GDP by 2036–37, relative to 2021–22 (the starting point for the workforce plan). This is similar to the increase in UK health spending over the 15 years to 2008–09 (2.2% of GDP) and is equivalent to an extra £52 billion in today’s terms. To give a sense of scale, raising that amount would require increasing the standard rate of VAT from 20% to around 27% by 2036–37 or increasing all income tax rates by around 6 percentage points. Other options to fund higher NHS spending would of course be available. In our ‘low’ scenario, the increase could be an extra 0.6% of GDP (£17 billion in today’s terms); in our ‘high’ scenario, it could be 3.0% of GDP (£77 billion).
The workforce plan is an NHS England document, and our analysis has focused on England for this reason. Health is a devolved matter, but higher spending on the NHS in England would likely mean additional funding for the devolved governments via the Barnett formula. An extra £100 of health spending in England would (unless offset by cuts to other spending in England) lead to around £19 of Barnett consequentials for Scotland, Wales and Northern Ireland. Our estimates of the additional funding implied for the NHS would need to be scaled up accordingly.
8.5 Conclusion
The publication of the NHS long-term workforce plan is an important and welcome milestone for the NHS. For the first time, we have official, public estimates of how many staff the NHS thinks it will need in the medium term, and a set of targets that aims to ensure that the workforce reaches these levels.
While it is an important step to have such a detailed plan, it does not necessarily follow that the plan’s targets will be achieved – something we have seen recently with the NHS backlog recovery plan. Among many challenging objectives, the targets for productivity and retention are particularly ambitious. The plan assumes that labour productivity will increase by between 1.5% and 2% per year. That would be considerably more than estimates suggest the NHS has tended to manage historically (Figure 8.6). Failing to deliver on these targets could mean either that workforce numbers do not grow as planned or that, even if they do, a larger workforce is still unable to provide the desired quantity and quality of healthcare.
On the assumption that the plan is successfully implemented and achieved in full, it promises to deliver a dramatic expansion of the NHS workforce. We estimate that by 2036–37, almost one in two public sector workers, and around one in eleven of all workers, will be working for the NHS in England. Such an expansion will inevitably require a substantial increase in the NHS wage bill, and could well also require increases in non-staff spending as the number of patients treated increases (though this is less certain).
In our central scenario, we estimate that NHS England resource funding may have to grow by 3.6% per year in real terms (or 70% in total by 2036–37) to meet the increase in costs implied by the plan. We estimate that this could mean spending an additional 2.0% of GDP on the NHS in England alone in 2036–37, compared with 2021–22, equivalent to an extra £52 billion in today’s terms. These are substantial sums, but we note that funding growth of 3.6% per year would match the long-run average seen since the advent of the NHS. Nonetheless, against the current backdrop of sluggish growth and elevated debt interest spending, achieving this will require difficult fiscal decisions to be made. This acknowledgement should be front and centre of the next fiscal event this autumn, and the next Spending Review (due by the end of 2024).
In our view, the main risk associated with a workforce plan – particularly one that aims for such a large increase in staffing – is that other inputs will be neglected. Our ‘low’ scenario suggests that NHS funding might need only grow by 2.4% per year, well below the long-run average. But this is because we assume spending on non-staffing inputs only grows by a very low 0.6% per year in real terms. That itself could put at risk the NHS’s ability to deliver labour productivity growth of 1.5–2% per year, an assumption which the plan is based on. While the plan acknowledges the importance of other inputs, such as capital and digital infrastructure, it is vital that the NHS and the wider government ensure these inputs receive similar planning and attention. Paying for the workforce plan by squeezing capital spending would be a serious mistake.
Endnotes
Authors

Max Warner
Max joined the IFS in 2020. His work covers health and social care, public spending and public sector productivity.

More from IFS
Understand this issue


Policy analysis


Academic research