
Downloads
Download the report as a PDF
PDF | 536.83 KB
Executive summary
Tribunals are a key part of the justice system. Most tribunals resolve disputes between individuals and the state – known as ‘administrative appeals’ – in a way that is more accessible and quicker than would be possible in traditional courts. Prominent examples include disputes relating to social security benefits, immigration and asylum, and special educational needs and disability (SEND). Recently, backlogs and delays have been a growing concern in tribunals, but there has been relatively little analysis of developments across the tribunal system. In this report, we explore the current situation, including the demand placed on the tribunals (proxied by appeal volumes) and the pace at which the system resolves these cases.
Key findings
- Tribunal backlogs rose in the early 2010s, peaking at 313,000 open cases in 2013, prompting legal and procedural reforms. Following targeted reforms, backlogs fell rapidly to 140,000 in 2014. After years of relative stability, the backlogs in administrative appeals started to increase rapidly in 2021 and are at record levels in the first quarter of 2026, at nearly 330,000 open cases. These backlogs have accrued over time as the inflow of new appeals has outpaced the resolution of outstanding cases. Some jurisdictions, such as SEND and immigration and asylum, have seen particularly sharp increases in backlogs, with open caseloads now more than six times what they were five years earlier.
- The growth in administrative appeal backlogs is accompanied by increasing time between an appeal being lodged and being resolved. In early 2026, asylum and immigration appeals and social security appeals are taking on average 61 weeks and 35 weeks to resolve, up from 23 and 18 weeks respectively at the beginning of 2013.
- A significant driver of growth in demand for tribunal services, as reflected in received appeals, is the increase in underlying applications for rights or entitlements that may later give rise to appeals. For both SEND and immigration and asylum, which now receive two to four times as many appeals as they did only five years ago, more than half of the increase in appeals observed since 2021 is due to increases in initial requests, to local authorities and the Home Office respectively.
- The inflow of appeals is also strongly influenced by ‘first-instance decision-makers’, which act as filters. Their actions and governing rules can reduce the number of cases reaching the tribunals, as with many social security benefits administered by the Department for Work and Pensions (DWP). Since 2013, claimants have typically had to request Mandatory Reconsideration, an internal DWP review of the initial decision, before they can appeal to a tribunal. This additional stage, which is specific to social security rather than a general tribunal requirement, reduces the number of cases that proceed to appeal, easing pressure on tribunals. First-instance decision-makers can also increase the inflow of appeals, as with asylum, where the Home Office has recently been working through its own backlog at an increased pace, thereby creating more cases with potential for appeal.
- The number of tribunal cases disposed of per sitting day has fallen since the 2010s and remains low by historical standards. Across social security, immigration and asylum, and SEND, disposals per sitting day fell over the past decade. In the first two jurisdictions, this coarse proxy for productivity is now around half its level in the early 2010s. Since 2018–19, however, it has remained relatively flat in all three jurisdictions, with some signs of modest increases recently in social security and SEND. Taken together with the sharp rise in inflows discussed above, this means that tribunals are not disposing of cases at the rate needed to prevent backlogs from growing. While we cannot rule out that this reflects factors such as greater case complexity rather than lower productivity, disposal rates have remained at historical lows during a period of mounting pressure from incoming appeals. The stability of disposal rates since 2020 suggests that deteriorating productivity was not the main trigger behind the recent spike in backlogs.
- Further evidence that the system is struggling to process appeals comes from deteriorating case management, with increasing levels of adjournments (when proceedings need to be suspended on the day of the hearing) and postponements (when the hearing is moved to a different date altogether before starting). Adjournment rates in particular have slowly but consistently risen since 2010 in social security and in immigration and asylum, from around 10–15% to around 20–25%. High rates of adjournments and postponements suggest that tribunal time is not being converted into final resolutions as effectively as it could be, adding further pressure to the system.
- We estimate the additional capacity (either through more sitting days or higher productivity) that would have been needed to offset the rise in the backlog since 2021–22. The required increase in capacity is relatively modest for social security and SEND, at around 13% and 21% respectively, but larger in immigration and asylum, at 35%. While such increases may not have been feasible in practice, they indicate that increases in tribunal capacity could have played an important role in preventing the recent sharp rise in caseload and could be an important lever in future interventions to reduce tribunal backlogs.
1. Introduction
Tribunals are a key part of the contemporary justice system (Cane, 2009). Most tribunals resolve disputes between individuals and the state – known as ‘administrative appeals’ – and these tribunals are the focus of this report.1, 2 Tribunals typically focus on resolving these matters without unnecessary complexity and with expertise: hearings in tribunals are usually more accessible than those in traditional courts, with panel members often including experts in relevant fields (such as medicine, education or disability) alongside legally qualified judges. They are generally configured to allow individuals to represent themselves if they wish, although representation is a common feature of tribunals. At the same time, tribunals are designed to be cheaper to administer than traditional courts, making them well placed, in theory, to manage large volumes of routine disputes. As such, the tribunals system plays a central role in upholding rights and entitlements and providing accountability in administrative decision-making more broadly.
Tribunal appeals cover a wide range of subject matters, including immigration and asylum, social security benefits, tax and special educational needs. They grew on an ad hoc basis over time through legislation, but major reforms to rationalise the organisation of the overall system were introduced through the Tribunals, Courts and Enforcement Act 2007, which was preceded by an extensive review by Sir Andrew Leggatt (2001). The system is now divided into two tiers: the First-Tier Tribunal, which hears initial appeals against decisions by public bodies and accounts for the bulk of the tribunal system, and the Upper Tribunal, which mainly considers whether the First-Tier Tribunal made an error of law, rather than rehearing the case on its facts. Within these tiers, there are specialist chambers focused on specific areas. The employment tribunal – which handles workplace and labour rights disputes – is also part of the tribunals system but is functionally distinct in many respects, as it generally manages party-to-party disputes between employer and employee.
The general aims of administrative appeals being managed by tribunals are clear, yet delivering a system that meets these aspirations is a constant challenge for the administration of justice. In recent years, there have been significant reforms to tribunals, including the digitalisation of processes, the growing use of remote proceedings and a corresponding reduction in physical hearing space. More recently, however, a familiar issue appears to be returning – growing backlogs (outstanding cases) and delays. Backlogs and delays can have significant consequences for those trying to access justice, by delaying access to services or benefits to which appellants may ultimately be found to be entitled, or by discouraging some from pursuing their appeal altogether. They can also increase the cost of running the tribunal system by requiring additional administrative handling, repeated listing and further case-management activity before cases are finally resolved. In two of the areas most affected by growing backlogs – Special Educational Needs and Disabilities (SEND) and Immigration and Asylum appeals – significant reform proposals that would change how tribunals work have recently emerged from the Department for Education and the Home Office, respectively. For the former, current proposals seek to prevent cases needing to go to tribunal and, for those cases that still reach the tribunal, change the remedial powers available to the tribunal (Department for Education, 2026). For the latter, there are proposals to abolish the tribunal in its current form and return to a system of independent adjudicators (Home Office, 2026).
While delays and backlogs in other areas of the justice system, especially in the Crown Court, have commanded much attention in recent years (Domínguez, Tomlinson and Zaranko, 2025), the developing situation in the tribunals system has thus far been subject to comparatively little analysis. In this report, we explore what the publicly available data on administrative appeal volumes show about the current situation in the First-Tier Tribunal, including the demand placed on the tribunals and the pace at which appeals are being resolved by the system.
2. Trends in the tribunals caseload
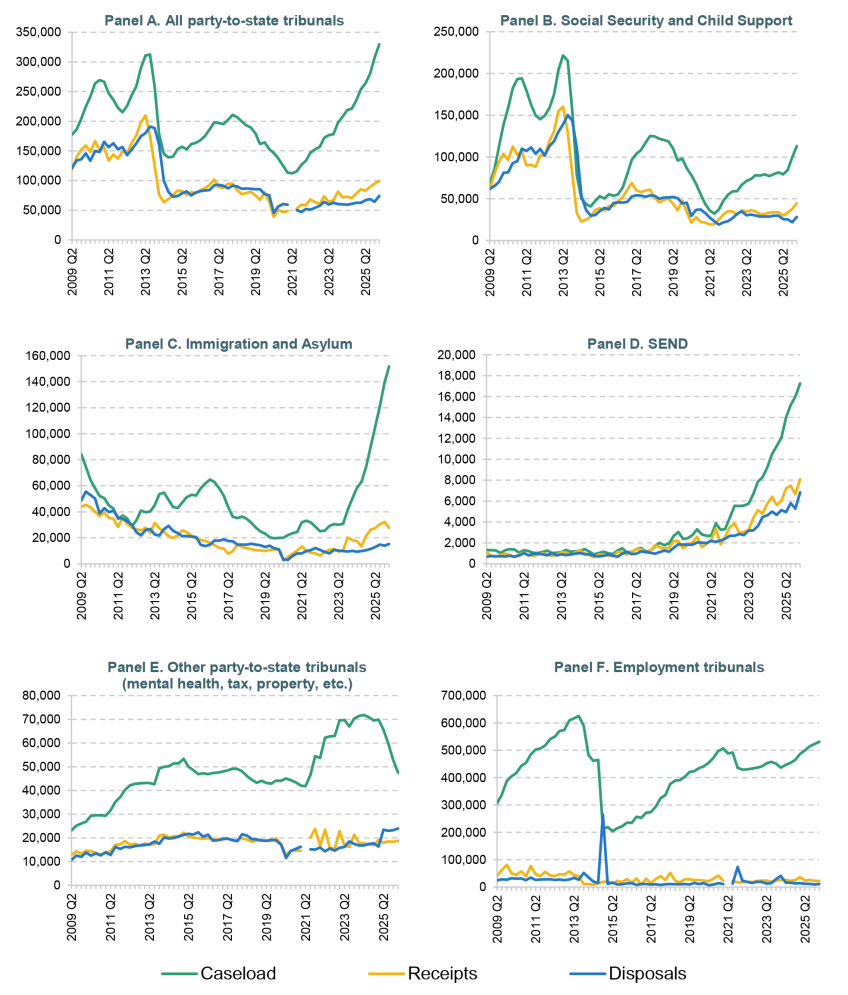
First, we consider trends in the tribunals system as a whole. Overall, Figure 1 shows a peak in tribunals outstanding caseload (backlog) in the early 2010s followed by a significant reduction in the mid and late 2010s. This was largely because of reforms to the two largest tribunals at the time – the Social Security and Child Support and the Immigration and Asylum tribunals – which either removed appeal rights or diverted cases to different dispute mechanisms (Thomas and Tomlinson, 2019).
Figure 1. Receipts, disposals and outstanding caseload (backlog) in tribunals
Note: Data on receipts and disposals in employment tribunals are missing for the second quarter of 2021 because of the migration to a new case-management system. Since receipts and disposals for party-to-state tribunals excluding employment tribunals (Panel A) are computed by subtracting employment tribunal receipts and disposals from the total, these series are also missing for the second quarter of 2021. Receipts and disposals for other party-to-state tribunals (Panel E) are also computed by subtraction, by removing receipts and disposals in SSCS, Immigration and Asylum, and SEND tribunals from the party-to-state total; they are therefore also missing for the second quarter of 2021.
Source: HM Courts and Tribunals Service tribunals quarterly data.
Since 2021, the backlog in administrative appeals has rapidly increased and has surpassed its previous record. As shown in Figure 1, the backlog is almost 330,000 at the end of the 2025–26 financial year (Panel A). These backlogs have accrued over time as the inflow of appeals (receipts) has outpaced the resolution of outstanding appeals (disposals).
These trends are not uniform across jurisdictions within the party-to-state tribunals. The Social Security and Child Support (SSCS) Tribunal, which represents the largest tribunal handling administrative appeals and deals with disputes about benefits such as personal independence payment (PIP), is slowly accruing a backlog as receipts continue to exceed disposals, even though both have remained relatively flat (Panel B). The backlog is around one-half of its 2013 peak, recorded before Mandatory Reconsideration was introduced for most Department for Work and Pensions (DWP)-administered benefits.3
By contrast, Immigration and Asylum and SEND tribunals have recently seen sharp increases in the scale of the backlogs they are managing, which have reached unprecedented levels (Panels C and D). Both jurisdictions have experienced strong growth in receipts, which were respectively 2.7 and 4.3 times as high in the first quarter of 2026 as they had been five years earlier.
The backlog in the remaining party-to-state tribunals, which are made up mainly of tax, mental health and residential property tribunals, rose sharply between 2021 and 2023 after almost a decade of stability at around 40,000–50,000 cases (Panel E). It stabilised at around 70,000 open cases between 2023 and 2025, and has recently been trending towards pre-pandemic levels.
Our analysis will focus generally on party-to-state appeals, and in particular on social security, SEND and asylum tribunals. But it is important to note that a similar trend is observable in employment tribunals, where the backlog recently surpassed 500,000 cases and is also approaching its 2013 peak (Panel F).
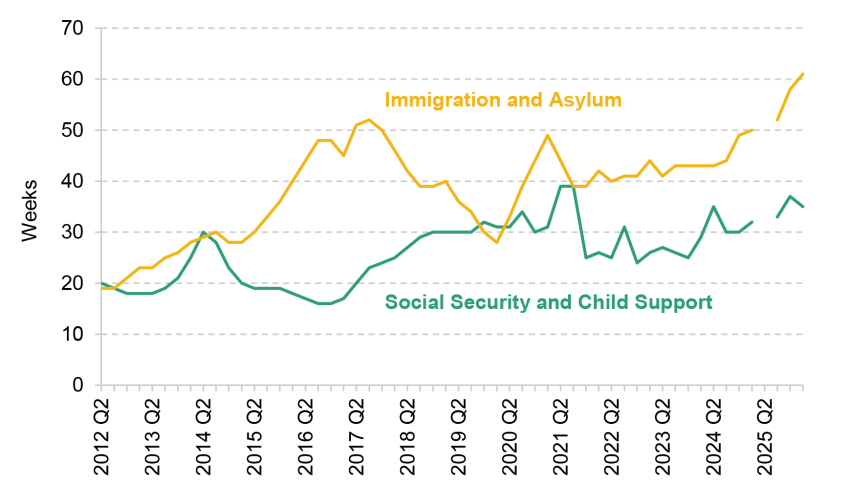
The growth in the backlogs of administrative appeals is accompanied by increasing amounts of time between an appeal being lodged and being resolved, which we define as ‘time to clearance’, calculated as the mean age of a case at time of resolution.4 These data are available only for SSCS and Immigration and Asylum and only from 2012 onward (Figure 2). For instance, Immigration and Asylum appeals in the First-Tier Tribunal are now taking on average 61 weeks to process. While the time to clearance for these has fluctuated considerably, it has typically been between 30 and 40 weeks for several years. The average time taken to resolve a case in the First-Tier Social Security and Child Support Tribunal is now 35 weeks and is also markedly higher than the 20 weeks that were typical between 2012 and 2017.
Figure 2. Average weeks from receipt to disposal of resolved cases, by jurisdiction
Note: Data on time from receipt to disposal are available only from 2012 onward and only for SSCS and Immigration and Asylum tribunals.
Source: HM Courts and Tribunals Service tribunals quarterly data.
3. Why have tribunal receipts increased?
We unpack the increasing trends in backlogs by examining their two components – receipts and disposals – separately. We begin with receipts (i.e. the number of cases being received by the system), asking why demand for tribunal services has increased so sharply in recent years. We study SEND, Immigration and Asylum, and SSCS tribunals individually, since each operates within a distinct institutional framework. Despite the substantial institutional differences between jurisdictions, the drivers of demand across these tribunals can be grouped into three broad categories:
- An increase in underlying requests for public services: namely SEND assessments, asylum claims and applications for social security benefits, with the disability benefit – personal independence payment (PIP) – being the most important.
- Shifts in first-instance decision outcomes across local authorities, the Home Office and the Department for Work and Pensions (DWP).5 These can stem directly from changes in decision-making standards or indirectly from changes in applicant mix or case complexity. Each can affect first-instance acceptance rates and ultimately change the number of cases with potential for appeal.
- Behavioural changes among service seekers, who may choose to appeal following an adverse first-instance decision. These can originate from service seekers changing their preferences/expectations/knowledge of their rights, even if their baseline potential for service is the same, or from the first-instance decision-makers rejecting individuals with a higher (or lower) propensity to appeal.
In this section, we plot the evolution of quantities related to each of these potential drivers and, where possible, explicitly quantify their relative importance in the change in receipts.6
Three overarching themes emerge from the analysis that follows. First, and perhaps unsurprisingly, tribunal workloads depend strongly on the underlying demand for public services, which the tribunals themselves cannot control. Second, first-instance decision-makers act as important filters, and their behaviour and governing rules can either reduce the inflow of cases, as in PIP, or increase it, as in immigration and asylum. Third, the main drivers of recent demand increases, by reference to the three categories above, vary by tribunal.
SEND
For SEND, the relevant quantities that can be computed from the available data, and that speak to the potential drivers of tribunal demand, are: (a) the number of requests submitted to local authorities (LAs) for an Education, Health and Care Plan (EHCP) needs assessment, the first formal step in the EHCP process, which we call ‘SEND requests’ for simplicity; (b) the refusal rate among LAs, defined as the number of first-instance refusals in a given period divided by the number of initial SEND requests in that period; and (c) the appeal rate, defined as total SEND appeals divided by the number of initial SEND requests in the same period.7, 8 We use this request-based appeal rate as our main measure of the propensity to appeal among users because SEND appeals do not only arise from refusals to assess or issue an EHCP, and many in fact concern the contents or placement specified in a plan.
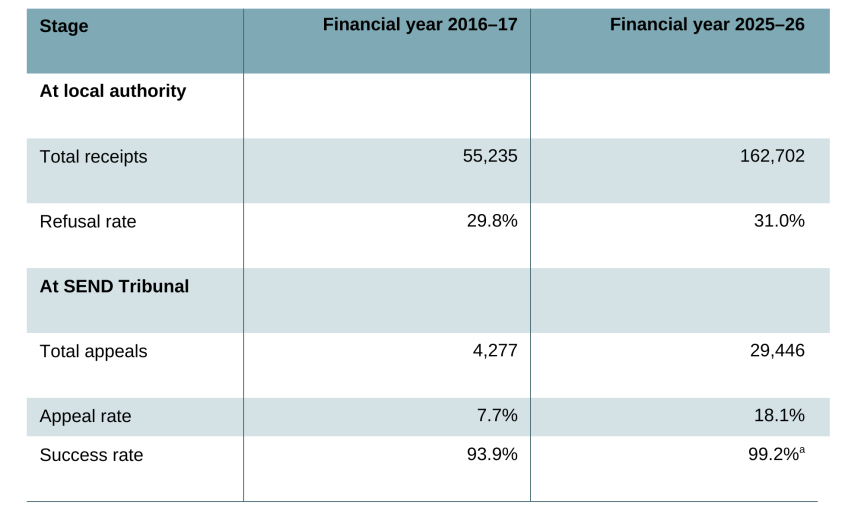
As shown in Table 1 and in more detail in Figure B1 in Appendix B, SEND requests have been rising for a decade, with growth accelerating over the past five years.9 This mechanically increases the potential volume of appeals reaching the SEND Tribunal. By contrast, the refusal rate among local authorities has remained broadly stable at around 30%. This suggests that changes in LA refusal behaviour are unlikely to have been an important driver of the rise in SEND appeals, although the refusal rate remains informative about how LAs respond to rising demand. The request-based appeal rate has more than doubled since 2016–17, from 7.7% to 18.1%, meaning that SEND appeals have become more common relative to the number of initial requests entering the LA system.
Table 1. SEND requests, refusal rate, appeal rate and success rate at appeal
a This value is for financial year 2024–25, the latest data available.
Note: Tribunals data for SEND are available at the financial year level, while the numbers of SEND requests and initial refusals from the local authorities are available at the calendar year level. We match the information on SEND for calendar year 2016 with the tribunals data for financial year 2016–17, and so on. Success rate is further only available at the academic year level. We assign the success rate observed in academic year 2016–17 to the appeals lodged in financial year 2016–17. We index everything at the financial year level.
Source: HM Courts and Tribunals Service tribunals quarterly data and DfE’s Explore Education Statistics.
Taken together, these patterns suggest that the growing volume of SEND requests, alongside a higher propensity to appeal the first-instance decision, are the main drivers of the increased pressure on SEND tribunals. A simple decomposition of the increase in appeal receipts between 2016–17 and 2025–26 suggests that around 60% of the increase is accounted for by more SEND requests being filed in the first place, and around 40% by appeals becoming more common relative to requests.10
Finally, it is also worth noting that appeal success rates in SEND tribunals have remained exceptionally high, at close to 100%, for more than a decade.11 Although this is not, strictly speaking, a direct driver of appeal receipts, it may shape service seekers’ expectations about the likely returns to appealing and therefore influence their decision.
Asylum
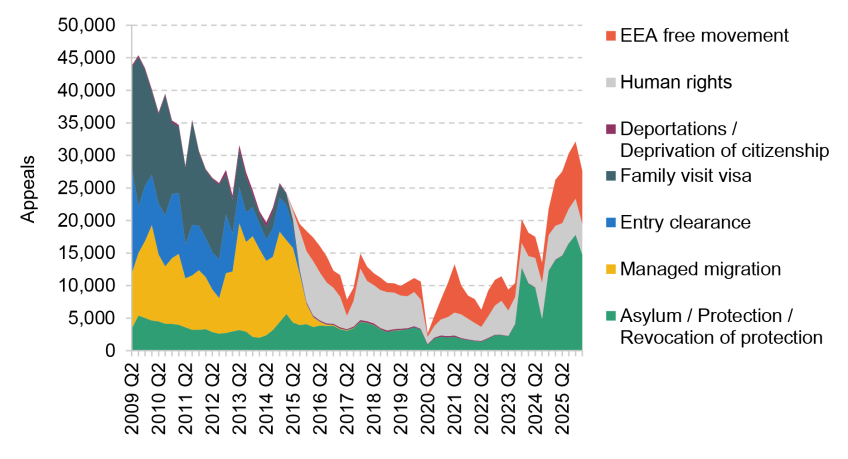
The Immigration and Asylum Tribunal does not deal exclusively with cases arising from asylum and protection claims and related refusals.12 It also hears appeals involving human rights issues in the immigration context, which may overlap with asylum claims, as well as appeals related to European Economic Area (EEA) free movement. Because the underlying drivers of human rights and EEA free movement appeals are less clearly identifiable, and because their volumes have grown more slowly than asylum and protection appeals, we focus here only on asylum and protection appeals.13
For asylum and protection appeals, we calculate proxies for the three main drivers of demand: (a) the number of asylum claims received by the Home Office; (b) the refusal rate by the Home Office; and (c) the appeal rate at the tribunal stage.14 In this setting, we define the refusal rate by the Home Office as the share of decisions that are refusals, rather than the share of claims that are refusals. Consistent with this, we include an additional measure, the decision rate, which is defined as the number of decisions taken by the Home Office in each period divided by the number of asylum claims received. We make these adjustments because changes in Home Office decision-making speed, with a slowdown starting in 2020 and a recent acceleration, have had their own impact on the inflow of asylum and protection appeals. We also report the success rate at the tribunal stage for completeness.
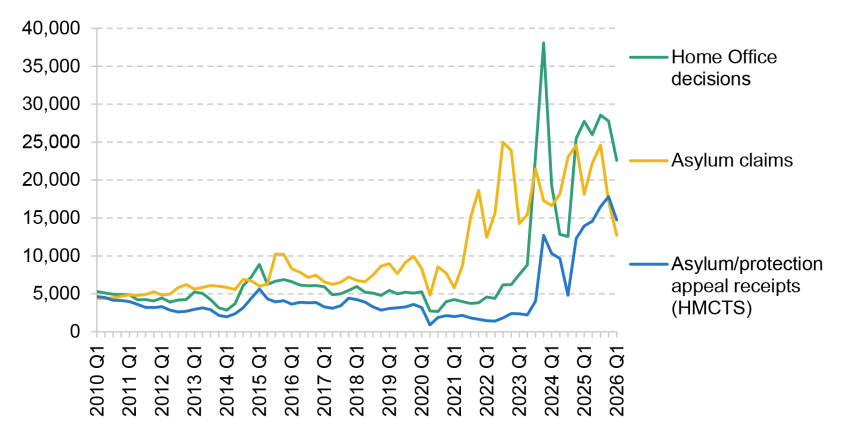
Figures 3 and 4 illustrate the evolution of these measures for asylum appeals. Figure 3 shows that as asylum claims began to rise in 2021, the Home Office was taking fewer decisions than at any point in the series. Only in 2023 did it begin to increase the volume of claims processed, and it did so at an unprecedented pace, mechanically increasing the number of claims that might lead to an appeal in a given period. The increase in overall decision-making at the Home Office in 2023 was also accompanied by an increase in the volume of claims refused.
Figure 3. Asylum claims, Home Office decisions and appeals received
Source: HM Courts and Tribunals Service tribunals quarterly data and Home Office immigration system statistics.
By contrast, Figure 4 shows that the appeal rate in tribunals has remained relatively stable, except for a spike in 2021 and 2022. That spike coincided with the slump in decision-making and refusals, which meant that the unusually high appeal rate did not translate into a massive inflow of receipts to the tribunal, as previously shown in Panel C of Figure 1.15
Figure 4. Home Office decision rate and refusal rate, appeal rate and success rate
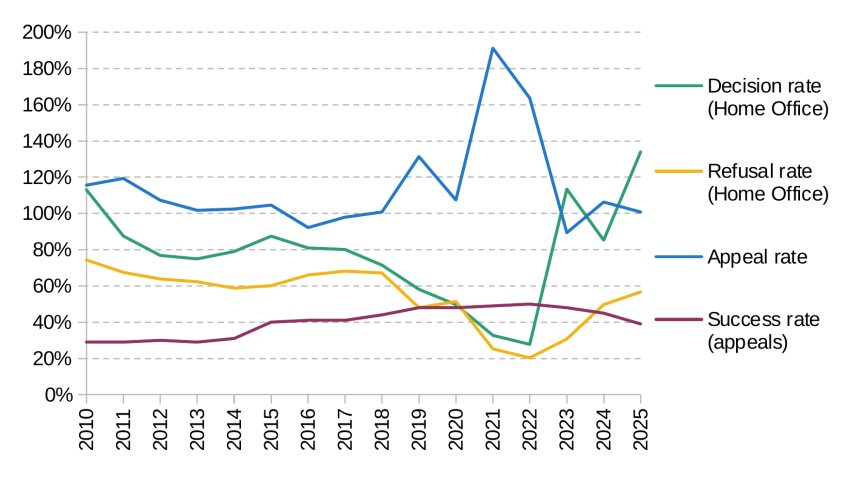
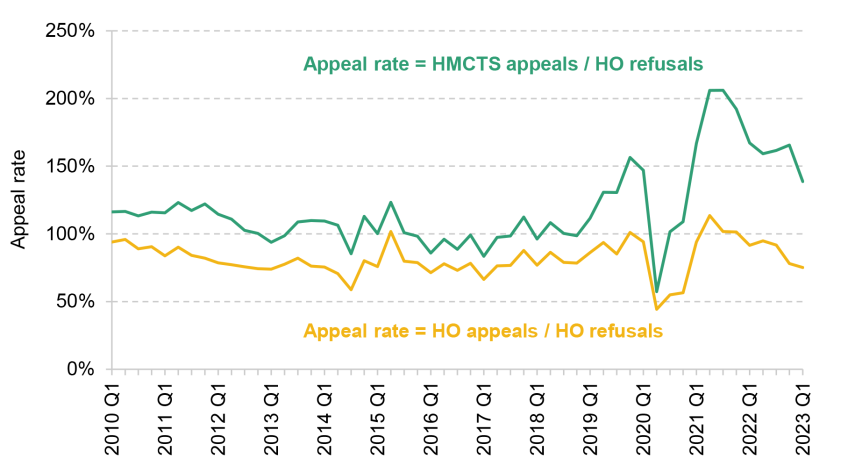
Note: The appeal rate can exceed 100% because the numerator and denominator are not measured on the same basis. The denominator uses Home Office refusals of asylum claims for main applicants, while the numerator uses HMCTS asylum/protection receipts, which cover a broader set of cases and may include some dependants, human rights cases, and extension and revocation-of-protection appeals. We therefore interpret this as a proxy for asylum/protection appeal pressure on tribunals, not as a clean person-level appeal rate. The decision rate can exceed 100% when the Home Office makes more decisions than there are new asylum claims, including by drawing on its backlog. This is possible because the rate compares contemporaneous aggregate claims and decisions, rather than tracking cohorts over time.
Source: HM Courts and Tribunals Service tribunals quarterly data and Home Office immigration system statistics.
Overall, the recent increase in receipts in the Immigration and Asylum Tribunal appears to have been driven mainly by a higher volume of asylum claims, and by the Home Office working through the backlog created by changing the pace of its own decision-making. This suggests that the inflow of appeals should slow over time as the Home Office clears its backlog, even if the underlying number of asylum claims remains unchanged. Our decomposition exercise in Appendix A suggests that, between 2017 and 2025, the increase in asylum appeals was driven by two factors pushing tribunal receipts up: the rise in asylum claims made to the Home Office and the acceleration in Home Office decision-making. Among these positive contributors, asylum claims account for roughly two-thirds of the upward pressure on appeals, while faster decision-making accounts for the remaining third.16 By contrast, the Home Office refusal rate is lower than in the past: we estimate that, had the refusal rate remained constant, growth in appeals would have been around 10.7% larger over this period. The appeal rate is very similar in the two periods, although slightly higher in 2025, and therefore has only a small positive effect on the volume of appeals (+5.6%), which is second-order compared with the rise in asylum claims and the increase in Home Office decision-making. Finally, the success rate at appeal has increased over time but has been relatively stable since 2019 at between 45% and 50%, though it dipped to 40% in 2025.
Social security
The benefits landscape has changed substantially over the last decade, and this has also affected the workload of the tribunals system. The benefit that accounts for around two-thirds of appeals in Social Security and Child Support (SSCS) tribunals, and for a significant share of party-to-state tribunal work more broadly, is personal independence payment (PIP, a disability benefit), which is the focus of this section. Compared with SEND and asylum, the SSCS backlog, with PIP as its main component, has not grown as quickly in percentage terms and the inflow of appeals into tribunals has been more moderate, despite a recent spike in SSCS receipts and backlogs (Panel B of Figure 1). We therefore ask what has protected the social security tribunal from the much larger volume of potential appeals entering the DWP system.
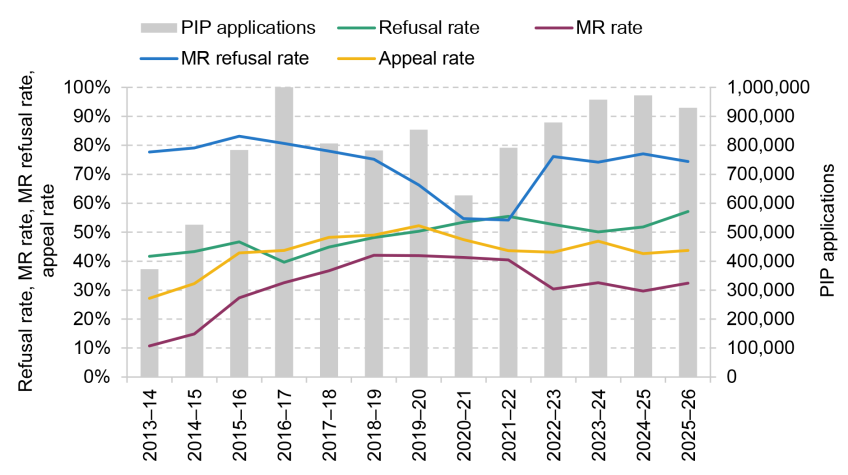
A crucial institutional feature that distinguishes social security benefits from other party-to-state jurisdictions is the presence of Mandatory Reconsideration (MR). MR is an additional review stage in which a different DWP official reassesses the initial decision, and applicants must request it before they are able to appeal to the tribunal. For PIP, therefore, there is an additional substantive review stage between the initial claim and a potential appeal. Moreover, MR is not limited to applicants who are refused PIP: some claimants who receive an award may request MR to seek a higher level of benefit. For this reason, we do not impose a mechanically exact decomposition. Instead, we carry out a descriptive accounting exercise that tracks the main quantities linking initial PIP claims to PIP appeals, including: (a) the number of PIP applications received by DWP;17 (b) the initial PIP refusal rate, computed as the ratio of all disallowances to all clearances excluding withdrawals;18 (c) the MR registration rate, computed relative to non-withdrawn initial clearances to allow both refused and awarded claimants to request MR;19 (d) the refusal rate at the MR stage, computed among completed MRs and excluding withdrawn or cancelled cases; and (e) the appeal rate, computed as the number of PIP appeals divided by the number of MR decisions that did not change the award. We also report the success rate at the tribunal stage for completeness.
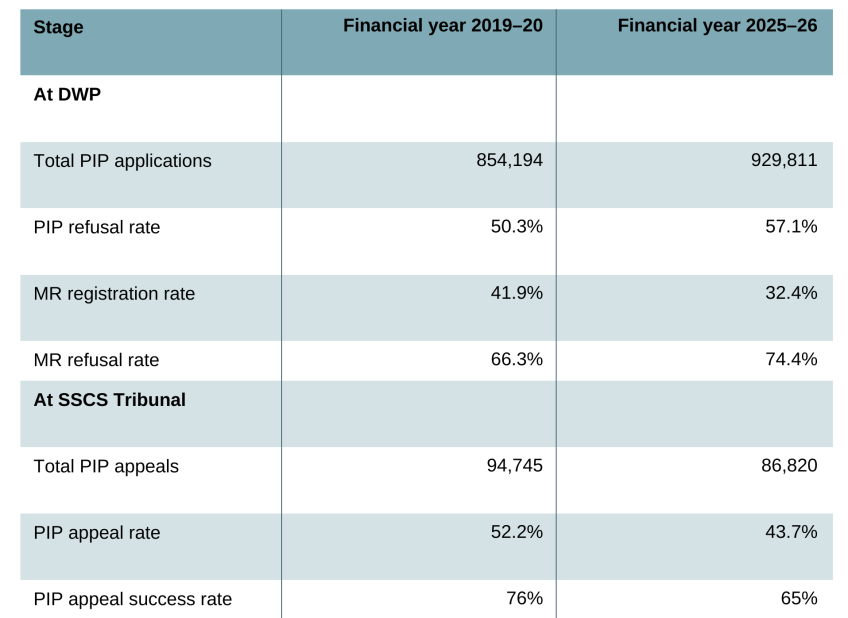
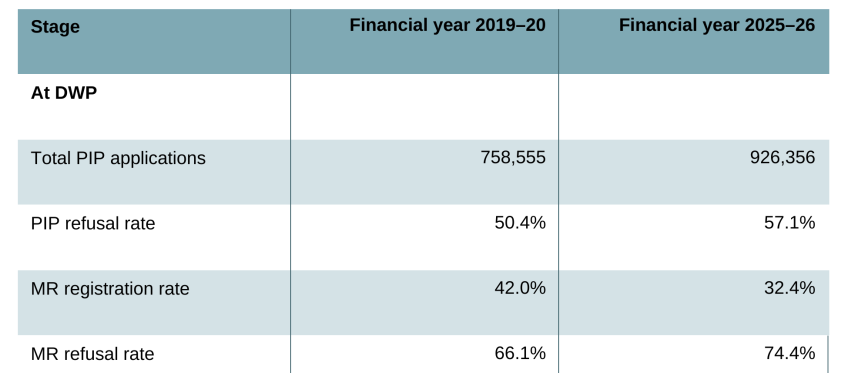
Table 2 summarises these main factors in financial years 2019–20 and 2025–26 (Figure B4 in Appendix B shows the full time series).20, 21 The first pattern worth noting is that initial requests for PIP received by DWP have increased substantially over the last six years (+9%), while the number of appeals has decreased from around 95,000 to around 87,000 (–8%). The initial refusal rate from DWP has been relatively stable at around 50% since 2019–20 with a moderate increase in 2025–26, at least when measured as described above. However, applicants are now significantly less likely to request MR than they were in 2019, with the share of initially refused applicants who request reconsideration falling from slightly more than 40% to slightly more than 30%. Among the applications that reached MR, 74% were refused in 2025–26, compared with 66% in 2019–20. Among those who were refused at Mandatory Reconsideration, the share who went on to appeal also fell, from 52% to 44%. This is not a marginal group: applicants who are refused at reconsideration and do not go on to appeal to the tribunal account for around 30–40% of all initial MR applications.22, 23 Finally, among those who do appeal, the chances of obtaining a favourable outcome at tribunal have also decreased slightly, from 76% to 65% over the last six financial years.
Table 2. Personal independence payment (PIP) applications and refusal rate, Mandatory Reconsideration (MR) rate, refusal rate at MR, appeal rate and success rate at appeal
Source: HM Courts and Tribunals Service tribunals quarterly data and DWP’s Stat-Xplore.
Taken together, these trends suggest that Mandatory Reconsideration partly shielded the social security tribunal from a much larger inflow of cases. It does so in two main ways: fewer initially refused applicants now request reconsideration, and many applicants who are refused at reconsideration do not go on to appeal. By contrast, MR does not appear to have reduced tribunal pressure by resolving more disputes before appeal. If anything, the opposite is true: both the refusal rate after the initial assessment by DWP and the refusal rate at MR have increased, leaving a larger share of applicants with a potential route to tribunal.24 Overall, however, the presence of MR still substantially reduces the workload of the social security tribunal. As an illustrative upper-bound counterfactual, if all applicants who requested MR had instead been able to appeal directly to the tribunal after the initial refusal, tribunal receipts would have been at least three times as high in each year.25
4. Why have disposals not kept up with receipts?
We now turn to the other component of the backlog: disposals (i.e. resolution of cases). We ask whether disposals fell short of keeping up with receipts because of declining productivity in the tribunals system. We again focus on SEND, Immigration and Asylum, and SSCS tribunals, which are the most salient in the public debate.26
We examine productivity using a simple measure of how many cases are disposed of (i.e. the output) per sitting day of the tribunal (i.e. the unit used to measure judicial resource, or input). This is a not-ideal, nuanced measure but gives us some insight into how productive tribunals are in converting judicial resource into resolved cases.27 HM Courts and Tribunals Service clarifies that sitting days are recorded differently across tribunals (Ministry of Justice, 2025). As a result, trends in disposals per sitting day are not directly comparable across jurisdictions and should be interpreted primarily within jurisdictions over time.
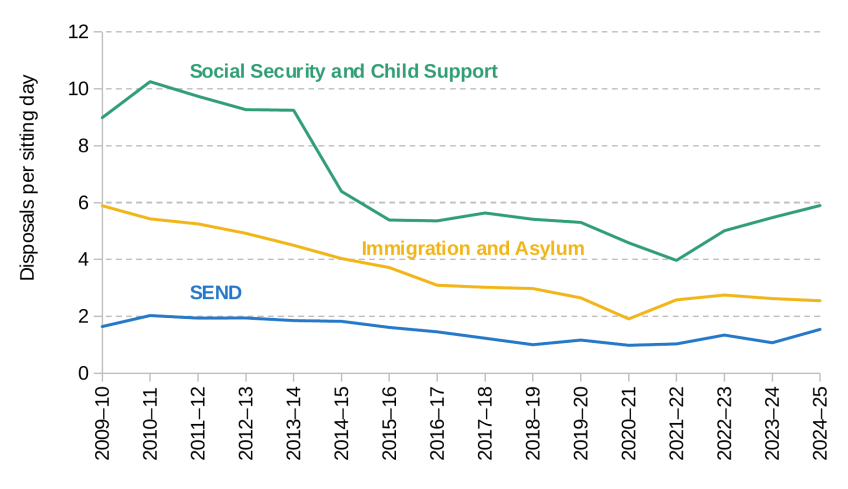
Using this measure, Figure 5 shows a long-term decline in disposals per sitting day across all three jurisdictions.28 Since around 2017–18, however, productivity has been relatively flat, aside from temporary drops during the COVID period in SSCS and in Immigration and Asylum. There are also some signs of modest increases in recent years in SSCS and SEND. One possible explanation for the longer-term decline is that the mix of cases reaching tribunals has changed. In Immigration and Asylum, reforms in the mid 2010s removed some appeal rights, leaving a greater concentration of cases involving asylum and human rights, which are arguably more complex. In SSCS, the introduction of Mandatory Reconsideration may have had a similar filtering effect, with weaker cases resolved or dropped before reaching the tribunal. This means that lower disposals per sitting day may partly reflect changes in case complexity, which we cannot observe, rather than a pure fall in productivity. Nevertheless, the ratio of disposals to sitting days has remained relatively stable in recent years, even as tribunal demand has accelerated after the COVID-19 pandemic and continues to rise.29
Figure 5. Disposals per sitting day by jurisdiction
Source: HM Courts and Tribunals Service tribunals quarterly data.
Another way to characterise tribunal productivity is to look at efficient case-handling. Throughout the tribunal process, an appeal may be adjourned or postponed. A postponement is where a case is removed from the scheduled hearing list before the hearing begins. Parties to an appeal can apply to the tribunal to have the hearing postponed but it is the tribunal’s decision as to whether that can be granted. The tribunal can also postpone a case on its own initiative. An adjournment is where, on the day of the hearing, the panel decides that the proceedings cannot be finalised and has to defer making a final decision to another date (e.g. because further evidence is required). Adjournments are particularly disruptive because incomplete proceedings do not free up time that can be reallocated to other cases, unlike postponements. HMCTS points out that listing practices differ across tribunals and hence postponement rates are not directly comparable across tribunals (Ministry of Justice, 2025).
Figure 6 shows an upward trend in the share of adjournments in SSCS and immigration and asylum tribunals, closely mirroring the evolution of the disposals-to-sitting-days ratio in these chambers.30 In the financial year 2024–25, around one-in-five hearings in the Social Security and Child Support Tribunal, and one-in-four in the Immigration and Asylum Tribunal, were adjourned before reaching a resolution. SEND tribunals have a lower adjournment rate, but face significant difficulties in scheduling, with roughly 70% of hearings being postponed to a later date (Figure 7). By contrast, postponements are relatively less common in SSCS and Immigration and Asylum tribunals. In SEND tribunals, postponements are mechanically more common because of the tribunal’s scheduling process. Hearings are listed when an appeal is registered, before parties’ availability is confirmed, so cases may be postponed if parties cannot attend the original date. Other tribunals generally list hearings only once a date has been agreed.
Figure 6. Percentage of adjourned hearings by jurisdiction
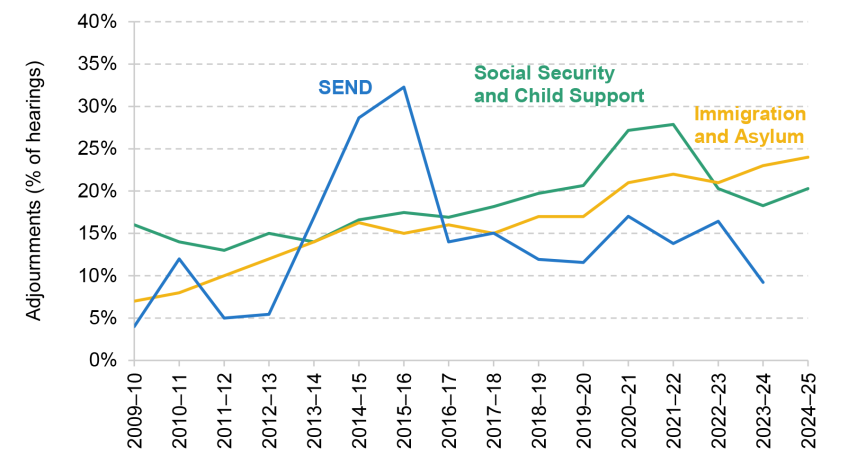
Note: Adjournment rates for SEND are not available for 2024–25 due to a methodological review by HM Courts and Tribunals Service that was still under way at the time of writing.
Source: HM Courts and Tribunals Service tribunals quarterly data.
Figure 7. Percentage of postponed hearings by jurisdiction
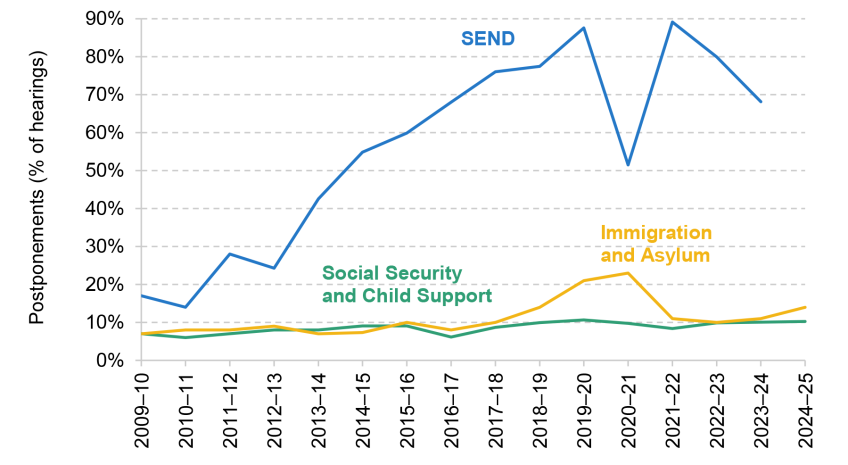
Note: Postponement rates for SEND are not available for 2024–25 due to a methodological review by HM Courts and Tribunals Service that was still under way at the time of writing.
Source: HM Courts and Tribunals Service tribunals quarterly data.
Such trends in adjournments and postponements could be due to factors such as deteriorating case management by the tribunals, a decrease in compliance with the tribunals’ requirements among users and respondent authorities (e.g. failing to provide evidence in time), or a change in case complexity. Existing data and research do not allow the causes of these postponements and adjournments to be disentangled. Regardless of why, adjournment and postponement rates remain well above the levels observed in the early 2010s. However, they do not display a clear, common pattern of deterioration across tribunals in recent years.
The overarching pattern that can be discerned from these trends is that the recent spike in backlogs was not triggered by decreasing productivity in tribunals. Although higher disposal rates would clearly have helped to keep the caseload down, the sharp rise in backlogs over the last four to five years did not coincide with a fall in productivity, at least as measured by the indicators presented here. Unlike the Crown Court (Domínguez, Tomlinson and Zaranko, 2025), the tribunals’ increasing backlog seems to be driven mostly by rising inflows, with a surge in incoming cases placing strain on a system that lacked sufficient capacity to process them efficiently.
However, this does not mean that tribunals’ resources and functioning cannot be part of a possible solution. Although we cannot predict the amount of additional spending needed to reduce the caseload from its current level, we can gauge the importance of resources for tribunals through counterfactual scenarios in which the backlogs remained at the levels observed at the end of financial year 2020–21. To keep caseloads constant over this period, tribunals would have needed enough disposals to offset all receipts, implying a higher number of disposals than actually took place. We then ask what increase in the number of sitting days, or disposals per sitting day, would have been required to generate this additional disposal volume in each tribunal. More specifically, we estimate:
- how many sitting days would have been required to keep the backlog at its 2020–21 level, given the average productivity levels observed between financial years 2021–22 and 2024–25;
- what average productivity levels would have been required to keep the backlog at its 2020–21 level, given the total number of sitting days provided between financial years 2020–21 and 2024–25.
The first quantity shows how the required additional output (disposals) could have been produced by increasing the main input (sitting days) at a given level of productivity, measured by disposals per sitting day. Conversely, the second quantity shows what improvement in productivity would have been needed to produce the same output with input held fixed.
As reported in Table 3, much of the increase in backlog over the last few years could have been offset through moderate increases in tribunal capacity: around 13% in SSCS, 21% in SEND and 35% in the immigration and asylum chamber. This could have taken the form of roughly 10,000 additional sitting days over the four-year period in both SSCS and SEND, and around 20,000 in Immigration and Asylum, equivalent to about 2,500 additional sitting days per year in the first two tribunals and 5,000 per year in the last. Equally, the same result could have been achieved through higher productivity, equivalent to an increase in average disposals per sitting day of 0.6, 0.3 and 0.9 cases in SSCS, SEND and Immigration and Asylum, respectively.
Table 3. Counterfactual capacity required to avoid the increase in backlog seen between 2021–22 and 2024–25
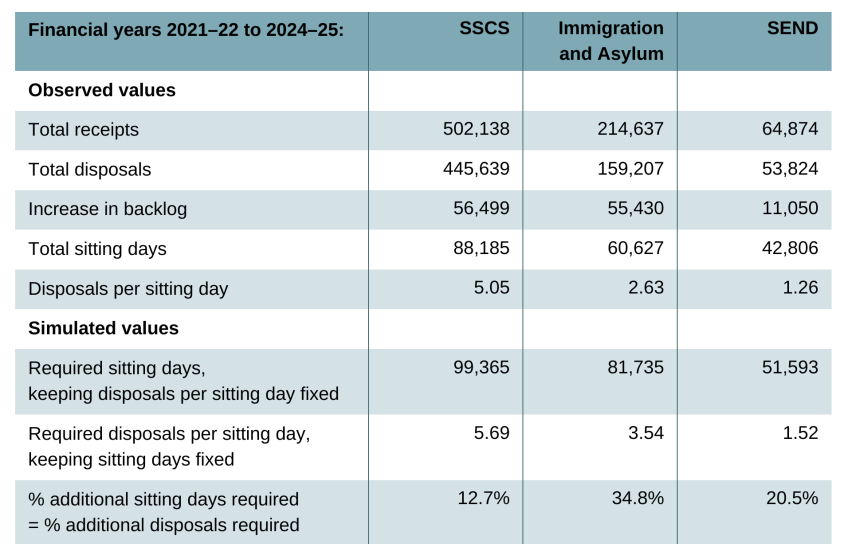
Note: See Appendix A for details of the methodology.
Source: HM Courts and Tribunals Service tribunals quarterly data.
The immigration and asylum chamber experienced the sharpest rise in caseload and would therefore have required the largest increase in capacity to offset the growth in inflows. Even so, the implied increase is equivalent to about one additional disposed case per sitting day. Given that between one-in-five and one-in-four immigration and asylum hearings were adjourned during these four years, there may nevertheless be some scope for improvement through investments that strengthen case management and, ultimately, overall productivity.31
It is important to acknowledge that these counterfactual changes may not have been feasible in practice, given the level of funding provided: more sitting days require additional staff, judicial capacity and infrastructure, while raising disposals per sitting day through technology or organisational reform would also take time. Even so, the analysis shows that, in an ideal scenario, the justice system could have used either margin to prevent, or at least mitigate, the sharp rise in the open caseload seen in the past few years.
5. Conclusion
Using publicly available data on administrative appeals in the tribunals system, we have examined how and why some tribunals are currently experiencing significant demand rises, which are causing increased backlogs and delays. We have shown how productivity issues are less relevant to the causes of the present issues with these tribunals than sheer demand on the system. We have also explained underlying drivers of demand, showing they vary across the tribunals concerned. Ultimately, the tribunal system is accumulating a growing backlog due to a combination of unprecedented demand for certain services, especially asylum and special educational needs and disabilities (SEND), and behavioural changes among either applicants or first-level decision-makers.
Policy responses to the present backlog – which has surpassed its 2013 peak – can essentially fall into two broad categories. First, they can reduce the number of appeals entering the tribunal system. This is desirable if it reflects better decisions being made earlier in the process, so that people receive the benefits, services or status they may be entitled to without needing to go to tribunal. But it would raise greater concerns if it were achieved by narrowing appeal rights or adding procedural barriers that make it harder for people to challenge government decisions, since this may prevent some meritorious claims from being reviewed. Second, policymakers could increase the capacity of tribunals to resolve cases. This might involve additional funding to increase the number of sitting days, or productivity improvements, perhaps through better case management. Such reforms may require resources that are difficult to mobilise or operational changes that take time to implement, but they are less likely to restrict access to justice. While we offer no evaluation of any of these proposals here, we note that all of them could affect the quality of justice individuals are afforded in respect of their disputes with administration.
Finally, it is also important that long-term, strategic responses are considered rather than interventions to manage the present challenges, not least because demand shocks have proven to be a relatively common challenge to tribunals administration. The reforms introduced by the 2007 Tribunals, Courts and Enforcement Act, and the Leggatt Review which preceded it, are now two decades old and it may be timely to take stock and reflect. Any such reflection should consider how effective resilience to increases in caseloads can best be built into tribunal operations without compromising the delivery and quality of justice.
Appendix A. Methodology
Receipts decomposition for SEND and asylum
We can decompose the increase in appeal receipts into the main drivers outlined in the main text by writing the total number of appeals at time , , as
where is the number of initial requests for a given service, is the refusal rate and is the appeal propensity conditional on refusal. With being the number of initial refusals (appealable adverse decisions) by the first-instance decision-maker, and .
Taking logs and differencing over time, which approximates the percentage change in each quantity, and then dividing by the log change in appeal receipts allows us to decompose the overall increase in appeals into three components: growth in the volume of requests, an increase in the likelihood of refusal, and a higher propensity to appeal following a refusal. More precisely, the decomposition is
Positive terms indicate that the respective quantities contribute positively to the increase in appeal receipts. The opposite is true for negative quantities.
Due to differences in institutional framework and data availability across jurisdictions, we adjust this general methodology where needed. For SEND, users may appeal even after being awarded an Education, Health and Care Plan, and they often do. It is therefore more appropriate to define the appeal rate as the ratio between appeals and the total number of SEND requests. This means removing the refusal rate from the decomposition so that the mechanical relationship between the quantities still holds. This does not affect the substantive interpretation, since the refusal rate has remained broadly flat over the period under analysis. Ultimately, SEND appeal receipts are defined as , with . Replacing each quantity with the values for financial years 2016–17 and 2025–26 and multiplying everything by 100 so that each term is expressed in percentage terms,
This means that the increase in appeal receipts, which is normalised to 100%, is driven 56% by an increase in SEND requests () and 44% by an increase in the appeal rate ().
For asylum, we implement a similar decomposition but also include the Home Office decision rate in order to capture the slowdown and subsequent acceleration in decision-making that has contributed to the recent increase in appeal receipts. Formally, this corresponds to writing appeal receipts in the Immigration and Asylum Tribunal as
where is the ratio between decisions taken by the Home Office at a given time and the number of asylum claims submitted in that period.
By taking logs and differences between time periods, and dividing by the log change in appeal receipts, we obtain the share of the increase in appeal receipts that is attributable to each component, now including the change in the decision rate as well.
Replacing each quantity with the values for calendar years 2016 and 2025 and multiplying everything by 100 so that each term is expressed in percentage terms,
Of the three factors that increased appeal receipts, the rise in asylum claims ( accounts for around 62.4% of the combined positive effect, the change in the decision rate ( accounts for 32.0% of the positive effect, and the small increase in the appeal rate () over this period accounts for the remaining 5.6%. Because the change in the appeal rate contributed only a small part of the overall increase, the rise in asylum appeals can be approximated as being driven roughly two-thirds by higher asylum claims and one-third by more Home Office decisions. The refusal rate (), on the other hand, decreased between the two periods. Had it remained constant, the increase in appeal receipts would have been 10.7% larger.
Simulation of counterfactual capacity
To prevent the caseload from rising over the period, the tribunal system would have needed to dispose of all cases received during that time. This implies a counterfactual cumulative number of disposals equal to the total number of appeals received over the same period:
where is the counterfactual total number of disposals over the period and is the observed total number of appeals received over the period.
We use the identity linking disposals in a given period to sitting days and productivity, where productivity is defined as disposals per sitting day:
where denotes sitting days and denotes disposals per sitting day. This allows us to express the required counterfactual increase in capacity on either margin. Holding fixed the observed aggregate disposal rate per sitting day over the period, , the required total number of sitting days is
Instead holding fixed the observed total number of sitting days over the period, , the required average disposal rate per sitting day is
These two quantities are equivalent because they are simply two ways of generating the same required number of disposals. If actual total disposals are given by , then
So the percentage gap between counterfactual and observed quantities is identical whether expressed in terms of sitting days or disposals per sitting day.
Appendix B. Additional figures and table
Figure B1. SEND requests, refusal rate, appeal rate and success rate at appeal
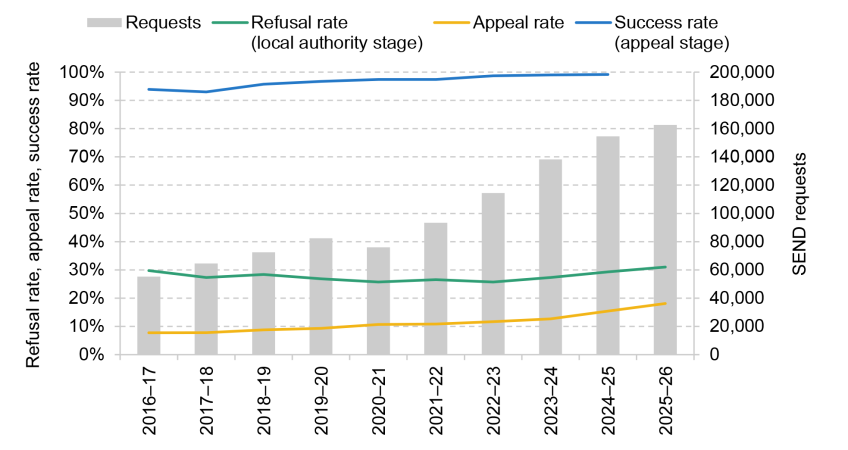
Source: HM Courts and Tribunals Service tribunals quarterly data and DfE’s Explore Education Statistics.
Figure B2. Composition of Immigration and Asylum receipts
Source: HM Courts and Tribunals Service tribunals quarterly data.
Figure B3. Comparing asylum appeal rates across sources
Source: HM Courts and Tribunals Service (HMCTS) tribunals quarterly data and Home Office (HO) immigration system statistics.
Figure B4. PIP applications and refusal rate, Mandatory Reconsideration (MR) rate, refusal rate at MR and appeal rate
Source: HM Courts and Tribunals Service tribunals quarterly data and DWP’s Stat-Xplore.
Table B1. PIP applications, Mandatory Reconsideration (MR) rate and refusal rates, for England and Wales only
Source: DWP’s Stat-Xplore.
Figure B5. Sitting days by jurisdiction
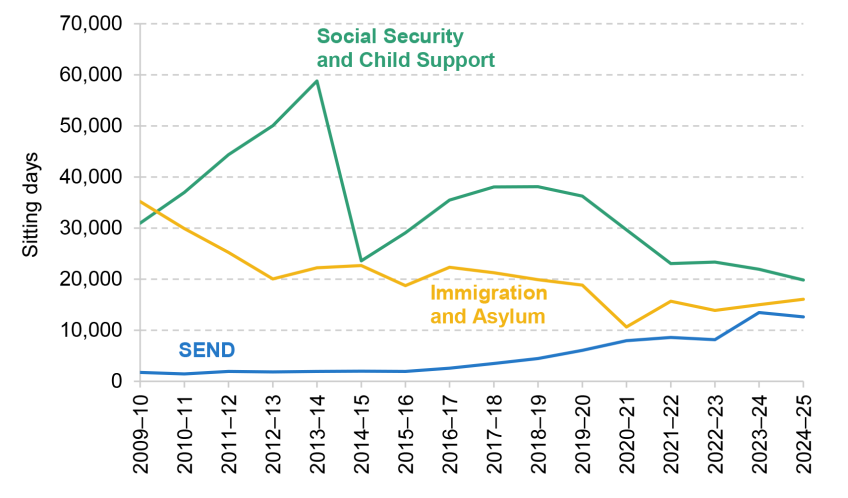
Source: HM Courts and Tribunals Service tribunals quarterly data.
Figure B6. Decisions made by the tribunal per sitting day, by jurisdiction
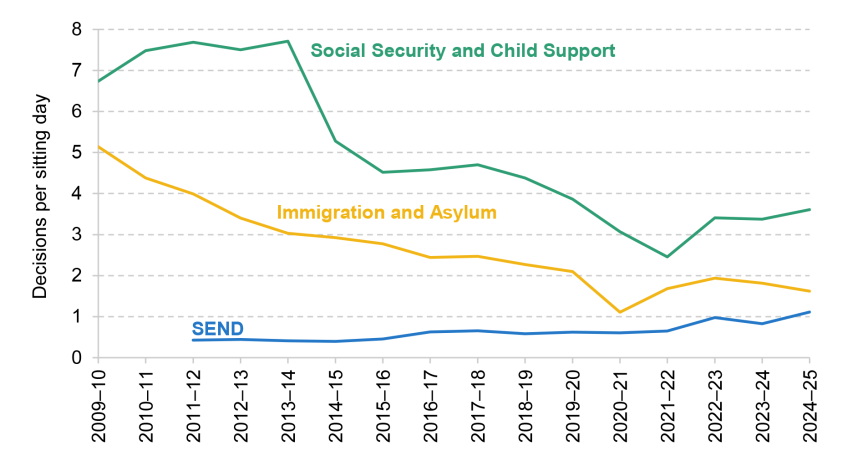
Source: HM Courts and Tribunals Service tribunals quarterly data.
References
Cane, P., 2009. Administrative Tribunals and Adjudication. Hart Publishing.
Department for Education, 2026. SEND reform: putting children and young people first. https://www.gov.uk/government/consultations/send-reform-putting-children-and-young-people-first/send-reform-putting-children-and-young-people-first-html-version.
Domínguez, M., Tomlinson, J. and Zaranko, B., 2025. Productivity in the Crown Court. IFS report, https://ifs.org.uk/publications/productivity-crown-court.
Home Office, 2026. The new Independent Appeals Body: call for evidence. https://www.gov.uk/government/calls-for-evidence/asylum-new-independent-appeals-body/the-new-independent-appeals-body-call-for-evidence.
Latimer, E., Sibieta, L. and Snape, D., 2025. Support for children with disabilities and special educational needs. IFS report, https://ifs.org.uk/publications/support-children-disabilities-and-special-educational-needs.
Leggatt, A., 2001. Tribunals for Users: One System, One Service. Report of the Review of Tribunals by Sir Andrew Leggatt, https://webarchive.nationalarchives.gov.uk/ukgwa/+/http://www.tribunals-review.org.uk/leggatthtm/leg-00.htm.
Ministry of Justice, 2025. Tribunal Statistics Quarterly: January to March 2025. https://www.gov.uk/government/statistics/tribunals-statistics-quarterly-january-to-march-2025/tribunal-statistics-quarterly-january-to-march-2025.
Thomas, R. and Tomlinson, J., 2019. A different tale of judicial power: administrative review as a problematic response to the judicialisation of tribunals. Public Law, 537–62.
Data
Ministry of Justice, 2026. Tribunals statistics quarterly: January to March 2026. https://www.gov.uk/government/statistics/tribunals-statistics-quarterly-january-to-march-2026.
Home Office, 2026. Asylum claims and initial decisions detailed datasets, year ending March 2026. Available at https://www.gov.uk/government/statistical-data-sets/immigration-system-statistics-data-tables.
Department for Education, 2025. Explore education statistics. https://explore-education-statistics.service.gov.uk/.
Department for Work and Pensions, 2026. Stat-Xplore. Available at https://stat-xplore.dwp.gov.uk/webapi/jsf/login.xhtml.
Acknowledgements
The authors gratefully acknowledge the support of the ESRC Centre for the Microeconomic Analysis of Public Policy (ES/T014334/1) and of the Nuffield Foundation (SFS/FR-000024397). Ben Zaranko was a central part of the early development of this research and the authors express their gratitude to him. They are also grateful to Jonathan Cribb, Magdalena Domínguez, Eduin Latimer and Max Warner for providing helpful feedback and comments. This project has been funded by the Nuffield Foundation, but the views expressed are those of the authors and not necessarily the Foundation. Visit nuffieldfoundation.org. Any errors are the authors’ own.
Endnotes
Authors

Luca Rizzotti
Luca joined IFS in 2025 as a Research Economist and works in the Justice sector. He received his PhD in economics from Brown University in May 2025.

Joe Tomlinson
Joe is Professor of Administrative Law at the Dickson Poon School of Law, King's College London.
More from IFS
Understand this issue


Policy analysis


Academic research


