
Downloads

Download the report as a PDF
PDF | 14.54 MB
The economic backdrop to this Budget is more difficult than was expected in the spring. The UK economy faces a number of headwinds, and the near-term outlook will be dominated by developments in the Middle East, which will drive a squeeze in the spending power of households.
Key findings
- The Middle East conflict has replaced the hoped-for soft landing with a renewed cost-of-living shock. Oil has risen from around $60 a barrel at the turn of the year to about $100, while UK wholesale gas prices have more than doubled from roughly 70p to around 185p per therm. These increases will make the UK poorer by raising the cost of imported energy, squeezing household spending power and increasing costs for businesses and the public sector.
- Inflation is set to remain above target through 2027, but we do not expect it to become entrenched in our baseline. We expect CPI inflation to average 3.1% in 2026 and 3.0% in 2027, before returning to 2% in 2028. Much of the near-term rise comes directly from energy, including an anticipated substantial increase in the Ofgem price cap in January. So far, broader price pressures, wage responses and longer-term inflation expectations remain relatively contained. In a scenario where energy prices stay at current levels through 2027, inflation would stay above 3% until the second quarter of 2028.
- The Bank of England faces a difficult trade-off, but we expect a smaller rate rise than market prices currently imply. Bank Rate is already restrictive at 3.75%. We expect two quarter-point increases, taking it to 4.25% by February, before rates gradually settle at 3.25% in the medium term. Markets instead imply a rise to around 4.75%. In our view, a sharper tightening would do little to prevent the imminent energy-driven inflation peak but would weaken growth and employment. In a high energy price scenario, we expect Bank Rate rises to as high as 4.75% next year.
- Growth has been resilient in 2026, but households and the labour market are likely to feel the strain as we move into next year. We forecast real GDP growth of 1.4% in 2026, slowing to 1.2% in 2027 as higher prices and interest rates bite; by the end of 2027, real GDP is around 0.8% lower than it would have been without the conflict. Real earnings fall in both 2026 and 2027, employment is broadly flat next year and unemployment rises to 5.7%. A key judgement for the Office for Budget Responsibility will be on how nominal earnings will respond to the energy price shock, with our baseline predicated on average annual nominal earnings growth of 2.5–3% over the next five years.
- Both fiscal and monetary policy are likely to weigh on demand. Existing spending plans imply a prolonged fiscal consolidation, while higher inflation reduces the real value of cash departmental budgets. Higher nominal GDP may lift tax receipts, but elevated interest rates and gilt yields increase government borrowing costs. The challenge is to support growth and confidence without unsettling a bond market already wary of additional borrowing.
- Investment and productivity improvements offer a route to stronger medium-term growth, but the outcome is highly uncertain. Recent strength in business investment, particularly in ICT and AI-related activity, is encouraging. In an upside scenario combining a sustained AI investment boom with wider productivity gains, real GDP could be 2.5% higher than in our baseline by the end of 2031. But if investment raises demand without broad productivity benefits, it would generate more inflation and higher interest rates, with a smaller lasting benefit to growth.
1.1 Introduction
At the time of the last Green Budget, the UK economy looked on the verge of turning a corner, having navigated a narrow path between risks. There were signs of private sector demand picking up and taking the baton from a public sector that was consolidating. Inflation was finally in touching distance of returning to the 2% target as the effects of the previous energy price shock faded. Monetary policy was on course to take the final steps towards a neutral interest rate.
Unfortunately, events, as they often do, have overtaken that outlook.
The breakout of conflict in the Middle East means that this Budget comes against a more difficult economic backdrop. The conflict has pushed inflation back up and it has now been above the Bank of England’s target for five years. Central banks have kept interest rates higher for longer than previously expected and this has pushed the cost of borrowing up for both the government and firms. The labour market is still subdued: unemployment remains heightened and vacancies have fallen to record lows. While growth has remained resilient thus far, the building pressure on the cost of living will squeeze households’ resources and spending power. Similarly, with public sector budgets set in cash terms, higher inflation will erode real spending on key public services, although the same inflation will also push up tax receipts.
There are some positive signs for the economy. Private sector investment has grown recently, particularly in sectors associated with AI, and signs of a nascent improvement in the productivity outlook give hope for the medium term. However, there is a risk that tighter financial conditions and elevated uncertainty could choke off this potential growth before it has got started. This complicates the jobs of policymakers on both sides of the fiscal–monetary divide, with the Bank of England balancing dealing with a near-term inflation spike with not overly dampening the economy in the medium term, and the Chancellor looking to find ways to stimulate growth with constrained resources and a bond market that remains wary of additional borrowing. This chapter outlines the cyclical forces that are driving the near-term economic outlook, as well as the more structural longer-term course for the UK economy.
In Section 1.2, we describe the effects of the Iran war on the energy market. Section 1.3 considers the outlook for inflation and Section 1.4 the challenges facing the Bank in setting monetary policy. Section 1.5 examines how real economic activity might evolve, focusing in turn on households, firms and international trade, and on the impact of a planned fiscal consolidation on demand. Section 1.6 discusses productivity, before Section 1.7 analyses the outlook for the labour market and perhaps the most important judgement that will feed into the Office for Budget Responsibility’s fiscal forecast – the extent to which higher inflation might feed through into higher nominal wages. Section 1.8 summarises our baseline scenario, before Section 1.9 looks at how the economy might fare in alternative scenarios – were the conflict in the Middle East to last for longer, or the UK to enjoy an AI investment boom. Section 1.10 concludes.
1.2 The UK and the Middle East shock
By far the most consequential global economic event since the last Green Budget is the conflict in the Middle East and the subsequent energy price shock that has reverberated around the world. As it runs through all aspects of the near-term outlook for the UK economy, we begin by outlining and contextualising what has actually happened.
The conflict in the Middle East has led to the partial closure of the Strait of Hormuz and more recently the Bab-al Mandeb Strait – two key channels for the oil trade.1 As a result, the price of Brent crude oil has risen from around $60 per barrel at the turn of the year, to around $100 per barrel at the time of writing. As shown in Figure 1.1, the scale of this increase is akin to that seen around the time of the beginning of the Russia–Ukraine war in 2022.
Figure 1.1. Brent crude oil price (index)
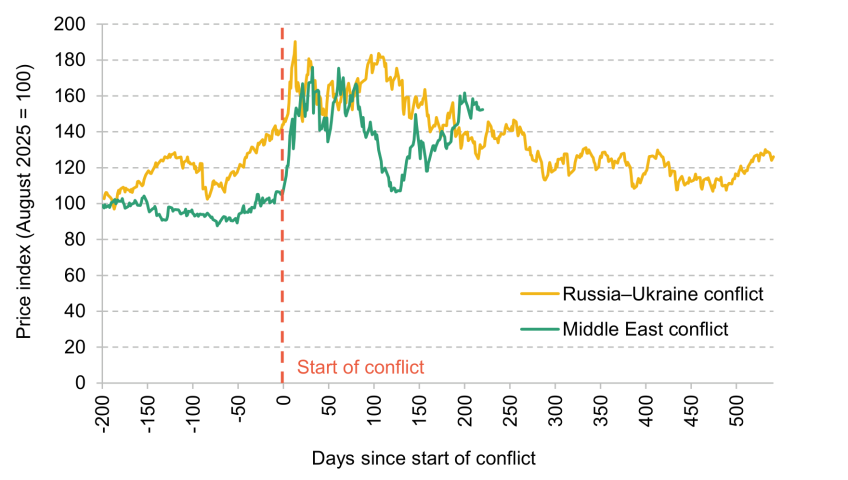
Note: Price is indexed to price in August 2025. Start of the conflict refers to 24 February 2022 in the case of the Russia–Ukraine conflict and 28 February 2026 in the case of the Middle East conflict.
Source: Bloomberg; Barclays Research.
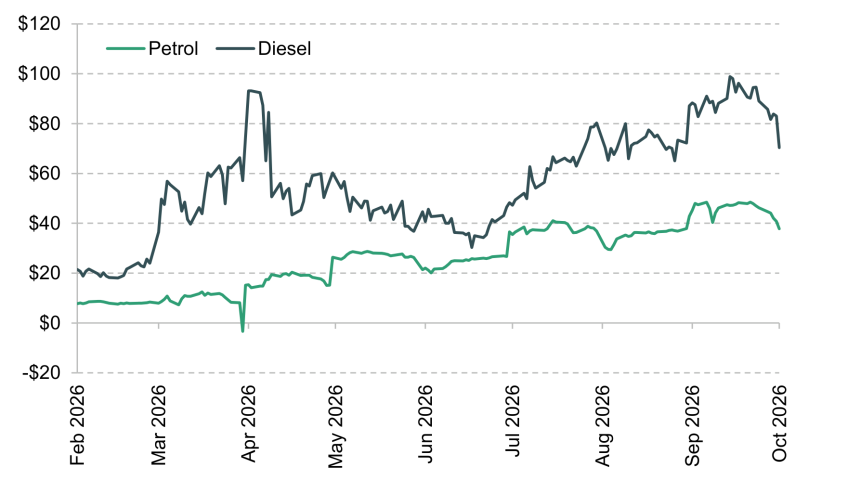
Global petrol and diesel prices have risen due to the rising cost of crude oil as well as increases in the cost of refining oil. Figure 1.2 shows how ‘crack spreads’ for European petrol and diesel – a measure of the gap between the prices of these refined oil products and crude oil – have crept up over 2026. Both the Iran war and the Russia–Ukraine war have reduced available refining capacity and so pushed up the cost of refined products.
Figure 1.2. Crack spreads for European refined oil products (dollars per barrel)
Source: Bloomberg; Barclays Research.
UK natural gas prices have also risen, from around 70 pence per therm before the conflict to around 185 pence now. As shown in Figure 1.3, the increase in wholesale natural gas prices has been much smaller than that seen around the 2022 Russia–Ukraine conflict. As highlighted by recent modelling, the gas price is disproportionately important for the outlook for UK inflation and growth, so the fact it has more than doubled this year is concerning (Barclays, 2026a).
Figure 1.3. UK natural gas prices (one month forward)
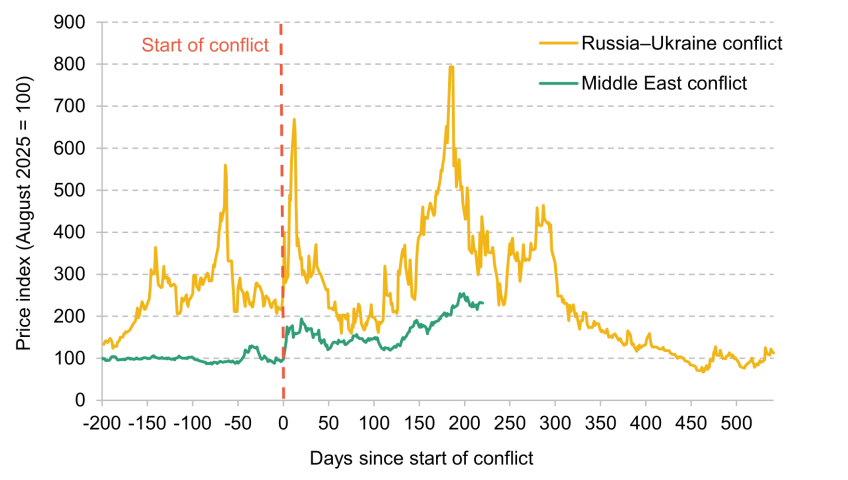
Note: Price is indexed to price in August 2025. Start of the conflict refers to 24 February 2022 in the case of the Russia–Ukraine conflict and 28 February 2026 in the case of the Middle East conflict.
Source: Bloomberg; Barclays Research.
The future evolution of the situation in the Middle East will be very important for the UK economy in the near term. A rapid and lasting resolution to the conflict could bring with it falling inflation sooner than currently expected, which would in turn benefit growth and households, and falling bond yields which would reduce government debt servicing costs. On the other hand, as explored in Section 1.9, a more protracted conflict that kept energy prices elevated for longer could further hamper growth. Predicting how the geopolitics will play out is a near impossible task, introducing a genuine degree of uncertainty, in the radical sense of not being able to know, rather than just a quantifiable set of risks that may, with some rough probability, happen or not (Kay and King, 2020).
This is the backdrop to our baseline forecast and the scenarios presented below. This shock will both increase inflation and reduce the real size of the economy – the volume of goods and services actually produced. We first discuss the likely impacts on inflation and then discuss how it alters the outlook for the real economy.
1.3 Inflation will rise again. The key is for how long
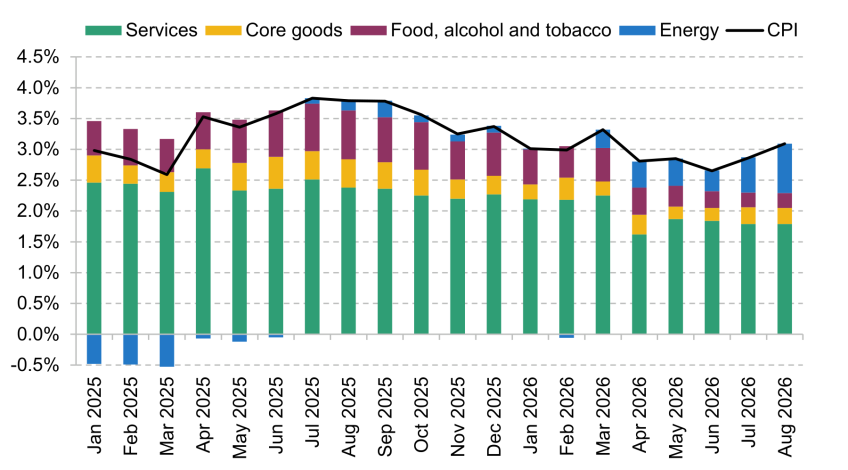
The Iran war has already increased inflation and will likely continue to put upwards pressure on it in the rest of 2026 and into 2027. At the time of the last Green Budget, we had anticipated headline Consumer Prices Index (CPI) inflation being around 2% at this point, and broadly stable going forwards. As of August, CPI inflation was 3.1%. As shown in Figure 1.4, excluding the direct effect of energy prices (both household energy and petrol, shown together in blue), CPI inflation would have been only 2.3%.
Figure 1.4. Decomposition of annual CPI inflation (% year on year)
Source: Office for National Statistics; Barclays Research.
The nature of the Ofgem energy price cap means elevated wholesale energy prices pass through to household energy prices with some delay. The cap increased by 4% this month, but market pricing of gas and electricity at the time of our forecast implies a much more substantial increase in the price cap of 20% in January, which will add considerably to UK inflation at the beginning of next year. The extent of volatility in energy prices in recent months means this judgement, while crucial, is highly uncertain. On top of this, forecasts of the cap require an assumption on what will happen to non-wholesale costs (other things Ofgem layers in on top of the raw energy cost). This means published estimates of the Ofgem cap in Q1 2027 have been swinging in a range of 10% to 25% in the last few weeks, depending on exactly when market prices were sampled and what is assumed on non-wholesale costs.
One key question for the inflation outlook is how persistent this shock to energy prices is. The energy price curves we condition our baseline forecast on (see Appendix 1A) imply market participants expect gas and oil prices will begin to fall from Q1 2027 onwards, as the conflict subsides and the energy supply outlook recovers, suggesting the direct energy price shock might be relatively short-lived.
We also assume the gap between the prices of refined oil products and crude oil (the ‘crack spreads’ shown in Figure 1.2) will not grow from their current elevated levels, consistent with futures market pricing for refined oil products. There remain risks around refined oil products, with the supply of them seriously constrained by the Middle East conflict. Risks also remain that the conflict may not be resolved in coming months. We explore the potential consequences of a more prolonged period of elevated energy prices in Section 1.9.
These increases in gas, electricity, petrol and diesel prices are the direct impact of the energy price shock. The second key question for the inflation outlook is whether rising energy prices will lead to broader increases in prices for other goods and services.
One potential channel for the energy price shock leading to broader inflation is through rising input costs for non-energy products. These are often termed indirect energy effects. However, so far we see little evidence of this. As shown in Figure 1.5, a measure of energy-intensive core inflation (which strips out direct energy bills, pump prices and also volatile food, alcohol and tobacco, but focuses on the goods and services where energy is a key input) remains around 2%. These are the goods and services where we would first expect to see any spillovers occurring from changes in direct energy costs. This effect is likely to build over time, and we expect a mild acceleration in the coming months but, eight months into the energy shock, we find it reassuring that there are still few signs of pressure in these groups.
Figure 1.5. Energy-intensive and non-energy-intensive core CPI inflation (% year on year)
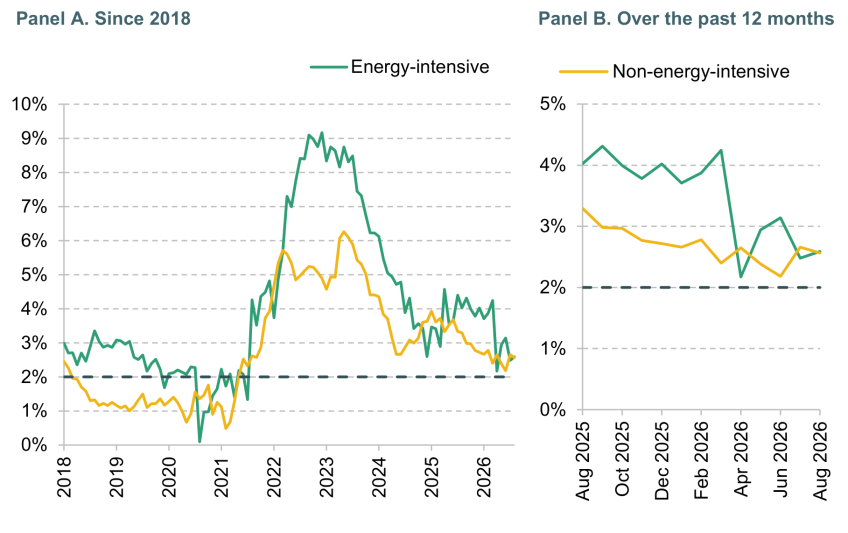
Note: Horizontal dashed line shows 2% inflation target. Scale of vertical axis differs between panels.
Source: Barclays Research.
Another potential route from the energy price shock to broad inflation is through the labour market. Workers might respond to the increase in prices they face by demanding higher wages to compensate, and firms might finance these higher wages through raising their own prices. This mechanism – often termed second-round effects or, at the extreme, a ‘wage–price spiral’ – could transmit the energy price shock out into the broader economy. However, our view is that this is unlikely to happen in a meaningful way in this instance due to the relatively weak demand for labour in the economy currently, as we discuss in Section 1.7. This weak demand relative to the supply of workers looking for jobs means workers have less bargaining power in wage negotiations.
This point is illustrated by Figure 1.6, which shows the historical relationship between firms’ expectations of wages and of inflation, and how this has broken down since the conflict in the Middle East began. Since March, wage expectations have been insensitive, even as inflation expectations have moved. Because of these conditions, in our baseline scenario we expect limited scope for pressures from the labour market to push up inflation more broadly.
Figure 1.6. UK firms’ expectations of CPI inflation one year ahead and nominal wage growth
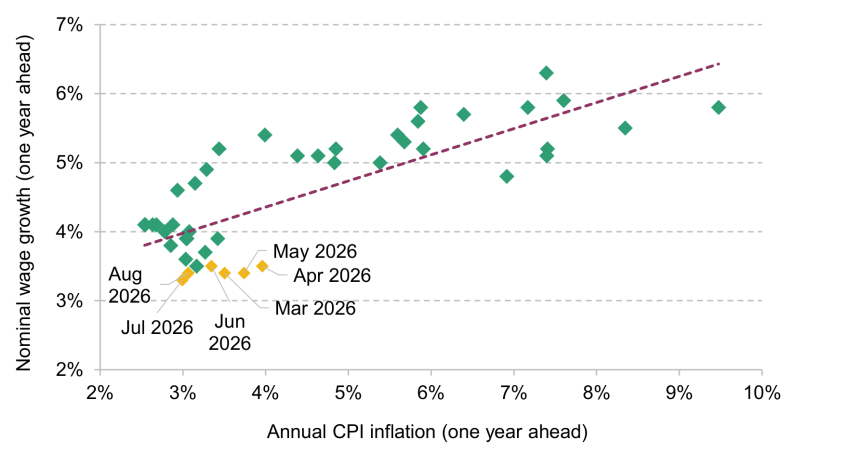
Note: Green markers show months from May 2025 to February 2026. Dashed line shows linear relationship over the whole period.
Source: Bank of England; Barclays Research.
Reassuringly, we do not see any evidence of the energy price shock passing on to non-energy-related goods and services yet. When we look at more granular data on prices in the UK, we can see little evidence of the energy shock spilling over more broadly. The Bank of England, for instance, has a measure of ‘sticky-central’ inflation that gives more prominence to parts of the consumer price basket that are associated with more persistent inflation. As with our own metric on energy-sensitive core inflation, this is currently at benign levels (Pill, 2026).
Inflation expectations also look to be relatively contained so far. Figure 1.7 shows firm and household expectations of inflation over time. We have seen measures of household inflation expectations tick up, but short-term expectations (for inflation over the next 12 months) remain far below where they were in 2022. The increases in measures of firms’ expectations have been much more muted, and remain well anchored, especially over longer horizons. This provides further support for the view that the period of higher inflation resulting from the energy price shock is likely to be short-lived.
Figure 1.7. UK inflation expectations (% year on year)
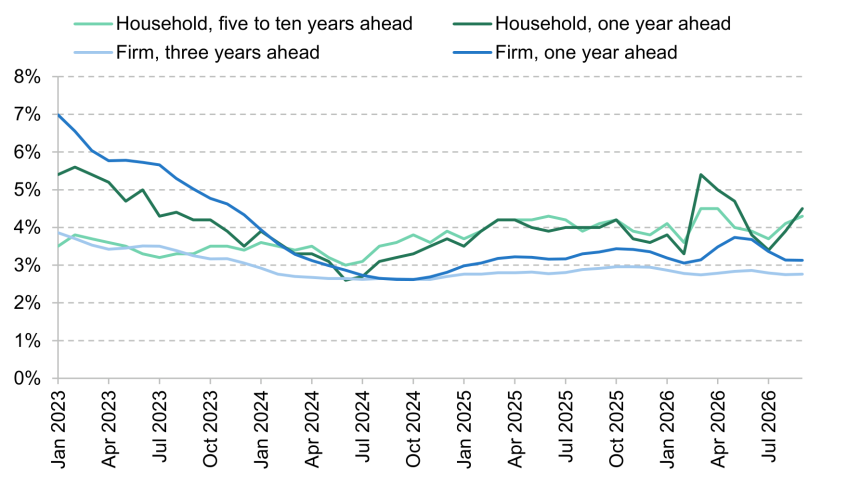
Note: Household expectations are from Citi/YouGov data. Firm expectations are from DMP survey.
Source: Citi/YouGov; Bank of England Decision Maker Panel (DMP); Barclays Research.
One further risk to the inflation outlook comes from food prices. These have been growing slowly in recent months, and many indicators of price pressures early in the supply chain remain benign. However, we expect there to be a pickup in the coming months as weak base effects that have been lowering the annual rate fall out of the growth rate calculation. This could be intensified by the erratic weather conditions already this year, which are likely to have affected coming harvests, and by the impact of the El Niño phenomenon – a natural climate pattern affecting large parts of the world – which is likely to cause further disruption over the next six months.
Monetary policy is also acting to reduce the persistence of the inflation shock. As we discuss in the next section, the current level of interest rates is restrictive, meaning it is weighing on the economy and reducing inflation. A further tightening of monetary policy in the coming months should act to slow inflation next year, though it will also push down on economic growth in the short term and increase the costs of government borrowing.
Taking all this together, we now expect headline CPI inflation to average 3.1% in 2026 and 3.0% in 2027, before normalising to 2% in 2028 as the spare capacity in the economy is absorbed and supply and demand become more balanced, stabilising price growth. Figure 1.8 compares our latest forecast for CPI with the Bank of England’s latest forecast, made in July, the Office for Budget Responsibility’s from March and our forecasts made in February before the Middle East conflict began. Our current forecast is in line with the Bank’s latest forecast but is much higher in the near term than the OBR’s forecast in March, when it expected CPI to average 2.3% in 2026 and 2.0% thereafter.
Figure 1.8. Forecasts for annual CPI inflation (% year on year)
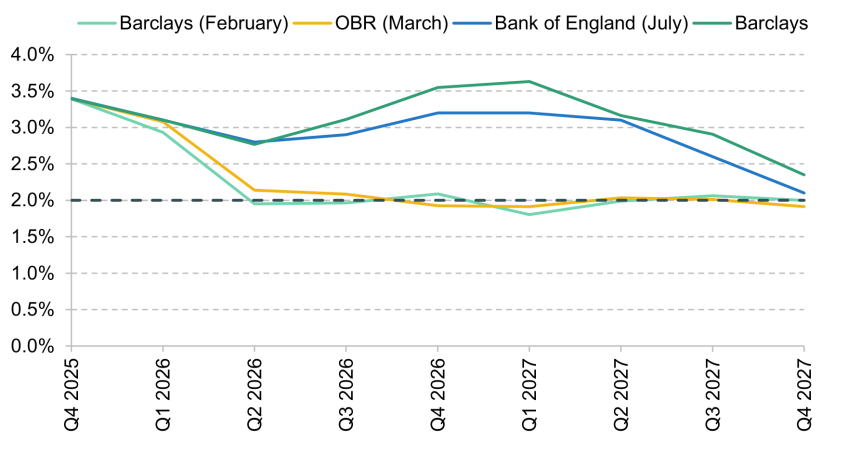
Note: Horizontal dashed line shows 2% inflation target.
Source: Office for Budget Responsibility’s Economic and fiscal outlook March 2026; Bank of England’s Monetary policy report July 2026; Barclays Research.
1.4 Monetary policy
This Budget comes at a crucial and difficult time for monetary policymakers at the Bank of England and around the world. Prior to the conflict in the Middle East, the Bank of England had been expected to cut its main interest rate by almost half a percentage point over the course of 2026. This was derailed by the conflict, which has increased inflation and put pressure on central banks around the world to tighten monetary policy.
In response to this, the Bank of England has so far decided to keep Bank Rate at 3.75% – the same level at which it started the year. This represents a tightening of monetary policy relative to prior market expectations that the Bank would cut Bank Rate. Other central banks, most notably the Federal Reserve in the United States and the European Central Bank, have raised their policy rates, but they had different expected stances going into the shock, reflecting that their economies started from different positions. As shown in Figure 1.9, the amount that the Bank of England has changed course in response to the energy price shock is aligned with other central banks’ changes, which have also set policy rates that are currently around half a percentage point higher than was expected at the end of February.
Figure 1.9. Changes in central bank policy rates compared with market expectations at the end of February (percentage points)
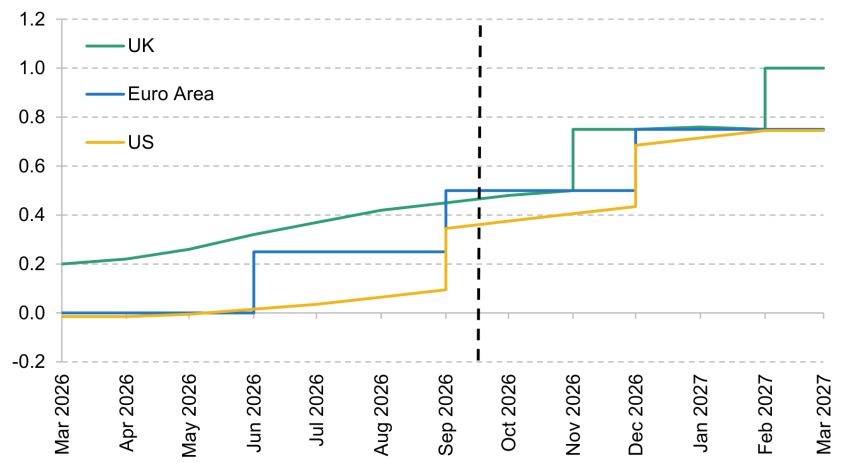
Note: Left of the dashed black line compares out-turns with expectations as of February 2026, and right of the dashed black line compares latest expectations as of September 2026 with expectations as of February 2026.
Source: Bloomberg; Barclays Research.
We estimate the neutral interest rate – the Bank Rate that neither slows nor stimulates the economy – is between 3% and 3.5%. In our assessment, holding Bank Rate at 3.75% is therefore restrictive, weighing on demand in the economy and ultimately prices. This is another point of difference with, say, the European Central Bank, which entered the energy price shock with its policy rate at a broadly neutral setting. The question facing the Bank of England now is: ‘Is this level of restriction enough, or should it increase Bank Rate from here?’.
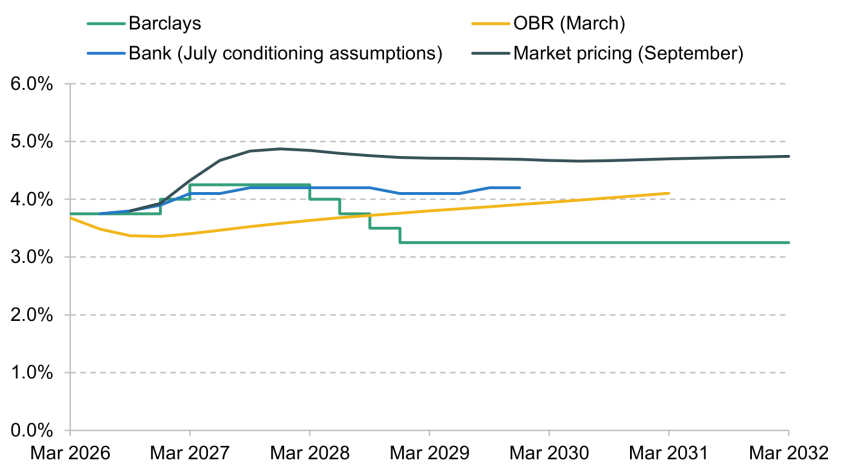
We do expect the Monetary Policy Committee (MPC) at the Bank of England to raise Bank Rate to 4.25% by next February. Figure 1.10 shows our baseline forecast for interest rate changes compared with market expectations for interest rates taken at different times. Our baseline forecast includes two rises in the coming months, with the first increase likely to come as soon as November, just one week after the Budget.
Figure 1.10. Expectations for path of Bank Rate
Source: Office for Budget Responsibility’s Economic and fiscal outlook March 2026; Bank of England’s Monetary policy report July 2026; Bloomberg; Barclays Research.
This is a more muted cycle of interest rate increases than financial markets are seemingly expecting, with market contracts pricing that the Bank will increase Bank Rate more materially, by 1 percentage point over the next 12 months. This matters, as it is the market’s expectation for the path of Bank Rate that will be reflected in the OBR’s forecast. At the time of the last OBR forecast, markets had expected the Bank of England to cut Bank Rate to around 3.25% by the end of 2026 and to keep it there, so the new OBR forecast is likely to reflect an expected swing of 1.5 percentage points.
So, why might our views differ? As we discuss in the next section, we assess there is slack in the economy – meaning the economy is smaller than the size it could sustain without generating excessive inflation. The MPC will be balancing this against the risk that the near-term inflation spike becomes embedded in expectations and spills over into more persistent inflation. As we discuss in Section 1.3, we think the evidence of such spillover so far is limited. The fact that expectations for future inflation remain reasonably well anchored at the 2% target makes the Bank of England’s job easier. It will make the Bank more able to look through a temporary, near-term spike in inflation, without fearing that it will translate into a loss of credibility or more persistent inflation. This would mean it does not need to raise interest rates as much as it otherwise might in order to bring inflation back to its 2% target.
Of course, the longer the conflict in the Middle East continues, the larger the risk becomes that households’ and businesses’ inflation expectations are de-anchored from the 2% target and the larger the risk that the direct energy shock bleeds more widely into persistent prices.
While a number of members of the Bank of England’s MPC believe these risks are enough to motivate them to increase policy rates, we do not judge that the energy price shock – at least, one of the scale and duration currently expected by energy markets – will warrant a more material increase in Bank Rate than these two quarter-point hikes.2 As shown by stylised and simplified rules that mimic how policymakers think about setting interest rates in response to the economy, a policymaker who is forward-looking would not respond with higher Bank Rate if they were certain that the energy shock followed the price embedded in markets and that there would be limited second-round effects. Monetary policy can do little to influence price increases in the next three to six months, especially when they are driven by global supply-side shocks; by the time we get to the first half of 2028, inflation in our baseline scenario is projected to be just 0.2 percentage points above the Bank of England’s 2% target. If we were to instead assume that there was a more severe tightening of monetary policy from the Bank, it would do little to reduce the inflation peak in Q1 2027, but it would slow growth and raise the unemployment rate.
Beyond the near term, we expect the MPC to bring rates back to a neutral setting over the course of 2028, settling at 3.25% in the medium term. This compares with an expectation in market pricing that Bank Rate will stay above 4% over the OBR’s entire forecast horizon.
The MPC has also made a judgement about its quantitative tightening programme and the steady-state treatment of government bonds on its balance sheet. We expand on this in Chapter 3 of this Green Budget as, although it has limited direct implications for growth, it will impact the public finances.
1.5 GDP and activity
As well as leading to an inflation spike, and to revised expectations of Bank Rate, the Iran war has worsened the outlook for economic growth. We now turn to that.
Real GDP growth has been resilient so far this year …
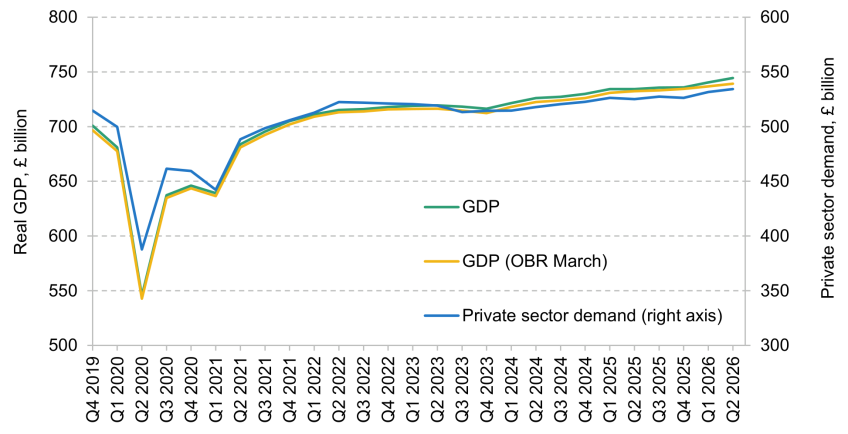
The UK economy has grown in real terms by 1.2% in the first half of 2026, and an additional 0.4% in July alone, according to current ONS data. This is higher than the 0.7% that was expected by the OBR at the time of its March forecast and, when coupled with revisions to the historical data, means that the economy is both 0.7% bigger than had been expected and carrying more momentum into the second half of the year.
In further positive news, the required handover from public-sector- to private-sector-led growth, which we had emphasised as fundamental in last year’s Green Budget in light of the planned fiscal consolidation, has occurred. Overall, private domestic demand (from household consumption and business investment) has increased by 1.5% in the first half of the year, showing a resilient picture so far, while public demand has grown by 0.5%.
Figure 1.11. Forecasts for real GDP and real private sector demand since Q4 2023
Source: Office for Budget Responsibility’s Economic and fiscal outlook March 2026; Office for National Statistics; Barclays Research.
Growth has been driven by strong private consumption in the first quarter of the year, which expanded by 0.6% quarter on quarter. Although this slowed to 0.3% in the second quarter of the year, business investment grew 1.8%, helping to offset the slowing of private consumption. The increase in business investment was attributed in particular to hardware in information and communication sectors, likely linked to increased investment in AI-related infrastructure. Sectorally, services continue to be the main driver of economic activity in the UK, expanding 1.3% in the first half of the year, while industrial production contracted 0.3%.
One concern is that some of the apparent strength in growth in the first half of the year may reflect measurement issues rather than genuine improvements in economic conditions. There has been a predictable pattern in recent years of stronger measured growth in the first half of the year that then fades in the second half. We judge that this effect has been lessening with time as the Office for National Statistics updates its estimates, and so more of the growth we have seen has been reflective of a genuine expansion than in previous years.
… but likely to slow in coming quarters
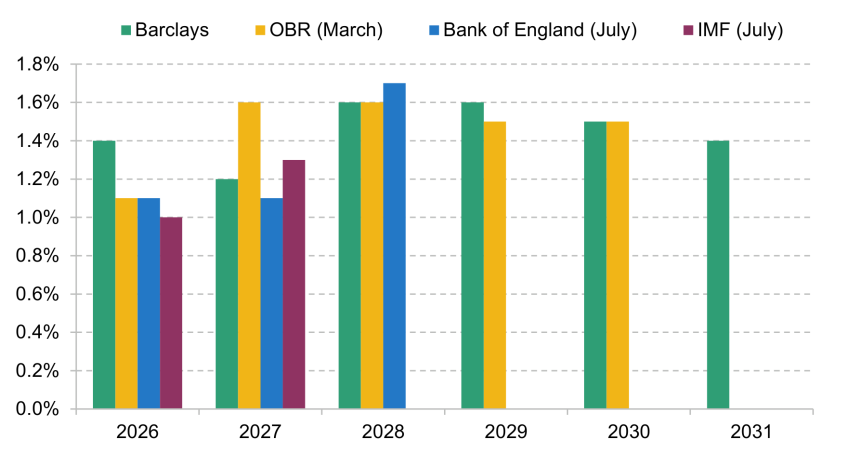
Looking ahead, growth is likely to slow in 2027. We expect real-terms annual growth in GDP to fall from 1.4% in 2026 to 1.2% in 2027 (Figure 1.12). The terms-of-trade shock emanating from the Middle East – where higher energy prices make countries that are reliant on energy imports, such as the UK, poorer – has not yet manifested in a meaningful way. Price rises, and their associated negative impacts, are only just starting to feed through, but next year we expect higher prices and the higher interest rates that have come alongside them to slow economic growth.
Figure 1.12. Forecasts for annual growth in real GDP (% year on year)
Source: Office for Budget Responsibility’s Economic and fiscal outlook March 2026; Bank of England’s Monetary policy report July 2026; International Monetary Fund’s World economic outlook update July 2026; Barclays Research.
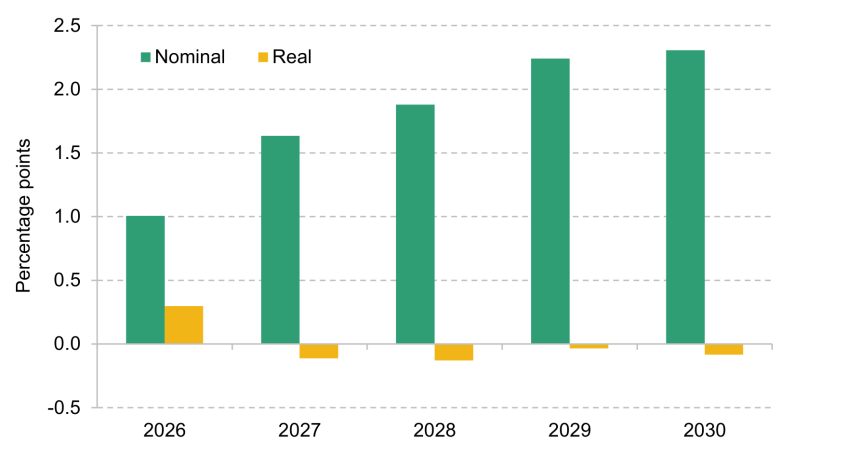
Our modelling suggests that, under our baseline assumptions for energy prices, the level of real GDP in the UK will be around 0.8% lower at the end of 2027 than it would have been in the absence of the conflict. In the medium term, growth will pick up to 1.5% annually in 2030 and 1.4% in 2031. Partly due to the Iran war shock, we expect real GDP to grow by 0.1 percentage points less between 2025 and 2030 than the OBR forecast in March (Figure 1.13).
Figure 1.13. Difference in forecast levels of GDP between Barclays baseline and OBR March 2026
Source: Barclays Research.
Despite our forecasts implying slower real-terms growth in GDP than the OBR’s forecast in March, we forecast higher levels of cash-terms GDP growth due to higher inflation. We expect nominal GDP to grow by 2.3 percentage points more between 2025 and 2030 than the OBR projected in March (Figure 1.13).
This is crucial for the fiscal outlook, as most taxes are levied on nominal quantities, such as prices and profits. As discussed in Chapter 4, higher inflation can therefore feed through into greater tax revenues.
Households to face a real income squeeze
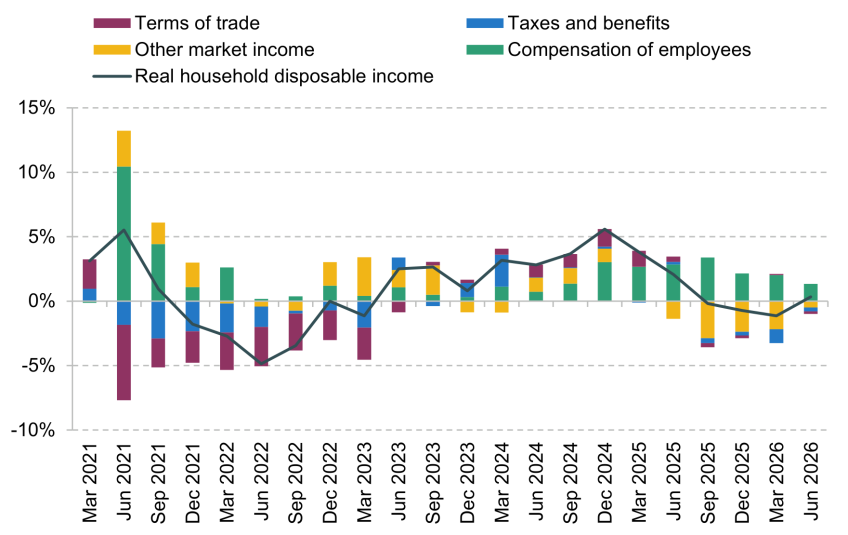
Real disposable incomes of UK households fell on an annual basis in the second half of 2025 and only just began to stabilise in Q2 2026. Figure 1.14 shows how different income sources have contributed to the real household disposable income growth over time. The biggest shift, a negative contribution from other market income, has been the result of: falling rates on deposits and savings unwinding part of the windfall that savers had enjoyed during the period of high rates, reducing net interest income; and weaker dividend and property income growth. While incomes were growing in real terms from 2022 to the middle of 2025, higher inflation has led to falls in real disposable income since then. Figure 1.14 also highlights how the current terms-of-trade shock has not yet taken effect, but is likely to build, following the pattern of 2022 but to a lesser extent.
Figure 1.14. Changes in real household disposable income each quarter (% year on year)
Source: Office for National Statistics; Barclays Research.
Whereas in the last Green Budget we had expected a normalisation of inflation and a pickup in economic growth to buoy household spending power, we now expect the inflationary shock from the Middle East to weigh on them further, keeping it falling in 2027.
Despite this, we expect households to continue to spend, and private consumption to grow by 0.4% in real terms in the second half of 2026. Consumer confidence metrics have remained resilient since the Middle East conflict began and Barclays SpendTrends data, which analyse information from roughly 40% of card spending in the UK, suggest UK consumers continue to prioritise spending on sectors they see as important, while looking to economise overall (Figure 1.15).
Figure 1.15. Changes in essential and non-essential consumer card spending, from Barclays SpendTrends (% year on year)

Note: Essential spending includes spending on childcare, healthcare, insurance, grocery, fuel and public transport. Based on Barclays debit card and Barclaycard credit card transactions in the UK.
Source: Barclays SpendTrends data.
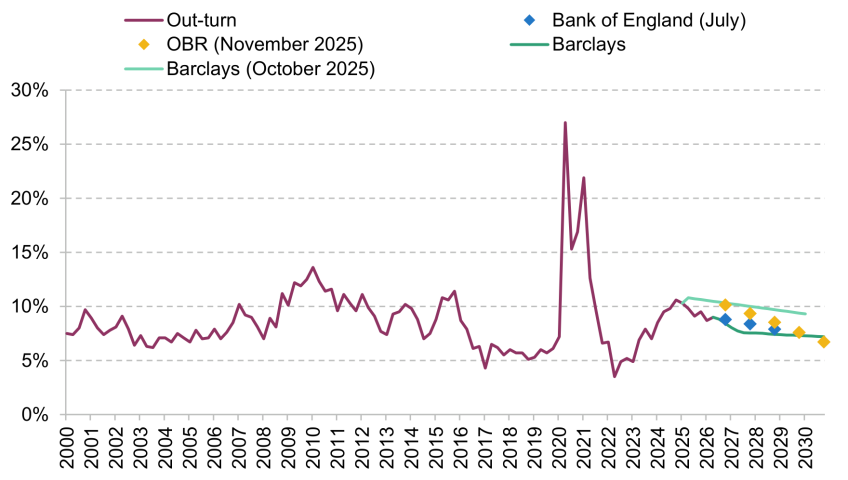
The corollary of consumption growth alongside falling real incomes is that we expect to see a larger fall in the saving rate than we had previously forecast. The saving rate is the share of annual income that households do not consume. So far in 2026, we have seen the household saving rate fall from 9.5% to 9.0% (as shown in Figure 1.16). This is faster than we had expected at the time of the last Green Budget, and faster than had been expected by the OBR in its March forecast. We explored what such a scenario would mean for economic growth this time last year (Meaning, 2025), although in the event, rather than boosting growth, the savings drawdown is being used to offset a negative shock and allow households to try to smooth through the pending real income squeeze.
Figure 1.16. Household saving rate: out-turn and forecasts
Note: Markers show annual forecasts. Barclays (October 2025) forecasts are from Meaning (2025).
Source: Office for Budget Responsibility’s Economic and fiscal outlook November 2025; Bank of England’s Monetary policy report July 2026; Barclays Research.
We saw a similar pattern in 2022 and 2023 when the Russia–Ukraine war started and inflicted a (larger) terms-of-trade shock on the UK. The main difference now compared with then is the extent of excess savings held by UK households. After the pandemic, households had built up significant savings balances they were able to run down. Now, having already used savings to absorb the last cost-of-living shock, aggregate savings are below what various metrics would imply would be the equilibrium level sought by households, and so the scope to run these down further is reduced. Households’ net financial wealth to income ratio has stabilised in recent quarters, at 8.6, having fallen from 15 in late 2020 to 8.5 in early 2025. However, it remains low compared with historical averages and will also limit the scope for households to unwind savings on a more prolonged basis as they try to repair this imbalance and restore previous levels of financial wealth.
In the medium term, our forecast reflects an expectation that the saving rate reaches 7.5% in 2028 and then stabilises. From 2028 onwards, consumption is driven by real disposable income growth of 0.6% per year as inflation comes back to the 2% target, outstripped by nominal earnings growth stabilising.
There have been positive signs for business investment
Following a weak performance in 2025, business investment accelerated in 2026, expanding 3.0% in the first quarter and 1.8% in the second. Within this, there has been particular strength in investment in ICT and other sectors associated with the global AI boom. This is a trend that, although nascent in the UK, we have seen play out at scale in the United States, where AI-adjacent investment has added more than 4% to the level of GDP over the last 18 months. Were it to continue, this pattern could make a material contribution to UK growth in the coming years (something we explore in Section 1.9), raising the level of real GDP by more than 2% by 2030 compared with our baseline forecast.
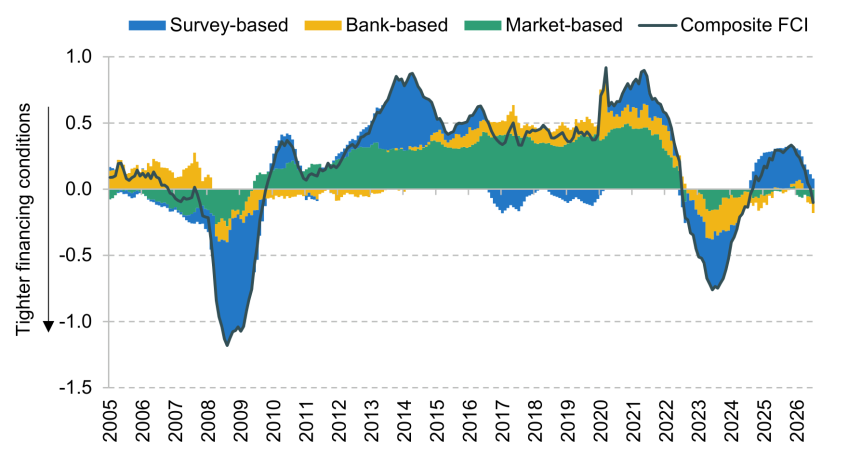
However, we think in practice there remain headwinds that will weigh against this. The first is tighter financial conditions partly due to higher central bank policy rates. As shown in Figure 1.17, financing conditions for firms are now back to the levels of tightness last seen in mid 2024, raising the hurdle rate for investment – the minimum rate of return required to make an investment viable. The second factor is elevated levels of economic and policy uncertainty globally and domestically. UK firms responding to the Barclays Prosperity Index survey asked for more certainty, particularly in the policy outlook. That said, the same survey suggests 56% of businesses plan to increase investment in the next 12 months. How the Chancellor handles the Budget will be a crucial piece in the puzzle unlocking this investment. Respondents to the latest Barclays survey, released last week, say eight out of ten firms plan to increase their investment if the Budget delivers increased certainty.
Figure 1.17. Barclays UK financing conditions index (FCI)
Source: Barclays Research.
In the medium term, we see investment (gross fixed capital formation) rising from 20% of GDP to closer to 22% of GDP. This goes some way to improving the UK’s capital to output ratio, lifting it from 2.01 to 2.04. It would still leave the UK behind many of its international peers, with the US and Germany holding capital around 2.5 times their GDP, France around 3 times GDP and Japan around 3.5 times GDP. Some of these differences will be due to the different industrial composition of the UK’s economy relative to comparator countries, as discussed in Chapter 2.
The global economy and current account
Alongside household consumption and business investment, net exports – the difference between the UK’s exports and imports – are another contributor to demand in the economy.
Global growth has remained resilient so far in 2026, especially considering that we are still experiencing the drag from higher global tariffs and absorbing the new shock from the Middle East. Despite these significant headwinds, we expect the global economy to expand by 3.3% in real terms in 2026, just 0.2 percentage point less than it did in 2025. We expect to see regional differences, with growth in the US remaining strong in the near term, spurred by a continuing AI investment cycle, Europe slowing and seeing significant divergence among members, and Chinese growth slowing, albeit from higher rates.
Global trade uncertainty has reduced significantly since last year, but remains elevated compared with a longer view of history, and while we have seen global supply chain pressures re-emerge, they are still far short of the levels seen in 2022. This resilient global backdrop is expected to support UK exports. Having widened in the final quarter of 2025, the UK’s current account deficit – the difference between what we earn from the rest of the world and what we pay abroad – has narrowed so far in 2026, to £19.9 billion, or 2.5% of GDP. We expect it to stay stable around these levels over the next year or so before falling back to around 2% of GDP in the medium term, helped by positive trade balances (exports exceeding imports) and reduced government borrowing. Key for the outlook will be the extent to which government policies are able to incentivise foreign direct investment, which has remained muted since 2016.
Fiscal policy
Government spending is an important component of demand in the economy. We expect to see reduced growth in total demand coming from this channel in the coming years, if the Chancellor sticks to plans to consolidate the public finances and reduce borrowing.
Our baseline forecast includes already-announced policies, rather than assumptions about what will be announced in the Budget. For the variant that underpins the fiscal estimates made in Chapter 2, we also strip out policies announced since the last fiscal event – such as the cost-of-living measures announced over the summer – to more cleanly approximate the process undertaken by the OBR in producing its pre-measures forecast.
The latest in-year data show that government has borrowed £77.3 billion so far this financial year (from April to August 2026), roughly £8 billion above the OBR’s expectation in its March forecast for borrowing up to this point (Office for National Statistics, 2026c). The current budget deficit – the difference between day-to-day spending and revenues –– was £51.9 billion over the same period, and £4.8 billion larger than the OBR had forecast. These misses are small in the scheme of large fiscal numbers though and do not change the overall fiscal narrative from March.
Based on the spending plans as laid out at the Spending Review last year, we expect a fiscal consolidation, with the cyclically adjusted primary balance – a measure of the fiscal stance – falling every year of this forecast, from a deficit of 1.1% of GDP in 2025–26, to a surplus by 2028–29, and a surplus of 0.1% in 2030–31. This means fiscal policy will be acting as a drag on aggregate demand and hence economic growth throughout the forecast horizon. Chapter 2 provides a detailed discussion of how changing economic conditions might impact the public finances.
A key element of our baseline forecast is that we have not assumed an increase in nominal departmental spending plans in line with the upwards revision to inflation. This means that the same spending profiles imply slower real-terms growth in departmental spending, a point investigated more in Chapter 6.
Given the above, both fiscal and monetary policy are acting as headwinds to economic growth for much of this parliament, highlighting the difficult balancing act of navigating an inflationary supply-side shock when fiscal policy is constrained.
The output gap
We currently assess that there is slack in the UK economy, with the level of real GDP as of the second quarter of 2026 around 1–1.5% below potential output. This means that the UK is producing less than it could stably produce whilst maintaining inflation steady at the Bank’s target rate of 2%. This is consistent with a range of metrics of capacity utilisation (shown in Figure 1.18) and the Bank of England’s assessment, which put spare capacity at 1.1% of potential GDP in the third quarter of 2026 in its July monetary policy report.
Figure 1.18. Measures of capacity utilisation and the output gap
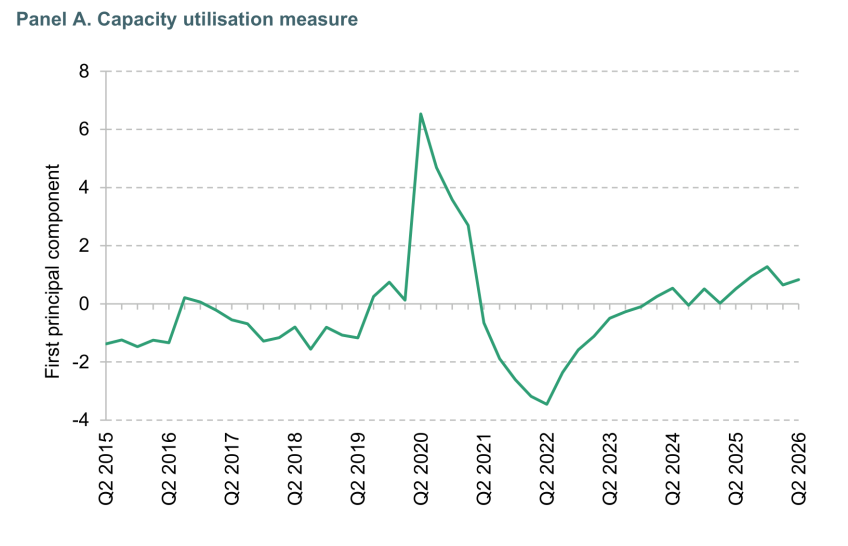
Note: We take the first principal component of the following survey measures of capacity utilisation: CBI industrial trends, BCC services/manufacturing, S&P PMI manufacturing, BoE Agents.
Source: Confederation of British Industry; British Chamber of Commerce; S&P Global; Bank of England; Barclays Research.
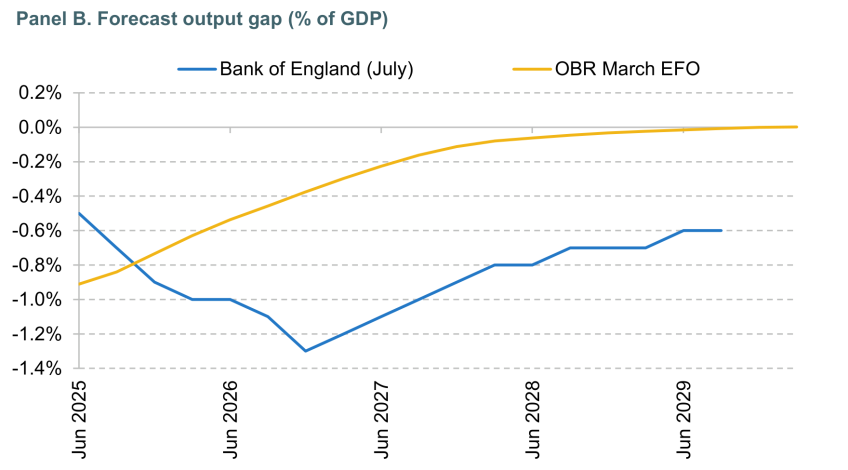
Source: Office for Budget Responsibility’s Economic and fiscal outlook March 2026; Bank of England’s Monetary policy report July 2026; Barclays Research.
We expect real economic growth in the second half of the year and first half of 2027 to be below trend, but only sufficiently so as to widen slack by a few tenths of a percentage point. As cyclical growth rebounds from 2028 onwards, we expect the output gap to narrow, but to not fully close by the end of our forecast horizon. This is because of the fiscal consolidation implied by current spending plans, which acts as a persistent drag on demand, and because we forecast the Bank of England will keep Bank Rate high, which also pushes demand in the economy down.
1.6 Potential output and productivity
Potential output is the amount of real output that the UK economy could produce while keeping the unemployment rate stable and inflation at the Bank of England’s 2% target over the medium term. While cyclical changes in output matter in the short term, in the medium term the path for potential output is the key determinant of real economic growth.
Potential output growth can be broken down into growth driven by increases in the labour force – the number of people available to work – and changes in real output per worker (productivity). Over the forecast, we expect potential output growth to increase from 1.2% per year in 2026 to 1.5% per year in 2031. This increase is driven by an anticipated increase in productivity growth which more than offsets slowing growth in the labour force. We now discuss our forecasts for those two components.
Changes in the size of the labour force
There are two reasons we expect labour force growth to slow over the forecast period.
Population. Recent evidence suggests that there is likely to be slower population growth between now and 2030 than previous forecasts suggested. In our baseline forecast of potential output, we follow the latest ONS population projections (produced in April 2026), which imply the 16+ population grows on average by 0.6% per year. Much of this slowdown is driven by expectations of lower net migration. ONS population projections now project medium- and long-run net migration to be 230,000 a year, compared with 340,000 per year in its previous projections. Recent visa data suggest that immigration could fall even faster than forecast (Home Office, 2026). The OBR already started to downgrade its net migration forecast in March, assuming around 290,000 a year by 2030, but is likely to go further at the Budget. A lower population projection reduces the number of people available to work and so the potential output of the UK economy in the medium term. For more detail on how changing patterns of migration affect the public finances – and how the OBR forecasts this – see Chapter 5.
Labour force participation rate. We expect the labour force participation rate – the share of the 16+ population who are working or looking for work – to fall over time as the population ages. Older adults tend to be less likely to be available for work either because they have retired or because they have health conditions that limit their ability to work. As the population gets older, we expect the participation rate to fall from around 63.8% now to 63.5% at the end of the forecast period. This pushes downwards on potential output over the forecast period. The same dynamics, in our view, will drive a reduction in average hours worked by each worker, and further reduce the labour input to potential output.
Productivity growth
Offsetting declining labour force growth, we expect productivity – output per worker – growth to increase through the forecast from 0.6% per year in 2026 to 1.1% per year in 2031.3 There are two reasons output per worker is growing in our forecast. First, we expect investments in capital (e.g. buildings and equipment) to increase the stock of capital available to workers – ‘capital deepening’. This makes each worker more productive as each worker can do more if they have more equipment available to them. We expect this effect to be a steady upward force throughout our forecast period.
Second, we expect output per worker to increase as the technologies for translating a given set of capital and labour into output increase. In the near term, we expect cyclical influences that have weighed on productivity, such as labour hoarding post-pandemic and supply-side shocks, to subside and bolster productivity growth. We expect investments in new technologies such as artificial intelligence (AI) to pay off and improve the economy’s ability to translate inputs into outputs going forward and for this technological growth to increase over time – from 0.1% per year in 2026 to 0.5% in 2031.
Productivity growth is highly uncertain and different forecasters will take different views. The OBR has historically been optimistic on productivity growth (Emmerson, Ridpath and Stockton, 2025) but revised down its medium-run productivity growth assumptions in March to 1.0% annual growth in output per worker. This is slightly below our medium-run projection for output per worker growth. An important potential upside risk on productivity growth is the development of AI. We discuss a scenario where the boom in investment in AI continues, and the potential consequences of this for productivity, in Section 1.9. How productivity growth turns out will be incredibly important for both the health of the public finances and labour market outcomes which we turn to next.
1.7 The labour market
We now turn to the likely trajectories for unemployment, employment and wages.
The labour market continues to show signs of weakness
Official data based on the Labour Force Survey (LFS) suggest the unemployment rate remains heightened but has fallen slightly in 2026. It rose from 4.3% in the first quarter of 2024 to 5.2% in the final quarter of 2025, before falling back slightly to 4.9% in the second quarter of 2026. The same Labour Force Survey would also paint a positive picture of strong employment growth. In fact, the figures for employment for Q2 2026 were around 260,000 more people in work than the OBR expected in its March forecast.
However, there are well-documented issues with the LFS post-pandemic, which make it hard to draw strong conclusions from recent LFS data alone (Office for National Statistics, 2026a and 2026b). Other indicators shown in Figure 1.19 suggest a weaker picture for labour demand. In contrast to the official LFS measures, other measures show employment falling during 2026. Our shadow employment indicator, based on web-scraped data from LinkedIn provided by Revelio, suggests the economy has lost 250,000 jobs since the start of the year. Tax data from HM Revenue and Customs (HMRC) on the number of payrolled employees also show a reduction in employment in the last two years.
Figure 1.19. Estimates of UK employment since January 2024 (millions)
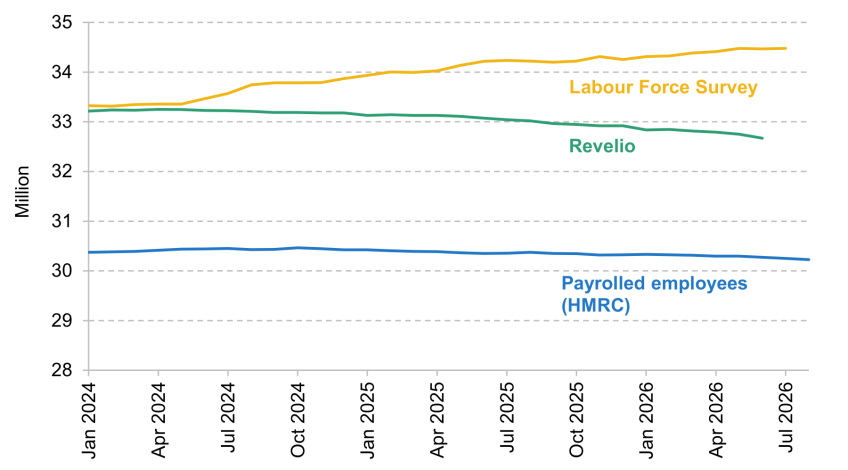
Note: Vertical axis is truncated.
Source: ONS labour market statistics time series (number of people in employment); ONS PAYE Real Time Information (number of payrolled employees); Revelio.
Another measure of the demand for labour is the number of vacancies. Vacancies have continued to fall, hitting 702,000 from June to August 2026. There are now only 0.4 vacancies for each unemployed jobseeker, the lowest rate since the economy reopened in 2021 after the COVID-19 pandemic.
Taken together, this evidence suggests that faster-than-expected economic growth so far this year has not been associated with an increase in demand for labour.
Unemployment likely to rise in 2027, but fall back from 2028
We expect this pattern of weak employment growth and heightened unemployment to continue through 2027. We project that the level of employment will not grow at all in 2027 and the unemployment rate will rise to 5.7%. This is based on our forecast for weak real economic growth in 2027, due to the Iran war shock and because we expect a large proportion of growth in 2027 to be driven by investment and a rebalancing towards capital rather than labour. In its March forecast, the OBR expected the unemployment rate would peak in 2026 and be on a downward trajectory thereafter. As it incorporates the Middle East shock into its forecast this time round, we would expect to see a profile closer to our own, and that of the Bank of England, with a later and more persistent peak as shown in Figure 1.20.
Figure 1.20. Forecasts for unemployment rate each calendar year (%)
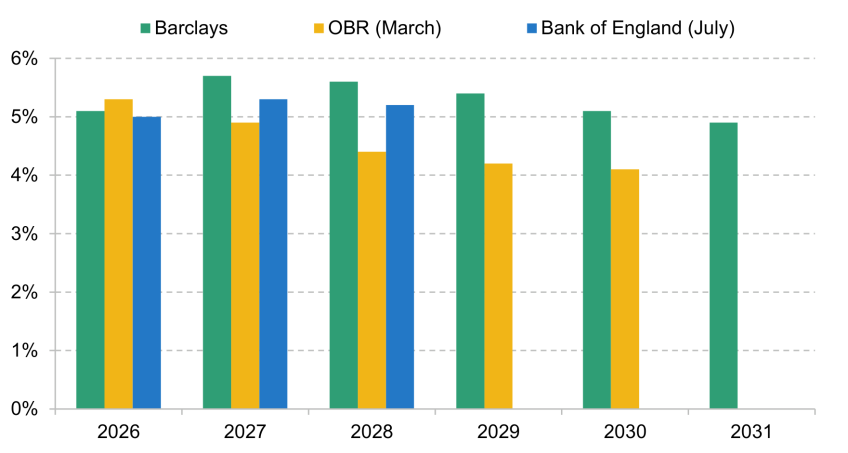
Source: Office for Budget Responsibility’s Economic and fiscal outlook March 2026; Bank of England’s Monetary policy report July 2026; Barclays Research.
After 2027, we expect overall real economic growth to increase and for this to pass through into higher demand for workers. This will lead the unemployment rate to gradually fall back towards a level consistent with stable economic growth and inflation at 2%. However, we expect this adjustment to be slow, given restrictive monetary and fiscal policy, and we do not expect the unemployment rate to fall below the rate expected in 2026 (5.1%) until as late as mid 2030.
We expect falling unemployment to translate into employment rises from 2027 onwards. In our baseline scenario, we expect the employment rate for adults aged 16 and over to increase from 59.6% in 2027 to 59.9% in 2031. This is predominantly driven by falling unemployment, which more than offsets the falling participation rate we discussed above. Rising employment during this period will help boost tax revenues, as discussed in Chapter 2.
Overall, we expect economic growth to be less jobs-rich in our forecast than it has been previously. In our forecast, the employment elasticity of GDP growth is around 0.3, meaning every 1% of additional real GDP generates around a 0.3% increase in employment. This sits around the lower end of the historical range; in the period since 2008, on average the elasticity has been closer to 0.5. This is consistent with our view that rising investment and improvements in labour productivity will be the main drivers of future growth.
Wage growth remains weak, but a key judgement in the medium term
Earnings growth has slowed in the UK so far in 2026 and we expect pay growth to remain low in 2027. Average weekly earnings grew by 4.2% from Q2 2025 to Q2 2026, relative to 4.7% in the previous year, and in the private sector specifically – which is often deemed more reflective of the balance of supply and demand in the labour market – average earnings slowed from 4.8% to 2.9%. Forward-looking surveys of employers suggest earnings growth will stabilise, if not slow further over the coming year as the slack in the labour market gives little bargaining power to workers, even in light of the pickup in inflation.
The implicit consequence, consistent with our view on households and consumers in Section 1.5, is that much of the burden of the terms-of-trade shock from the Middle East will be borne by workers. We expect private sector wages to grow by 2.8% in 2026 and 3.0% in 2027 in nominal terms. This increase is largely an artefact of base effects that have brought down wage growth in the middle of 2026 unwinding in 2027, rather than additional pressure from the labour market. Adjusting for inflation, we expect wages to fall by 0.4% in 2026 and 0.1% in 2027.
Looking beyond 2027, we expect real wage growth to increase. We expect nominal earnings growth to slow slightly to 2.6% on average from 2028 onwards, but because we expect inflation to fall by more, this is equivalent to a 0.6% increase in real-terms wages each year on average. The key driver for this is increased productivity growth, discussed in Section 1.6. We assume that workers accrue just over half of the gains from this productivity growth through higher earnings growth, in line with historical averages of UK labour share, with the rest of the gains going to firm and capital owners. Given the investment and capital-intensive nature of the productivity improvements we are expecting, there are risks this may overstate the pass-through in the near term as investors and capital owners recoup their initial costs. This would act to lower earnings growth relative to our baseline forecast.
We do not expect workers to be able to bargain for higher wage growth in later years to compensate for the real-terms wage cuts in 2026 and 2027. This is because we expect the unemployment rate to remain elevated through 2028 onwards and this gives workers limited power to bargain up wages. A simulation of future wages and inflation based on a model often cited by the Bank of England suggests that an inflation spike of the nature we expect in our baseline does not have a persistent effect on wages, if the spike occurs during a period where there is a loose labour market, as we currently assess to be the case. This is therefore likely to be the case for the recent Iran-war-related inflation shock.
However, there is considerable uncertainty over the path for wage growth and different forecasters will take different views. As shown in Figure 1.21, the OBR’s March projections had a lower path for nominal earnings growth, which dropped to 2.1% year-on-year growth in 2028 and averaged a little over 2% in the medium term. It is likely that the OBR will increase its forecast for wage growth later this month to reflect higher-than-expected inflation, but to what extent is uncertain.
Figure 1.21. Forecasts for nominal average weekly earnings (% year on year)
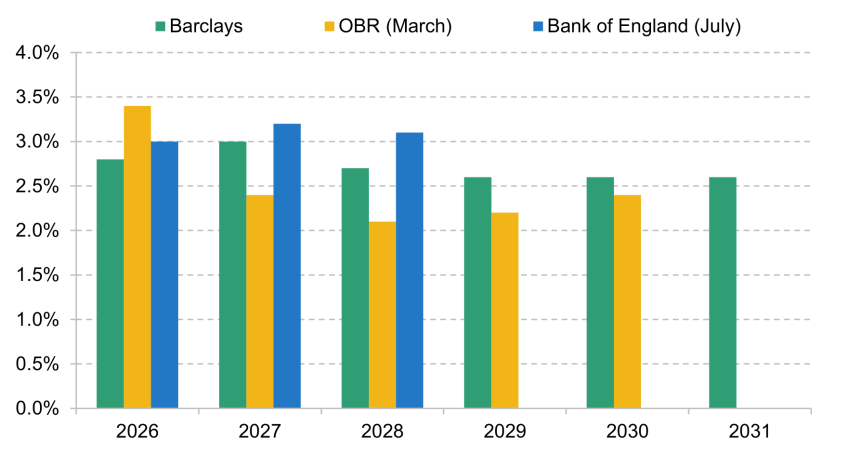
Note: The OBR uses a national accounts method to calculate nominal average weekly earnings, whereas our forecast is drawn from the ONS labour market data, and is for private sector earnings excluding bonus pay. Historically, the growth rates vary little.
Source: Office for Budget Responsibility’s Economic and fiscal outlook March 2026; Bank of England’s Monetary policy report July 2026; Barclays Research.
In contrast, the Bank of England has consistently forecast higher wage growth than the OBR in the medium term. In its latest forecasts, the Bank forecasts wage growth of 3.1% on average each year from 2026 to 2028 relative to 2.8% in our forecasts. These differences in forecast nominal wage growth are due to a combination of different views on different factors including: the path for inflation; the extent to which an inflation shock passes through to wages; medium-run productivity growth; and the share of future productivity gains that workers receive. For instance, the Bank of England estimates assume firms’ profit margins do not add to inflation in the medium term, leaving more space for wages to expand without pushing up inflation. While this may be true in the medium term, we think in the near term the rebuilding of margins against a backdrop of weak demand is likely to weigh against wage growth. Given the importance of nominal wage growth for tax receipts (see Chapter 2) and public sector pay pressures (see Chapter 6), forecasts for nominal earnings growth will be a crucial judgement for the OBR.
1.8 Summary of baseline scenario
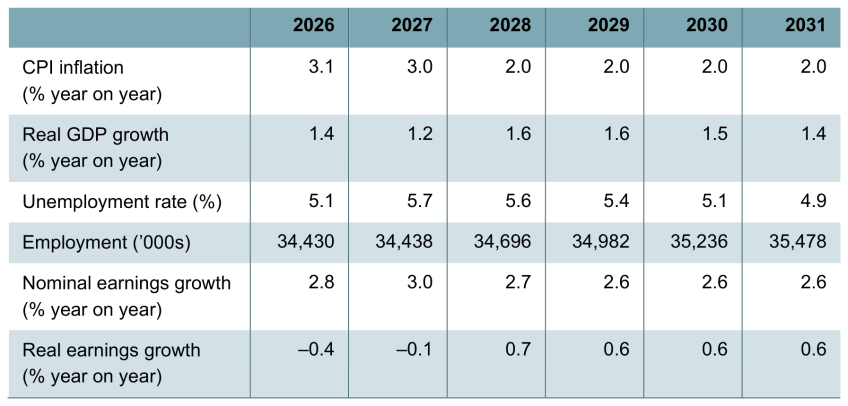
In our baseline scenario, we assume there is some resolution to the Iran war in the next few months, so that global oil prices jump in 2026 but then gradually decline from 2027 to 2030. Rising energy prices have already pushed up inflation to 3.1% and we expect it to increase further until the first quarter of 2027. We do not expect the energy price rise to feed through into more generalised inflation and so we expect inflation to ease back towards the Bank of England’s 2% target as global oil prices fall.
The Iran war shock will also make us poorer as a country. We expect real (inflation-adjusted) GDP to grow by only 1.2% in 2027. Following the easing of the shock, we expect GDP growth to speed up to 1.6% in 2028, 1.6% in 2029 and 1.5% in 2030. We expect the unemployment rate to also rise in 2027 due to the Iran war shock before gradually falling back through our forecast.
We expect nominal earnings growth to increase slightly in 2027 and to reduce slightly before growing steadily in the later years of the forecast. However, we do not expect nominal earnings growth to increase sufficiently to offset the inflation jump, and so we expect real earnings to fall in 2026 and 2027 before growing by on average 0.6% each year from 2028 to 2030.
Table 1.1 summarises the key economic outcomes in our baseline scenario.
Table 1.1. Values of key economic indicators each year in Barclays baseline scenario
Source: Barclays Research.
1.9 Alternative economic scenarios
The above forecasts reflect a baseline scenario, which we consider a reasonable central forecast given the set of information we have at this time. However, it is predicated on a necessary set of assumptions about key areas which may or may not come to pass. To see what impact different choices about these assumptions might have, we look at scenarios in which we vary them and model the alternative path for the economy.
Scenario 1. The economic consequences of delayed peace
In our baseline projections, there is an implicit assumption that a resolution is found for the conflict in the Middle East in the coming months, or at least that it eases enough that energy prices fall through 2027, slowing inflation. However, there is no clear end in sight, and many financial market participants are nervous that downward-sloping gas and oil futures curves – capturing that buyers are currently willing to pay more for near-dated contracts than for energy delivered further in the future – may be giving a false signal about the ultimate trajectory of prices. Here, we consider the potential impact of energy prices remaining higher for longer.
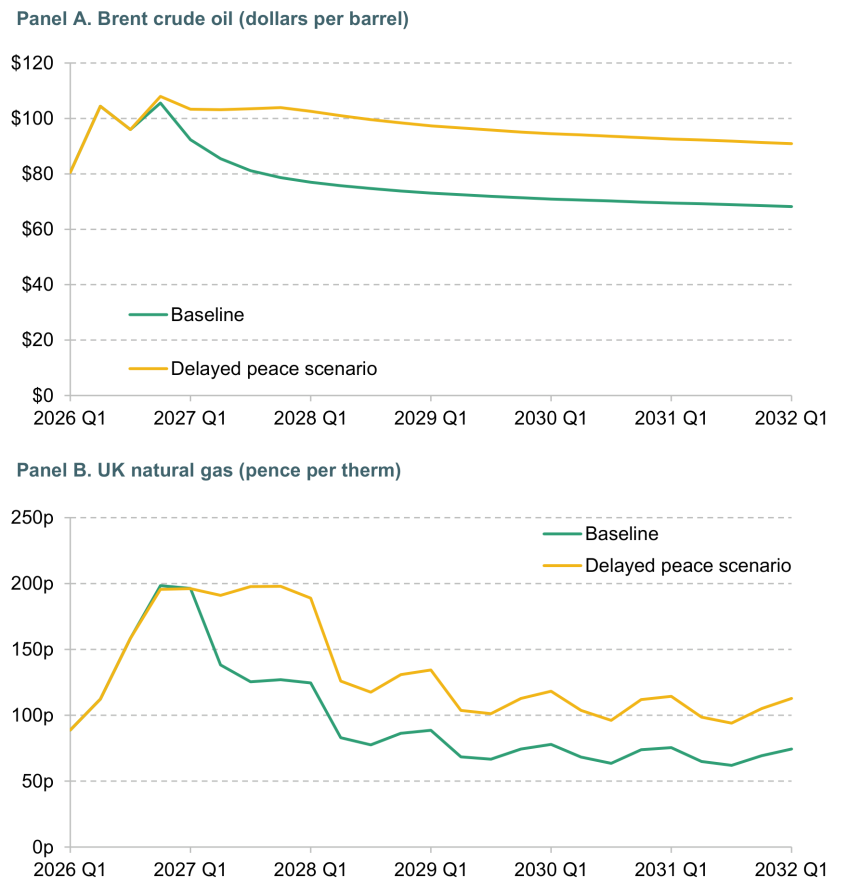
In particular, we analyse what it would mean if gas and oil prices were to stay at their current levels through 2027 before falling broadly in line with the slope of the existing curves thereafter. In specific terms, this would amount to gas prices that were roughly 33% higher in 2027 than in our baseline projections (Figure 1.22). We focus on the direct economic effects of higher energy prices, rather than the additional global uncertainty that might also follow from a prolonged conflict.
Figure 1.22. Energy prices under Barclays baseline scenario and alternative scenario with delayed peace
Source: Bloomberg; Barclays Research.
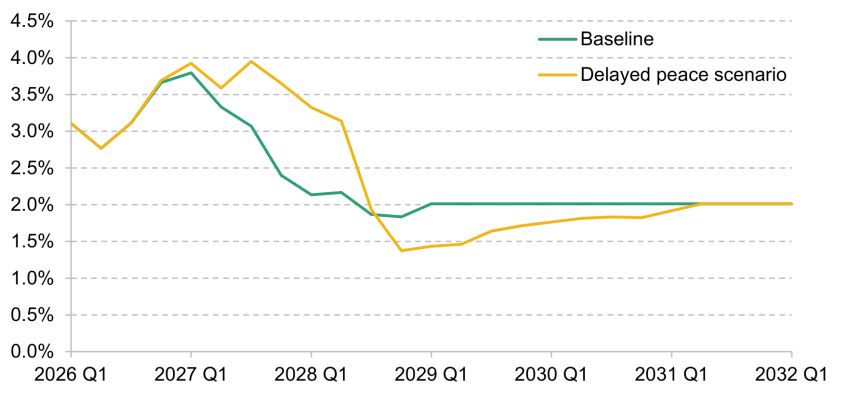
Our modelling suggests this would raise inflation by 1.25 percentage points (ppts) compared with the baseline in Q4 2027, keeping headline CPI above 3.5% for the entirety of next year. However, a longer energy price spike implies a larger drag on inflation when the shock begins to unwind. By mid 2028, year-on-year inflation would actually be lower than in our baseline, temporarily falling to as low as 1.4% in Q4 2028 and staying below 2% in 2029 and 2030, as shown in Figure 1.23.
Figure 1.23. Annual CPI inflation in Barclays baseline scenario and alternative scenario with delayed peace
Source: Barclays Research.
The additional near-term inflation would likely cause a more aggressive response from the Bank of England. However, if the Bank was confident that persistent inflation would not become embedded in expectations – and, crucially, if it knew with a reasonable degree of confidence that elevated energy prices would last only for another year – we might still expect a relatively muted increase in Bank Rate in 2027. We assume it would peak 0.5 ppts higher at 4.75%, before falling back to the same rate as in our baseline scenario by the end of 2028.
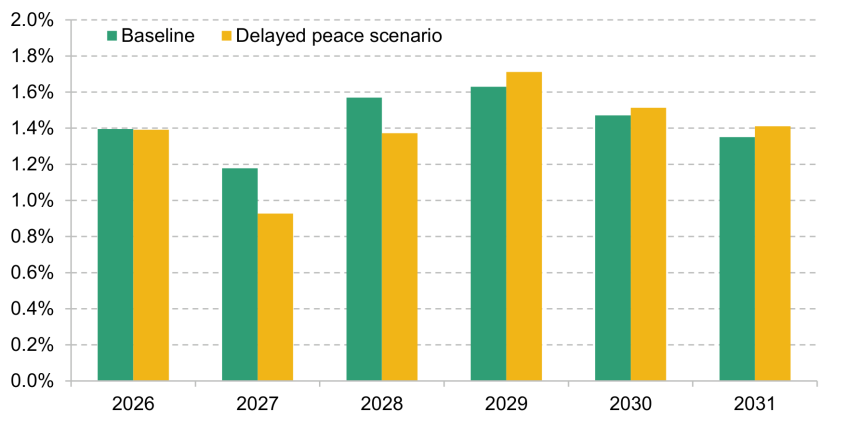
Even with a reasonably muted response from the Bank, the larger terms-of-trade shock from higher energy prices and slightly tighter financial conditions would lead to lower real GDP growth: 0.3 ppts lower growth in 2027 than in our baseline scenario and 0.2 ppts lower in 2028 (Figure 1.24). It would also shift up the unemployment rate profile by roughly 0.2 ppts, implying around 70,000 more people unemployed at the end of 2028.
Figure 1.24. Forecasts for annual growth in real GDP (% year on year)
Source: Barclays Research.
Scenario 2. How much could the UK benefit from an AI investment boom?
Recent growth has been driven by investment and activity in ICT and AI-related industries. Output in computer programming, consultancy and related activities grew by 9.3% in the first half of the year, while in the second quarter (April–June), business investment in ICT was 8.3% higher than in the previous quarter. This sector alone contributed roughly 65% of the total business investment growth in Q2, and incorporates investment in software, hardware, data centres and infrastructure. This is, on a smaller scale, akin to what has been seen in the US in recent years.
Our baseline forecast assumes this investment continues, but at a less aggressive pace. However, here we ask: ‘How would the outlook differ if the UK could continue to grow AI-related activity and investment?’.
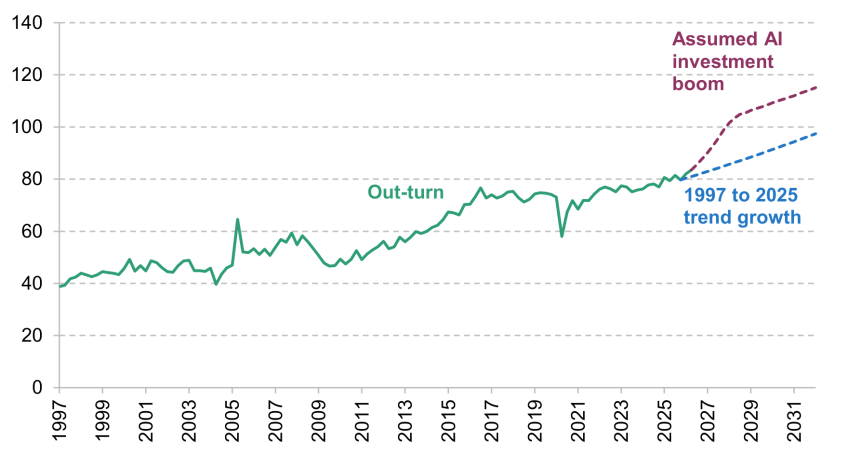
In particular, we consider the impact of a period of sustained strong AI-related investment in the UK, where business investment grows at a pace of 2.5–3.5% quarter on quarter over the next two years, driven by ICT equipment, before returning to growth consistent with our baseline forecast for investment, as shown in Figure 1.25. This is aligned with AI investment adding 0.8 ppts to annual US GDP growth in 2025. As a reference point, UK business investment growth averaged 0.6% quarter on quarter from 2015 to 2025, while in the first two quarters of 2026, the average was 2.4% quarter on quarter.
Figure 1.25. Business investment out-turn since 1997 and trend growth up until 2025, and AI investment boom (£ billion, 2024 prices)
Note: Solid lines show out-turn and dashed lines are forecasts.
Source: Barclays Research.
We then consider two possible scenarios for the way that an AI boom could play out: one in which this investment constitutes a capital deepening, but has no other beneficial supply-side effects; and another where AI leads to wider improvements in productivity, increasing total factor productivity (TFP) – the rate at which a given level of labour input and capital input is transformed into output. While both raise the level of real GDP, only the latter changes the long-term growth rates the economy can reach and sustainably maintain.
Narrow capital deepening
In the first scenario, there would be a near-term growth boost from investment that adds to the capital stock. If the beneficial supply-side effects of the investments were fairly small, this additional demand would reduce spare capacity in the economy and increase inflation (Ambrosino, Chan and Tenreyro, 2026).
Limited supply-side effects could be plausible because the increase in the capital stock associated with the investment described would actually be relatively small, for three reasons. Investment in the ICT sector comprises a small share of business investment (about 15%). Investment as a flow is relatively small compared with the stock of capital. And we also expect the speed of capital depreciation to increase, as AI-related investments generally tend to be replaced quite quickly when compared with other types of investment (Barclays, 2026b).
This means that in the near term, an AI boom that was not associated with widespread improvements in TFP would represent a positive demand shock to the economy.
AI will likely change the demand for skills from employers, which may have negative impacts on hiring in sectors most exposed to AI, particularly for junior positions (Klein Teeselink, 2025). However, job losses in certain sectors may be offset by higher demand for labour in others, where AI increases demand (Barclays, 2026c). There are also large parts of the workforce that are relatively unexposed to AI, such as hospitality services. General-purpose technologies, such as the internet, have not thus far led to a decrease in employment, which may well hold once more for AI. As such, even if AI affects which sectors people are employed in, and potentially affects employment differentially across age groups, the aggregate impact may not be in a significant increase in overall unemployment.
If increased AI investment had no spillovers to TFP, we assume that firms’ demand for labour would increase to meet the increase in aggregate demand, but to a lesser extent than the historical relationship between labour demand and real GDP growth would imply, given the rebalancing of capital and labour in the economy to a higher capital ratio.
In this case, we would expect the output gap to be reduced, and for inflation to rise. This in turn would likely lead to a higher path for the Bank Rate, weighing on growth and reducing the extent to which CPI would overshoot its 2% target in the medium term. For wages, we assume that around two-thirds of the increase in labour productivity feeds into stronger wage growth, which raises average weekly earnings growth, but the size of this impact would be minimal as the increase in productivity is only coming from capital deepening in this scenario.
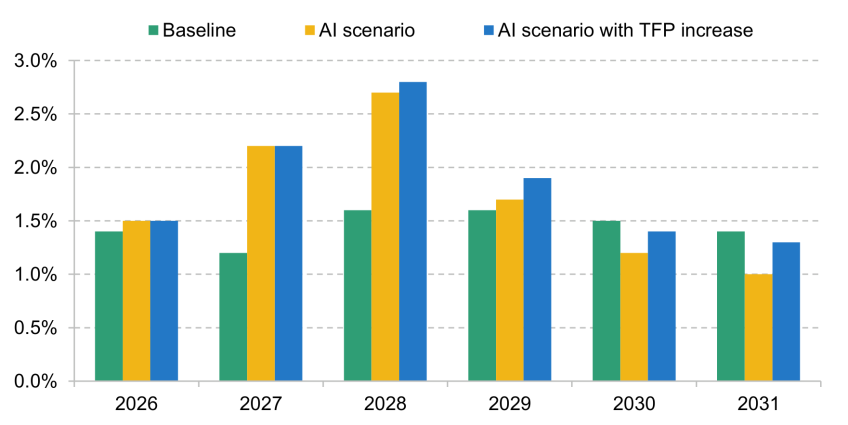
We estimate that real GDP growth would average 2.7% year on year in 2028, 1.1 ppts higher than in our baseline scenario (Figure 1.26). However, we would expect annual growth at the end of our forecast horizon to be lower than in our baseline, as the AI investment cycle unwinds, and restrictive monetary policy would weigh on activity to curb the additional demand-induced inflation. This would leave the level of real GDP around 1.6% higher at the end of our forecast horizon than in our baseline scenario.
Figure 1.26. Forecasts for annual real-terms GDP growth in baseline scenario and two AI scenarios (% year on year)
Source: Barclays Research.
Increases in total factor productivity
A key part of the positive narrative around developments in AI is that, as a general-purpose technology, it can lead to improvements in productivity beyond narrow capital deepening. In this scenario, we assume TFP growth increases by between 0.1 ppt and 0.5 ppts more per year than in our baseline, reaching 1% annually by 2030. This adds a further 0.5% to the level of GDP by 2030 and, importantly, as it is supply-side driven, would not add further to inflation. There are a wide range of estimates for the impact of AI on TFP growth, with our assumption falling more towards the upper end of the range, although it brings TFP growth in line with the OBR’s baseline assumption (Cerutti et al., 2025).
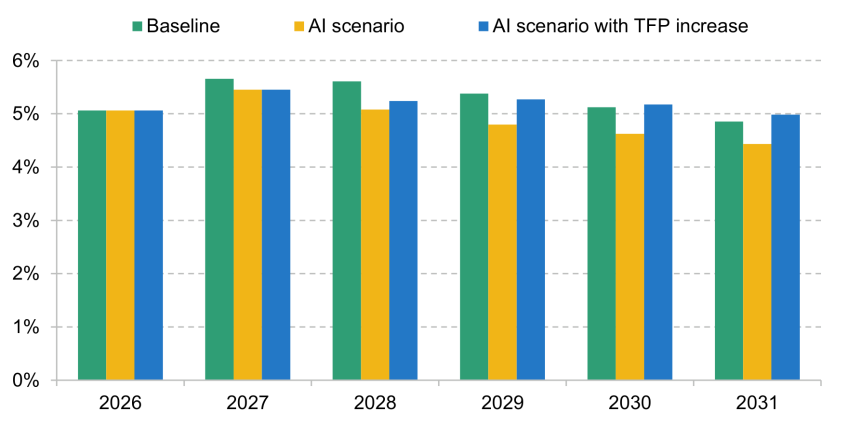
If AI investment was to spill over to increase TFP growth, this would lead to higher potential growth, which increases the growth rate in the latter part of the forecast horizon. Annual real GDP growth is on average 0.2 ppts higher after 2029 in this scenario than in our scenario with no spillovers to TFP growth, and would accelerate past our baseline growth profile beyond 2031. As shown in Figure 1.27, the unemployment rate path is higher than in the scenario with only a capital deepening, due to an assumed increase in the non-accelerating inflation rate of unemployment (NAIRU) as firms substitute away from labour. However, while the rise in the NAIRU dominates in the latter stages of the forecast horizon, there would still be a boost in labour demand in the near term. Overall, we would expect the level of real GDP to be 2.5% higher than our baseline forecast by the end of 2031.
Figure 1.27. Forecasts for annual unemployment rate under baseline scenario and two AI scenarios (%)
Source: Barclays Research.
1.10 Conclusion
The UK economy faces a number of headwinds at a time when policy, both fiscal and monetary, is likely to have to remain restrictive and unable to support demand growth in a meaningful way. The near-term outlook will be dominated by developments in the Middle East, which will drive a squeeze in the spending power of households and reduce the incentives for firms to invest. Without a relatively quick resolution that allows energy prices to begin to fall in coming months, this drag could be even more material. Weighing against that, though, there is a nascent trend emerging for rising investment in technology and improving productivity that could raise growth and standards of living. It is against this uncertain and conflicting backdrop that the Chancellor will deliver his first Budget on 28 October.
Appendix 1A. Conditioning assumptions
The OBR in March based its conditioning assumptions – market-implied expectations of the likely path of several components of its economy forecast – on the 10-day average up until 22 January, with a later cut-off date for interest rates expectations (30 January). This was around five weeks before the Spring Forecast (3 March). We will not know precisely which 10-day window the OBR will use for its upcoming forecast until it is published. But following a similar schedule in relation to the date of the upcoming Budget would suggest a conditioning period in the 10 days up until mid to late September.
Energy prices. The outlook for energy prices has shifted considerably since the OBR’s last forecast. During the March forecast’s conditioning period, the Brent crude oil price averaged $65 per barrel, but the spot price now stands at around $100 per barrel, a roughly 50% increase. A similar picture can be seen for gas, with the spot price of UK natural gas averaging 89 pence per therm in the March conditioning window, and now sitting at around 185 pence per therm (more than double). Gas prices on futures markets have also risen, adding to price pressures over a more protracted period.
Figure 1A.1. Out-turn and forecast energy prices

Note: Market pricing is as of 24 September 2026.
Source: Barclays Research.
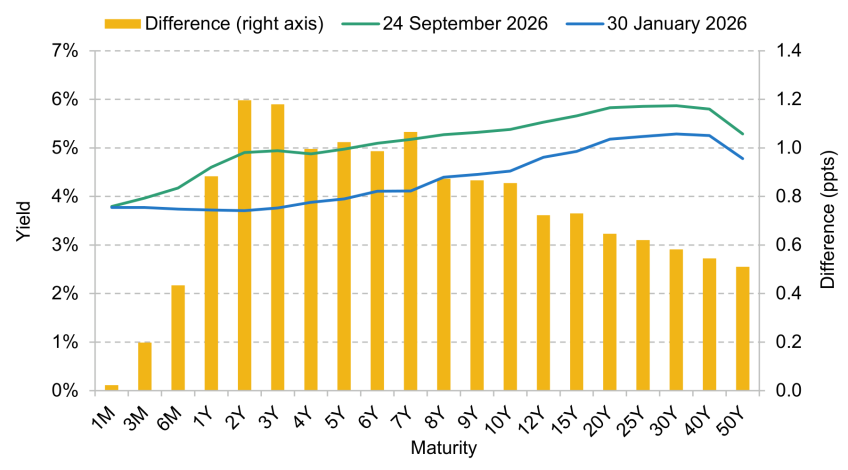
Interest rates. The Middle East conflict has also impacted the outlook for UK interest rates and bond yields since March. As discussed in Section 1.4, the conditioning path of the March forecast assumed Bank Rate would fall, whereas the new forecast in October will assume a rise from current levels of around 1 percentage point. In government debt markets, the 10-year nominal yield is now 0.9 ppt higher than in March at 5.4%, while the 20-year yield has risen around 0.6 ppt to 5.8%. The upwards shift in yields has been primarily driven by an upwards shift in the expected path for central bank policy rates, as the inflation outlook has worsened. At the time of the last OBR forecast, markets had expected the Bank of England to cut Bank Rate to around 3.25% by the end of 2026 and keep it there. The new OBR forecast is likely to be conditioned on an outlook that expects 1 ppt of hikes over the next 12 months (to 4.75%), a swing of 1.5 ppts.
Figure 1A.2. UK gilt yield curve
Source: Bloomberg; Barclays Research.
The Bank of England recently announced that it would modify its existing quantitative tightening programme to stop selling gilts with a maturity date later than 2049 (in 23 years’ time) to the market. This helped to lower long-term gilt yields on the day, but the continued worsening of the energy inflation outlook has seen yields continue to increase since. For more on the detail and fiscal implications of this, see Chapter 3. Market prices continue to suggest yields will be higher still at the end of our forecast horizon, with the 10-year yield rising to 6.2% by 2032.
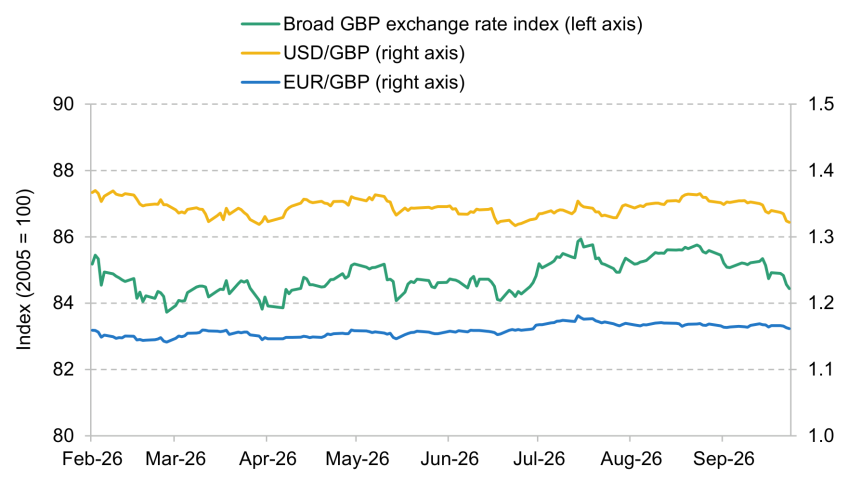
Exchange rates. Although the outlook for inflation and gilt yields has shifted, the outlook for sterling has been less volatile, due to the global nature of the inflation shock. On a trade-weighted basis, sterling has been remarkably stable, staying in a range of 84 to 86 since March, as the dollar (USD) has strengthened but sterling has appreciated relative to the euro (EUR). Fiscal policy is a more pertinent risk to sterling at the moment, as any sign of a loosening of the fiscal stance would likely put pressure on the pound. Were we to see a more significant swing in sterling in the coming months, this would drive a different path for our inflation and demand outlook, with lower sterling (stronger US dollar or euro) increasing inflationary pressures but making UK goods and services more internationally competitive.
Figure 1A.3. Sterling exchange rates since February 2026
Source: Bank of England; Bloomberg; Barclays Research.
References
Ambrosino, L., Chan, J. and Tenreyro, S., 2026. Productivity and inflation dynamics. Bank of England Staff Working Paper 1201, https://www.bankofengland.co.uk/working-paper/2026/productivity-and-inflation-dynamics.
Barclays, 2026a. All eyes on gas prices. Barclays Live.
Barclays, 2026b. Productivity: strong headlines, softer reality. Barclays Live.
Barclays, 2026c. The market for skills. Barclays Live.
Cerutti, E., Garcia Pascual, A., Kido, Y., Li, L., Melina, G., Tavares, M. M. and Wingender, P., 2025. The global impact of AI: mind the gap. IMF Working Paper 25/76, https://www.imf.org/-/media/files/publications/wp/2025/english/wpiea2025076-print-pdf.pdf.
Emmerson, C., Ridpath, N. and Stockton, I., 2025. Risks and challenges for the public finances. IFS Green Budget 2025, https://ifs.org.uk/publications/risks-and-challenges-public-finances.
Home Office, 2026. Monthly entry clearance visa applications, August 2026. https://www.gov.uk/government/statistics/monthly-entry-clearance-visa-applications-august-2026/monthly-entry-clearance-visa-applications-august-2026.
Kay, J. and King, M., 2020. Radical Uncertainty: Decision-Making for an Unknowable Future. Bridge Street Press.
Klein Teeselink, B., 2025. Generative AI and labor market outcomes: evidence from the United Kingdom. SSRN, https://ssrn.com/abstract=5516798.
Meaning, J., 2025. Economic outlook: navigating narrow paths. IFS Green Budget 2025, https://ifs.org.uk/publications/economic-outlook-navigating-narrow-paths.
Office for National Statistics, 2026a. Investigating non-response to the Labour Force Survey using administrative data. https://www.ons.gov.uk/employmentandlabourmarket/peopleinwork/employmentandemployeetypes/methodologies/investigatingnonresponsetothelabourforcesurveyusingadministrativedata.
Office for National Statistics, 2026b. Labour market overview, UK: September 2026. https://www.ons.gov.uk/employmentandlabourmarket/peopleinwork/employmentandemployeetypes/bulletins/uklabourmarket/september2026.
Office for National Statistics, 2026c. Public sector finances, UK: August 2026. https://www.ons.gov.uk/economy/governmentpublicsectorandtaxes/publicsectorfinance/bulletins/publicsectorfinances/august2026.
Office for National Statistics, 2026d. Measuring labour productivity: our new approach. https://blog.ons.gov.uk/2026/09/17/measuring-labour-productivity-our-new-approach/.
Pill, H., 2026. Homophones. Remarks, Bank of England, https://www.bankofengland.co.uk/speech/2026/september/remarks-at-the-edinburgh-chamber-of-commerce.
Acknowledgements
This chapter has been produced as part of the IFS Green Budget 2026. It is by authors from Barclays, who have written specific chapters for the 2026 Green Budget, covering topics (the macroeconomic outlook, bond market and Asset Purchase Facility) where their expertise complements that of IFS.
The 2026 edition of the IFS Green Budget is funded by the Nuffield Foundation, Barclays and the Economic and Social Research Council (ESRC) through the Centre for Microeconomic Analysis of Public Policy (CPP). IFS is an independent Research Institute.
Endnotes
Authors

Jack Meaning
Cian Hennigan
More from IFS
Understand this issue


Policy analysis


Academic research


