
Downloads
Download chapter pdf
PDF | 860.83 KB
Key findings
- The economic backdrop to this Budget is a difficult one. Following a positive start to the year, growth is decelerating, and the growth we have seen has been driven disproportionately by the public sector and net trade, as opposed to private domestic demand. The unemployment rate has risen 0.5 percentage points in the past 12 months and is now the highest it has been since 2016, outside of the COVID-19 pandemic. While the official Labour Force Survey suggests that employment growth has been strong, we think a broader set of indicators points to a much weaker assessment. Meanwhile, inflation remains well above the Bank of England’s 2% target, and higher than that of international peers. This is making the Monetary Policy Committee cautious about further cuts to interest rates, which remain in restrictive territory. Against this backdrop, the Chancellor is likely to need to find a sizeable fiscal consolidation at the Budget to meet her fiscal rules.
- The outlook in the very near term is one of economic softening. We forecast growth will decelerate further in the second half of this year, with the economy growing at half the rate it did in the first half. Consumption and business investment will likely be muted, as uncertainty remains elevated, monetary policy has remained in restrictive territory and households continue to build savings. Surveys suggest businesses remain cautious, and dissuaded from investing by squeezed margins and high financing costs.
- We expect the Bank of England to continue reducing interest rates to the point where they are no longer acting as a headwind to the economy. Our forecast assumes Bank Rate reaches 3.5% in the first half of 2026. Inflation is likely to have peaked already in September 2025, spurred by a combination of energy price base effects, food price inflation, and changes in taxes and prices set by government. Headline CPI inflation should drop back to target in the first half of next year as the effect of the tax changes announced in last October’s Budget drops out of the calculation. As monetary policy easing starts to feed through more meaningfully, we should see a cyclical rebound in activity in 2026 and 2027 as the economy starts to absorb existing slack. In our baseline scenario, the unemployment rate is forecast to peak at 5.1% in 2026 before gradually falling.
- The medium-term outlook for the UK economy will be defined by three trends: the extent to which increasing productivity growth can offset slowing inward migration and population growth; the ability of the domestic private sector to take the baton from the public sector and net trade as the key driver of growth; and the success or otherwise of policymakers to navigate the narrow path in the transition.
- In our forecast, annual growth in total factor productivity increases gradually and reaches 0.4% by 2030. This would be high by the standards of recent history, but falls short of the 1% growth assumed by the Office for Budget Responsibility (OBR) in its March forecast. We expect the OBR to make a downward revision to its own productivity growth assumption of between 0.1 and 0.2 percentage points per year, and this is perhaps the single biggest forecast judgement the OBR will make. Such a downgrade would still leave the OBR more optimistic than our own baseline forecast. We also explore a scenario in which our forecast is surprised to the upside by a larger and faster improvement in productivity, more aligned with the OBR’s from March, and find it suggests the level of real output would be 2% higher by 2030.
- Beyond the near-term fiscal implications, productivity growth will likely be the single biggest determinant of living standards over the longer run. In our baseline forecast, increasing productivity enables real wage growth over the medium term. Despite falling average hours, total hours worked increase and real incomes grow at an average of 1.1% annually. Alongside a gradual reduction in the saving rate from 10.8% in June to 9.3% in 2030, we expect this to lead to household consumption growth of 1.4% per year in the medium term. The path of household saving is another key judgement, and our modelling suggests saving will stay higher for longer than was assumed in the OBR’s March forecast. If the OBR had instead assumed the saving rate followed the path suggested by our modelling, it would have forecast real consumption to be more than 2% lower by 2030.
- Rising productivity and lower interest rates will enable businesses to invest over the medium term, raising the level of investment as firms rebalance their capital-to-labour ratios in favour of capital. Acting in the other direction, we expect fiscal policy to be a headwind to demand throughout the forecast, as we move from a cyclically adjusted primary deficit of 1.5% in 2025 to a surplus by 2030. This continued fiscal consolidation means that the negative output gap does not fully close by the end of our forecast horizon.
- We expect the Chancellor to be able to make the required consolidation at the upcoming Budget with relatively limited damage to real GDP growth (–0.25% at peak) and mild disinflation. However, this is predicated on her doing so without applying measures that, mechanically or otherwise, add substantially to near-term inflation. We model a scenario in which the Chancellor delivers a fiscal consolidation through an increase in VAT, raising inflation at a point when inflation is already high enough – and central bank credibility under enough scrutiny – that monetary policymakers are not comfortable looking through the temporary price-level shock for fear of second-round inflationary effects. In this scenario, we find that the negative effect on GDP would be twice as big at its peak as if the same consolidation was done through non-inflationary taxation, and interest rates would remain higher for longer, requiring a more aggressive easing cycle in 2027.
1.1 Introduction
The economic backdrop to this Autumn’s Budget is a difficult one. Growth is decelerating and expected to slow further in the second half of the year. Unemployment has been on an upward trend since mid 2022 and is at the highest rate since December 2016, absenting the COVID-19 pandemic. Broader metrics of the labour market show clear signs of softening. Meanwhile, inflation remains considerably above the Bank of England’s 2% target, making the Monetary Policy Committee cautious about cutting rates for fear of de-anchoring expectations and embedding structurally higher inflation. Lastly, fiscal policy itself looks likely to require a substantial consolidation to stay the right side of the Chancellor’s fiscal rules, leaving her with a menu of unenviable choices to fill the gap.
Turning our gaze from the backdrop to the outlook, the view is, perhaps, more appealing. Our five-year forecast is driven in the near term by cyclical factors. As the global trading order (re)finds its equilibrium, uncertainty diminishes and the impact of recent monetary policy easing feeds through, activity should pick back up, providing a bounce in 2026 and early 2027. Inflation should fall back to target relatively quickly as recent price-level shocks dissipate against a backdrop of both a loosening labour market and broader economic slack. This should allow for the further monetary easing that is required to absorb economic slack, bring down unemployment and maintain inflation at 2% over the medium term.
The outlook for the latter half of this parliament will depend on more structural features such as trends in population growth and migration flows, the extent to which current elevated saving rates among households are the new normal or can be expected to ease, and, perhaps most importantly, the path for productivity. On these, our assessment is for improvement from the status quo of the last decade, but still short of the OBR’s forecasts from March (Office for Budget Responsibility, 2025).
The path to medium-term balance is beset with risks on both sides. It would not take much in terms of additional near-term inflationary pressure to derail a Bank of England easing cycle, even if the inflationary impulse were one that in other circumstances might be considered temporary. Similarly, the Budget itself represents a moment of risk, given the potential for any adverse market reaction to feed through into wider borrowing costs for businesses and households (see Chapter 2 for a discussion). Conversely, while we assume a modest pick-up in total factor productivity from the depressed rates of recent history, if this were to come through faster or larger in size, then the additional economic growth this would imply could mitigate many of the downside risks.
In what follows, Sections 1.2, 1.3 and 1.4 consider the outlook for GDP, households and firms, respectively. Section 1.5 examines the global economic context, including the trading environment, before Section 1.6 turns to developments in the UK labour market. Section 1.7 provides a discussion of the inflationary context and outlook. Section 1.8 draws out the implications for both fiscal and monetary policy in the months and years ahead, while Section 1.9 looks at the possible consequences of the Chancellor conducting a fiscal consolidation that raises near-term inflationary pressures. Section 1.10 analyses perhaps the most important determinant of the UK’s longer-term economic outlook – productivity – before Section 1.11 concludes.
1.2 GDP and activity
Real GDP growth decelerating
The UK economy has grown by 0.9% in the first half of 2025, faster than the 0.6% the OBR had expected at the time of its March Economic and Fiscal Outlook. This compares with growth over the same period of 0.8% in the US and 0.7% in the Euro Area. We expect the second half of the year to show a deceleration as ongoing elevated uncertainty, both global and domestic, weighs on businesses and consumers, as do financial conditions, which have tightened in recent months despite monetary policy having eased.
Despite this slowing, we expect real GDP growth for the year as a whole to be 1.4%, up from 1.1% in 2024. This would place the UK second in the G7 in terms of annual growth (Barclays, 2025a; OECD, 2025). Recent revisions to the national accounts (the Blue Book) have also raised the level of measured GDP. Nominal GDP is now estimated to have been 2.2% higher in Q2 2025 than the OBR had expected it to be in March.
A handover from public spending and net trade to private domestic demand is required for medium-term growth
If we look under the hood, the recent economic picture appears less resilient, however. Only half of the 0.9% increase in real GDP so far in 2025 has come from private domestic demand (private consumption plus business investment), despite these sectors accounting for three-quarters of overall activity. This has been a feature of UK growth for a while, with private domestic demand just 2% above its pre-COVID level compared with an increase of 16% in the rest of the economy over the same time frame. The public sector and net trade have instead played an outsized role in driving recent growth, alongside an expanding population, itself driven by net migration. Real GDP per capita grew just 0.1% year on year in 2024, followed by 0.7% in the first half of 2025.
This presents two key questions for the medium-term outlook of the UK economy. First, with global growth expected to slow this year and next, and government spending constrained, to what extent will the private sector fill the gap? Second, with government policy aimed at reducing net migration, to what extent can much-needed productivity improvements step in as the underlying driver of growth?
Ultimately, we expect annual real GDP growth to average 1.4% from 2026 onwards as strengthening consumption and investment are able to offset the fiscal headwinds and productivity gains increase the UK potential growth rate. This compares with 1.8% in the OBR’s March forecast. As shown in Figure 1.1, this is more in line with forecasts published by the International Monetary Fund in July, although we have a more frontloaded profile of the growth forecast, predominantly due to having taken on the more recent data updates from the Office for National Statistics (ONS).
Figure 1.1. Annual real GDP growth (% year on year)
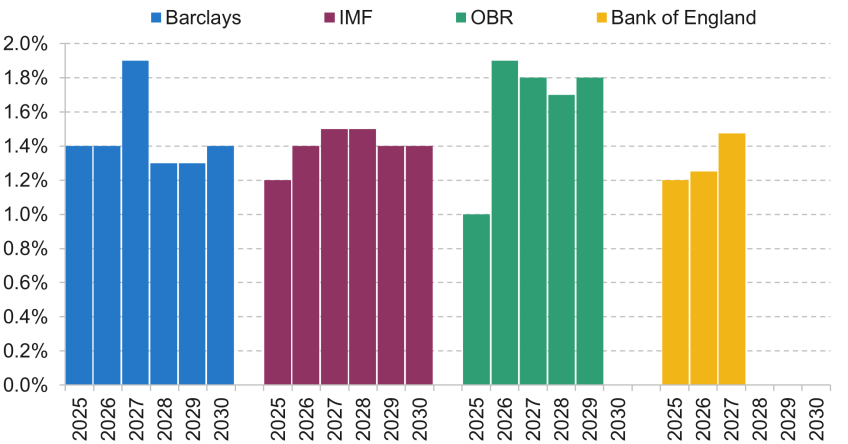
Note: Forecasts are only available from the Office for Budget Responsibility up to 2029–30 and from the Bank of England up to 2027–28.
Source: Office for Budget Responsibility, Economic and Fiscal Outlook, March 2025; Bank of England, Monetary Policy Report, August 2025; International Monetary Fund, World Economic Outlook update, July 2025; Barclays Research.
1.3 Households
Consumption is soft in the near term due to elevated saving
We expect private consumption growth to average 0.9% year on year in 2025, continuing the recent trend for underperformance relative to growth in headline GDP. Consumer confidence remains muted and household consumption growth is likely to be moderated by a continuation of high saving rates. In Q2 2025, the household saving rate rose to 10.8%. It has now risen 7 percentage points from its level in 2022 (4.0%), with the increase focused predominantly in the rate of cash saving, rather than in households’ pensions.1 This strength in saving is the corollary to relatively weak consumption growth in the face of rising real incomes.
During the pandemic, households built up excess savings that allowed them to smooth consumption through a period of falling real incomes in 2021 and 2022 by dissaving. However, across a range of measures, these excess savings balances have been eroded, by households dipping into them to maintain spending in the face of high inflation. In real terms, we now estimate that the stock of excess savings is in deficit, as shown in Figure 1.2, with real household liquid balances persistently below trend, suggesting households may take time to build these back.
Figure 1.2. Household real liquid deposits since March 2019 compared with pre-pandemic trend
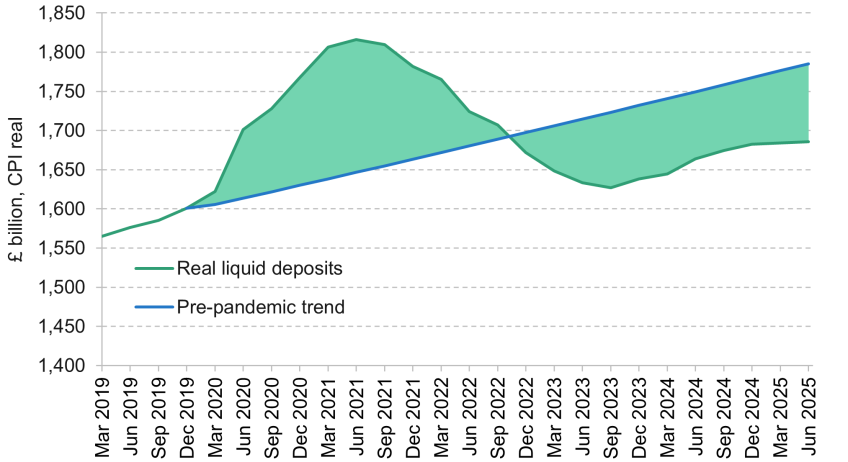
Note: ‘Pre-pandemic trend’ extrapolated forwards from average growth rate in 2018 and 2019.
Source: Barclays Research.
Easing saving will deliver a modest boost
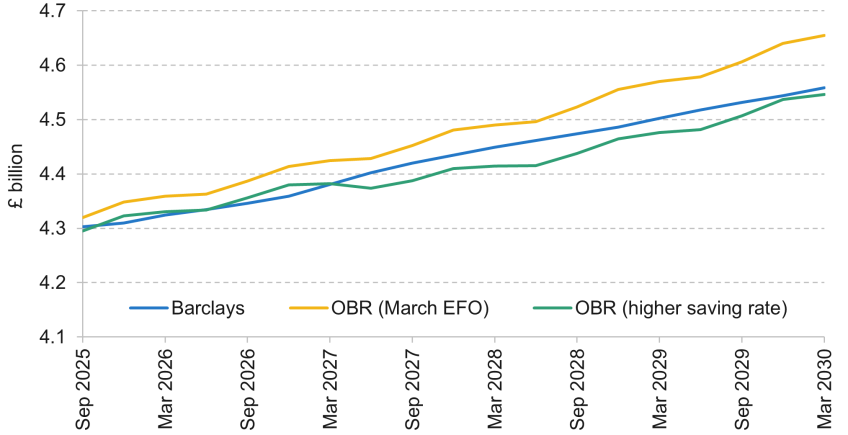
Looking forward, our modelling suggests the household saving rate will remain high over the next couple of quarters amid concerns around rising unemployment and low household wealth-to-income ratios. As the impact of falling interest rates, an improving labour market and a recovery in wealth-to-income begins to be felt, we expect household saving to reduce gradually, reaching about 9% by 2030 (Figure 1.3). This is higher than the assumption that underpinned the OBR’s forecast in the March Economic and Fiscal Outlook (EFO), which reduced more rapidly, albeit from a lower starting position, to 7.2%. For this reason, we forecast weaker growth in household consumption than did the OBR in its March forecast.
Figure 1.3. Household saving rate: out-turn, forecast and Barclays assumed path
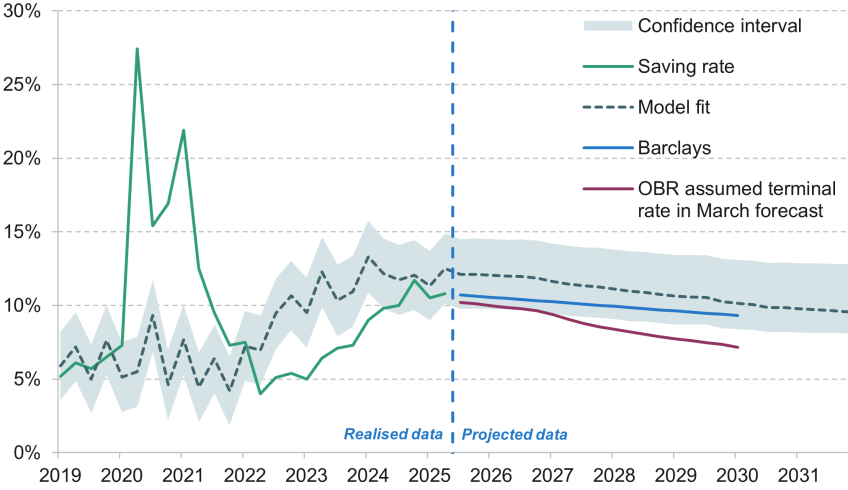
Note: Model fit shows implied saving rate based on an empirical model that is estimated on the household wealth–income ratio, income growth, interest rates, the unemployment gap and the change in mortgage lending. We then extrapolate this forward based on our forecast for these variables.
Source: Office for Budget Responsibility, Economic and Fiscal Outlook, March 2025; Barclays Research.
Assumption on saving is key to the outlook for consumer spending
To illustrate the centrality of this saving rate assumption for the outlook for consumption, we examine how the OBR’s consumption path would be affected by a saving rate that declines gradually to 9% at the end of its forecast horizon (as it does in our forecast). Assuming the same OBR real income forecast, the first-round effect of this saving rate path would reduce the OBR’s implied annual growth in real consumption by 0.5 percentage points on average over the forecast horizon. The total impact would be to reduce the level of real consumption by 2029 by 2.4% (Figure 1.4).
Figure 1.4. Forecasts for real household consumption with different assumed paths for the saving rate
Source: Office for Budget Responsibility, Economic and Fiscal Outlook, March 2025; Barclays analysis.
Real income growth to drive medium-term consumption
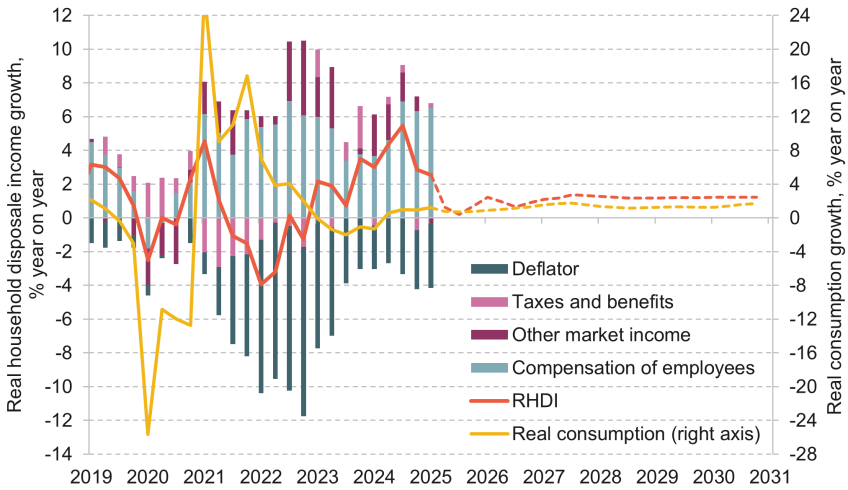
After a period of catch-up in 2024, real disposable incomes fell by 0.7% in the first quarter of 2025 and only partially recovered in Q2. Increased inflation alongside moderating nominal wage growth and a higher tax transfer is likely to weigh on real income growth this year. After that point, income growth should pick up as a combination of falling inflation and improvements in productivity allows for real wage growth. Although soft over 2026, we expect employment growth to strengthen from 2027 onwards, further increasing labour income. Partially offsetting this is the increased taxation that we anticipate being announced at this Budget, but ultimately, we expect real incomes to grow around 1.1% per year on average over the next five years (Figure 1.5). This, coupled with a gradual decline of the saving rate, leaves household consumption growing around 1.4% per year between 2027 and 2031, stable as a share of GDP. In comparison, the OBR expected private consumption to grow on average by 1.6% per year over the next five years in its March EFO forecast.
Figure 1.5. Year-on-year changes in real household disposable income (RHDI) and real consumption each quarter
Note: Dashed lines show Barclays forecasts.
Source: Office for National Statistics; Barclays Research.
1.4 Businesses and investment
Uncertainty and financing costs to weigh on investment
The latest revisions to business investment data have told a mixed story of the recent past. Business investment is now estimated to have been 6.8% higher than its pre-COVID peak in Q2 2024, compared with just 0.4% above in the data that underpinned the OBR’s March forecast. Growth so far in 2025 takes that to 10% above pre-COVID levels and the ratio of business investment to GDP has grown from 10.1% in mid 2021 to 10.8% in Q2 2025. Less positively, upward revisions to the level of GDP were larger than revisions to business investment, meaning that this share is on average 1 percentage point lower than in previous vintages of data. It also remains considerably below levels of business investment elsewhere (e.g. it compares with around 16% in the US and 17% in Germany).
Business surveys suggest that business investment will be muted for the rest of 2025 and early 2026. This is consistent with signs that firms’ margins have been squeezed as they have absorbed increasing unit labour costs driven by low growth in worker productivity and rising non-wage costs following the sizeable increase in employer National Insurance contributions (NICs) in April 2025. The profit share of GDP for corporations has fallen by 0.9 percentage points between Q3 2024 and Q2 2025 and now sits at 21.3%, the lowest since Q1 2007. The net rate of return for non-financial corporations is also low, disincentivising investment. It stood at 8.8% in Q2 2024, maintaining a long-term downward trend since 2015. Sectoral surveys from the CBI suggest an elevated fraction of firms across sectors believe rates of return and costs of finance are currently an impediment to increasing capital expenditure.
Medium-term catch-up should rebalance labour–capital ratio
However, as the effect of easing interest rates passes through and uncertainty diminishes, we expect firms to increase investment more rapidly from 2026 onward, averaging 1.6% over the period to 2030, and rebalancing the labour-to-capital ratio in favour of capital in response to the relative shift in factor costs. This is not remotely sufficient to fully close the capital gap the UK has with advanced economy peers, as identified by Allas and Zenghelis (2025), but should be sufficient to increase total factor productivity growth from current rates.
1.5 The global economy and trade
Global growth is slowing as tariffs and trade uncertainty bite
Global growth is expected to slow this year to 3.1% from 3.3% in 2024, with a similar pattern in UK trade-weighted output (Barclays, 2025a).
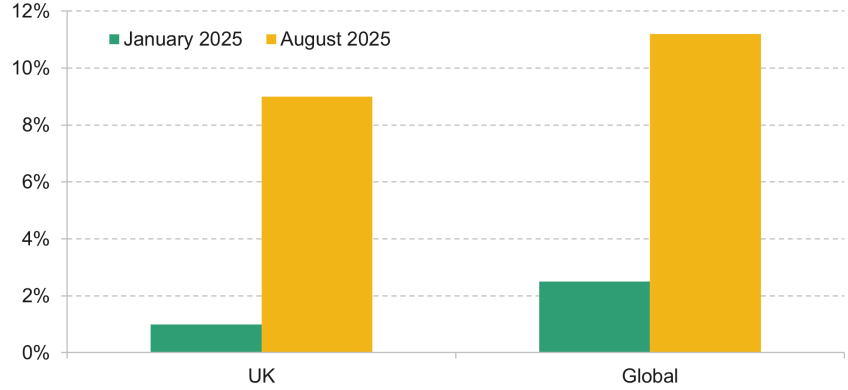
Increased tariffs have been a large part of the story for slowing global growth. The current configuration of US tariffs and retaliations sits somewhere between the OBR’s most mild and medium-intensity scenarios back in March. The effective tariff rate on goods imports to the US has now risen to 11.2%, up 8.7 percentage points since the start of the year and the highest since 1943, and that is before taking account of as-yet unclear tariffs on pharmaceuticals that have been announced by the US administration but not yet implemented and additional tariffs on steel imports (Figure 1.6). For the UK, even with a marginally less punitive arrangement than some of its peers, the effective tariff rate on UK goods exports to the US, which make up 16% of total UK goods exports, has increased 8 percentage points to 9%. Application of macroeconomic multipliers would suggest that this reduces UK GDP via a direct trade channel by 0.1–0.2 percentage points by the end of 2026.
Figure 1.6. Effective tariff rate on goods imported to the US
Source: Barclays Research.
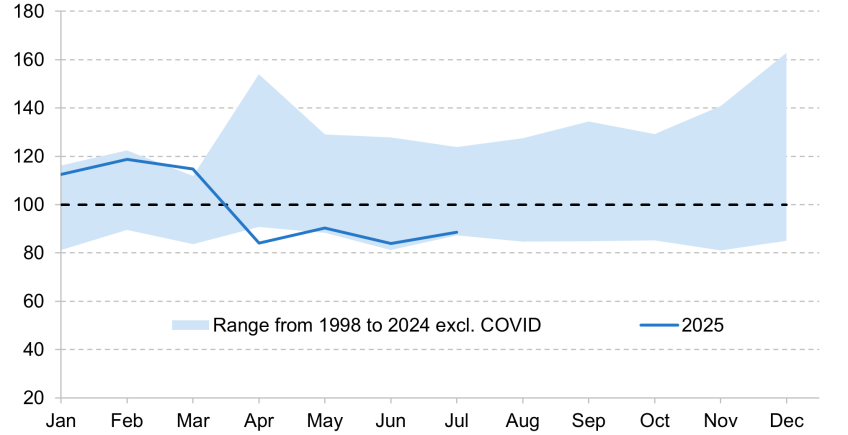
As well as the levels impact, there is evidence of trade activity shifting across time as companies sought to get ahead of tariffs coming into effect. UK exports were strong in Q1 2025 relative to previous within-year patterns, growing 1.7% quarter on quarter, but they unwound this strength in Q2, contracting by 0.2% quarter on quarter. To understand this, we must look at goods exports to the US (Figure 1.7). We can see that pre-emptive exports ahead of tariffs coming into effect was a key driver of this Q1 strength, but that this has begun to unwind, with year-to-date exports to the US more consistent with the pattern seen in previous years.
Figure 1.7. Year-to-date goods exports from the UK to the US
Note: Each year based to December of previous year equals 100.
Source: Office for National Statistics; Barclays Research.
Yet, for a small, open economy such as the UK, and especially one whose activity is more heavily focused in the service sector as opposed to goods production and manufacturing, it is the increased uncertainty and the global trade slowdown, rather than the direct impact of tariffs applied to the UK, that has the larger consequence. Uncertainty remains elevated, having hit historic highs in the first half of this year, and will be the more important determinant of the impact of tariffs on the UK. Our modelling suggests this will weigh on growth this year by 0.4 percentage points and only partially unwind in 2026, taking around 0.2 percentage points from the level of real GDP by the end of next year. We also find it to be mildly disinflationary as weaker global demand weighs on price growth around the world and excess supply in economies that export to the US has to find a new home, at lower prices (Barclays, 2025b). This effect is then assumed to dissipate as either uncertainty reduces or businesses and consumers become less sensitive to remaining uncertainty, having adapted to this as a new normal, leading to a catch-up of delayed investment and spending. On this basis, the level of GDP is estimated to remain just 0.3% lower by the end of 2026 accounting for both the direct and indirect effects of tariffs.
The UK’s terms of trade deteriorated in the first half of 2025 as goods export prices fell while import prices remained stable. There has been some improvement since the middle of the year, helped by falling global oil prices. As domestic inflation eases and cost shocks dissipate, we expect the terms of trade should remain relatively stable.
Current account deficit to fall over the medium term as foreign direct investment and net investment income improve
The current account deteriorated in Q2 2025 to –3.8% of GDP. We expect this current account deficit to shrink over the medium-term forecast, helped by positive trade balances and reduced government borrowing. What is more, we expect inflows of foreign direct investment (FDI) to the UK to pick up from the muted levels we have seen since 2016, back towards the rates seen pre-Brexit as the UK establishes a series of new trading arrangements, including with the European Union. Recent announcements of substantial FDI flows from US firms are a positive sign in this regard. We expect the current account to rest in deficit by just over 2% of GDP.
Global trade outlook remains highly uncertain
Risks remain as the global trade environment is volatile, with tariffs increasingly a geopolitical tool rather than an economic one. This makes it harder than it has been for a long time to predict when and how they will be applied. There is also a possibility that the rise in effective tariff rates is less impactful in the near term but has longer, more drawn-out negative consequences than originally expected. This pattern is beginning to emerge in the US and may have lagged economic effects on the global economic outlook. One way in which this might manifest is the normalisation of tariff usage more widely and second-round contagion. As a case in point, at the time of writing, the EU has announced a proposed 50% tariff on imports of steel. This follows the imposition of a 50% tariff on steel imports by the US, to which the UK had a preferential rate of 25%. As currently discussed, the EU does not make any allowances or carve-outs for the UK and, given the UK exports twice as much steel to the EU as it does to the US, with UK steel exports to the EU accounting for 3% of all UK goods exports, this would have more material consequences. Trade multipliers based on standard economic models would suggest that it could reduce GDP by around 0.1%.
1.6 The labour market
Mixed signals on employment
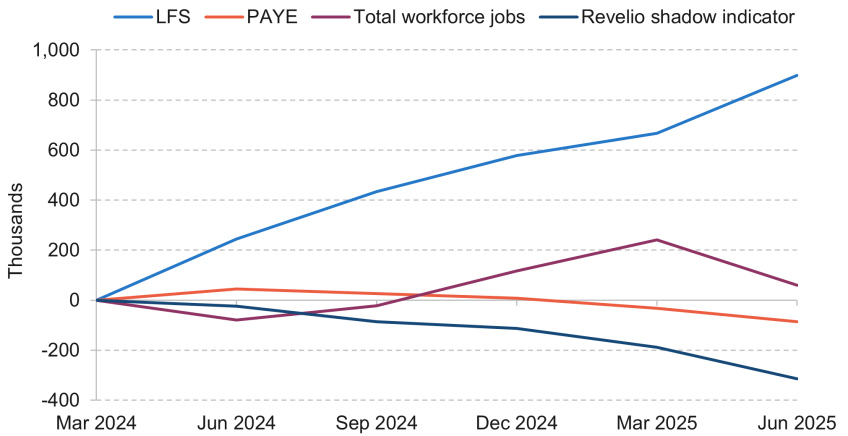
With the UK labour market of late, it has been hard to know where we are, let alone where we are going. Official data from the Labour Force Survey, a survey of households that has known issues in recent years, imply that employment growth has been strong. Our own assessment of the broader evidence challenges this.
Administrative data from HM Revenue and Customs, focused on PAYE employees, indicate that payrolled employment has been contracting for the past seven months (Figure 1.8). The workforce jobs data, which also capture self-employed workers, suggest a mild contraction since the end of last year. Barclays’s shadow employment indicator, which is derived from web-scraped data, suggests the contraction has been going on for even longer. Measures based on surveys of businesses, including purchasing managers’ indices (PMIs) and the Bank of England’s Decision Maker Panel (DMP), also suggest contracting employment.
Figure 1.8. Estimates of cumulative change in UK employment since March 2024
Source: ONS labour market statistics time series (number of people in employment and total workforce jobs), ONS PAYE Real Time Information (number of payrolled employees), Revelio and Barclays Research.
Forward-looking surveys suggest that this will continue and, with decelerating economic growth in the second half of 2025, we expect the unemployment rate to rise to just over 5% in the first half of 2026, from its current level of 4.8%. This would represent a 1.5 percentage point increase from the trough in mid 2022. Alongside this, economic inactivity is expected to stay relatively stable in the near term, having fallen from 37.3% in December 2023 to 36.2% in June 2025. Outside of COVID, this represents the joint lowest rate of inactivity since 1991. Around one-third of current inactivity is due to long-term sickness, a group that increased during COVID and has yet to shrink back (unlike the number of early retirees or students).
Looking at the medium term, the Keep Britain Working review also implies that a large number of these are younger people, which raises concerns around hysteresis, risking these potential workers never fully catching back up from the damage done at the start of their working lives. The recent government policy to offer compulsory work to young adults who have been long-term unemployed may help to bring more people in this category back into the workforce although, as pointed out by researchers at IFS (Farquharson et al., 2025), there are reasons to expect the impact to be relatively limited. However, there are signs from surveys that more of the potential workforce want a job now even if they are not actively looking. These flows are not expected to be sufficient to offset demographic trends, though, as the working-age population becomes older on average, and we expect the inactivity rate to edge up over the medium term to 36.5% in 2030.
The labour market is loose and loosening, as wages slow
Crucially, we judge the labour market to be loose. Vacancies in the economy continue to fall and the ratio of vacancies to unemployment is now comfortably below estimates of the equilibrium rate. Firms’ views on hiring and recruitment difficulties have continued to ease. This looseness is now feeding its way into wage costs. Although still high, regular private sector wage growth has continued to decline from a peak of 8.2% in June 2023 (as a three-month average versus a year earlier) and now sits at 4.7%. Higher-frequency measures, such as three-month on three-month annualised growth, suggest momentum in wages has stalled since the start of the year and is now below 4%. This would be consistent with the signal from surveys such as the Decision Maker Panel (DMP) and the Bank of England’s Agents that expect nominal wage growth between 3.5% and 4% by the end of the year. Evidence from wage settlement data is softer still, with average settlements already at 3% and a skew towards lower agreements. 11% of settlements in the three months to August saw no increase on the previous year.
The current estimate from the Low Pay Commission is that the National Living Wage (NLW) should increase by 4.1% in 2026. This is lower than the 6.7% increase seen in 2025 and so would represent a reduced upward influence on wage growth, although we note that just half of firms responding to the DMP survey rank the NLW as being in the top three factors influencing wage growth. We model that the additional boost from the NLW compared with a world in which it increased in line with our baseline forecast for regular private sector wages in April 2026 (3.5%) would add less than 0.1 percentage points to overall wage growth.
Real wage growth and falling hours to define medium term
With inflation easing and a loose labour market, we expect nominal wage growth to slow to
3–3.5% in the coming 12 months and to settle around 2.5–3% from mid 2026 onward. We expect improving productivity to allow for 0.5% annual real wage growth with unit labour costs growing at a rate consistent with 2% inflation.
One risk to this outlook is that workers look to catch-up perceived past real income losses (Haskel, Martin and Brandt, 2023; Bernanke and Blanchard, 2025). We judge this to be a limited risk. Extrapolating a trend for real earnings growth up to the start of the pandemic and then playing it forward would suggest that this process is already complete and historical losses have been regained (Figure 1.9).
Figure 1.9. Average total and regular weekly earnings, in real terms
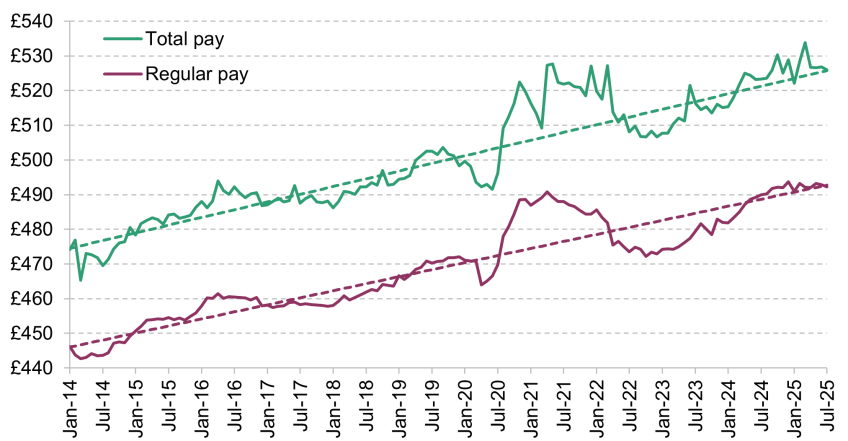
Note: Dashed lines show trends, extrapolated forward from the period January 2014 to January 2020. Earnings are seasonally adjusted, and expressed in 2015 prices.
Source: Office for National Statistics; Barclays Research.
We expect average hours to trend down over the coming years, as demographic shifts change the composition of the working population and social changes around work patterns continue. However, as the labour force grows and, beyond 2026, the unemployment rate falls, total hours are forecast to continue to grow for the duration of our forecast.
1.7 Inflation and inflation expectations
Understanding the hump
Having briefly dropped below 2% in September last year, headline CPI inflation looks likely to have climbed to 4% in September 2025. This implies annual price growth is running around 0.2 percentage points ahead of the 3.7% the OBR assumed at its March forecast for Q3 2025. Having re-established itself back in the pack of international peers for inflation performance in early 2024, recent months have seen the UK deviate again, with annual price growth now running around 0.9 percentage points higher than in the US and 1.6 percentage points higher than in the Euro Area.
This increase has been driven, in large part, by energy base effects (Figure 1.10). Gas and electricity prices were contributing –1.3 percentage points to headline CPI growth in June 2024 but are now adding +0.3 percentage points in August 2025, representing a shift of +1.6 percentage points of the overall increase between August 2024 and August 2025. More recently, accelerating food prices have also been a factor, moving from a +0.2 percentage point contribution in December 2024 to +0.6 percentage points in August. The Q4 Ofgem price cap rose by 2% in Q4 this year, compared with 10% in 2024, meaning that the upward influence of energy prices will lessen from next month. Our replication of the Ofgem modelling, based on gas futures prices, suggests a further fall in Q1 and Q2 of 2026.
Figure 1.10. Decomposition of monthly CPI inflation (% year on year)
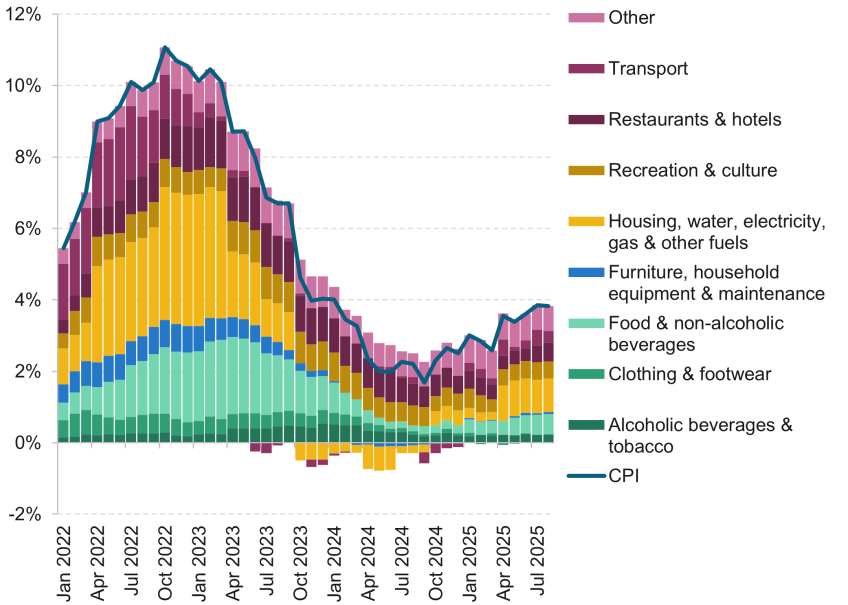
Note: ‘Other’ category includes communications, health, and miscellaneous goods and services.
Source: Office for National Statistics; Barclays Research.
Beyond this, we expect energy prices to have a broadly stable impact on headline inflation. Food price growth looks to have been driven by a combination of international commodity price increases and domestic costs associated with labour, regulation and taxation. We expect this to prove stickier than energy effects but also to dissipate through 2026.
The other drivers of recent inflation have been policy decisions taken at the last Budget and increasing administered prices (those prices directly determined by government regulations or policy). Last autumn’s Budget brought with it increases in duties on alcohol and tobacco and an increase in vehicle excise duty. There was also an extension of VAT to cover private school tuition fees. Cumulatively, we estimate these increases in indirect taxation have added 0.4 percentage points to the current inflation rate. Alongside this, a number of administered prices saw increases: bus fares; postal charges; the cost of applying for a passport; and, most significantly, water and sewerage costs. We calculate that these have added another 0.3 percentage points to the current rate of inflation. Lastly, we estimate that the increase in employer NICs that came into effect from April is adding around 0.2 percentage points to headline inflation. Around 38% of firms in the Decision Maker Panel say they have responded to the tax increase by raising their prices.
Stripping these three factors out (Figure 1.11), the UK looks much less of an outlier relative to its international peers. And assuming that they are not repeated to the same extent this year, which we think is likely given the recent messaging from government of the focus on a disinflationary Budget, then we believe we should see a substantial disinflation over the next eight to twelve months.
Figure 1.11. Path for CPI inflation, and estimated path without impact of tax changes at October 2024 Budget or administered price increases
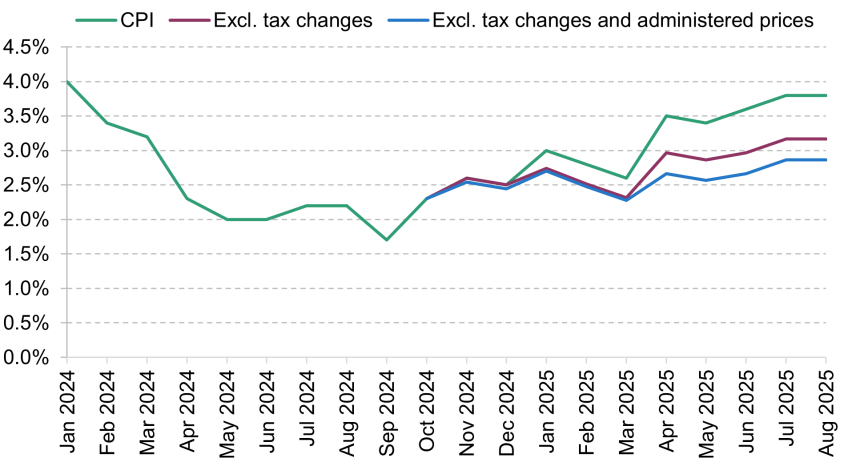
Note: ‘Excl. tax changes’ removes the impact of increased duties on alcohol and tobacco, vehicle excise duty and VAT on private school tuition fees as well as Barclays’s estimate of the impact of increased employer NICs. ‘Excl. tax changes and administered prices’ additionally removes the impact of increases in water and sewerage costs, bus fares, postal charges and administrative passport fees.
Source: Office for National Statistics; Barclays Research.
Elevated risk of rising expectations and embedded inflation persistence
Whatever the cause, though, with the exception of a single month in September last year, the current hump represents a period of more than four years of inflation above target and this is reflected in the inflation expectations of households and businesses, which have risen (Figure 1.12). Such a rise is not unexpected, although there is some evidence that expectations are currently more sensitive to increases in prices than would be implied by historical relationships, driven by the increased attentiveness of economic agents and the fact that some of the most affected categories, such as food and energy prices, are ones to which people pay the most attention. While this represents a risk that elevated expectations translate into higher and more persistent inflation, this attentiveness might mean it would be reasonable to assume expectations will fall by a similar magnitude to which they rose when actual inflation falls occur due to base effects.
Figure 1.12. Inflation expectations (% year on year)
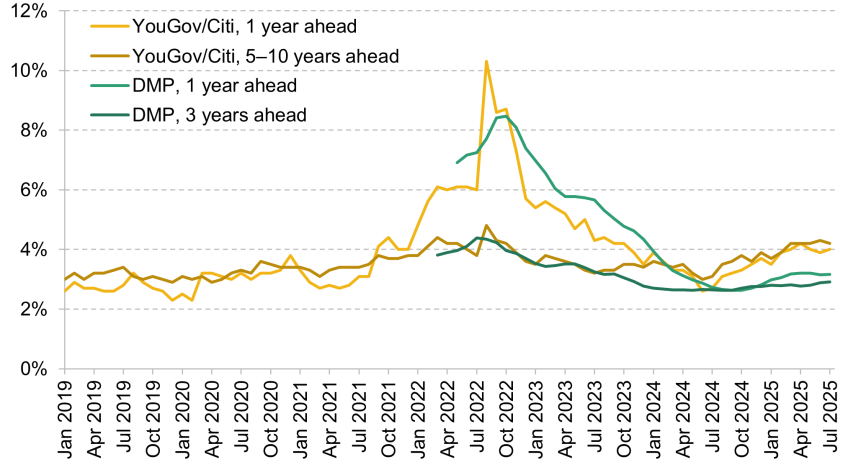
Source: YouGov/Citi; Bank of England Decision Maker Panel (DMP); Barclays Research.
Having navigated the near term, inflation should settle at target
Our forecast embodies easing nominal wage growth and improvements in productivity, both of which lower growth in unit labour costs. We also expect further strengthening in sterling and slack in both the labour market and the economy more widely. As such, we expect inflation to drop quickly over the coming six to twelve months. Without a repeat of last year’s inflationary fiscal measures, headline inflation should be back at the 2% target by Q2 next year and, with the effects of monetary easing feeding through and economic growth picking up to close the output gap, we expect price growth to stabilise around 2% thereafter (see Section 1.9 for analysis of an alternative scenario in which this November’s Budget follows a similarly inflationary pattern to that last October). Both RPI and the GDP deflator are forecast to follow a similar medium-term trajectory to CPI (Figure 1.13). We expect the RPI–CPI wedge to stay relatively stable (between 0.7 percentage points and 1 percentage point) until 2030, when the alignment of RPI to CPIH causes a narrowing of the spread to just 0.2 percentage points. The GDP deflator starts the forecast at a more elevated rate of 4.1% in Q2 2025 but, similar to CPI, reaches 2% in the second quarter of 2026 and stays around 2% thereafter.
Figure 1.13. Barclays forecasts for CPI, RPI and the GDP deflator (% year on year)
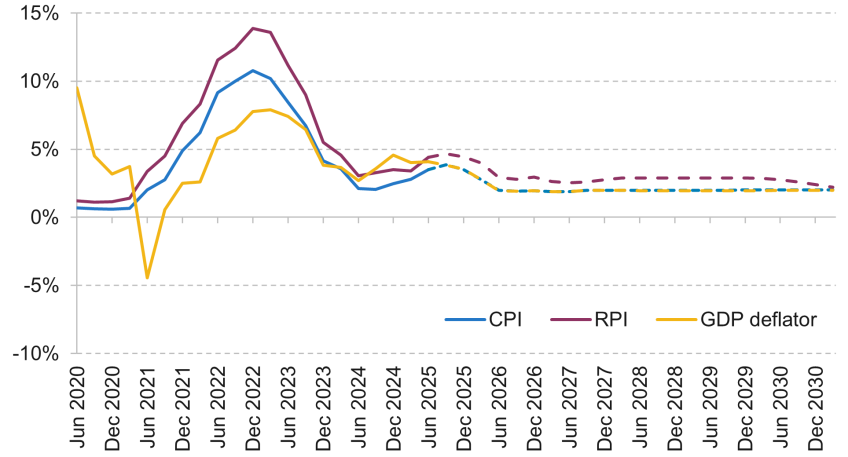
Source: Office for National Statistics; Barclays Research.
Box 1.1. Financial markets and conditioning assumptions
Global oil and gas prices have fallen in recent months. At the time the OBR closed the market assumptions for its March forecast, the sterling gas price was 125 pence per therm (p/therm) and it now sits at 80 p/therm (Figure 1.14). Brent crude was at 76 $/barrel and has eased to 63 $/barrel. It is also notable how stable these markets have become since June, with prices remaining between $65 and $70 and less daily volatility (Figure 1.15). Financial market prices used to condition our forecast imply a relatively stable path from here, with the oil price averaging 66.4 $/barrel and sterling gas prices averaging 78 p/therm. These prices are 4.5% and 15% lower respectively than the OBR’s previous assumptions in March.
Figure 1.14. Sterling gas price: out-turn, forecast and Barclays assumed path
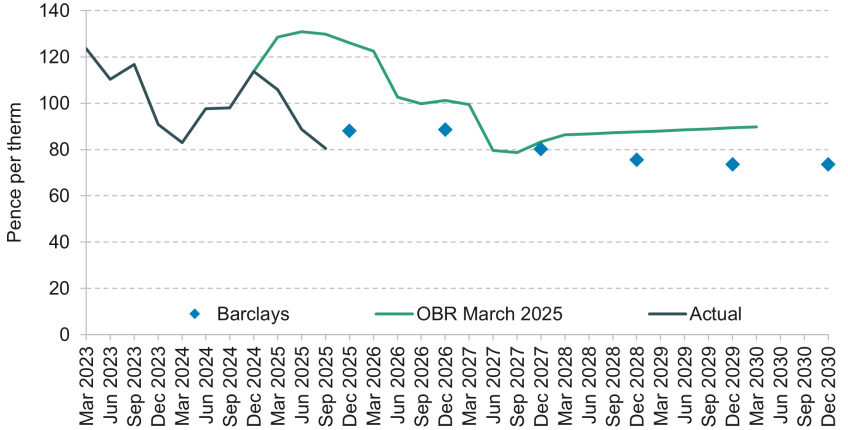
Note: Barclays forecast based on energy futures contracts for December in each year until 2029, beyond which a flat path is assumed.
Source: Office for Budget Responsibility, Economic and Fiscal Outlook, March 2025; Bloomberg; Barclays Research.
Figure 1.15. Brent crude oil price: out-turn, forecast and Barclays assumed path
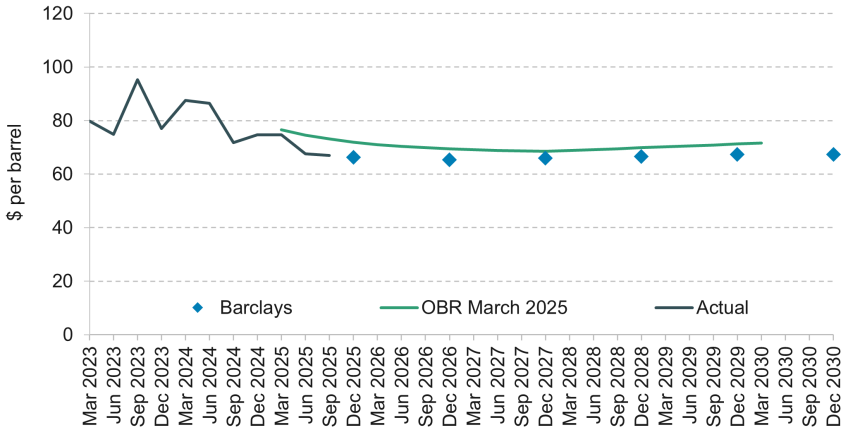
Note: Barclays forecast based on energy futures contracts for December in each year until 2029, beyond which a flat path is assumed.
Source: Office for Budget Responsibility, Economic and Fiscal Outlook, March 2025; Bloomberg; Barclays Research.
The Ofgem energy price cap for Q2 increased 6% and this was followed by a 7% decrease in Q3, while Q4 has seen an increase of 2%, pushed up by allowances for the Warm Homes Discount. Our replication of the Ofgem model, conditioned on market pricing of gas contracts, implies a fall in Q1 and Q2 of 2026.
UK government bond yields have increased since March, particularly those on long-dated gilts (see Chapter 2 for a discussion of the domestic and global drivers of these moves). The 10-year nominal yield now sits at 4.7%, while the 20-year yield is 5.4%. This is around 0.14 percentage points higher than the OBR forecast at the time of the last EFO. Market prices used to condition our forecast imply the 10-year rate will rise by just under 1 percentage point by 2030, to 5.7%, although the increase in the weighted-average yield will be moderated by the planned reduction in the weighted-average maturity of issuance leading to a compositional shift to structurally lower rates (Figure 1.16).
Figure 1.16. Yields on 10-year gilts: out-turn, forecast and Barclays assumed path
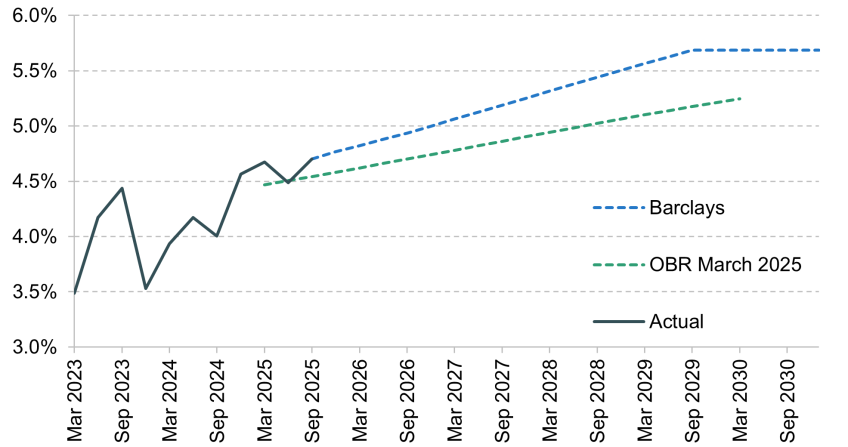
Note: Barclays assumed path based on market forward contracts. OBR figures are averages over the quarter, whereas Barclays are at the end of the same quarter.
Source: Office for Budget Responsibility, Economic and Fiscal Outlook, March 2025; Barclays Research.
On a trade-weighted basis, sterling has been relatively stable in recent months, pulled in opposite directions as dollar weakness has led to an appreciation in the bilateral sterling/dollar exchange rate, offset by a weakening against the euro. We assume that sterling rises further against the dollar, from $1.35 to $1.37 by the end of 2026, and also gains against the euro, from €1.15 to €1.19 and then stays at these levels (Figure 1.17).
Figure 1.17. Foreign exchange rates: out-turn and Barclays assumed path
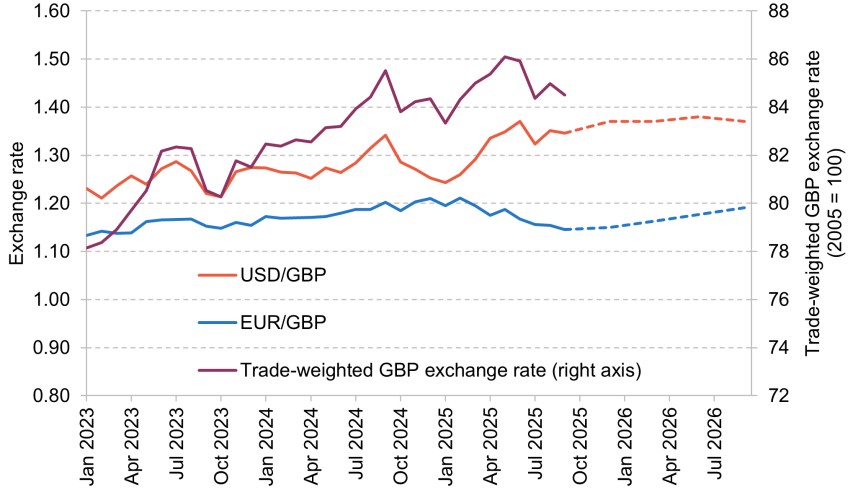
Note: Dashed lines show forecasts.
Source: Barclays Research.
1.8 Policy
Monetary policy needs to stay the course
Our relatively benign economic outlook is predicated on the Bank of England continuing the trajectory it has been on since August 2024 and removing further policy restraint over the coming months, taking Bank Rate to 3.5% – which we judge is within the plausible range of estimates of the UK’s neutral rate, the short-term interest rate that neither adds to nor subtracts from inflationary pressure – by the end of Q1 2026.
The Bank of England has already reduced Bank Rate from 5.25% in June 2024 to 4.0% in September 2025. In doing so, the Monetary Policy Committee (MPC) has gradually and carefully navigated the narrow path between supporting an economy with growing slack and minimising the risk that it fails to squeeze out the last few yards of inflationary pressure. This judgement has been finely balanced. Keeping rates too high for too long risks inflicting unnecessary pain on households and businesses that would ultimately result in higher unemployment and an undershoot of inflation. Cutting rates too fast risks the central bank’s credibility and embedding structurally higher inflation, which comes at a cost to those same households and businesses when greater effort then has to be made to return inflation back to target. However, as we get closer to the neutral rate, the appropriate path to follow has become even more unclear.
Despite the recent cuts to interest rates, monetary policy remains restrictive in an absolute sense and is weighing on economic output (Bank of England, 2025, box A). We view the nominal neutral interest rate as between 3% and 3.5% and so, without further easing, monetary policy is likely to continue to act as a headwind to growth and will weigh on inflation. What is more, the economy continues to be haunted by the ghost of tightening past. The lags between monetary policy decisions being taken and them affecting the economy mean that, even though the extent of restriction has been reduced, we are still feeling the effects of more restrictive rates from two years ago. This point can be illustrated by using granular mortgage data from UK Finance which show we are in the midst of a wave of remortgaging (Figure 1.18). People dropping off five-year deals will be moving to a rate that could be more than 2 percentage points higher than previously. This suggests that the cash-flow channel of monetary policy will bite for the foreseeable future.
Figure 1.18. Flow of mortgages reaching maturity, by fixed-rate period
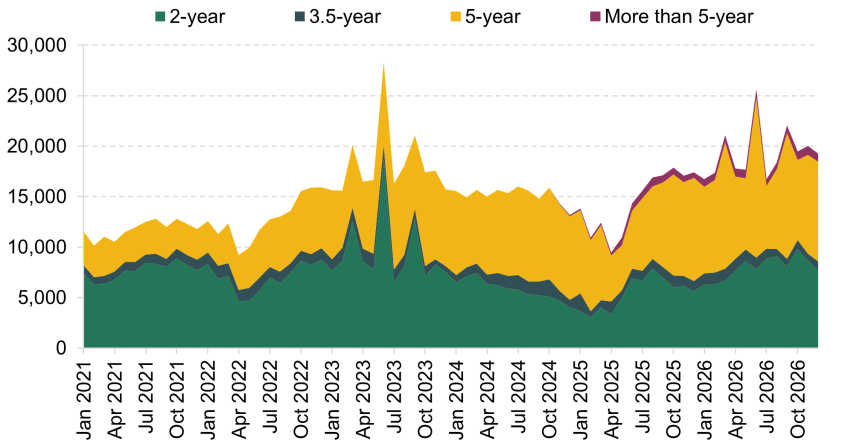
Note: UK Finance data only cover new lending, not internal product transfers within a lender. Modelling assumes mortgages are held to maturity.
Source: UK Finance; Barclays Research.
More immediately, in recent months, the market has become less certain that the MPC will deliver further rate cuts, which has led financial conditions actually to tighten since the summer, even as the MPC has reduced Bank Rate.
We continue to think that quarterly cuts to Bank Rate are the appropriate path for the MPC to take until the rate is closer to the neutral rate. If not, the risk is that the Bank ultimately has to cut faster and further, with a then-unavoidable undershoot of inflation in the interim. Current market pricing implies that Bank Rate will hit 3.6% in Q3 2026, roughly 0.2 percentage points below the level the OBR had assumed in March.
Previously, the forecast was conditioned on an assumption that active sales were constant at £48 billion per annum. A slower pace of asset sales means that the amount of gilts held on the Bank of England’s balance sheet will remain higher for longer. The Bank makes a carry loss (or interest loss) on its balance sheet holdings, because it pays out more in interest on the reserves used to finance those purchases than it receives in interest on the gilts. So, the slowing of quantitative tightening (QT) will increase interest losses, which are scored against borrowing, and this will add just under £2 billion to the current budget deficit in 2029–30, thereby reducing the Chancellor’s headroom against her borrowing rule. However, at the same time, a slower pace of sales will reduce valuation losses (which arise from selling the bonds for less than they were bought). These losses do not score against borrowing, but do score against debt. For that reason, the decision to slow QT may – depending on how the OBR’s forecast adjusts in response – be fiscally beneficial for the Chancellor’s debt rule, which requires that public sector net financial liabilities (PSNFL) must be forecast to fall relative to GDP by 2029–30. As discussed in Chapter 3, it could be this debt rule which acts as the binding constraint on policy in the Budget.
Fiscal policy is a drag on demand
The near-term fiscal outlook is likely to be dominated by the Chancellor’s response to the shifts in headroom against the fiscal rule to balance the current budget by 2029–30. Accounting for announced changes in policy, an increase in yields on government bonds and an assumed downgrade to the OBR’s forecast for productivity growth, we calculate that the OBR’s pre-measures forecast will show a material deterioration of the current budget in 2029–30 that will require a substantial consolidation in order to simply return it to a position in which the Chancellor has the same level of headroom as she had in March (£9.9 billion, 0.3% of GDP). This is discussed in more detail in Chapter 3 on the public finances.
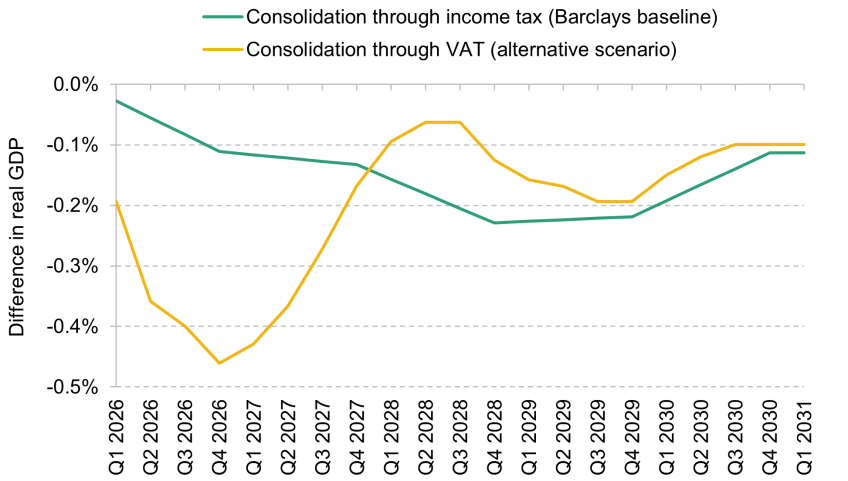
Our baseline forecast assumes that this fiscal consolidation is achieved predominantly through a combination of extending the freeze on income tax thresholds beyond 2027–28 and a more frontloaded increase in the basic and higher income tax rates (1 percentage point on each). While this would contravene a government manifesto pledge, we judge this to be one of the few ways to raise sufficient funds credibly and reliably, and a plausible scenario (see Chapter 4 for a more detailed discussion of tax options available to the government). Such a consolidation would weigh on economic activity, reducing the level of GDP by 0.25% at peak impact, which occurs in 2028. This implies that the impulse to growth is positive (although from a lower base) in 2029 and 2030.
The broader story for fiscal policy over the medium term is unchanged from March. Having contributed positively in 2024–25, the fiscal stance is forecast to be a drag on growth in each year of the forecast from here onwards, as the cyclically adjusted primary balance is moved from –1.5% of GDP in 2025–26 to a surplus in 2029–30.
Risk if fiscal rules drive policy in the medium term
A major risk for this Budget (discussed in more detail in Chapter 2) is that the consolidation is insufficient to satisfy markets that we will not be back in the same position next spring, or autumn. In other words, the risk is that markets perceive that the Chancellor will need another fiscal consolidation in the future to fulfil her fiscal rules, which would act as a further drag on growth. This can become self-fulfilling as a lower growth outlook and market concerns around sustainability may raise gilt yields and further reduce headroom. If fiscal policy gets stuck in a loop, with decisions repeatedly set based on the vagaries of the fiscal rules, this could represent a material risk to the ability of government to achieve the spending and growth profiles which underpin the forecast. The government needs to break out of this cycle.
1.9 The risk of an inflationary consolidation
In our baseline assessment, the Chancellor undertakes a consolidation of just under 1% of GDP, predominantly through increasing income taxes, both by raising the rates and by extending the current cash-terms freeze on income tax thresholds beyond 2027–28. This slows growth and reduces inflation.
In October 2024, the Chancellor raised the tax burden by a much greater amount, with a headline rise of around £40 billion. However, this was done through a combination of increases in duties (alcohol, tobacco, vehicle excise duty), VAT (on private school tuition fees) and an increase in employer National Insurance contributions. As discussed above, this combination was responsible for a significant proportion of the recent rise in headline inflation.
As a sensitivity to our baseline scenario, we model what might happen should the Chancellor look to pull on similar levers to raise the required money this time around. While we stay agnostic on the precise constellation of duties, levies and taxes that could be employed, we proxy the plethora of possible tax increases that could – mechanically or otherwise – lead to stronger near-term inflation with a standard VAT rate shock, implemented from Q1 2026. The calibration to tax intake suggests that a 2 percentage point increase in the standard rate of VAT (to 22%), offset with a removal of VAT on energy, would raise £17 billion.
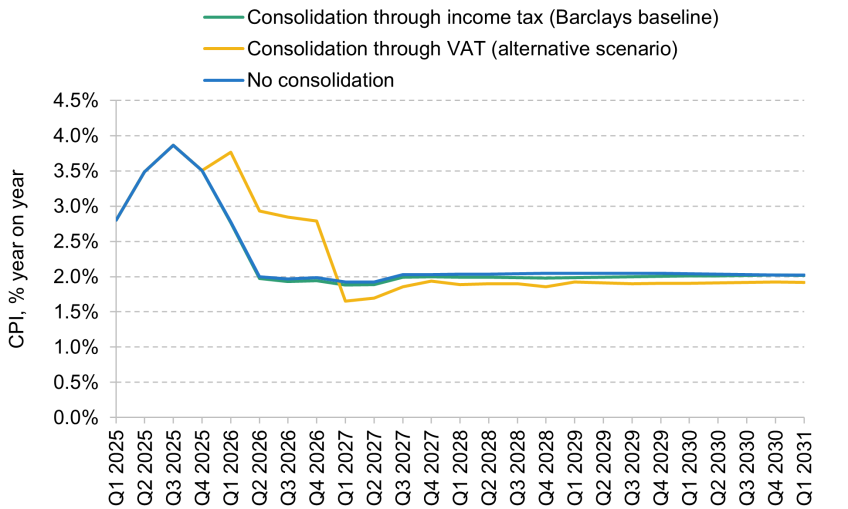
On impact, CPI inflation would jump by 1 percentage point compared with our baseline and remain there for the entirety of 2026. This is consistent with the fact that around half of the CPI basket is subject to the main rate of VAT and past episodes have shown pass-through in those prices to be close to 100%. Activity would fall by around 0.1 percentage point on impact and be around 0.2% lower at its peak impact. Aside from the near-term inflation spike, this is not dissimilar to the economic path in our baseline.
However, there are reasons to believe that modelling on past episodes may be insufficient. This time could well be different. In previous episodes, central banks have tended to look through the temporary price level shock (Bank of England, 2011), knowing that it should dissipate before any policy response would have its effect. However, with UK inflation currently around 4% and monetary policymakers concerned about a de-anchoring of inflation expectations, this time they may be less comfortable looking through even a temporary shock. There is support for such a position from economic theory. Recent work by Nakamura, Riblier and Steinsson (2025) suggests that when inflation expectations are less firmly anchored, it is optimal to respond more forcefully than otherwise. Similarly, Bandera et al. (2023) show that, following a sequence of supply shocks that drive inflation above target, looking through may be suboptimal and lead to a more persistent inflation overshoot and reductions in welfare.
We incorporate this into our scenario by first looking at what the implied policy response would be based on a swathe of different policy rules and calibrations, based on Knotek II et al. (2016) (Figure 1.19). Inputting the scenario above into these rules, we conclude that a forward-looking policymaker would look through the shock and, in some cases, would actually reduce rates pre-emptively to offset the demand destruction implied by the tax increase. However, more near-sighted policy rules suggest that, relative to our baseline, the policymaker should set rates more restrictively in the near term, to squeeze out inflation, even at the expense of an inflation undershoot further out (which in most calibrations requires rates to be lower, all else equal). Assuming the Bank of England retains credibility, and so a less aggressive interest rate response is required to drive inflation expectations to a level consistent with 2% inflation, we aim towards the bottom of the swathe of policy rules and derive a path that is initially 0.5 percentage points higher than our baseline, before falling below it by 2027.
Figure 1.19. Paths for Bank Rate in response to an inflationary tax shock across policy rules (difference from baseline scenario)
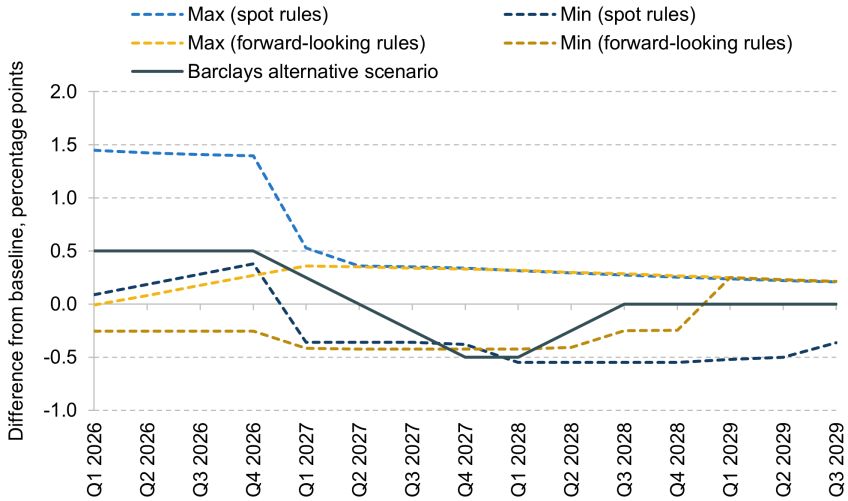
Source: Barclays Research.
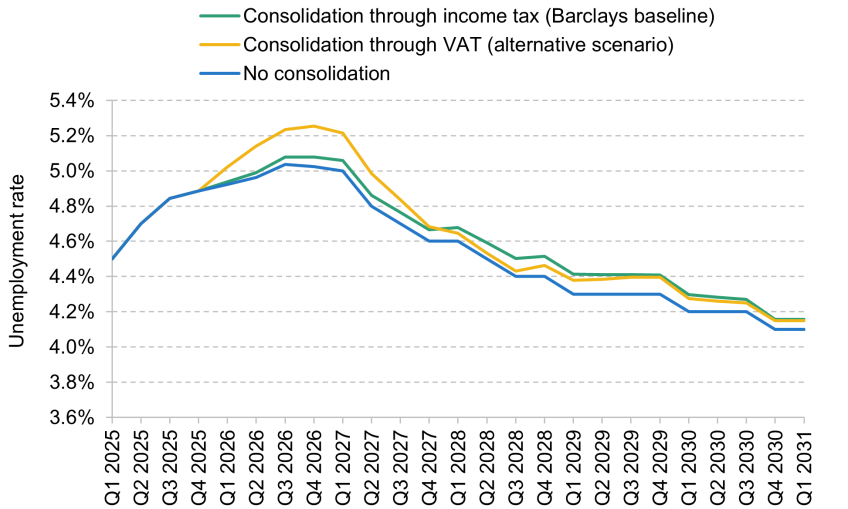
Layering this updated policy path as a further shock to our first stage of the scenario, we estimate the reduction in real GDP grows to be –0.2% on impact and around 0.5% at peak, double the slowdown implied by our baseline (Figure 1.20). Weaker activity and higher initial inflation (Figure 1.21) also translate into higher unemployment, with the unemployment rate peaking at 5.3%, 0.2 percentage points higher than in our baseline (Figure 1.22). What is more, under the current fiscal rules, the problem is exacerbated as a higher path for Bank Rate would likely lead to higher gilt yields. This would increase debt interest, as would higher inflation, all else equal. This would worsen the profile of the current budget, requiring an increased fiscal adjustment at future fiscal events.
Figure 1.20. Level of real GDP under Barclays baseline and alternative scenarios, compared with scenario with no consolidation at the Autumn Budget
Source: Barclays Research.
Figure 1.21. CPI inflation under different scenarios
Source: Barclays Research.
Figure 1.22. Unemployment rate under different scenarios
Source: Barclays Research.
The implication of this exercise is that not all tax levers are created equal and, should the Chancellor choose to meet her fiscal rules off the back of taxes that increase near-term inflation, the outlook for the economy could be worse than our central projection. As such, we believe briefings in recent weeks that this will be a Budget focused on ensuring disinflation are to be welcomed.
1.10 Potential output and productivity
Potential growth has been driven by population growth
We calculate potential output growth has been under 1% in 2023 and 2024. This has been driven by growth in the population of the UK, which expanded 1.3% in 2023 and 1.1% in 2024. These were the highest annual growth rates since the series began in the 1940s. This population growth was almost exclusively a result of net migration flows, particularly from outside the EU. Net migration from the previous year to mid 2024 was 738,718, only slightly more than the OBR assumption of 720,000 in its March EFO. Taking this into account, the level of the population in mid 2024 stood at 69.28 million, which is just 50,000 (less than 0.1%) more than the ONS’s migration variant projections that underpinned the last OBR forecast. Since the start of 2024, the labour input to potential GDP has been further boosted by a recovering participation rate, which has risen 1.2 percentage points and now sits at 63.9%. Turning to the other factor of production, growth in the volume of capital services – the flow of services derived from capital assets – has slowed, following a post-pandemic bounce, falling below 1% year on year in 2024.
Still waiting on productivity growth
Productivity has fared less well in recent data. The upward revision to real GDP embodied in the Blue Book will have raised the level of output per hour worked by around 0.6%, but GDP growth in the first half of 2025 was actually revised slightly lower, suggesting weaker productivity growth over that period, while the historical upgrades will have not been sufficient to offset the contractions in multifactor productivity in 2023 and 2024.
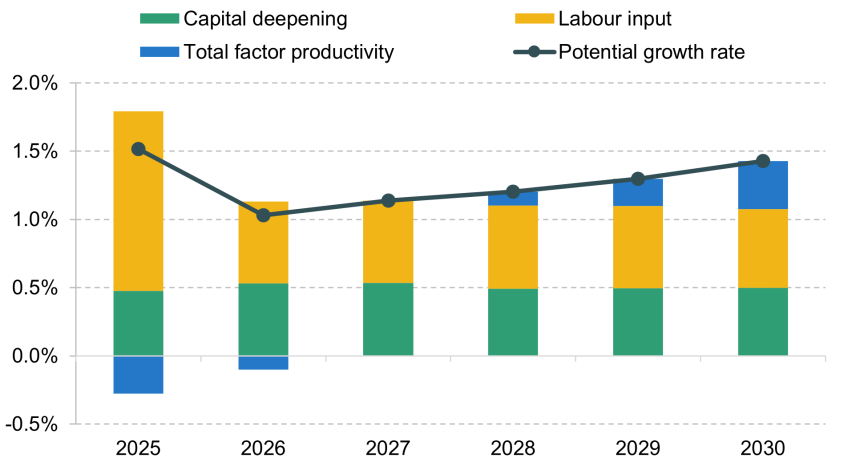
2025 should see further strength in potential output driven by population growth of 0.5% alongside an increasing participation rate, which has risen 0.4 percentage points since the start of the year, and a slight increase in average hours of work. All of these have combined to increase labour input by 2.3%. This is offset by a fall in measured productivity and more muted capital deepening. In our forecast, potential growth should then fall back to around 1% in 2026. Lower net migration leads the working-age population to grow by an average of 0.7% per year, while participation gradually falls to 63.5% in 2030–31 as the downward trend driven by an ageing population is less than fully offset by other factors such as the forthcoming increase in the state pension age from 66 to 67. We forecast average hours to decline from 32 hours per week in 2025 to 31.8 in 2030, as the ageing population combines with social trends relating to work–life balance and increasing productivity.
These downward trends are offset over the medium term by rising trend (and realised) total factor productivity growth, which we assume moves from –0.3% currently to 0.4% year on year by 2030. The latter effect dominates and the UK’s potential growth rate increases from around 1% in 2026 to around 1.5% by 2030 (Figure 1.23).
Figure 1.23. UK potential growth rate (% year on year)
Source: Barclays Research.
Negative output gap to reduce, but not fully close by 2030
We assess that the UK is currently in a position of slack, with the level of GDP around 1% below potential. This is consistent with a range of metrics on capacity utilisation. Given below-trend growth, we expect this gap to widen over the second half of 2025 before closing over the course of 2026 and the first half of 2027 as monetary easing feeds through. The gap is not fully closed in the medium term as fiscal policy continues to act as a drag on demand while the supply-side picture improves, but the gap is sufficiently small that it does not generate an inflation undershoot.
Box 1.2. Sensitivity to the outlook for productivity
The assessment of the outlook for productivity is perhaps the most consequential forecast decision in the coming Budget. In March, the OBR forecast that output per hour worked, which had fallen by 1.0% in 2024, would increase by 0.2% in 2025 and 1.1% in 2026, and by 1.3% in 2029–30. Outside of the pandemic, the UK has not seen such rates of productivity growth on a sustained period in the past 20 years. Our own forecast embodies an increase in output per hour worked of 0.8% in the medium term. We condition it on the same population projections used by the OBR in March, and broadly similar expectations for declining average hours and participation. Our forecast is actually a little more optimistic than the OBR’s on capital deepening. The biggest difference derives from our differing views of total factor productivity (TFP). The OBR assumes this will average 0.8% annually over the forecast and reach 1% by 2029–30. This is roughly 0.6 percentage points higher than the path in our forecast by 2029–30. This has material consequences for the medium-term outlook. A scenario in which we impose the OBR’s TFP assumption onto our own forecast would raise the level of real GDP in 2029–30 by 2% (Figure 1.24).
Figure 1.24. Level of quarterly real GDP under different productivity growth assumptions
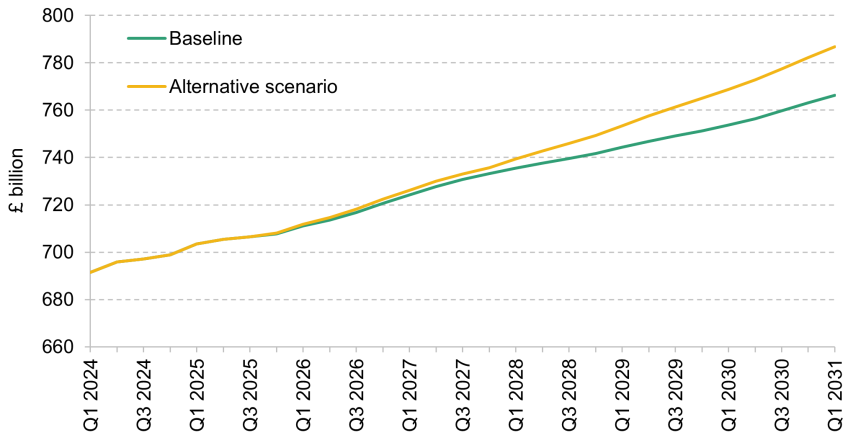
Note: Seasonally adjusted quarterly UK GDP, chained volume measures. Forecasts from Q3 2025 onwards.
Source: Out-turns from ONS UK Economic Accounts time series. Forecasts from Barclays Research.
Were the OBR to move its assumption to our own, and leave all other forecast assumptions unchanged from March, then the deterioration in the current budget in 2029–30 could be in excess of £40 billion. A downward revision of some variety by the OBR at this Budget looks likely – our baseline is conditioned on an assumption that this revision is an average of 0.1 percentage points – but we expect the OBR’s productivity assumption to remain higher than our own.
There are scenarios which could plausibly see faster productivity growth than we currently anticipate, including:
- Faster adoption of AI. We have seen significant global investment in the infrastructure required for AI, and plans for this to accelerate in the UK (Department for Science, Innovation and Technology, 2025; Pabst and Marioni, 2025). There are signs that UK firms are increasingly adopting AI, with 55% of firms answering the Bank of England’s Decision Maker Panel already using it in some form and an expectation this could increase 10–20 percentage points in the next three years.
- Realigning trade with the EU and greater openness. Evidence suggests that more open economies are more productive, with better generation and diffusion of innovation (D’Aguanno et al., 2021). The UK has seen the negative consequences of this since Brexit, with estimates suggesting it has reduced productivity by 4% (Office for Budget Responsibility, 2020; Dhingra et al., 2016). Current government discussions with the EU could reverse some of this trend if they can lead to a more flexible labour market (e.g. the Youth Mobility Scheme), sharing of R&D resources and reductions in the costs of doing trade. That said, as discussed above, the trend globally is for less openness to trade, not more.
- Fiscal and political stability crowding in productivity. There is an established link between political, fiscal and economic uncertainty and productivity and growth (Hong, Ke and Nguyen, 2024; Bloom, 2007). The UK government currently has a large parliamentary majority and no requirement to call an election for four more years, and if it can maintain stability of both policy direction and tenure then there could be a dividend in the form of better productivity performance.
- Public sector productivity increases. Partly as a consequence of the above, public sector productivity increases may be able to leverage the developments above (AI, openness, stability) to improve. However, even the current plans may seem optimistic, as discussed in Chapter 6.
1.11 Conclusion
The UK economy stands at a pivotal juncture, facing near-term headwinds from decelerating growth, persistent inflation, and the need for a substantial fiscal consolidation to meet the Chancellor’s fiscal rules. While the immediate outlook is marked by caution and restraint, the medium-term prospects hinge on the successful transition from public-sector- and net-trade-driven growth to a more dynamic private sector, alongside improvements in productivity. The Chancellor must tread carefully, balancing the imperative for fiscal discipline with the risks of stifling recovery and undermining living standards. Our analysis shows she would be well advised to avoid policy levers that add to near-term inflation in making the required consolidation at the dispatch box come November.
We also show that productivity growth and household saving behaviour will be decisive in shaping the trajectory of real incomes, investment and consumption. Achieving a sustainable rebound will require not only prudent monetary and fiscal policy, but also a renewed focus on fostering innovation, openness and stability. The risks associated with global trade uncertainty, productivity and demographic shifts remain significant, but so too do the opportunities for resilience and renewal if the right policy choices are made.
Ultimately, the path ahead is narrow but navigable. By prioritising measures that support productivity, encourage private sector investment and maintain macroeconomic stability, the UK can lay the groundwork for stronger, more sustainable growth. The choices made in the coming months will determine not just the near-term outlook, but the nation’s economic prospects for years to come.
References
Allas, T. and Zenghelis, D., 2025. The UK’s capital gap: a short-fall in the trillions of pounds that will take decades to bridge. Productivity Insights Paper 055, The Productivity Institute, https://www.productivity.ac.uk/research/the-uks-capital-gap-a-short-fall-in-the-trillions-of-pounds-that-will-take-decades-to-bridge/.
Bandera, N., Barnes, L., Chavaz, M., Tenreyro, S. and von dem Berge, L., 2023. Monetary policy in the face of supply shocks: the role of inflation expectations. ECB Forum on Central Banking, https://www.ecb.europa.eu/press/conferences/ecbforum/shared/pdf/2023/Tenreyro_paper.pdf.
Bank of England, 2011. Inflation Report – February 2011. https://www.bankofengland.co.uk/inflation-report/2011/february-2011.
Bank of England, 2025. Monetary Policy Report – August 2025. https://www.bankofengland.co.uk/monetary-policy-report/2025/august-2025.
Barclays, 2025a. Rorschach test. Barclays Live.
Barclays, 2025b. Tariffs hit now, fiscal relief follows. Barclays Live.
Bernanke, B. and Blanchard, O., 2025. What caused the US pandemic-era inflation? American Economic Journal: Macroeconomics, 17(3), 1–35, https://www.aeaweb.org/articles?id=10.1257/mac.20230195.
Bloom, N., 2007. The impact of uncertainty shocks. NBER Working Paper 13385, https://doi.org/10.3386/w13385.
D’Aguanno, L., Davies, O., Dogan, A., Freeman, R., Lloyd, S., Reinhardt, D., Sajedi, R. and Zymek, R., 2021. Global value chains, volatility and safe openness: is trade a double-edged sword? Bank of England Financial Stability Paper 46, https://www.bankofengland.co.uk/financial-stability-paper/2021/global-value-chains-volatility-and-safe-openness-is-trade-a-double-edged-sword.
Department for Science, Innovation and Technology, 2025. Investment in British AI companies hits record levels as Tech Sec pitches UK as global magnet. https://www.gov.uk/government/news/investment-in-british-ai-companies-hits-record-levels-as-tech-sec-pitches-uk-as-global-magnet.
Dhingra, S., Ottaviano, G., Sampson, T. and Van Reenen, J., 2016. The consequences of Brexit for UK trade and living standards. CEP Brexit Analysis 2, https://eprints.lse.ac.uk/66144/1/__lse.ac.uk_storage_LIBRARY_Secondary_libfile_shared_repository_Content_LSE%20BrexitVote%20blog_brexit02.pdf.
Farquharson, C., Tahir, I., Waters, T. and Xu, X., 2025. A response to government announcement of work placements for young people on long-term benefits. IFS comment, https://ifs.org.uk/articles/response-government-announcement-work-placements-young-people-long-term-benefits.
Haskel, J., Martin, J. and Brandt, L., 2023. Recent UK inflation: an application of the Bernanke–Blanchard model. Bank of England, https://www.bankofengland.co.uk/-/media/boe/files/speech/2023/november/recent-uk-inflation-an-application-of-the-bernanke-blanchard-model-paper.pdf.
Hong, G. H., Ke, S. and Nguyen, A. D. M., 2025. The macroeconomic effects of fiscal policy uncertainty around the world. AEA Papers and Proceedings, 115, 182–7, https://www.aeaweb.org/articles?id=10.1257/pandp.20251011.
Knotek II, E. S., Verbrugge, R. J., Garciga, C., Treanor, C. and Zaman, S., 2016. Federal funds rates based on seven simple monetary policy rules. Federal Reserve Bank of Cleveland, Economic Commentary 2016-07, https://doi.org/10.26509/frbc-ec-201607.
Nakamura, E., Riblier, V. and Steinsson, J., 2025. Beyond the Taylor Rule. NBER Working Paper 34200, https://www.nber.org/papers/w34200.
Office for Budget Responsibility, 2020. The effect on productivity of leaving the EU. Economic and fiscal outlook – March 2020, box 2.1, https://obr.uk/box/the-effect-on-productivity-of-leaving-the-eu/.
Office for Budget Responsibility, 2025. Economic and fiscal outlook – March 2025, https://obr.uk/efo/economic-and-fiscal-outlook-march-2025/.
OECD, 2025. OECD Economic Outlook, Interim Report September 2025: finding the right balance in uncertain times. https://doi.org/10.1787/67b10c01-en.
Pabst, A. and Marioni, L., 2025. How artificial intelligence could narrow the productivity gap. NIESR Blog, https://niesr.ac.uk/blog/how-artificial-intelligence-could-narrow-productivity-gap.
Acknowledgements
I would like to thank Cian Hennigan for his immense work and support in creating this chapter and Moyeen Islam for his market experience and expertise. I am also incredibly grateful to Silvia Ardagna, Mariano Cena, Lefteris Farmakis, Christian Keller, Iaroslav Shelepko and many more colleagues at Barclays for their insightful comments and illuminating conversations in the preparation, and more generally. Lastly, I would like to thank Carl Emmerson, Kate Ogden, Ben Zaranko and the rest of the team at IFS for their perspectives and insights, as well as their patience.
Endnotes
Authors

Jack Meaning
More from IFS
Understand this issue


Policy analysis


Academic research


