
Downloads
Download chapter PDF
PDF | 1.61 MB
Key findings
- The stock of government debt has grown consistently over the last 25 years, and is not forecast to fall substantively over the next five. Debt has risen in other countries too, but the increase in the UK has been bigger than most. Since the start of the century, the UK has gone from having the 21st-largest debt among advanced economies – below the average – to having the 5th-largest.
- Much elevated debt, combined with higher government borrowing costs, has pushed up debt interest spending. It is forecast to be £111 billion this year, which is £64 billion – roughly equivalent to the entire core schools budget – higher than forecast just three years ago, and it is not expected to fall over the medium term. High debt interest spending leaves a smaller share of the pie for other, more attractive types of spending. This is one of the key reasons the government’s fiscal bind feels so unforgiving.
- A crucial determinant of the fiscal tightening needed at the Budget in November will be the Office for Budget Responsibility’s productivity forecast. Productivity growth has fallen short of the OBR’s forecast since the COVID-19 pandemic, and its growth expectations in March 2025 were above those of all independent forecasters surveyed by the Treasury. A forecast downgrade bringing the OBR more closely in line with independent forecasters and the Bank of England is widely expected. As a rule of thumb, we might expect a 0.1 percentage point downgrade to the annual productivity growth rate to increase public sector net borrowing by £7 billion in 2029–30.
- Under the Barclays central economic scenario, we forecast that borrowing in 2029–30 could be £22 billion (0.7% of national income) higher than forecast in March. In this scenario, the additional borrowing would be caused by higher interest rates (£5 billion), additional social security spending stemming from recent policy reversals (£6 billion) and other changes to the forecast, most notably a weaker growth outlook (£8 billion). Notably, though, Barclays is still relatively optimistic on growth and the cost of borrowing relative to other forecasters, and a larger fiscal downgrade is entirely possible.
- The central Barclays scenario would leave the Chancellor needing a fiscal tightening of at least £12 billion to meet her fiscal rule to run a current budget surplus by 2029–30. This would leave no headroom at all. A tightening of £22 billion would be required to restore the £10 billion forecast current budget surplus she chose at the Spring Forecast.
- Under the same scenario, without a fiscal tightening, the government would also be missing its second fiscal rule – to have debt, as measured by public sector net financial liabilities (PSNFL), falling as a share of national income in 2029–30 – by £17 billion, i.e. by more than the forecast current budget deficit in that year. This is driven by lower forecast growth reducing the rate at which the existing stock of debt falls as a share of national income. To continue meeting her debt rule under this scenario without building in any amount of headroom, the Chancellor would therefore need to enact a fiscal tightening of at least £17 billion, some of which could come from cuts to (or a reprofiling of) investment spending.
- If the Chancellor left herself the same £10 billion margin against her fiscal rules in the Budget, then, taking the history of forecast-to-forecast revisions since 2010 as a guide, we expect the Chancellor to have only a two-in-three chance of meeting her borrowing rule in the spring without new tax rises or spending cuts. A narrow margin against the debt rule, which may well become the binding rule at the Budget but is more sensitive to the precise profile of economic growth, would have no better chances of making it to the spring. Over three years, with £10 billion of headroom, Ms Reeves would have just a one-in-five chance of meeting her fiscal rules at each forecast without the need for policy adjustments.
- Leaving minimal headroom against pass–fail rules undermines the Chancellor’s stated objective of securing policy stability, creating damaging uncertainty and impeding good policymaking. There are multiple ways the Chancellor could try to reduce such policy volatility. Implementing a larger fiscal consolidation than strictly necessary, in order to build in a larger amount of headroom, is the most straightforward one. It has much to commend it: it would likely be well received by bond markets and would help to secure policy stability beyond just the spring – but would have the unavoidable downside of requiring larger tax rises or spending cuts than otherwise.
- Another option would be to ask the OBR to produce only one forecast a year, thereby avoiding the possibility of missing the rules in the spring. This would have the benefit of simplicity, but would be the fiscal equivalent of throwing the baby out with the bathwater – sacrificing transparency and potentially exacerbating the damaging effect of speculation in the (then longer) run-up to a new forecast. Nor would it prevent the Chancellor from finding herself in exactly the same position in a year’s time. Other options – such as specifying ahead of time which tax or spending levers the Chancellor would pull in the event a tightening becomes necessary, or expanding the use of ranges on the fiscal rules – could also be promising avenues. But the key question is whether they could be implemented in a credible way.
- Reducing planned spending is one option for reducing borrowing – whether required to meet the fiscal rules or desired to build in more headroom – though a difficult one. Future spending on support for those with health conditions and disabilities is highly uncertain, cuts to planned social security spending lacked sufficient support in parliament, and simply pencilling in lower departmental spending in 2029–30 lacks credibility. There are also clear pressures to spend more – for example, on social security through the removal of the two-child limit and the household benefit cap or on defence.
- If the government chooses to raise more in taxes instead, there is a very strong case for combining revenue-raising measures with well-designed tax reform that reduces some of the many unwelcome and unnecessary distortions caused by the present tax system. If they are not, then fiscal stability will come at a greater economic cost than it needs to – something we can ill afford.
3.1 The fiscal picture today
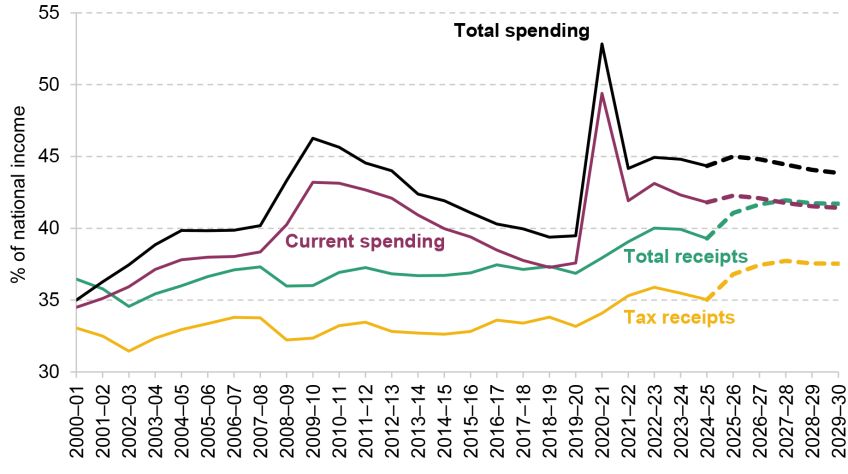
Over the last five years, the size of the state has stabilised at a level never maintained in the UK previously. Public spending and government revenues are both at elevated levels (Figure 3.1). Total public spending represented 44.3% of national income in 2024–25. This is almost 5% of national income above levels on the eve of the COVID-19 pandemic (2019–20) and the eve of the global financial crisis (2007–08), though it is below the peaks experienced during each of these crises. Since the end of the pandemic, government spending has remained stable as a share of national income and, as of the Office for Budget Responsibility’s most recent forecast in March 2025, is not set to fall significantly by the end of the decade. Meanwhile, tax receipts, which grew by a record amount to historic highs in the last parliament (Emmerson, Johnson and Zaranko, 2023), are set to increase further over the next five years.
Figure 3.1. Total spending, current spending, total receipts and tax receipts: out-turn and March 2025 forecast
Note: National Accounts tax receipts shown.
Source: Office for Budget Responsibility, Public Finances Databank, September 2025.
Changes since the 2024 general election
In its first year in office, this government announced increases in both day-to-day and capital spending alongside a package of tax rises (on top of those already baked into the plans inherited from the previous government). The additional tax rises were sufficiently large for the government to meet its fiscal target to run at least a balanced current budget – in other words, for revenues to exceed day-to-day spending – by 2029–30 (with this being forecast by the Office for Budget Responsibility to be achieved from 2027–28). The overall result is higher spending, higher taxes and higher borrowing than under the previous government’s stated plans.
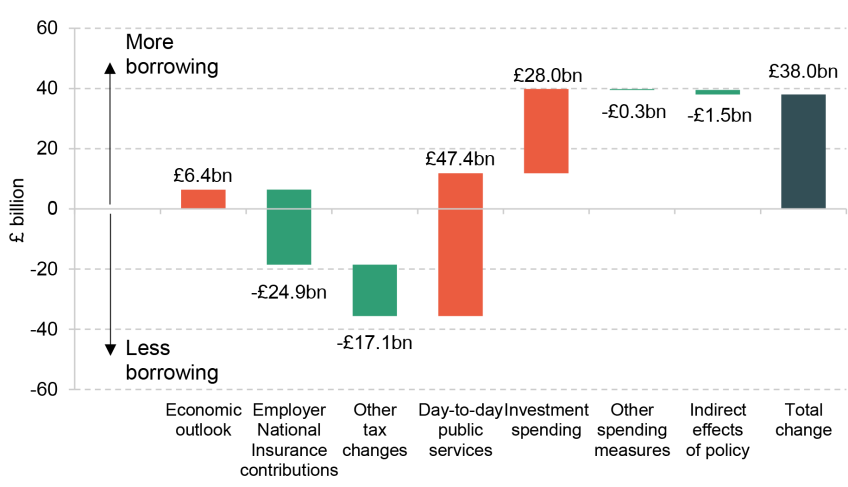
The change to inherited plans can be seen in more detail in Figure 3.2 and Table 3.1, which break down changes to forecast government borrowing in 2028–29 since the final fiscal event of the previous government in March 2024. Relative to the previous government’s plans, over £40 billion of net tax increases (in 2028–29 prices) were announced in the Autumn Budget. This included £24.9 billion from changes to employer National Insurance contributions (before accounting for countervailing knock-on effects of the tax rise), in addition to revenue-raising changes to non-domicile taxation and capital taxes (specifically capital gains tax, inheritance tax and stamp duty land tax).1
On the other side of the government’s ledger, the Chancellor has significantly increased day-to-day departmental spending relative to previous plans, by £47.4 billion in 2028–29. While this is a large increase relative to the plans pencilled in by the previous government, it is important to note that it still leaves current spending falling as a share of national income, albeit slowly (as shown in Figure 3.1). Steep scheduled falls in day-to-day spending pencilled in by the previous government were widely thought to be at best very difficult, or at worst impossible, to deliver. Certainly neither the Conservatives’ nor Labour’s general election manifesto engaged with how they would deliver those spending plans in office.
Figure 3.2. Changes to planned public sector net borrowing in 2028-29 between March 2024 and March 2025
Note: Changes in planned public sector net borrowing in 2028–29, the last year of the forecast in March 2024.
Source: Office for Budget Responsibility, Economic and Fiscal Outlook, October 2024 and March 2025.
Table 3.1. Change in forecasts for 2028-29
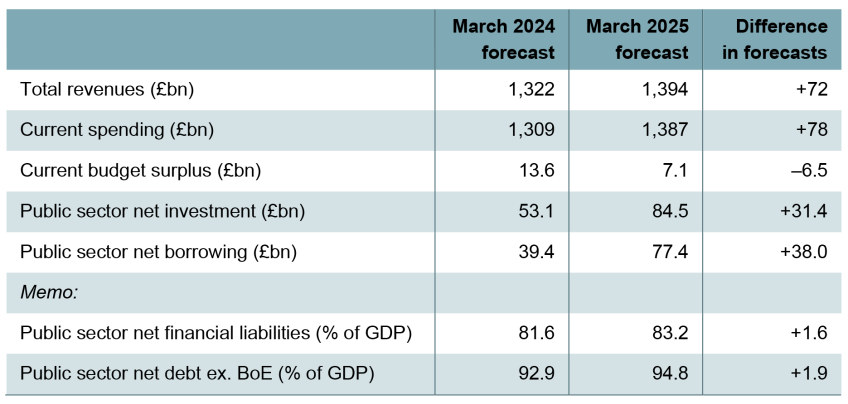
Note: Difference expressed as the increase in March 2025 relative to March 2024. Values expressed in 2028–29 prices as expected at successive forecasts. Public Sector Net Debt excluding the Bank of England was targeted by the previous government’s debt rule.
Source: Office for Budget Responsibility, Public Finances Databank, March 2024 and March 2025.
Because the increase in planned day-to-day spending over the past year was bigger than the increase in taxes, the outlook is for a smaller current budget surplus than was expected as of March 2024. On top of this, a further increase in forecast overall borrowing comes from a large increase in capital spending relative to previous plans. The government is planning an additional £28 billion of capital spending per year by the end of the forecast period, sufficient to keep net investment spending steady as a percentage of national income, rather than falling as was planned by the previous government.
In consequence, Rachel Reeves’s Autumn 2024 Budget represented a major tax-raising Budget, but also a major fiscal loosening relative to previous plans: at £38 billion, or 1.1% of national income, the policies represented one of the largest permanent net fiscal loosenings at any full fiscal event since 2010, as shown in Figure 3.3. The Office for Budget Responsibility (OBR) noted at the time that, while direct like-for-like comparisons are difficult, the Autumn 2024 Budget represented ‘one of the largest [increases in borrowing] outside of a crisis since the pre-election Budget in March 1992’ (Office for Budget Responsibility, 2024).
In other words, the Chancellor decided to reduce borrowing by less over the forecast period than her predecessor’s stated plan, to rely more on tax rises for the fiscal consolidation that remains, and to maintain investment spending as a share of national income. This decision comes against the backdrop of a steep increase in debt as a share of national income over the last 25 years, shown in Figure 3.4. The largest increases came during the global financial crisis and the COVID-19 pandemic, but debt has continued to increase steadily since 2022, and is forecast to continue doing so under the Chancellor’s plans.
Figure 3.3. Scale of additional borrowing in the fifth year of the forecast at each fiscal event
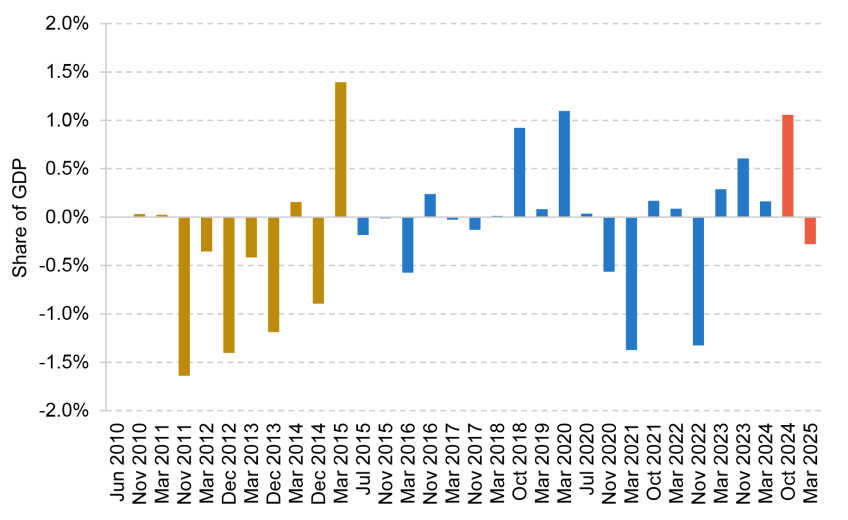
Note: Positive values reflect increases in public sector net borrowing, negative values reflect reductions in public sector net borrowing. The fourth year of the forecast is used for the July 2020 Summer Economic Update, as a forecast for borrowing in the fifth year was not provided. Blue represents fiscal events presided over by Conservative governments, red represents those presided over by Labour governments and gold represents those presided over by the Conservative–Liberal-Democrat coalition government.
Source: Office for Budget Responsibility, Forecast Revisions Database, March 2025.
How does the UK’s debt trajectory compare with those of its international peers?
This debt trajectory over the last 25 years has changed the UK’s position relative to its peers (Figure 3.4). At the start of the century, the UK had only the 21st-largest debt-to-GDP ratio out of 37 advanced economies, and – as Gordon Brown as Chancellor often stated – the lowest debt-to-GDP ratio in the G7. Since then, the ratio has tripled in the UK, while the average level of debt across advanced economies has fluctuated without rising substantially over the period as a whole, leaving us with the fifth-highest debt level among advanced economies. Government borrowing this year is higher in the UK than in most advanced economies (Office for Budget Responsibility, 2025, chart 1.1) and the gap between the UK and the average among advanced economies is forecast to be stable for the rest of the decade.
Figure 3.4. Government net debt as a percentage of national income in the UK and comparator countries
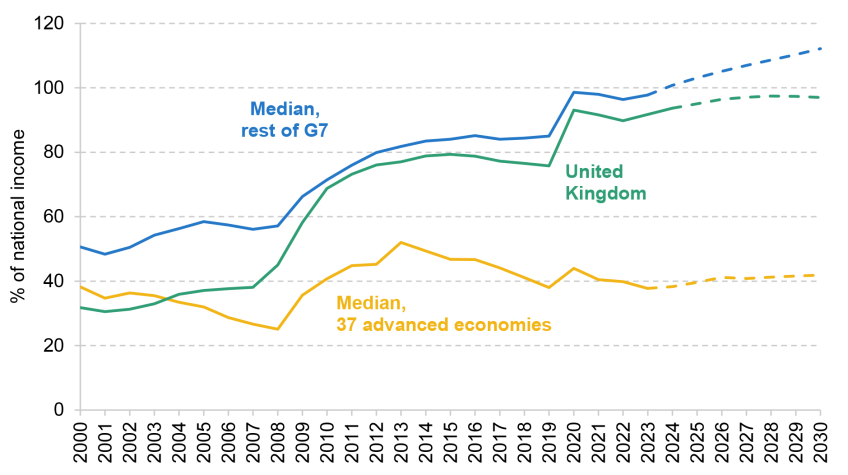
Note: The 37 advanced economies are the EU27 (except Greece), the rest of the G7, Australia, New Zealand, Iceland, Israel, Norway, South Korea, Switzerland and Taiwan. Net debt is measured on a general government basis. This is internationally comparable, but differs from public sector net debt, public sector net financial liabilities and other measures of public sector debt commonly used in a UK context.
Source: International Monetary Fund, World Economic Outlook, April 2025.
Among larger economies – which typically have higher ratios of debt to national income – the UK now looks less unusual than it did prior to the global financial crisis: levels of debt have also risen significantly in most other G7 countries, with France and the United States in particular experiencing similar increases following the twin crises of the global financial crisis and the COVID-19 pandemic.
Debt interest spending
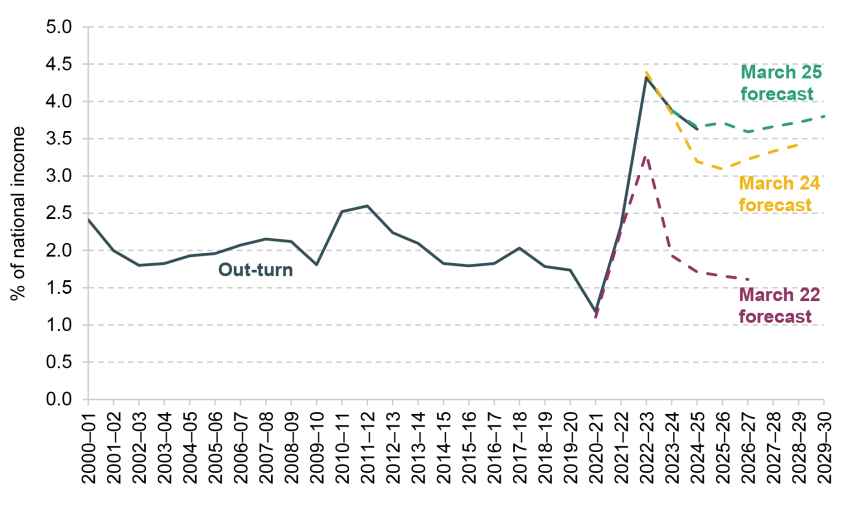
One reason to be concerned about growing debt as a share of national income is the rising cost of financing that debt. Prior to the pandemic, debt interest spending had fluctuated around 2% of GDP for several decades; in the 2010s, ultra-low interest rates kept debt interest costs down despite a higher level of debt. Since then, debt has increased further and interest rates have risen sharply, pushing up debt interest payments. They surpassed 4% of national income in the 2022–23 financial year, the highest share seen in the UK since 1950.2 Over time, the degree to which this increase was expected to be permanent has changed: at the onset of the 2022 cost-of-living crisis, debt interest payments were expected to fall back fully to their pre-pandemic (low) level, as shown in Figure 3.5. Now, higher debt interest costs are expected to remain with us: as of the March 2025 OBR forecast, debt interest is expected to remain between 3.5% and 4.0% of GDP throughout the five-year forecast horizon. This represents a substantial strain on the public finances: debt interest payments this year are set to be £64 billion higher than they were expected to be just three years ago. This increase is roughly equivalent to the total size of the core schools budget this year, and is significantly larger than the increase in day-to-day spending implemented by the Chancellor over the first year of government.
Figure 3.5. Debt interest spending as a percentage of national income compared with past forecasts
Source: Office for Budget Responsibility, Public Finances Databank, July 2025, and Economic and Fiscal Outlooks, March 2022, March 2024 and March 2025.
Debt interest spending this year was equivalent to 9% of overall government revenues, compared with an average 6% over the two decades to 2020. This is a key reason why it is a difficult time to be Chancellor, and why the trade-offs facing the government are so acute: without further increases to tax or to borrowing, debt interest spending leaves a smaller share of the pie for other, more attractive types of spending. Reducing the debt interest bill, however, is easier said than done. In large part, it reflects repayments on borrowing undertaken by past governments, which by definition is outside the current government’s control. For that reason, reducing borrowing over this parliament would only reduce the level of debt very slowly, and thus – at least in terms of its direct effect – have only a limited effect on debt interest: if borrowing were reduced by £10 billion in each year of the forecast, and assuming no knock-on impact on market interest rates, this would save an estimated £2.1 billion in debt interest in 2029–30. That said, the UK is currently in the unfortunate position of both paying interest on a larger debt stock than most countries and paying a higher interest rate on that debt (in the form of high bond yields – see Chapter 2 of this Green Budget). Measures that boosted the confidence of the bond markets and thus reduced yields – the interest rate charged on government debt – could generate additional savings. Getting the same savings in 2029–30 from reduced yields as from a £10 billion reduction in annual borrowing over the next five years would take a 0.17 percentage point reduction in yields, less than half of the increase in 20-year gilt yields since the start of 2025. On the other hand, increased borrowing – even for legitimate and urgent policy priorities – runs the risk of increasing gilt yields, generating additional costs for the government.
In the following sections, we set out in more detail the challenges Ms Reeves faces going forward, and how they might be addressed. Section 3.2 focuses on the fiscal rules, setting out recent changes, areas of weakness in the current system and some common proposals for potential improvement. Section 3.3 discusses the case for building more headroom against these fiscal rules. Section 3.4 then analyses what the forecast set out in Chapter 1 of this year’s Green Budget might mean for the public finances. Section 3.5 focuses on the risk of the OBR downgrading productivity and its fiscal impact, while Section 3.6 discusses significant additional risks facing the public finances in the medium term. Section 3.7 concludes.
3.2 Fixing the fiscal rules?
Over the last year, the government has made significant changes to the fiscal rules, legislated in the Charter for Budget Responsibility (HM Treasury, 2025a). The Charter provides for some changes to be rolled out over the next several years.
The first fiscal rule targets a forecast current budget surplus, where day-to-day spending is less than total revenues, in 2029–30. This replaced a rule which mandated that public sector net borrowing – including both borrowing for day-to-day spending and borrowing for investment – remain below 3% of GDP in the final year of the forecast period. Over the first few years of government, the target year for the new rule is being held at 2029–30, such that the horizon over which the fiscal rule binds will shrink from five years to three. From the 2026–27 financial year onwards, the fiscal rule will bind in the third year of the forecast. From that point onwards, the Charter will also allow the government to consider the borrowing rule to be met in case of a small deficit in some circumstances. The stated – and laudable – aim of this is to limit major fiscal events to one a year by avoiding the need for fiscal ‘tinkering’ to continue meeting the rule, which might (for example) turn a Spring Forecast into a fiscal event.
The second fiscal rule states that debt, specifically as measured by public sector net financial liabilities (PSNFL) – also known as public sector net financial debt – must be falling as a share of national income by 2029–30. The previous government had a similar rule targeting falling public sector net debt (PSND) excluding the Bank of England, a narrower measure of debt, as we discuss later. As with the borrowing rule, the debt rule will continue to bind in 2029–30 for several years, until it becomes a rolling target binding in the third year of the forecast.
The long-standing welfare cap is an oddly designed fiscal rule, and the 2023 IFS Green Budget called for it to be consigned to ‘the dustbin of history’ (Emmerson, Mikloš and Stockton, 2023). It nevertheless remains in place, but is widely ignored – perhaps in part due to increases in social security spending in recent years leading to it being on course to be breached.
In the following, we set out design choices for fiscal rules, the problems they are trying to solve, and how recent and ongoing changes to the fiscal framework fit in.
When should the fiscal rules bind?
Choosing a horizon for a fiscal rule to bind – whether a target should be achieved in the out-turn, three years out, five years out, or at another point in the forecast – involves making trade-offs, with no single, best answer.
At one extreme, a fiscal rule that binds in the out-turn – for example, a commitment to run at least a balanced current budget in every year – offers the benefits of strong commitment and transparency: policies would only help meet the rule once they are implemented, hence there is no risk of a policymaker formally meeting the rule by promising to cut spending or raise taxes and then failing to do so.
However, it is extremely rigid: in a temporary economic downturn, immediate tax rises or spending cuts required to meet such a fiscal rule would likely exacerbate the economic situation. To give an example: suppose at the start of the fiscal year the forecast was for a £20 billion current budget surplus, but 11 months into the fiscal year it was clear that current borrowing would actually be £30 billion higher than expected, and so the current budget would actually be on course to be in deficit by £10 billion. This is around the amount by which the in-year forecast for borrowing in 2024–25 increased over the course of the year, excluding in-year policy measures. Strict compliance with the rule would require £10 billion of fiscal tightening to be implemented in just one month and for this to happen even if the medium-term outlook for the public finances had not deteriorated. And if the deterioration was expected to last, a Chancellor would be forced to adjust immediately even if a gradual adjustment might be more appropriate. Countries with a fiscal rule binding in the out-turn, such as Germany and Switzerland, therefore combine these rules with extensive emergency ‘escape clause’ mechanisms whose design becomes the crux of the rule.
Balancing flexibility and credibility
On the other hand, a fiscal rule that targets the forecast for a future year gives a Chancellor the flexibility to respond to temporary disturbances and long-term changes in an economically less damaging way. The benefits of this could be substantial.
But, of course, there is a risk that policymakers may not use this flexibility in a well-judged and economically sound way: they may be tempted to over-rely on ‘temporary’ policies, even in cases where this creates damaging uncertainty, just because those policies are less restricted by the rolling fiscal rule. The full expensing policy in corporation tax introduced by then Chancellor Jeremy Hunt in his Spring 2023 Budget as a temporary three-year policy – despite his stated ‘ambition’ to make it permanent, and despite the benefits of stable expensing rules for long-term investment decisions – is an example of this. Supposedly ‘temporary’ policies can also compromise the credibility of the forecast when policymakers abuse them in order to duck difficult decisions and maximise the number of times they can announce a fiscal giveaway. The charade where successive Chancellors pretend that rates of fuel duties will rise in line with inflation is a vivid example. Similarly, rules binding far into the future can enable more short-term borrowing if followed by pencilled-in implausibly tight spending plans, which allow policymakers to meet the fiscal rules with plans that are unlikely to ever be implemented.
A rolling fiscal rule may also discourage some kinds of short-termist behaviour: if a policy has up-front costs but longer-term benefits that appear within the forecast horizon, then it will seem more attractive under a rule with a longer horizon (conversely, a policy with short-term benefits but longer-term costs will look less attractive). In practice, it is rare for the Office for Budget Responsibility to score policies as having different effects by the end of its forecast than they have partway through the forecast. In the last ten OBR forecasts, only one permanent policy change – the reforms to non-domicile taxation announced in Ms Reeves’s October 2024 Budget, which were expected not to raise any revenue by the fifth year of the forecast – was judged by the OBR to have fiscal effects in the short term that did not persist over five years.3 In order for the fiscal rules actively to incentivise policies with large long-term benefits, the horizon against which they were judged would likely need to be rather longer than the five-year horizon on the OBR’s forecasts. In cases where the long-run benefits, or costs, of a policy in the longer term were significantly different from those expected by year 5, it would be sensible for the OBR to publish these estimates.
With a rule targeting the forecast rather than the out-turn, the forecasters’ judgements on the outlook for the economy (most importantly, the path of nominal GDP, as that is one of the biggest drivers of the outlook for revenues) and on the costs and benefits of policies become a key factor in determining whether fiscal rules are being met or missed. In contexts where forecasts are not independent from government – such as in the UK before the establishment of the Office for Budget Responsibility in 2010 – this often creates a strong temptation to produce an overly optimistic forecast, damaging transparency and enabling policymakers to defer difficult decisions.4 Even if the forecaster is formally independent, there is a risk that the forecast is perceived as having been influenced by political considerations.
Bringing the target year forward to the third year
The main rule in place until 2024 mandated debt to fall as a share of national income five years into the future. While the forecast period is five years, this choice maximises flexibility.
However, this comes at the cost of a less credible commitment. For much of the period this rule was in place, the majority of this time frame was outside of the period covered by a Spending Review which would have set spending plans for individual departments. This means the implications of provisional total departmental spending plans were not specified and were widely perceived to lack credibility. Five years is also longer than the typical tenure of a Chancellor over this period – of the nine UK Chancellors between 1997 and 2024, only Gordon Brown and George Osborne were still in the position three years after their first fiscal event (with none of the six Chancellors between 2016 and 2024 remaining at the Treasury for that long). Chancellors could therefore meet fiscal rules by pencilling in ambitious plans that they were unlikely to have to implement themselves.
Among the changes to fiscal rules at the 2024 Autumn Budget was a process by which the horizon is gradually shortened until both rules (the current budget rule and the debt rule) bind in the third year of the forecast. This process is currently underway; at the upcoming 2025 Autumn Budget, the rules will bind in 2029–30, the fourth year of the forecast. This comes with a loss of flexibility: some temporary disturbances may not have fully worked their way through the economy within three years, obliging a Chancellor to take action to meet their fiscal rule at an economically premature point. In contrast, five years might be enough for the economy to have recovered, making it ‘safe’ for the Chancellor to raise taxes or cut spending after the disturbance ends to meet their fiscal rules.
But for a forward-looking fiscal rule, what matters is not how long a disturbance ends up lasting, but how long it is expected to last at the outset. The impact of a recession on borrowing is typically expected to have faded within three years after it first begins. Over the 30 forecast updates made by the OBR since its inception, none included a substantial deterioration to the underlying forecast for borrowing in year 3 that was nonetheless expected to dissipate by year 5.5 Deteriorations that were expected to last three years – such as the initial inclusion of the COVID-19 pandemic into forecasts in the summer of 2020 – were expected to be permanent. So, in practice, based on the OBR’s forecasting record, any economic deterioration in the third year of the forecast can approximately be treated as a permanent downgrade, and something the government ought to be responding to.
There is no ‘magic’ year for the fiscal rule to bind that would make the trade-off between flexibility and a credible commitment simply disappear. But in the context of the current framework, there is a reasonably strong case that bringing the target year forwards to the third year appropriately balances costs and benefits.
Which borrowing?
The fiscal rules Ms Reeves introduced in the Autumn of 2024 also targeted subtly different fiscal aggregates from her predecessor’s. Instead of a ceiling on overall borrowing, she aims for a current budget surplus by the third year of the forecast (once the rule is fully rolled out); in other words, to pay for day-to-day spending from revenues without resorting to borrowing. Investment spending is not capped by this rule. While this is consistent in spirit with the large top-up to investment spending plans set out at the same time, the change in the rule was not necessary to allow for this top-up: because the previous borrowing rule only capped overall borrowing at the fairly loose limit of 3% of national income, it would also have been met – and by a larger margin – even with the new, higher planned level of investment spending (2.4% of national income in 2029–30). There are, however, arguments in favour of targeting the current budget rather than total borrowing: not least as an approximate rule-of-thumb that it might be reasonable to borrow for spending that future generations will benefit from while, on average, ensuring that revenues are sufficient to cover day-to-day spending from which the benefits may be felt immediately. When the borrowing rule is the binding one, it also avoids the temptation for policymakers to cut investment spending when the rule is being missed, creating damaging uncertainty and potentially storing up problems for the future.
Which debt?
The rule to get debt on a falling path switched to targeting public sector net financial liabilities (PSNFL). Compared with the measure targeted previously, this measure includes a broader range of financial assets, such as the student loan book, and liabilities such as those associated with a small number of funded pension schemes (for more details, see Emmerson et al. (2024)). Figure 3.6 shows how the two measures of government debt have evolved since 2008, and were forecast to evolve at the OBR’s forecast in March 2024, before the general election, and at the most recent forecast this past March.
Figure 3.6. Measures of public sector debt netting off different assets: out-turn and March 2024 and March 2025 forecasts

Note: The March 2024 forecast is the restated version, which is methodologically comparable to the March 2025 one.
Source: Office for Budget Responsibility, Public Finances Databank, September 2025 and Historical Official Forecasts Database, March 2025.
In one sense, the switch to targeting PSNFL ‘allowed’ additional borrowing for investment: public sector net debt excluding the Bank of England is now forecast to be rising in every forecast year – albeit only slightly between 2028–29 and 2029–30 – which would have breached the previous government’s fiscal rule. In contrast, PSNFL is forecast to fall in the final two forecast years, again by a slight margin, meeting the current Chancellor’s fiscal rule. However, this is not because of any direct relationship between the additional investment spending and the assets netted off the debt measure: investment in public services announced at the Autumn 2024 Budget is largely intended to add to or improve physical assets such as school buildings, medical equipment and low-carbon heating technology. These are all non-financial assets which are not netted off either measure of debt. Instead, the reason PSNFL debt is falling even with the additional investment spending is that it was falling more steeply than net debt to begin with. This reflects the different treatment of the student loan system in the two measures and the fact that government-owned financial assets such as stocks and shares tend to gain value over time, leading to PSNFL falling.
Box 3.1. How would different measures of debt reflect a nationalisation?
When private companies providing services essential to public welfare or to government priorities are in financial difficulty, there are sometimes calls for the government to step in. This could take different forms, but one of the most decisive actions is nationalisation, an option that is discussed in the context of struggling rail operators and water companies (Cunliffe, 2025), for example. A sensible decision in these cases would rest on the question of whether the resources employed (capital assets and staff) to provide the relevant service could be more efficiently managed in the public or the private sector. In principle, fiscal rules targeting a measure of debt that encompasses a wider range of assets and liabilities could help decisions be made in this way. A narrow focus on (a subset of) an entity’s debts is not likely to provide a good guide to the true fiscal impact of a nationalisation – much less its impact on wider policy objectives.
It matters, though, precisely which measure of debt is used. The measure used in the government’s fiscal rules, public sector net financial liabilities, would recognise new financial assets and liabilities owned by, for example, water companies that nationalisation would bring onto the government’s balance sheet. However, the main assets owned by water companies (nearly 90% of their overall assets, by the OBR’s estimate) and other utility providers are physical infrastructure – non-financial assets – and the value of these would not be netted off against PSNFL (or, for that matter, the measure of debt that preceded it in the fiscal rules, PSND ex. BoE). Such physical assets are netted off public sector net worth, an even more comprehensive measure of the government balance sheet. Its trajectory can deliver important insights, but targeting it in a typical fiscal rule would come with major downsides and the government was wise not to target it directly (Zaranko, 2023). The OBR provisionally estimates that water sector reclassification would have increased public sector net financial liabilities by £78 billion in 2023–24 (Office for Budget Responsibility, 2025)
Another key point here is that UK debt rules since 2010 have all targeted the change in rather than the level of debt. Recent rules have been forward-looking, with the current rule eventually targeting year 3 of the forecast. Therefore, to the extent that nationalisation represented a one-off shift in the assets and liabilities on the government balance sheet, it would have no impact on performance against the fiscal rules. However, the trajectory of the value of those assets and liabilities – or, to be accurate, the expected future trajectory, as it would appear in the forecast – will affect the change in debt in future years and so be of relevance to performance against the fiscal rules.
If nationalised utility companies are likely to take on more debt in future, then (assuming this was not associated with greater financial assets) this would make the debt rule, as currently configured, harder to meet. If the reason for nationalisation is that the company was in major financial difficulty, this is perhaps not an unlikely scenario, but the precise impact would depend on the OBR’s judgement on the likely trajectory of its liabilities. With the debt rule now in place targeting PSNFL, the trajectory of financial assets owned by nationalised companies would also matter, but in most cases these assets will be limited and therefore the switch in debt measures would make little difference to the impact of nationalisation on compliance with the fiscal rules.
Cyclical adjustment: minding the gap?
Unlike Ms Reeves and her immediate predecessors, past Chancellors have sometimes targeted cyclically adjusted measures – Philip Hammond was the last Chancellor to set a target for cyclically adjusted borrowing in 2016, and the 2017 Labour manifesto proposed targeting debt as a share of cyclically adjusted national income. Cyclical adjustment refers to targeting a measure of, for example, borrowing that has been statistically adjusted in an attempt to remove the temporary impacts of the ups-and-downs of the business cycle. The idea is attractive: few would argue that governments should not borrow to support the economy temporarily during recessions. The alternative would be to raise taxes or cut spending in order to bring down borrowing in recessions, even if any extra borrowing was temporary. Unless looser monetary policy could fully offset the impact of these policies, they would risk exacerbating any downturn. If cyclical adjustment works well, it could show whether extra borrowing was caused by temporary factors or needed correcting.
However, constructing such a cyclically adjusted measure requires estimating the output gap: the gap between actual output – something that is observed noisily and is commonly revised long after the fact – and underlying ‘potential’ output – a concept that can never be directly observed at all. And, furthermore, it requires a reliable estimate of the extent to which a given amount of temporary weakness in the economy would worsen headline measures of the public finances. So, estimating the output gap is a task fraught with uncertainty, to put it mildly. Different methodologies frequently disagree on the size, and sometimes even the direction, of the output gap at any given point in time.6 Even if the size of the output gap were known, different types of recessions will have different temporary impacts on the public finances: for example, a recession associated with a downturn in the housing market or the financial sector would likely cause an especially large hit to revenues. Formally targeting a cyclically adjusted measure as part of the fiscal rule would make fiscal policy dependent on an additional and opaque methodological layer, on top of the many decisions already and inevitably involved in a fiscal forecast.
Rolling fiscal rules targeting the third year in combination with a credible independent forecast already allow the Chancellor a fair degree of flexibility in responding to most – although not all – temporary disturbances. Additionally reintroducing cyclical adjustment might add beneficial flexibility in some circumstances – but at a large cost in clarity and transparency.
Should we target a range, not a point?
Bright-line fiscal rules that target a single point, such as have been typical in the UK, are criticised for contributing to excessive policy volatility, or ‘tinkering’. This is greatly exacerbated by the (recent) tendency of Chancellors to aim to meet those rules almost exactly, which means that Chancellors are obliged to make frequent changes to tax and spending plans when the forecast deteriorates even a little, in order to stay on the right side of the rule. This might lead to unnecessary uncertainty for taxpayers and recipients of social security spending, to damaging speculation in the run-up to any fiscal events, and to rushed policymaking that is driven by the specifics of a fiscal rule rather than any more principled policy objective. It has clearly undermined the welcome commitment of successive governments to hold only one fiscal event a year.
The planned range on the borrowing rule
Partly in response to this concern, the Treasury has said that once 2029–30 becomes the third year of the forecast horizon, an additional margin against the borrowing rule will be introduced in order to make it easier for the Chancellor to avoid making policy changes outside of full fiscal events, with policy adjusted only once each year at a full fiscal event in the autumn. The idea is that the Spring Forecast would typically provide only an update, rather than containing substantial fiscal measures (so, while containing a fiscal forecast, it would not be a fiscal event).
Specifically, the intention is that, from the 2027 Spring Forecast onwards, as long as the current budget is not in deficit by more than a small amount (0.5% of national income), this would not constitute a breach of the borrowing rule and hence would not require immediate corrective action from the Chancellor. In subsequent Autumn Budgets, a balance (or better) on the current budget would be required, so if the OBR’s forecast from the previous spring had been for a small current budget deficit, the Chancellor would either need the forecast to improve or need to take corrective action.
This would be a sensible, even elegant, way to deliver greater policy stability and avoid some of the problems highlighted above in instances when the borrowing rule is binding but the debt rule is not. However, our careful reading of the legislated Charter for Budget Responsibility, which the OBR will presumably use as the rulebook to how the fiscal rules operate, differs from the way that the Treasury has described it (and as we have so far described it). In particular, our reading of the legislation is that the range will apply at all fiscal events from Autumn 2026 onwards, not only at Spring Forecasts produced between fiscal events – see Box 3.2 for more detail. If our interpretation is correct, achieving what the Chancellor intends could require revised legislation to be passed by Parliament. Some clarification would, in any case, be welcome.
Box 3.2. The Charter for Budget Responsibility: in need of a redraft?
The key part of the Charter for Budget Responsibility introducing a range for the current budget is paragraph 3.6 (HM Treasury, 2025a):
‘In order to achieve the above objectives, the Treasury’s mandate for fiscal policy is that:
- ‘the current budget must be in surplus in 2029–30, until 2029–30 becomes the third year of the forecast period. From that point, the current budget must then remain in balance or in surplus from the third year of the rolling forecast period, where balance is defined as a range: in surplus, or in deficit of no more than 0.5% of GDP
- ‘this range will support the government’s commitment to a single fiscal event every year by avoiding the need for policy adjustment at forecasts outside of fiscal events. If the range is used between fiscal events, the current budget must return to surplus from the third year at the following fiscal event.’
The Treasury’s objective (as made clear in the second bullet) is to avoid making fiscal adjustments at forecasts outside of the Autumn Budget each year (i.e. at Spring Forecasts), and not to have the borrowing rule apply as a range at every fiscal event. However, as currently drafted (and legislated), it is not clear that this is how it would apply – or that the Budget Responsibility Committee at the OBR would interpret it as applying only outside of autumn fiscal events.
To see why, note first that the first bullet states that the range will apply from the point at which 2029–30 becomes the third year of the forecast horizon. This will be in the first fiscal forecast of financial year 2026–27, which on the current timetable is expected to be the Autumn 2026 Budget. On our reading, it is from that point that the current budget target will apply as a range – i.e. the range will first be applied at a full fiscal event. After that, because it is not specified that the range will only apply at Spring Forecasts, and it will have applied at Autumn Budget 2026, it seems reasonable to assume that it will then apply at all subsequent full fiscal events.
There is then a second consideration: the fact that in those subsequent fiscal events (i.e. Autumn Budgets from 2027 onwards), whether or not the current budget is required to return to surplus from year 3 will depend on whether the previous Spring Forecast made use of the range or not. This will lead to the odd situation that the necessary fiscal response required in Autumn 2027 will depend not just on the forecast for the current budget in 2030–31 (which will then be the third year of the forecast horizon) made at that point in time, but also on whether or not the 2026 Spring Forecast for 2029–30 was for a surplus on the current budget or for a small current deficit. It would be surprising if this was what the Treasury intended.
It would seem sensible for this to be clarified, and perhaps for the legislation to be amended, if the government does not intend the range to apply at all forecasts, but only at those outside of fiscal events. That could also be an opportunity to bring forward the point at which the range applies, to Spring 2026 (an option discussed at more length in Emmerson, Miller and Zaranko (2025)).
A range on the debt rule?
As it stands, the Charter does not introduce a range for the debt rule – only the borrowing rule. This means that the range on the borrowing rule would only be enough to prevent the Chancellor needing to make policy changes outside of major fiscal events if the debt rule was not the binding constraint on policy. As discussed in Section 3.4, it is eminently possible that the debt rule will bind as soon as the Autumn Budget. Therefore, it might be the debt rule prompting frequent policy changes outside of fiscal events, even if the borrowing rule operates with a range.
It is sensible to aim for debt to be falling over time outside of crises, but the idea is notoriously difficult to operationalise well as a formal fiscal rule, as we have discussed in successive Green Budgets (e.g. Emmerson and Stockton, 2021). While the Autumn 2024 changes to the fiscal framework changed the targeted measure of debt and began the process of bringing the target year forward to the third forecast year, the basic structure of the debt rule – which targets the change in the ratio of debt to national income over the course of a year – remains in place.
The debt rule is just as problematic as it ever was. Performance against the rule – whether the rule is met or missed and by how much – can swing wildly in response to minor changes in the economic outlook (it is especially sensitive to the forecast growth in the cash size of the economy in the year in which the rule applies), or deliver starkly different assessments of similar policies (for some illustrative examples, see section 3.2 of Emmerson, Mikloš and Stockton (2023)). Aiming to meet such a rule almost exactly leaves the Chancellor even more of a hostage to fortune than doing so with a borrowing rule, owing to the additional volatility, and frequent ‘fiscal tinkering’ to meet it is even more futile. Operating with a greater degree of headroom might be the most obvious solution. Failing that, a range might help to limit the damage caused by a fiscal rule that is more poorly designed than most. It would not, however, fix the more fundamental problems with a rule designed in this way.
3.3 How much headroom is enough?
At the Spring Statement in March, the government left itself £9.9 billion of headroom against its fiscal rule to have a forecast current budget surplus in 2029–30, and slightly more against its debt rule. This was notable for two reasons. First, the amount of headroom against the borrowing rule was ridiculously similar – within £3 million – to the forecast made by the Office for Budget Responsibility in the Autumn Budget the previous October. Second, the level of headroom was historically low, at less than 0.3% of national income. As shown in Figure 3.7, this continues a recent trend of Chancellors leaving themselves very small amounts of headroom, with successive Chancellors leaving a margin of error of less than 0.4% of GDP against their fiscal rules at every fiscal event since November 2022. This is in contrast to the period from the inception of the OBR in 2010 to 2022, when no Chancellor left a margin of error of less than 0.4% of GDP against their fiscal rules, and headroom was twice this level on average.
Figure 3.7. Headroom as a percentage of national income against fiscal rules at each fiscal event
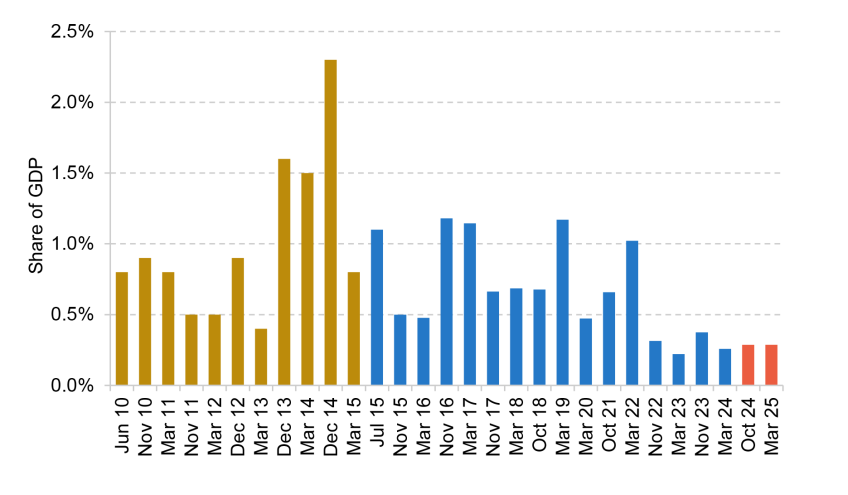
Note: Margin against the fiscal rule in place at each fiscal event that was closest to being breached. Blue represents fiscal events presided over by Conservative governments, red represents those presided over by Labour governments and gold represents those presided over by the Conservative–Liberal-Democrat coalition government.
Source: Office for Budget Responsibility, Economic and Fiscal Outlook, March 2025.
Leaving only a small amount of margin against fiscal rules and targeting a hyper-specific level of headroom both lead to the same risk: even very ordinary changes in the economic outlook prompt overly frequent policy changes. The resulting volatility in the policy environment is harmful. It makes it more difficult to set a stable policy trajectory to achieve a long-term objective, and firms, taxpayers and recipients of social security benefits have to cope with additional uncertainty.
In the face of risks to the outlook for spending and revenues, one option available to the Chancellor would be to increase headroom significantly, reducing the chance that overly reactive policymaking will be required in future. Of course, headroom is not an unmitigated good: it would require a combination of higher taxes and lower spending. One might also argue that the fiscal rules do more to prevent bad policy when they are being met by very narrow margins, by bringing trade-offs over additional spending or tax cuts more to the fore. The case for implementing spending increases or tax cuts may need to be stronger when they need to be balanced out by compensating measures in order to stay within the fiscal rules. One might hope that governments would always be alive to fiscal trade-offs, regardless of available headroom. But the constraints from a fiscal rule that is met only narrowly might increase discipline and reduce the risk of poor policy choices.
Headroom against the borrowing rule
In this subsection, we quantify how much headroom would be needed to remain within the government’s fiscal rules in the face of different recent shocks. We do this using the distribution of recent changes to the OBR’s forecast for borrowing and growth. This is based on the underlying changes – those that are not explained by changes to policy announced in the run-up to or at the fiscal event – in forecast borrowing in the third year of the forecast relative to the previous forecast at each of the 31 fiscal events since the inception of the OBR in 2010.7 We focus on the third year of the forecast as the fiscal rules will target the third year of the forecast at fiscal events from 2026–27 onwards. We perform additional calculations based on the fourth year of the forecast to quantify the headroom the Chancellor needs to withstand shocks before the Spring Forecast – the degree of headroom needed is broadly unchanged by whether the fiscal rules target the third or fourth year of the forecast.
The recent past is one guide to the plausible shocks to the borrowing forecast that the Chancellor might expect to face in future. Of course, a number of crises have increased expected borrowing over these 15 years, including the COVID-19 pandemic and past downgrades to the productivity forecast, so this could be thought of as a relatively pessimistic guide to future changes. However, there is also reason to think that the risky environment of the last 15 years may be the new normal, in which case we might think it reasonable for the Chancellor to plan for a similar distribution of shocks going forward.8
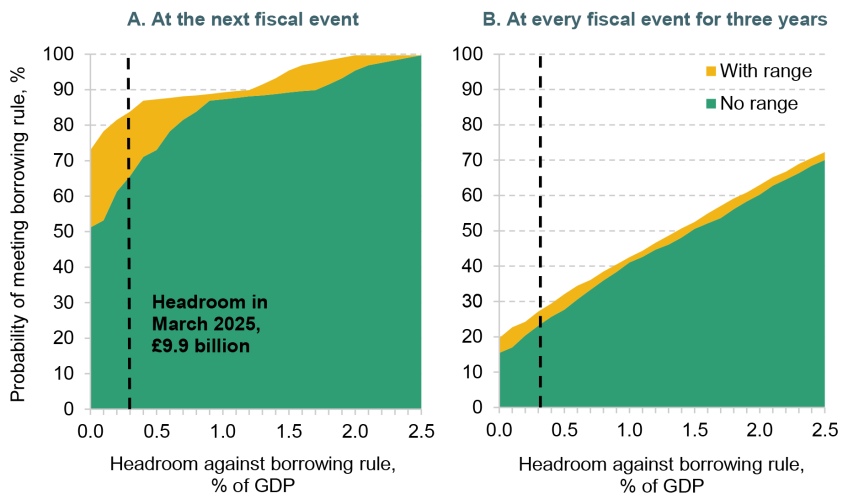
Figure 3.8. Probability of meeting the borrowing rule with no policy changes given different amounts of initial headroom (A) at the next fiscal event and (B) at every fiscal event for three years
Note: Charts display the probability of a government meeting its borrowing rule at subsequent fiscal events based only on underlying changes to borrowing, for given amounts of headroom against the borrowing rule at an initial Autumn Budget. Based on the government’s borrowing rule as it will be from 2026–27 onwards, targeting a current budget surplus in the third year of the forecast. Probabilities reflect an assumed distribution of changes to forecast current borrowing, based on recent underlying changes in forecast public sector net borrowing. For the probability across three years, underlying changes to public sector net borrowing are assumed to be independent and identically distributed. Headroom labelled is headroom against the borrowing rule.
Source: Authors’ calculations based on Office for Budget Responsibility, Forecast Revisions Database, March 2025.
The left panel of Figure 3.8 shows, for different amounts of headroom the Chancellor might leave herself at an Autumn Budget, the probability of meeting her borrowing rule at the next forecast in the Spring. Like many of her predecessors, the Chancellor has a stated ambition of only holding one fiscal event per year, but – at least for the moment – two OBR forecasts. One way to honour this commitment in most years would be to leave enough headroom at the Budget that it is unlikely to dissipate by the second (and final) OBR forecast of the financial year. As discussed in Section 3.2, the government now intends for the fiscal rules to permit a current budget deficit of no more than 0.5% of GDP (rather than balance or a surplus) at each Spring Forecast, but this is not set to apply at the 2026 Spring Forecast. Therefore, Figure 3.8 shows the probability that the Chancellor would be able to meet her borrowing rule without policy changes one forecast later if the rule permitted a range (in yellow) and without a range (in green).
For any given level of headroom at an Autumn Budget, the presence of a range would make it easier for the Chancellor to meet her borrowing rule in the Spring. Without a range, a Chancellor leaving no headroom might expect to meet her rule in the Spring without making policy adjustments around half the time (in the left-hand chart, with zero headroom, the green shaded area is at around 50%). With a range, the odds of avoiding such adjustments rise to 75% (shown by the yellow area). With the level of headroom seen at the last two fiscal events – £9.9 billion or 0.3% of GDP – the Chancellor would be expected to meet her fiscal rules in the Spring in two-thirds (66%) of cases without a range, or in 84% of cases with a range.
Put differently, if the Chancellor maintains her headroom at £9.9 billion at the Budget in November, then there is around a one-in-three chance that she will find herself on the wrong side of her rule by the Spring Forecast, based on past OBR revisions.
However, the Chancellor might want to avoid the need for policy volatility over a longer time span than just one forecast. The second panel of Figure 3.8 shows the probability of the Chancellor being able to meet the borrowing rule without policy changes at every fiscal event for three years. Two things are noteworthy. First, the range on the borrowing rule matters less over this longer time span. If the borrowing rule is met thanks to the range at the Spring Forecast, it still has to be met without the range by the next fiscal event, and so the range provides only a temporary reprieve.
Second, the level of headroom needed to be similarly confident of continuing to meet the borrowing rule for three years is much larger. In the face of a plausible random sequence of shocks, there is only a 20% chance that a government that left itself no margin for error would be able to go three years without being forced into policy changes in order to meet the borrowing rule, even with the range in place. The amount of headroom in March 2025 (0.3% of GDP) would not provide much additional security – it would be expected to withstand less than 25% of the possible outcomes we could see based on past shocks. In other words, there would be a three-in-four chance that the Chancellor would need to adjust policy over a three-year period to continue to meet her borrowing rule. In order to have a better-than-even chance of avoiding the need to make policy changes, the government would need 1.4% of GDP as headroom against the borrowing rule, or almost £50 billion.
Whilst 1.4% of GDP is not an inconceivable amount of headroom – it is similar to the levels maintained towards the end of the coalition government – it would require significant spending cuts or tax rises to reach it from the starting point of the last few years. For example, on the tax side, it would take a 4 percentage point increase in all rates of income tax or in the main rate of VAT to get to this level of headroom from the level achieved at the last two fiscal events.
Headroom against the debt rule
Of course, the Chancellor is not only constrained by the borrowing rule. While it has been the rule that was closer to being breached at the last two fiscal events, it is entirely possible that the debt rule may constrain policy more than the borrowing rule at the Budget in November (a point we return to in the next section).
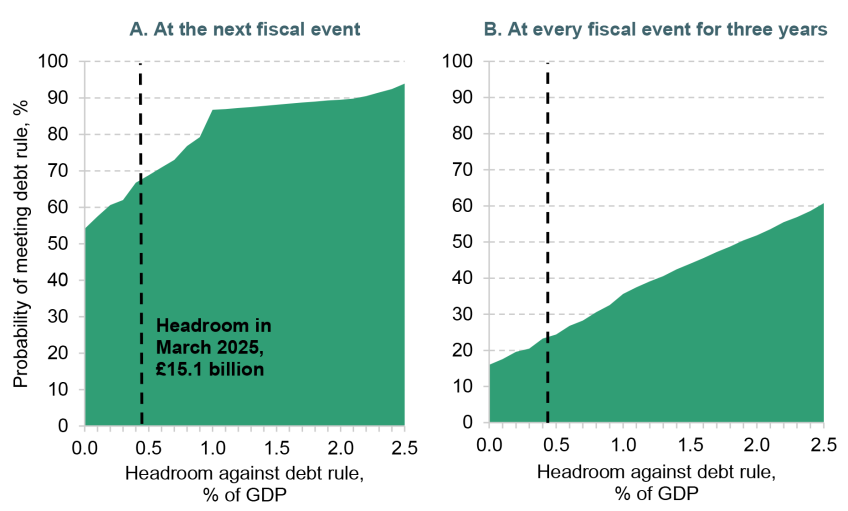
In Figure 3.9, we present the same exercise as above but for the probability of meeting the debt rule: to have PSNFL, a measure of debt, falling as a share of GDP in 2029–30. Generally, the amount of headroom needed to continue meeting the debt rule between one fiscal event and the next is similar to that needed to continue meeting the borrowing rule, if the borrowing rule is applied without a range. A Chancellor leaving no headroom against the debt rule might also expect to meet it at the next fiscal event without policy changes around half the time. At the Spring Statement, the Chancellor had (slightly) more headroom against this second fiscal rule – £15.1 billion or 0.4% of GDP. With this level of headroom, and once the rules roll forward to target the third forecast year, she might expect to meet the debt rule at the next forecast in around two-thirds (67%) of cases.
Table 3.2 presents the comparison of this exercise across different fiscal rules. It shows that the probability of staying within the debt rule for three years without making significant changes to policy is lower than that for the borrowing rule for almost any given level of headroom. This is in part due to the poor design of the debt rule: headroom against the debt rule is much more volatile, as it responds not just to underlying changes in borrowing, but also responds directly to changes in the forecast for growth in the nominal size of the economy in the year in which the rule binds. This volatility increases the chance that a downwards revision to the growth forecast eliminates whatever headroom the Chancellor has against the debt rule. More generally, the fact that performance against the debt rule is so sensitive not just to forecasts for economic growth over the forecast period as a whole, but to the exact trajectory of that growth, is an undesirable feature: while a revision to the overall growth outlook can be a good reason to adjust fiscal policy, a revision to the path of growth that hits a particular year while leaving the medium-term outlook unchanged is not.
Figure 3.9. Probability of meeting the debt rule with no policy changes given different amounts of initial headroom (A) at the next fiscal event and (B) at every fiscal event for three years
Note: Charts display the probability of a government meeting its debt rule at subsequent fiscal events based only on underlying changes to forecast borrowing and changes to forecast growth, for given amounts of headroom against the debt rule at an initial Autumn Budget. Based on the government’s debt rule as it will be from 2026–27 onwards, targeting public sector net financial liabilities (PSNFL) falling as a share of GDP in the third year of the forecast. All changes in growth forecasts between fiscal events are assumed to be underlying, and unaffected by policy announced at that fiscal event. Charts are based on PSNFL being at its 2024–25 level of 83.4% of GDP – changes to the stock of debt from forecast to forecast are ignored. For the probability across three years, pairs of underlying changes to public sector net borrowing and the growth rate at a fiscal event are assumed to be independent and identically distributed. Headroom labelled is headroom against the debt rule.
Source: Authors’ calculations based on Office for Budget Responsibility, Forecast Revisions Database, March 2025 and Historical Official Forecasts Database, March 2025.
Should the debt rule stay in place, there is clear value in maintaining a great enough margin against it that its inherent volatility does not drive key policy decisions. However, on account of this volatility, the level of headroom required to have a better-than-even chance of staying within the debt rule without policy changes over a three-year period is significantly larger than for the borrowing rule – around 2% of GDP (£71 billion), as per Table 3.2.
Generating this level of margin of error against the debt rule might be considered infeasible – the government has only left itself a larger amount of headroom than this against its fiscal rules once in the last 15 years (see Figure 3.7). This should perhaps be taken as a sign that the forecast change in debt as a share of national income between two particular future years is quite simply too volatile a measure to be a useful target for a fiscal rule.
Table 3.2. Probabilities of meeting fiscal rules from different headrooms
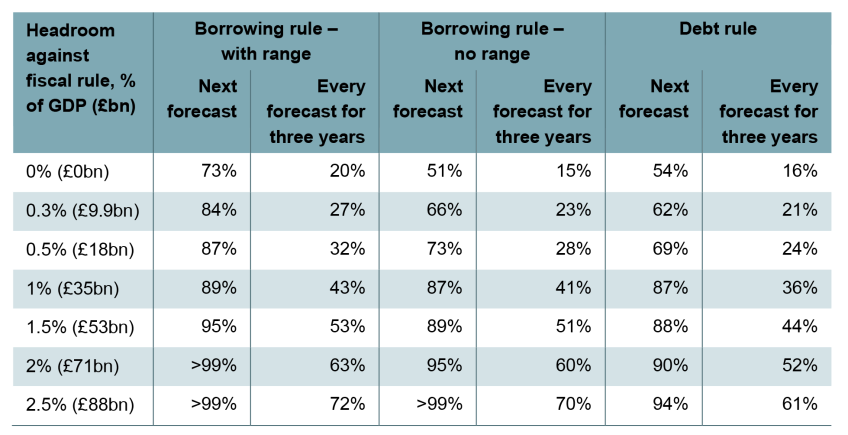
Note: Probability of meeting each fiscal rule over different time spans without the need for any policy changes. 0.3% included to illustrate the level of headroom against the borrowing rule at the last two fiscal events. See notes to Figures 3.8 and 3.9 for details on the underlying calculations. Values in £bn presented as the percentage of March-centred nominal GDP in 2029–30.
Source: Authors’ calculations based on Office for Budget Responsibility, Forecast Revisions Database, March 2025 and Historical Official Forecasts Database, March 2025.
A case for more headroom
We should not expect an increase in headroom to avert permanently the need for policy changes in response to changing economic circumstances – and nor would this be a sensible goal to set. As Figure 3.9 shows, there is a reasonable chance that even with headroom at 1.5% of GDP, additional adjustment would be needed over the next three years, and that is not necessarily a problem – policy should adjust to changing circumstances.
But policy volatility could also be excessive if keeping headroom high becomes a target in itself: a government with a new target, official or unofficial, to keep headroom above a certain, fixed level would likely also need to make frequent policy adjustments to keep borrowing below the new target (even if it were nowhere near breaching the actual, legislated fiscal rule). This is what the Chancellor appeared to do this past March, and if it became standard practice, it would exacerbate the problem of policy volatility. Instead, a one-off increase in headroom would significantly reduce the extent to which policy needed to be specifically tailored to the fiscal rules in the short run, by allowing policymakers to stop ‘tinkering’ and let headroom fulfil its role as a buffer.
Increasing headroom might also bring with it additional benefits, in particular from a reduction in debt interest spending, as discussed in Section 3.1. If an increase in headroom resulted from lower sustained borrowing, this would directly reduce the scale of debt interest payments. Further, a greater margin of error against the fiscal rules might improve the confidence of the bond markets. This might be because it signals that a government is serious about the sustainability of the public finances and will not jettison the fiscal rules entirely, because it demonstrates a government’s ability to make difficult trade-offs, or because it promotes strategic, long-term reform in place of last-minute ‘tinkering’ in the run-up to every new forecast. Reducing the risk premium associated with gilts might bring down the rates the government pays in interest on its debt. If it did bring down gilt rates, every 0.1 percentage point fall would bring down annual debt interest spending by about £1 billion.
There is, of course, one big reason why the Chancellor might not choose to increase headroom: it would require tax rises or spending cuts. The level of tax rises and spending cuts needed to generate a material buffer might be considered politically infeasible, particularly given the constraints on tax rises stemming from pre-election promises, and constraints on cuts to social security spending from parliament. These constraints may be harder to overcome in pursuit of additional headroom than they would be merely to comply with existing fiscal rules.
3.4 Risks to the economic and fiscal outlook
Since the Office for Budget Responsibility last presented a forecast in March, recent and planned cuts to social security benefits have been partially reversed, consumer prices have risen by more than forecast, and gilt yields – the interest rate at which the government borrows – have increased. Forecasters at the Bank of England and elsewhere expect economic growth going forward to be slower than the OBR forecast in March – as has been the case for some time. Each of these developments affects the outlook for the government in the Autumn Budget. In this section, we use the Barclays economic forecasts presented in Chapter 1 to discuss the challenges facing the Chancellor and the kind of fiscal response that might be required for Ms Reeves to continue to meet her fiscal rules.
Impact of recent policy reversals
Amid substantial uncertainty around the economic outlook, the consequences of some recent policy decisions are more predictable. Since March, the government has announced a partial reversal of its recent cut to pensioners’ winter fuel payments and substantially watered down its plans to reduce eligibility to personal independence payments. Both of these changes will push up forecast spending on social security benefits relative to previous plans.
In particular, in July 2024 the Chancellor announced plans to restrict winter fuel payments to pensioners who received pension credit and certain other means-tested benefits from Winter 2024–25 onwards. This led to spending on winter fuel payment falling from £2.0 billion in 2023–24 to just £0.3 billion in 2024–25. The government has since announced that from Winter 2025–26, all individuals over state pension age will once again be eligible to receive a winter fuel payment, with the amounts received being clawed back from those with an annual taxable income above £35,000. HM Treasury estimates that this change relative to previous plans will cost around £1.25 billion per year and that the saving relative to a universal payment that is not clawed back will be just £450 million per year.9
At the Spring Statement in March, the Chancellor set out plans to tighten the eligibility criteria for receiving personal independence payment and reduce the projected increase in spending by £4.7 billion a year by 2029–30. The OBR scored these savings as part of the government’s effort to rebuild (slim) headroom against the fiscal rules in its March forecast, but the government has since withdrawn the measures that deliver the reductions in spending after facing opposition in parliament. The revised package will not deliver a net saving in 2029–30 (although savings are still expected in the longer term, beyond the forecast horizon).
These two major policy reversals mean that absent any additional reforms or forecast changes in the Autumn Budget, the government will be expected to spend £6 billion more on social security benefits in 2029–30 than the OBR forecast in March.
Impact of changes to the economic outlook
More important but more uncertain is the broader economic outlook for the UK – or, more specifically from the Chancellor’s perspective, the OBR’s judgement on the economic outlook. This will be the most important determinant of the current budget trajectory. In this subsection, we use the Barclays central economic forecast – discussed in detail in Chapter 1 – to illustrate the impacts that one recent independent forecast could have on the public finances. Of course, there will always be a range of views on the outlook for determinants of the fiscal outlook, including output, inflation, interest rates and employment. Nevertheless, this exercise provides a useful illustration of the challenges facing the Chancellor, and helps give a sense of the magnitudes of plausible effects were the OBR to take a similar view to Barclays. We discuss one key source of uncertainty – the productivity forecast – in Section 3.5.
Figure 3.10 provides a useful starting point by showing how the OBR’s forecast for the current budget surplus might change when taking into account both recent policy changes and the fiscal consequences of the Barclays central economic forecast, before any changes the Chancellor might choose to implement in the autumn. This central forecast implies an additional £21 billion of borrowing by 2029–30 relative to the OBR’s March forecast, a quarter of which comes from the U-turns on working-age disability benefits and pensioners’ winter fuel payments. It does not reflect any extra spending on social security (e.g. from a scrapping of the two-child limit), a further freeze in fuel duties, or any other policy changes; these issues are discussed in Section 3.6.
Figure 3.10. Current budget surplus as a percentage of national income, March 2025 OBR forecast and scenarios

Note: Negative values represent current budget deficits.
Source: Office for Budget Responsibility, Economic and Fiscal Outlook, March 2025. Barclays economic forecast, using authors’ calculations based on OBR Ready Reckoner, September 2025.
Why is borrowing higher under the Barclays economic scenario?
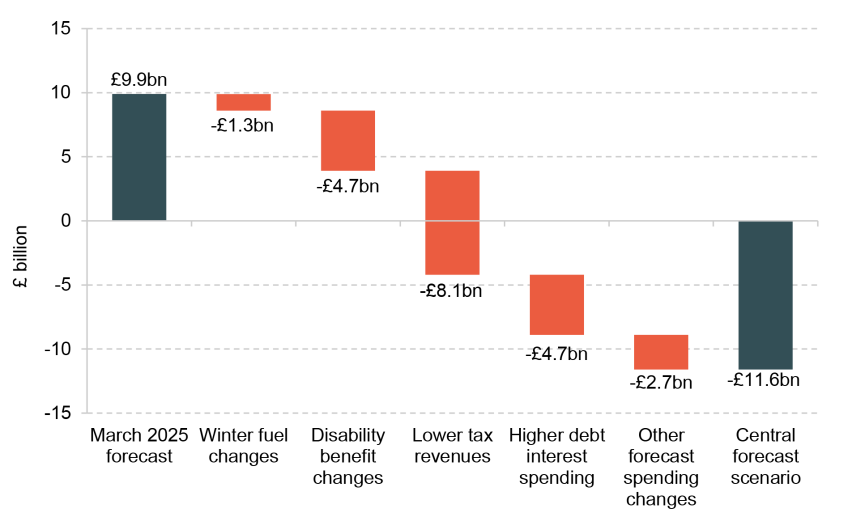
In this scenario, the government would be running a current deficit of £12 billion in 2029–30, compared with a £10 billion surplus under the OBR’s March forecast. Figure 3.11 breaks this down into different determinants. As the figure shows, the single biggest contributor to the additional borrowing implied by the Barclays forecast comes from reduced tax revenues, a result of lower growth. Barclays forecasts that the economy will be 1% smaller in real terms by 2029–30 than the OBR forecast back in March. This is still more optimistic than the Bank of England’s most recent forecast, and that of most independent forecasters surveyed by the Treasury.10 Notably, Barclays only expects growth to fall substantively behind the OBR’s forecast from 2028–29 onwards, which causes the current budget to deteriorate in the last two years of Figure 3.10. By 2029–30, tax revenues are expected to be lower by £8.1 billion, mostly as a result of this lower growth.
Figure 3.11. Changes to forecast current budget surplus in 2029–30 between OBR March 2025 forecast and Barclays central scenario
Note: ‘Other forecast spending changes’ includes all spending besides debt interest spending and the assessed cost of policy reversals on social security spending.
Source: Office for Budget Responsibility, Economic and Fiscal Outlook, March 2025. Barclays economic forecast, using authors’ calculations based on OBR Ready Reckoner, September 2025.
The Barclays central forecast also involves significantly higher interest rates on long-term government debt than expected by the OBR in March. As Figure 3.12 shows, long-term gilt yields have increased dramatically over the last several years, and the market now expects that they will continue to increase. By the start of 2027, 20-year gilt yields are now expected to be 0.3 percentage points above the expectations in March 2025, and 3.8 percentage points higher than in March 2022, the time of the last OBR forecast before the sharp increase in gilt yields which followed the energy price shock.
Since the OBR’s forecast is also conditioned on market expectations, the Autumn forecast is very likely to include higher interest rates. Higher interest rates increase the cost to the Treasury of issuing new debt. Therefore, the impact on debt interest spending accumulates gradually over the forecast horizon. On the other hand, Barclays expects Bank Rate to settle at a lower level than that forecast by the OBR, partly countervailing the effect of higher long-term rates by reducing the cost of servicing short-term debt and the effect of the cost of remunerating reserves held at the Bank of England. In combination, these changes to debt interest would be expected to increase debt servicing costs by £4.7 billion by 2029–30.
The Barclays central economic forecast also implies an additional £2.7 billion of spending, mostly from the direct effects of higher inflation. Consumer Prices Index (CPI) inflation has been higher than expected over the last six months, and is now projected to return to the Bank of England’s 2% target more slowly than previously anticipated. Many social security benefits are uprated in line with CPI inflation, and so higher inflation will, in cash terms, generate additional costs for the government. We also incorporate higher expected inflation in future years, which raises forecast revenues via higher earnings and spending (again in cash terms). However, we do not assume higher revenues in the current year, as official statistics to date have shown no evidence of an unexpected uptick in revenues, as Box 3.3 describes.
Figure 3.12. 20-year gilt yield, out-turn and expectations, March 2022, March 2025 and September 2025
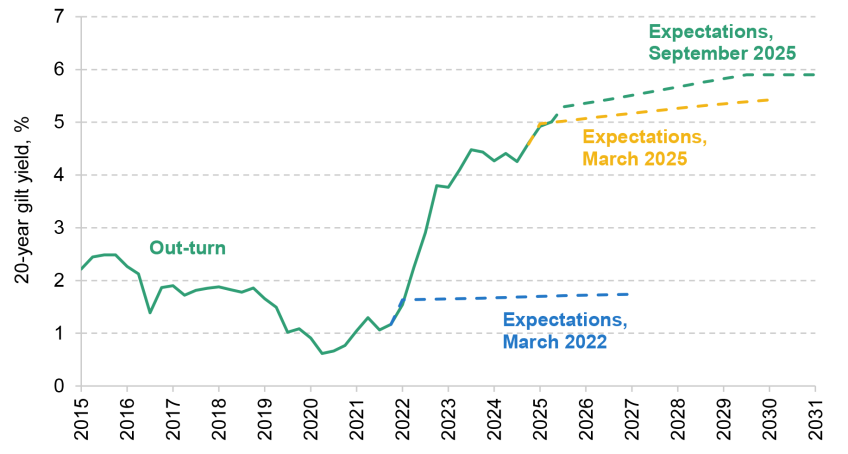
Source: Office for Budget Responsibility, Economic and Fiscal Outlook, March 2022 and March 2025; September 2025 expectations from Barclays.
Box 3.3. Inflation and the public finances
Prices have been rising faster than the OBR expected when it closed its March 2025 forecast. Relative to the end of 2024, consumer price inflation (measured by the CPI) in the first half of 2025 has exceeded the March 2025 forecast by 0.3 percentage points, inflation as measured by growth in the GDP deflator has exceeded it by 0.4 percentage points, and the economy was £42 billion larger in cash terms (only partly reflecting higher output, and including revisions to past out-turns).
Inflation has a range of partially countervailing effects on the public finances. Some parts of social security spending, notably universal credit, are linked to measures of consumer price inflation, meaning that they rise faster when inflation is higher. In addition, higher inflation directly pushes up spending on debt interest via the approximately one-quarter of government debt that is index-linked – meaning that the cost of servicing it depends on the Retail Prices Index (RPI). However, large parts of government spending – including departmental spending – are not automatically adjusted in line with inflation. In the absence of policy action to top up plans, higher inflation will erode their value, meaning they become less generous in real terms.
On the other hand, inflation also pushes up government revenues. This is because taxes are levied on cash quantities – such as spending, earnings and profits – and if the cash size of the economy increases, even without a corresponding increase in real output, the government collects more tax revenue. In this way, inflation can produce a kind of ‘stealthy’ fiscal tightening: tax revenues increase and spending on public services becomes less generous, all without explicit policy action. This is especially true when tax thresholds are frozen in cash terms (as many are at present).
The balance of these factors depends on the composition of inflation. In the wake of the 2022 energy price shock, benefit spending rose substantially (albeit with a delay), because high energy prices pushed up consumer price inflation. However, because much of our energy consumption is imported and taxed at preferential rates, domestic wages and prices – and the tax revenues they generate – did not rise as fast, making this inflation unfavourable for the public finances overall.
According to initial out-turns for the first five months of this financial year, income tax and National Insurance contributions have been close to the OBR’s March forecast. The initial out-turn for the first five months of the financial year suggested that cash VAT revenues were substantially lower than forecast. A correction published on 8 October stated that this was inaccurate. While fully corrected and updated data have not been published at the time of writing, VAT revenues still appear to be slightly below the forecast – despite higher inflation. Regular, scheduled revisions will provide a more complete picture, but based on the information we have so far, there is no evidence that an unexpectedly large economy in cash terms is translating into higher revenues. Our scenario in this section assumes that this continues to be the case for the rest of this financial year, but that higher inflation softens some of the fiscal blow from lower real-terms growth in later forecast years. This is one source of uncertainty around the fiscal impact of the Barclays central economic scenario: if higher inflation this year starts to bring in much more additional revenue, the fiscal picture could look better (although calls for top-ups to public service spending might also get louder). If a larger economy in cash terms turns out to be permanently less tax-rich than expected, however, the medium-term outlook for revenues could suffer more.
As discussed in Chapter 1, there is considerable uncertainty around the Barclays central economic forecast. Two possible alternative scenarios considered by Barclays include one in which productivity growth is higher and closer to that in the OBR’s March 2025 forecast, and another in which higher inflation in the short run leads the Bank of England to keep Bank Rate higher for longer, suppressing growth for several years. The implications of each of these are displayed in Figure 3.13. In the more optimistic of these scenarios, the government would meet its fiscal rules at the Autumn Budget without making policy adjustments, as it does not suffer from lower receipts due to lower-than-expected growth. However, borrowing is still higher than in March due to the cost of the social security announcements since March, with a forecast current budget surplus of just £7 billion in 2029–30. In the more pessimistic of these scenarios, where interest rates remain higher for longer, the government faces significant costs in the short run, with higher borrowing in the 2025–26 and 2026–27 financial years. However, this would likely not make a significant difference to headroom, as catch-up growth in later years would increase receipts.
Figure 3.13. Current budget surplus as a percentage of national income, March 2025 OBR forecast and scenarios

Note: Negative values represent current budget deficits.
Source: Barclays economic forecast, using authors’ calculations based on OBR Ready Reckoner, September 2025.
Continuing to meet the fiscal rules?
The government’s borrowing rule states that it must be on track to run a current budget surplus in 2029–30 according to the OBR’s forecast. Given this, what matters for compliance is not the actual course of the economy over the next four years, but how it is forecast by the OBR.11 As discussed in the next section, there is reason to think that the OBR might downgrade its growth forecast at the Autumn Budget, as press reports have suggested.12 The Barclays central scenario – which is still more optimistic than most independent forecasts – provides a plausible benchmark for such a downgrade.
Under this scenario, the government’s current budget deficit of £11.6 billion means the Chancellor would need to introduce (at least) an equivalent level of spending reductions or tax rises to comply with the borrowing rule. Chapter 4 discusses options for tax rises, and how much revenue they might be expected to raise. Purely to give a rough sense of scale, this could be achieved through cuts to social security spending roughly twice the size of those the government attempted to introduce in March, or through a roughly 1 percentage point increase in all rates of income tax, or through a roughly 1 percentage point increase in the standard and reduced rates of VAT. Note that this is the estimated tightening required to meet the fiscal rule exactly. If the Chancellor wanted to restore her headroom – or increase headroom even further – that would require a larger adjustment.
Figure 3.14. Public sector net financial liabilities (PSNFL) as a percentage of national income, March 2025 OBR forecast and scenarios
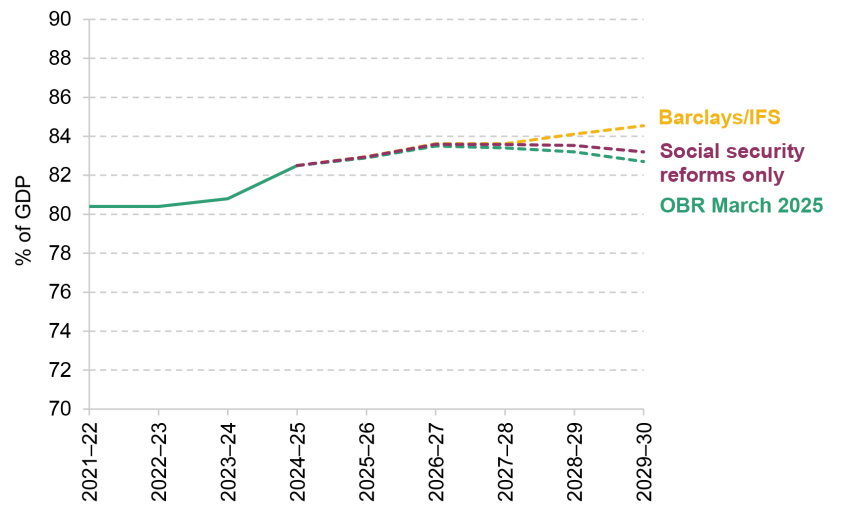
Source: Office for Budget Responsibility, Economic and Fiscal Outlook, March 2025. Barclays economic forecast, using authors’ calculations based on OBR Ready Reckoner, September 2025.
The second fiscal rule – to have public sector net financial liabilities (PSNFL) falling as a share of GDP in 2029–30 – has not been the binding rule at the Chancellor’s first two fiscal events, as the government has met that rule by a greater margin than it did the borrowing rule. However, the difference was – in fiscal terms – relatively small: the government was meeting its debt rule by £15.1 billion, compared with £9.9 billion of headroom against its borrowing rule. Figure 3.14 shows that under the Barclays central scenario, the government would also be failing to meet the debt rule at the Autumn Budget without further policy changes. In this scenario, PSNFL is no longer falling in the final year of the forecast, and instead continues its upward trend into 2029–30.
Having debt rising indefinitely is risky. Perhaps most importantly, if debt is not expected to be brought down in ‘normal’ times, this has implications for the government’s ‘fiscal space’: the room it has to respond to crises via temporarily much higher borrowing. Of course, this is already a concern when debt is forecast barely to fall over five years, rather than a brand-new problem when it is forecast to rise slightly. More specifically, under the Barclays central forecast, the government would be missing the debt rule by £17.5 billion – a larger margin than the £11.6 billion shortfall against the borrowing rule, as shown in Table 3.3. This means that under this scenario it is the debt rule, and not the borrowing rule, that would constrain the Chancellor’s choices the most. But we should also remember that the borrowing rule has a much better theoretical underpinning. While there are good reasons to want to have debt on a decisively downwards path over the medium and longer terms, there is nothing special about having debt falling between 2028–29 and 2029–30. And the debt rule is extremely sensitive to forecast nominal growth in the year to which it applies.
Table 3.3. Headroom against each fiscal rule, OBR March 2025 forecast and Barclays central scenario
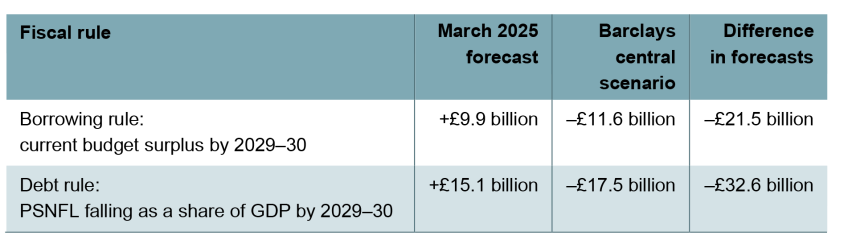
Note: Positive numbers represent level of headroom; negative numbers represent the amount a given rule would be missed by. Difference expressed as the increase in headroom in Barclays central scenario relative to March 2025. Values expressed in 2029–30 prices as expected at different forecasts.
Source: Office for Budget Responsibility, Public Finances Databank, March 2025 and authors’ calculations using Barclays forecasts.
Indeed, the reason the debt rule becomes relatively hard to meet is the result of the difference in growth forecasts between the OBR’s March 2025 forecast and the Barclays central scenario in 2029–30 specifically. Unlike the OBR’s March forecast, which expects growth to rebound by 2027 and then stabilise, Barclays expects growth to fall back again in 2029 and 2030. This means that Barclays expects much lower growth in 2029–30 than the OBR did in March. As a result, debt is forecast to be increasing faster as a share of GDP than it would be if economic growth were higher, and it is forecast to rise faster in 2029–30 than it would if the Barclays growth profile were more evenly spread over the medium term.
If the OBR did downgrade its assumptions about medium-term growth at the Autumn Budget, the debt rule might become the binding rule, depending on the profile of that growth (it is especially likely to bind if the forecast includes a significant downgrade in 2029–30). In the Barclays scenario, the Chancellor would need to find at least £17.5 billion of savings in that year to continue meeting the debt rule. As with the borrowing rule, significant cuts to planned day-to-day spending or substantial tax rises could be implemented to meet the rule. But the Chancellor would also have the option of cutting planned investment spending (and/or adjusting its time profile), which is only captured in the debt rule, not the borrowing rule.13
3.5 The productivity forecast
The scenarios presented in the previous section show the likely effects of worse economic growth on the public finances in the medium term. The actual evolution of public sector borrowing and debt over the coming years matters. But the more immediate fiscal concern for the Chancellor stems from the fact that the government’s fiscal rules are assessed against the OBR’s forecast. This means that the OBR’s expectations for economic growth over the next four years will directly affect the degree of fiscal adjustment needed to meet the rules, particularly through the impact of growth on the expected level of tax receipts when the fiscal rules bind in 2029–30.
Productivity is a key component of the OBR’s forecast for economic growth.14 As such, a downward revision to the OBR’s productivity forecast would increase projected borrowing in that year, requiring larger spending cuts or tax rises for the Chancellor to remain compliant with the fiscal rules.
In recent years, the OBR has more often than not been over-optimistic about future productivity growth. Figure 3.15 shows out-turn productivity since 2008 (black), alongside the OBR’s forecasts for productivity at each fiscal event. In the aftermath of the global financial crisis, the OBR expected that productivity would recover to the growth rates enjoyed in the early 2000s, but it consistently undershot those expectations, instead staying close to stagnant in the first half of the 2010s. In response to this, the OBR revised its productivity forecast downwards in 2017: it still expected some return towards the rate of growth we saw prior to the global financial crisis, but for this return to remain incomplete. Over the next few years, productivity more closely tracked the OBR’s forecasts.
Figure 3.15. Productivity: out-turn and successive OBR forecasts
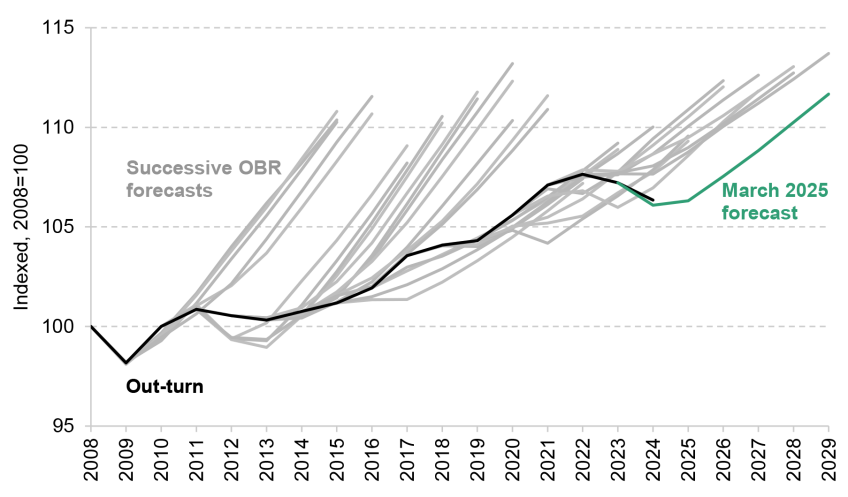
Source: Office for Budget Responsibility, Economic and Fiscal Outlook, March 2025 and Historical Official Forecasts Database, March 2025.
However, the aftermath of the pandemic has seen an unanticipated fall in productivity. The OBR’s most recent forecast in March suggested that productivity growth was likely to rebound quickly to the rates seen just before the pandemic. This might be seen as optimistic given the slow pace at which productivity growth has recovered from other recent shocks.
Even a modest downgrade to productivity would still imply a significantly higher borrowing forecast. The specifics will depend on the OBR’s assumptions about how exactly a lower productivity forecast works its way through the economy: for example, if higher productivity disproportionately dampens wage growth for higher earners who pay more tax, the fiscal impact will be bigger than if the hit is more evenly spread. However, a simple rule of thumb is that a downgrade of a tenth of a percentage point to productivity growth between now and 2029–30 might add some £7 billion to the current budget deficit in that year. A downgrade in line with the Barclays central scenario, which is still more optimistic than the median independent forecaster, might be expected to add £14 billion to forecast borrowing.15
Figure 3.16 shows a range of different forecasts for the size of the economy in real terms, including those from Chapter 1 of this Green Budget from Barclays, from the Bank of England, and from a range of independent forecasters. The OBR’s central forecast for GDP growth lies above the Bank of England’s, the Barclays central scenario, and those of all independent forecasters monitored by HM Treasury (2025b). It is therefore plausible, and widely expected, that the OBR will downgrade its forecasts for productivity and growth, narrowing the gap with other forecasters.
Figure 3.16. OBR and independent forecasters: real GDP forecasts
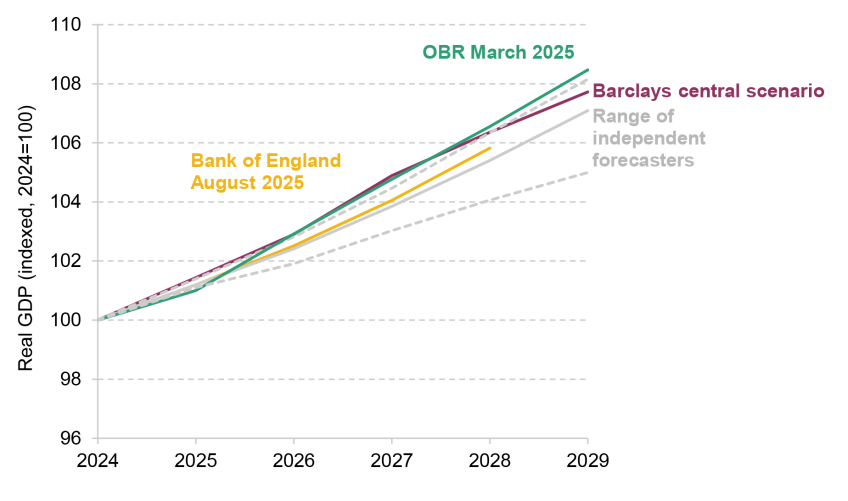
Source: Bank of England; HM Treasury, Survey of Independent Forecasters, August 2025; Office for Budget Responsibility, Economic and Fiscal Outlook, March 2025.
The OBR might judge that there is not yet enough evidence to justify a significant downgrade to its productivity and growth forecasts this autumn. However, making fiscal policy based on an economic forecast that continues to be an outlier might come with its own risks: it is important for the OBR’s forecasts to be seen as credible. Consistent over-optimism might risk that reputation with voters and markets, and eventually affect the cost of government borrowing. Feeble productivity growth is a risk that could continue to push debt up as a share of national income – and that is a risk that a prudent and forward-looking Chancellor should take into account, whether or not the OBR chooses to revise its productivity assumption on this particular occasion.
3.6 Policy risks
The outlook for the public finances is always inherently uncertain, and will not be shaped by the economic trajectory alone. In addition to the shifting economic environment, there are a range of uncertainties around policy that may affect the strain on the public finances over the next several years. Some areas of public spending could need significant top-ups if circumstances do not develop in the government’s favour, while social security spending, in the absence of reform, could rise more – or less – quickly than is forecast, particularly given that the drivers of the increases in claims of health-related benefits among children, working-age households and pensioners are far from understood. On the revenue side, there are reasons to think that tax revenue could either exceed or fall short of levels currently forecast. These factors are unlikely to influence tax or spending decisions at the Budget (unless they are reflected in the OBR central forecast), but could heavily influence the actual course of spending, revenues and borrowing over the next five years.
In this section, we discuss a number of policy risks, or reasons why spending or revenues might deviate from forecasts, focusing on their consequences for borrowing in 2029–30, the target year for the fiscal rules.
Spending risks
Public sector productivity
The government’s spending plans rest on ambitious planned improvements in the productivity of public services: spending plans assume that more medical procedures can be performed, more court cases dealt with and more taxes collected for the same level of funding for the government departments responsible. Historically, the opposite has more often happened: over time, it has become more expensive to provide the same level of public services, not less. It may be that this parliament will be an exception. For one thing, sizeable funding increases for public services since the COVID-19 pandemic have so far not resulted in a corresponding increase in outputs, and there should be scope for catch-up growth. Almost two-thirds of the planned public service productivity gains are set to come from the NHS in England, where plans imply that hospitals will return to 2019 levels of productivity only by 2028–29. This may – perhaps even should – be achievable. High levels of investment spending compared with historical averages may help with this. New technologies, and in particular artificial intelligence, may also boost productivity across a range of tasks in the public sector.
However, there is a counterpoint to this optimistic case, and a risk that the historical pattern instead repeats itself and productivity falls, or does not rise as quickly as spending plans assume. In that case, the government would have two choices: it could maintain its spending plans and allow public services to deteriorate, potentially falling short of ambitious commitments made in the 2024 manifesto; or it could top up spending plans to compensate.
As set out in Chapter 6, if the outputs that the public sector is able to produce with a given level of funding evolve according to their long-run historical trend (a slight fall over time) and the government still wanted to achieve the level of output assumed at the 2025 Spending Review, it could require tens of billions of additional spending in 2029–30.
Of course, it is conceivable that the government will be able to find more efficiencies in the public sector than anticipated, in which case the planned level of output could be achieved with less funding. In that case, the government could allow service providers to use the funding freed up in this way to do more or do it better – or claw back some funding to maintain the same level of output planned in the Spending Review while spending less.
Ambitious targets for productivity improvements are not the only source of pressure on departmental spending plans, though. In the central scenario presented in Section 3.4, economy-wide inflation – as measured by the GDP deflator, the measure of prices used to calculate the real-terms generosity of spending plans for public services – is well above the March 2025 forecast. If inflation does indeed turn out higher than expected, this would increase pressure on the government to top up spending plans to maintain their real-terms generosity, rather than expecting public services to absorb higher costs – and, very likely, demands for higher pay awards – within their existing cash budgets.
Defence spending
The July Spending Review allocated budgets to government departments up to 2028–29. In that year, the government plans to spend 2.6% of national income on defence – 0.3% of national income more than it did in 2024–25. Subsequently, at the NATO Summit in The Hague at the end of June, the government, alongside many of its NATO allies, committed to increase spending to 3.5% of national income by 2035. No commitment was made on the path to get to this figure.
Chapter 7 sets out alternative paths for defence spending, ranging from a scenario where the Spending Review allocation to defence is topped up to move steadily towards the 3.5% target, to one where all increases beyond 2.6% are deferred to the next parliament. Either of these could be consistent with the government meeting its 3.5% commitment in 2035, but this choice over the profile of spending could make a sizeable difference to defence spending in 2029–30 – the gap between those two paths is £7.9 billion in that year.
The central scenario in Section 3.4, like the OBR’s March forecast, takes the government’s ‘pencilled-in’ spending plans for public services after the end of the Spending Review period as given. Spending totals after 2028–29 have not yet been allocated to individual departments. A higher defence budget could, in theory, come at the expense of lower spending by another department – although with modest overall planned increases to day-to-day public service spending in 2029–30, at 1% in real terms, this would likely imply difficult trade-offs. If plans were instead topped up, borrowing might need to be higher.
Notably, the defence budget – and, in particular, top-ups to the defence budget – include a large share of capital spending relative to day-to-day spending: the £7.9 billion top-up to get from the heavily backloaded path to the steadily increasing path would almost certainly include at least 40% capital spending, and the share could be much higher. This means that the impact of any top-up on the government’s headroom against the borrowing rule is likely to be smaller than the impact on the debt target – although at least in the Barclays central scenario we present in Section 3.4, it is actually the latter that is more constraining.
Health- and disability-related benefits
Spending to support children and working-age adults with disabilities and long-term health conditions has risen much more sharply since the COVID-19 pandemic than it did over the 2010s. This largely reflects fast-rising caseloads. We have already discussed the government’s choice not to go ahead with planned cuts which were incorporated into the OBR’s March 2025 forecast, and the impact of these policy reversals on overall spending. We also discussed the impact of higher consumer price inflation on social security spending – this also applies to benefits to support people with disabilities and long-term health conditions.
However, for a given policy environment and inflation forecast, the future path of spending will crucially depend on caseloads and awards. Sharply rising caseloads for child disability support have implications for future spending on support for adults with disabilities and health conditions: Chapter 5 notes that more than four in five teenagers who applied for personal independence payment when they were about to age out of the child disability system were successful, and the vast majority received an award that was the same as or higher than their child disability living allowance. The OBR’s March 2025 forecast assumes that health- and disability-related welfare spending continues to grow at a faster rate than it did pre-pandemic, but not as fast as it did over the last five years.
Of course, there is uncertainty around this forecast, in both directions. If spending on child disability benefits and adult incapacity and disability benefits returned to the growth rate seen on average over the second half of the 2010s, spending in today’s prices could be £3.7 billion lower than in our scenario in 2029–30, the year the fiscal rules bind. Notably, this would still be slightly above the level in the OBR’s March 2025 forecast, which included the government’s now-abandoned reforms. Conversely, if the high growth rate seen over the five years to 2024–25 continues unabated, spending in 2029–30 would exceed our scenario by £17.5 billion in today’s prices.
In principle, a lower growth rate in spending could come about either through a deliberate policy effort, or through changes to the underlying drivers of spending, notably population health and would-be claimants’ choice to apply. It is worth noting, though, that past policy efforts to reduce spending on health- and disability-related benefits have often run into difficulties: this is not just because of political opposition as in the case of this Spring’s proposals. The introduction of personal independence payment (PIP) in 2013 had the aim of delivering a 20% reduction in caseloads and spending (and was scored by the OBR at the time as doing so). Instead, the OBR now judges that the reform ended up increasing spending (Office for Budget Responsibility, 2019).
Other social security spending
There is also well-publicised pressure on the Chancellor to increase the generosity of the working-age benefit system, specifically calls to abolish – or at least reform – the two-child limit in universal credit and the associated household benefit cap. Removing both would be a well-targeted way to reduce child poverty: estimates suggest that over the longer term, this would reduce child poverty by around 550,000 children each year (Henry and Wernham, 2024). But an obvious downside is that it would add around £3 billion a year to spending.
As discussed in Chapter 8, there is a proposal on the table that could deliver savings to the working-age benefits bill. This is the government’s proposal to replace new style jobseeker’s allowance (NS JSA) and new style employment & support allowance (NS ESA) with a single new ‘unemployment insurance’ (UI) benefit. While the proposal would set UI at a much higher weekly rate for those who are actively seeking work, the time-limiting of the benefit – which will reduce the incomes of many of those who would otherwise have received NS ESA – could deliver savings overall. As set out in Chapter 8, after any transitional protections had expired, time-limiting the benefit to 12 months would save around £0.6 billion a year. Restricting it to 6 months would save around £1.4 billion a year.
Revenue risks
Closing the tax gap?
Discussions of revenue risks usually focus on the underlying economic drivers of taxable activity. But not all taxable activity actually is taxed successfully: this difference between tax owed (as estimated by HMRC) and paid is known as the tax gap.
Measures to reduce this gap and ensure more of the tax that ought to be paid is actually paid are a popular addition to the scorecard for any Chancellor; indeed, the official tax gap fell from 7.4% in 2005–06 to 5.3% in 2023–24. The OBR’s forecast assumes that measures announced in the last two years shrink this by a further 0.4 percentage points by 2029–30, the target year of the fiscal rules, raising an additional £6 billion.
There is substantial uncertainty around this. The fall in the tax gap has not been universal across taxes and taxpayers: the tax gap for smaller companies’ corporation tax liabilities grew quickly and was estimated at 40% in 2023–24. As set out in Chapter 4, this means that even returning the gap to its level in 2017–18 would raise more than £10 billion in additional revenue in 2029–30. An optimist may conclude that well-designed measures should be able to collect most or all of this additional revenue. However, the causes of the sharp decline in compliance among smaller companies are not well understood, meaning that designing policies to achieve this goal may be much easier said than done. If these trends continued instead, or even spread to other taxes or groups of taxpayers, the risk for revenues may be that the tax gap actually closes by less than the forecast currently assumes.
Fuel duties
The OBR forecast assumes that rates of fuel duties will increase in line with RPI inflation, and that the ‘temporary’ 5p per litre cut to duties will be allowed to expire in April 2026. This is despite the facts that cash freezes, rather than inflation uprating, have become the normal practice of Chancellors since 2011 and that the ‘temporary’ 5p cut was originally supposed to be in place for only one year and yet has been in place since 2022. As set out in Chapter 4, fuel duty revenue in 2025–26 (forecast to be £24.4 billion) is expected to be £17.4 billion lower than it would have been had the rates been increased in line with RPI inflation since 2011.
This practice suggests that it is more likely that rates of fuel duties remain at their current cash values for the next five years. Freezing duties at their current rates through to 2029–30 would reduce revenues in that year by an estimated £5.5 billion. Indeed, such a freeze would lead to a nominal decline in fuel duty receipts over time, as petrol and diesel vehicles become more fuel-efficient and the shift to electric vehicles continues. If cash freezes are the Chancellor’s intent, then she should announce them now so that taxpayers can plan on that basis. However, they would also necessitate additional fiscal tightening elsewhere to comply with the fiscal rules to make up for reduced fuel duty revenues.
Perhaps more likely is that the Chancellor will announce at either the Autumn Budget or the Spring Forecast that rates will (for now) be frozen for one more year. This would reduce forecast revenues in 2029–30 by £2.7 billion. The remaining £2.8 billion (£5.5 billion less £2.7 billion) in 2029–30 would then feed into later forecast vintages as subsequent ‘one more year’ freezes were announced (assuming that is how policy evolves). In doing so, the costs of annual freezes would not appear in the forecast, removing the need for the same level of fiscal tightening. This would not be a good way to conduct policy, although unfortunately it feels closer to being a fiscal certainty than a fiscal risk.
3.7 Budget judgement
Diagnosis: the backdrop
The Chancellor faces many challenges. Economic growth has been weak since 2008, and forecasts suggest that the economy will continue to expand only modestly over the next few years. By UK standards, taxes are already at a historic high and rising further, while debt interest spending is significantly elevated relative to the period from 2010 to 2021. Spending on disability- and health-related benefits had been rising steadily, before sharply accelerating from Summer 2021; this rise is expected to continue. The Prime Minister has made a commitment to NATO allies to increase defence spending substantially as a share of national income over the next decade. Many domestic public services are visibly struggling, perhaps most obviously the NHS, the largest-spending public service, where the government has ambitious targets to reduce waiting lists from their recent highs.
The Autumn 2024 Budget
In her first Budget, Rachel Reeves introduced a large package of tax rises. But these did not coincide with a strengthening of the current budget position, as planned day-to-day spending on public services was increased by an even larger amount. The decision to top up spending plans was unsurprising, given the ambitions to improve public services laid out in Labour’s manifesto and the tight – bordering on implausible – spending plans that Ms Reeves inherited from her predecessor as Chancellor, Jeremy Hunt. What was more striking was how front-loaded the additional spending was, with spending growth concentrated in 2024–25 and 2025–26 and much slower planned growth from April 2026 onwards.
The Budget also included a major increase in planned public sector investment spending. This boost was sufficient to maintain investment at around its current share of national income – relatively high by the standards of recent decades – rather than allowing it to fall as Mr Hunt’s plans implied. This decision has much to commend it: if the investment is delivered effectively, it should improve the quality and resilience of public services in future years. The case for more investment, however, is separate from the case for funding this additional investment through borrowing, which Ms Reeves chose to do.
The resulting medium-term fiscal loosening in the Autumn 2024 Budget was large. It was on a par with Rishi Sunak’s post-election Budget in March 2020, and in recent history surpassed only by George Osborne’s pre-election Budget of March 2015.
The Spring 2025 Forecast
Ms Reeves’s choice – of higher taxes, higher spending, higher borrowing, and hence higher debt – was left broadly unchanged at the Spring Statement. The measures announced in March were kept to around the minimum required to leave the outlook for borrowing broadly unchanged from the previous Budget. That is to say, the Chancellor continued to meet her two main fiscal rules, but only just. The current budget was forecast to reach a surplus of just £9.9 billion by 2029–30 – a slim margin, almost identical to that she had after her first Budget, leaving her vulnerable to even modest future revisions in the fiscal outlook. While public sector net debt was forecast to continue rising as a share of national income over the next five years, the Chancellor’s preferred measure of debt – public sector net financial liabilities – was forecast to fall slightly by 2029–30.
Headroom against the fiscal rules is tiny, and the debt rule at least is relatively loose. But the ultimate economic constraint is not the fiscal rules themselves. In broad terms, debt is merely forecast to be stable as a share of national income in five years’ time – not falling. History tells us that adverse shocks tend to push debt up which means that, if debt is not to rise indefinitely, Chancellors must aim to reduce debt in normal times. Moreover, while the cost of debt was low during the 2010s, that is no longer the case. The March forecast projected debt interest spending in 2025–26 of £111 billion. Among the broad functions of government spending, this figure is only surpassed by what the government spends each year on the NHS and on the state pension. And the £111 billion figure is £64 billion higher than the £47 billion forecast for debt interest spending in 2025–26 made in the March 2022 Budget just three years ago. Amid a host of factors behind the government’s ongoing fiscal challenges, this – that we are spending more than double what we expected to spend on debt interest, some 2% of national income more – stands out as one of the central issues.
Changes since March
Since March, the fiscal outlook has worsened. Some of this reflects policy reversals by the government. Many more pensioners will once again be able to benefit from the winter fuel payment from this winter. Planned disability benefit reforms have been watered down, and as a result will deliver almost none of the savings that had been previously expected in 2029–30. Overall, these two changes will add around £6 billion to spending in that year. Market expectations of long-term interest rates, which remain volatile, have risen since March; given elevated debt, this alone could increase (the forecast for) debt interest spending in 2029–30 by around £5 billion. Most critically, having often been more optimistic than most about the UK’s growth prospects – and, unfortunately, often too optimistic with hindsight – the OBR is widely expected to downgrade its productivity growth forecasts. Each 0.1 percentage point reduction per year would add roughly £7 billion to borrowing in 2029–30.
If the OBR were to adopt something like the Barclays central forecast for the economy, then alongside all other changes since March, borrowing might be on course to be around £95 billion in 2029–30 – £22 billion higher than at the last OBR forecast. Such a downgrade would not be particularly large in the grand scheme of things: official forecasts have seen a downward revision to the outlook for the public finances that is larger than this on eight occasions since the OBR first reported in June 2010. It would leave growth over the next three years similar to that forecast by the Bank of England, and still above the average of independent forecasts surveyed by the Treasury. A downgrade of this magnitude would, however, without offsetting fiscal action, leave the current budget in deficit over the next five years, with a forecast shortfall of £12 billion in 2029–30, down from a surplus of £10 billion last March. The Chancellor’s borrowing rule would therefore be breached and, because public sector net financial liabilities would be forecast to rise as a share of national income in 2029–30, her debt rule would be breached too.
Prescription: so what is a Chancellor to do?
Faced with this situation, the Chancellor has three uncomfortable options: borrow more, cut planned spending, or raise taxes further. The case for borrowing significantly more on a permanent basis is weak. Doing so would leave Ms Reeves’s ‘non-negotiable’ and ‘iron-clad’ fiscal rules in disarray. There is nothing sacrosanct about these or indeed any set of fiscal rules. But borrowing significantly more – and further loosening or abandoning the fiscal targets – would leave debt on an ever-increasing path, which comes with real economic risks. While these risks might not crystallise for a long time, with gilt markets in a febrile state the government’s borrowing costs – already a major source of fiscal pressure, and high relative to other major economies – could easily be pushed up further in the near term.
If a widely expected forecast downgrade does materialise next month, the Chancellor will therefore need to find savings.
Spend less?
Reducing planned spending is an option – though a difficult one.
The Chancellor could look again at planned spending on social security benefits. However – as set out above – her previous attempts to cut spending on pensioner benefits and working-age benefits are now expected to deliver far smaller savings over this parliament than she initially envisaged. Some other widely discussed proposals for reform – such as abolishing the two-child limit and the household benefit cap – would, if implemented, increase social security spending, whereas others, such as the government’s proposal for a new time-limited unemployment insurance benefit, would likely deliver a net saving. The Chancellor could choose to abolish the two-child limit and the household benefit cap and offset some of the increase in forecast working-age benefit spending by also introducing the new unemployment insurance with a time limit of 6 months. This would redistribute away from those with long-term health conditions who would have been eligible for the previous benefit for longer than 6 months and are not eligible for universal credit (see Chapter 8), and towards families with more than two children who do receive universal credit. However, this would be a re-prioritisation of existing spending, rather than a means to reduce overall social security spending in pursuit of fiscal consolidation.
Ms Reeves could also reopen the plans for spending on public services over the next few years, with a view to trimming certain departmental budgets. But these plans were only agreed in June and were set as multi-year settlements in order to aid departments’ ability to plan ahead. Revising them so soon seems unlikely and would sit oddly with the Chancellor’s emphasis on stability. In addition, there are reasons to think calls for top-ups to the Spending Review settlements are likely (although perhaps not until the next Spending Review, which is scheduled for 2027) – from the risk of productivity improvements falling short of ambitious targets (see Chapter 6), to pressures to go further and faster on defence spending increases (see Chapter 7), to calls to maintain the real-terms generosity of existing plans in the face of higher inflation.
The year in which the fiscal rules bind, 2029–30, does not fall within the current Spending Review period, and thus the Chancellor could theoretically pencil in spending cuts for that year without specifying how they would fall on individual departments. However, this kind of move would lack credibility. With no fundamental reason why real growth in day-to-day spending should fall sharply between the third and fourth years in the forecast, there would be little reason to think any spending cuts announced for only 2029–30 would be stuck to and not undone at the next Spending Review. The previous government scheduled in similarly implausible spending plans for the current parliament, which were described as ‘worse than fiction’ by the Office for Budget Responsibility’s chair, Richard Hughes, and topped up very substantially at the Autumn 2024 Budget. The Chancellor would be unwise to mimic this fiscal illusion.
Raise taxes?
Further tax rises are a likely option – despite manifesto commitments.
Given the inadvisability of permanently higher borrowing and the challenges in cutting spending substantially, further tax rises are likely even if the downgrade is relatively modest in size. While taxes are already high by UK historical standards – and already forecast to rise more – most Western European and Scandinavian countries have successful economies with much higher tax revenues as a share of national income. But the more taxes are raised, the more they will distort behaviour, reducing growth and therefore standards of living. But as set out in Chapter 4, there are opportunities here. The UK tax system is badly designed, so that the current range of taxes do more damage to the economy than they need to. The risk is that unreformed taxes are increased and, as a result, are even more harmful. The opportunity is that by first reforming taxes and then, if deemed necessary, increasing them, greater revenue could be raised with commensurately less damage to living standards. The Chancellor should confront the challenge of tax reform, ensuring that any future increases are preceded by efforts to improve the design and efficiency of the tax system.
Room for thinking ahead?
If Ms Reeves opts for spending cuts or tax rises, this raises the question of how large a fiscal tightening she should opt for, and whether this should be accompanied by changes to the fiscal framework. We consider each in turn.
The Chancellor could choose to implement just enough of a fiscal tightening to allow her to continue meeting her fiscal rules without any headroom. On our central forecast, based on the Barclays view of the likely performance of the economy over the next few years, this would require a fiscal tightening of at least £17 billion in 2029–30. The rule that most constrains policy in this scenario – where growth is expected to be weak towards the end of the forecast period in particular – is the debt rule, rather than the borrowing rule. In other words, the Chancellor would be required to aim for a current budget surplus – albeit a tiny one of £6 billion – in order to keep her preferred measure of debt from rising by 2029–30, without cutting investment spending plans. Another option would be to implement a fiscal tightening of £22 billion – i.e. sufficient to offset the underlying increase in borrowing, and thereby restore headroom against the borrowing rule to the slim £10 billion of headroom that was left in place in March.
Persisting with a low level of headroom or no headroom at all has the obvious advantage of facilitating lower taxes or higher spending than what greater headroom would require. But it leaves the Chancellor exposed to the risk that any future downward revisions to the outlook for the public finances – revisions which are not uncommon – necessitate policy adjustments if the fiscal targets are not to be breached. Overly frequent adjustments to tax and spending are not conducive to good policymaking and can have adverse consequences for households and firms affected by those changes. Moreover, widespread speculation about which taxes might rise – and the resulting efforts by taxpayers to change their plans in anticipation – can also be costly.
The Chancellor’s ambition to create a more stable policy environment by holding only one fiscal event each year is therefore welcome. It is an ambition that was shared, but not turned into a reality, by both George Osborne and Philip Hammond.16 The more general commitment to policy stability is also welcome. But it is important to note that it is not the existence of fiscal rules, or the role of the OBR in evaluating them, that has undermined it. Instead, volatility in policy has stemmed from her decision to commit to meeting high-profile pass-or-fail fiscal targets that are assessed twice a year, and her decision to set policy to meet them with narrow margins. The former has been true of many of her predecessors in recent times, but having such little headroom has been a phenomenon in UK fiscal policy only since Jeremy Hunt’s November 2022 Budget.
From this starting point, if the aim is to foster greater policy stability, there are several options available to the Chancellor, each of which would make it easier to make changes to tax and spending at only one fiscal event a year, without breaching her fiscal rules.
The first route, and by far the most straightforward one, would be to implement a fiscal tightening that exceeds the deterioration in the underlying outlook in the autumn. This would subsequently allow greater headroom to act in its intended role as a buffer. For example, a tightening £20 billion bigger than the underlying increase in borrowing in 2029–30 would increase the forecast current budget surplus from £10 billion to £30 billion, or 1% of national income, a level of headroom that Chancellors commonly left themselves prior to 2022. This would significantly reduce the chances of further policy action being required in the March 2026 Spring Forecast to continue to comply with the Chancellor’s borrowing rule. Of course, this would not be costless: it would take higher taxes or lower spending to build this additional headroom. Communicating the reason for those tax rises or spending cuts could be a challenge.
Other options are also available to the Chancellor. She could ask the OBR to produce only one economic and fiscal forecast a year. This would automatically remove the possibility of missing her fiscal rules in the spring, as now there would be no forecast against which to evaluate them. Such a move would also have the advantage of being (relatively) easy to explain. However, this would be a very blunt instrument: removing the Spring Forecast would reduce transparency and make the UK an outlier among other advanced economies and international bodies. The UK has had a legal requirement to publish two forecasts a year for half a century – since the passing of then Secretary of State for Industry Tony Benn’s Industry Act 1975. It is only choices government has made in recent years that have exacerbated such problems so much. In the absence of a new OBR forecast, speculation about the size of a potentially required fiscal tightening may well become more frenzied, less anchored in sound methodologies – especially as the most recent official forecast could become considerably out of date – and go on for longer. Even with only one forecast per year, with minimal headroom the government could find itself in an extremely similar situation next year – the ‘fiscal Groundhog Day’ scenario.
Another option, if retaining the second forecast, would be to bring forward planned changes to the operation of the fiscal targets, where the stated intention (if not our reading of the letter of the actual legislation) is for the borrowing rule to be assessed against a range at the Spring Fiscal Forecast. Fiscal action would only be required at that point if the current budget were forecast to be in deficit by more than 0.5% of national income. More modest forecast deficits could be left until the autumn, when measures could be implemented if still needed to return to a current budget surplus (see Emmerson, Miller and Zaranko (2025) for a discussion). However, these measures would need to be brought forward to 2025–26, and to be applied to the debt rule as well as the borrowing rule (given that the former may soon become the binding constraint on policy), if they are to reduce excessive policy volatility. Ms Reeves could potentially combine this with pre-announcing contingent measures – for example, stating that any shortfall that persists in the autumn will be compensated by a rate rise in one particular tax – to reduce uncertainty, and potentially ill-advised financial decision-making by those trying to anticipate a future tax change. However, these benefits would only accrue if these contingent measures can be communicated carefully and credibly to markets and taxpayers – not an easy task – and they would add to the complexity of the fiscal framework.
In sum, the Chancellor’s stated aim of providing greater policy stability is a sensible one. Scrapping the Spring Forecast would be one (rather blunt) means of avoiding over-correction in the spring. Doing so would reduce transparency and would not avoid the risk of having to go through the same charade next autumn – but would at least have the advantage of being simple and easy to communicate. Bringing forward adjustments to the fiscal framework (perhaps alongside rewritten legislation to clarify its operation) would be neater, but admittedly more complex. Implementing a larger fiscal consolidation than strictly necessary, in order to build in a larger amount of headroom, would likely be well received by bond markets (see Chapter 2), would help to secure policy stability beyond just the spring and would have much to commend it – but would have the unavoidable downside of requiring larger tax rises or spending cuts than otherwise. It is for the Chancellor to judge how to weigh these competing considerations.
References
Cunliffe, J., 2025. Independent Water Commission: final report. https://assets.publishing.service.gov.uk/media/687dfcc4312ee8a5f0806be6/Independent_Water_Commission_-_Final_Report_-_21_July.pdf.
Emmerson, C., Johnson, P., Stockton, I. and Zaranko, B., 2024. Fiscal rules and investment in the upcoming Budget. IFS Comment, https://ifs.org.uk/articles/fiscal-rules-and-investment-upcoming-budget.
Emmerson, C., Johnson, P. and Zaranko, B., 2023. This will be the biggest tax-raising parliament on record. IFS Comment, https://ifs.org.uk/articles/will-be-biggest-tax-raising-parliament-record.
Emmerson, C., Mikloš, M. and Stockton, I., 2023. Outlook for the public finances. IFS Green Budget, https://ifs.org.uk/publications/outlook-public-finances-0.
Emmerson, C., Miller, H. and Zaranko, B., 2025. How frequently should the OBR produce forecasts? IFS Comment, https://ifs.org.uk/articles/how-frequently-should-obr-produce-forecasts.
Emmerson, C. and Stockton, I., 2021. Rewriting the fiscal rules. IFS Green Budget, https://ifs.org.uk/books/rewriting-fiscal-rules.
Henry, A. and Wernham, T., 2024. Child poverty: trends and policy options. IFS Green Budget, https://ifs.org.uk/publications/child-poverty-trends-and-policy-options.
HM Treasury, 2025a. Charter for Budget Responsibility: Autumn 2024. (Updated with final version of document as it has been laid in parliament, approved in the House of Commons and enshrined in law– see https://www.gov.uk/government/news/charter-for-budget-responsibility-approved-by-parliament.) https://www.gov.uk/government/publications/draft-charter-for-budget-responsibility-autumn-2024.
HM Treasury, 2025b. Forecasts for the UK economy: August 2025. https://www.gov.uk/government/statistics/forecasts-for-the-uk-economy-august-2025.
Office for Budget Responsibility, 2019. Welfare trends report – January 2019. https://obr.uk/wtr/welfare-trends-report-january-2019/.
Office for Budget Responsibility, 2021. Fiscal risks report – July 2021. https://obr.uk/frs/fiscal-risks-report-july-2021/.
Office for Budget Responsibility, 2024. Economic and fiscal outlook – October 2024. https://obr.uk/efo/economic-and-fiscal-outlook-october-2024/.
Office for Budget Responsibility, 2025. Fiscal risks and sustainability – July 2025. https://obr.uk/frs/fiscal-risks-and-sustainability-july-2025/.
Zaranko, B., 2023. Public sector net worth as a fiscal target. IFS Green Budget, https://ifs.org.uk/publications/public-sector-net-worth-fiscal-target.
Endnotes
Authors


Nick Ridpath
Nick joined the IFS in 2023 and works in the Education and Skills sector, focusing on the long-run impacts of education policy.

Isabel Stockton
Isabel works in the Healthcare sector, and on the public finances. Their research focuses on retaining and developing the NHS workforce.
More from IFS
Understand this issue


Policy analysis


Academic research


