
Downloads
Download report PDF
PDF | 682 KB
Key findings
The poverty rate is a useful summary measure of how low-income families are faring, comparing their total household income with a specified poverty line. For example, a couple with no children would need to have household income below £17,100 to be classed as living in relative poverty in 2022–23. For a couple with two young children, the relative poverty line would be £23,900 as they are judged to require a higher household income to maintain a similar standard of living.
Relative child poverty stands at 30% (4.3 million children). Under Labour governments from 1997–98 to 2010–11, during which there was a policy focus on reducing child poverty, the relative poverty rate for children decreased from 33% (4.2 million children) to 27% (3.6 million children). Half of that decline was reversed from 2010–11 to 2022–23. The child poverty rate is highest among families with three or more children, and almost all of the rise in child poverty over the 2010s was concentrated in this group. Children of lone parents, those in rented accommodation, and those in workless households are all also more likely to be in poverty, though the child poverty rate in working families increased from 18% in 2010–11 to 23% in 2022–23.
Overall, the benefits system provides less support for low-income households with children now than it did in 2010. Though rates of support for families with children are still much higher in real terms than in 1997, the below-inflation uprating of many benefits from 2011 to 2019 made the system less generous. Various other policies, such as the two-child limit, removal of the family premium, the household benefit cap, and cuts to housing support, have also substantially reduced the incomes of affected families. As a result of the first three of these reforms, a typical social renting out-of-work lone parent with three young children has seen their disposable annual income cut by £4,000, or a fifth, relative to what it would have been had these reforms not been implemented.
The government has a number of levers it can pull through the benefits system if it wants to reduce child poverty. Among the policies we consider, the single most cost-effective policy for reducing the number of children living below the poverty line is removing the two-child limit. This would cost £2.5 billion a year but would reduce child poverty by 540,000 (4 percentage points) in the long run, equating to an annual cost of around £4,500 per child lifted out of poverty. This compares to removing the household benefit cap, which would reduce child poverty by 10,000 at an annual cost of around £47,000 per child, or increasing LHA rates to the 50th percentile of local rents, which would reduce child poverty by 40,000 at an annual cost of £11,000 per child.
The poverty rate, while a useful summary measure of how those on low incomes are faring, is based on an arbitrarily drawn poverty line, and does not tell us everything about the impact of reforms on the living standards of children in low-income families. For example, whilst removing the two-child limit would lift large numbers out of poverty, many of the children deepest in poverty would benefit less if the household benefit cap remained in place, and households already capped would not gain at all. Removing the household benefit cap alone would lift very few (10,000 children) above the poverty line but would significantly alleviate the depth of poverty faced by some of the poorest children and provide a bigger proportional boost to their incomes. When designing its child poverty strategy, the government should therefore consider effects of policies across the distribution of incomes, not just around the poverty line.
- Labour market policies present another lever the government may pull to reduce child poverty, though they will necessarily be less well targeted. The government has highly ambitious plans to increase the employment rate to 80%, which could reduce child poverty by 200,000 to 350,000 if achieved – though hitting that goal will be much easier said than done. Or it could increase the minimum wage. But neither increases in the minimum wage nor widespread increases in employment are likely to be well targeted at low-income households or to give large income gains to those who do benefit.
See our child poverty policy options calculator here.
6.1 Introduction
Of the 14.4 million children in the UK, 4.3 million, or 30% of them, are living in relative poverty. This is 3 percentage points (730,000 children) more than in 2010. Tackling child poverty is high up the policy agenda for the new government. The government has set ‘breaking down barriers to opportunity’ for children as one of its five missions, and launched a ministerial taskforce tasked with developing an ‘ambitious’ cross-government strategy to reduce child poverty, to be published in Spring 2025. These words evoke the ambitions of the last Labour government, which oversaw – through big increases in the generosity of financial support for low-income families with children and in the context of favourable economic conditions – a 6 percentage point fall in child poverty. But so far, no specific policies directly targeting income poverty among families with children have been announced.
In this chapter, we begin in Section 6.2 by reviewing trends in child poverty in recent decades and how support through the benefits system has changed over time. We then consider a range of policy options the government has if it wishes to alleviate child poverty. In Section 6.3, we consider potential reforms to the benefits system, and we turn in Section 6.4 to the role that changes in the labour market could play in reducing child poverty. A careful approach to supporting children in low-income households needs to consider how policies affect not only whether children are above or below an arbitrarily drawn poverty line, but also their effects across the income distribution. Section 6.5 concludes.
6.2 How many children are in poverty? How has this changed over time?
In this section, we look at trends in child poverty rates from 1997–98 to 2022–23. We begin by looking at overall trends in child poverty rates. Relative poverty is defined as the proportion of children living in households with incomes below 60% of the median household income in the same year and reflects the extent to which the incomes of poorer households with children are keeping pace with the average. A couple with no children would need to have household income less than £17,100 to be classed as living in relative poverty in 2022–23, whereas for a couple with two young children the amount would be £23,900 as they are judged to require a higher household income to maintain a similar standard of living. Absolute poverty is defined as the proportion of children in households with incomes below a poverty line that is fixed in real terms (i.e. adjusting for inflation) over time – in this case, we use the official definition of 60% of the median in 2010–11 (and so the poverty lines, and the numbers below them, are identical in that year). For a couple with no children to be in absolute poverty in 2022–23, they would need to have a household income less than £15,600, whereas for a couple with two young children the amount would be £21,800.
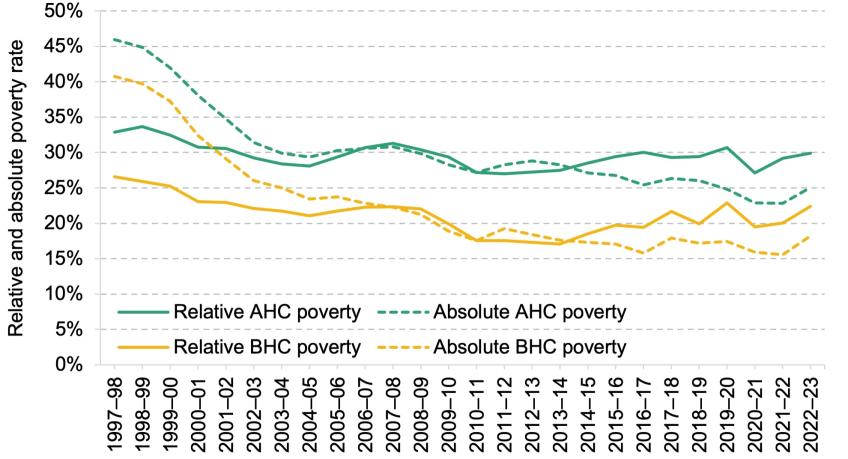
Figure 6.1 shows relative and absolute poverty rates before and after housing costs are deducted (BHC and AHC respectively). Throughout this chapter, we will focus on the measures based on income after deducting housing costs, because this measure is more effective at identifying households with the lowest living standards.1 Whilst there are also non-income-based measures of children’s well-being, such as material deprivation, we focus here on measuring poverty through household income. Over the period 1997–98 to 2022–23, the relative child poverty rate followed a U-shaped pattern, falling from 33% in 1997–98 to 27% in 2010–11, where it stayed until 2014–15. The rate has since risen to 30% in 2022–23. Absolute poverty tends to fall over time as incomes grow, though with weak income growth in recent years, the absolute child poverty rate in 2022–23 was at the same level as in 2016–17.
Figure 6.1. Relative (solid lines) and absolute (dashed lines) child poverty rates before and after housing costs have been deducted over time
Note: Incomes have been measured net of taxes and benefits. All incomes have been equivalised using
the modified OECD equivalence scale. Relative poverty is defined as having income less than 60% of contemporaneous median income. Absolute poverty is defined as having income less than 60% of median income in 2010–11. The 1997–98 to 2003–04 period excludes Northern Ireland.
Source: Authors’ calculations using the Family Resources Survey, 1997–98 to 2022–23.
These trends in poverty rates are driven by a combination of economic conditions and policy changes. Between 1997–98 and 2003–04, the UK saw a period of economic growth, with large rises in employment incomes for low-income families with children (Cribb et al., 2022). In addition, benefit incomes increased for low-income families over this period, largely due to a huge expansion of tax credits as part of a concerted effort to reduce child poverty. Overall, this led to income growth for low-income families with children exceeding median income growth, which consequently brought the relative child poverty rate down. Absolute child poverty fell faster during these six years than during any other period shown. However, from 2003–04 until the financial crisis, reductions in relative child poverty were partially reversed as income growth for poorer households stalled relative to the median.
The period during and immediately following the financial crisis was characterised by much weaker, but overall slightly positive, income growth for low-income families, compared with the decade prior. Income growth at the middle, however, fared even worse over this period. As a result, relative child poverty rates fell during the period 2007–08 to 2013–14, despite the weak income growth for children in low-income families.
From 2013–14 to 2019–20, earnings growth picked up again and income from employment grew, reflecting a sustained increase in employment rates over this period. However, this was largely offset by a fall in income from benefits, both from a cut in the generosity of benefits themselves and from a fall in entitlements to benefits due to rising incomes from employment (Cribb et al., 2022). As the incomes of low-income families are more sensitive to changes in benefit income than the average household, relative poverty rates increased over this period.
By 2022–23, absolute poverty rates were roughly the same as in 2019–20, whilst relative poverty rates were slightly lower, by around 1 percentage point for relative AHC poverty. The fall in relative poverty rates was driven by negative real income growth at the median and stagnant income growth at the bottom of the income distribution as employment earnings and benefit income fell over this period, but incomes at the bottom of the income distribution were propped up by cost-of-living payments (Ray-Chaudhuri, Waters and Wernham, 2024).
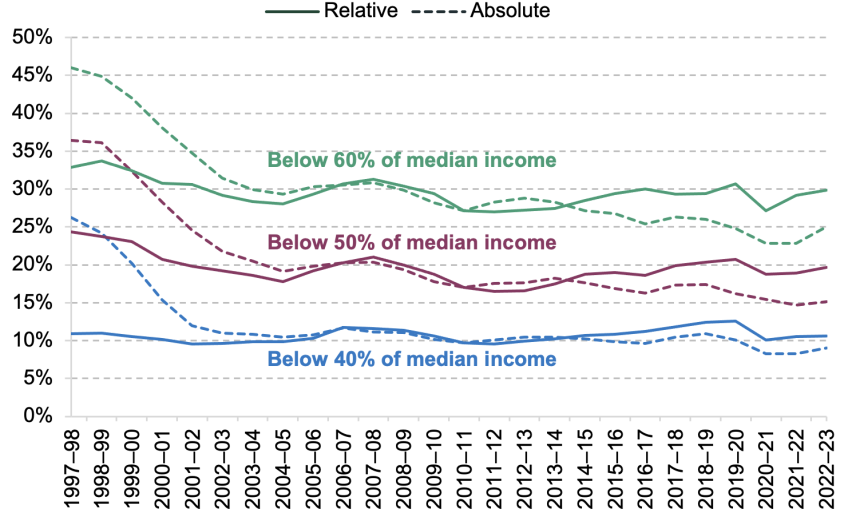
Up until now, we have looked at relative and absolute poverty defined as having income less than 60% of contemporaneous median income (relative poverty) or of 2010–11 median income (absolute). However, of course, people in poverty face varying depths of poverty – not all those who are under these poverty lines will face the same living standards. For example, children with household incomes far below the poverty line will face worse living standards than those who have incomes just below the threshold. In order to understand better how children in poverty are faring, there are various other measures of well-being we can look at. One option would be to calculate the total pound amount required to bring all households to the poverty line. Another would be to look at the proportion of children under different, lower, income thresholds.2 Here we have taken the latter approach. We have defined two alternative absolute and relative poverty lines. The first, deep relative poverty, is defined as 50% and 40% of contemporaneous median income which in 2022–23 are equivalent to annual household income of £14,200 and £11,400 respectively for a childless couple or £19,800 and £15,900 for a couple with two young children. The second, deep absolute poverty, is defined as 50% and 40% of 2010–11 median income; in 2022–23, these are equivalent to annual household income of £13,000 and £10,400 respectively for a childless couple or £18,100 and £14,500 for a couple with two young children.
Figure 6.2 shows that the proportion of children living with income below 50% of the median has trended in a similar direction to the headline poverty rate, with sharper declines from 1997 to 2010 and sharper rises since. The proportion with incomes below 40% of the median is just over 10%, broadly the same level as in the late 1990s and early 2000s. Difficulties in measuring very low incomes in survey data make it harder to analyse deep poverty, so we should take this finding with a pinch of salt. Measures of deep absolute poverty fell quickly in the period 1997–98 to 2004–05 but have changed less since then.
Figure 6.2. Deep child poverty rates (after housing costs are deducted) over time
Note: Incomes have been measured net of taxes and benefits. All incomes have been equivalised using
the modified OECD equivalence scale and have had housing costs deducted. Relative poverty is based on contemporaneous median incomes. Absolute poverty is based on 2010–11 median incomes. The 1997–98 to 2003–04 period excludes Northern Ireland.
Source: Authors’ calculations using the Family Resources Survey, 1997–98 to 2022–23.
How have poverty rates differed between groups?
We have seen that child absolute poverty rates have fallen since 1997–98, whilst child relative poverty rates have shown a U-shaped pattern, increasing after 2013–14. However, there is significant variation in poverty rates across different subgroups of children. These differences are partly explained by differing characteristics of these subgroups but can also be driven by government policy, particularly around the generosity of benefits. Below we consider family size, whether anyone in the household is in work, the number of adults in the household and housing tenure.
Family size
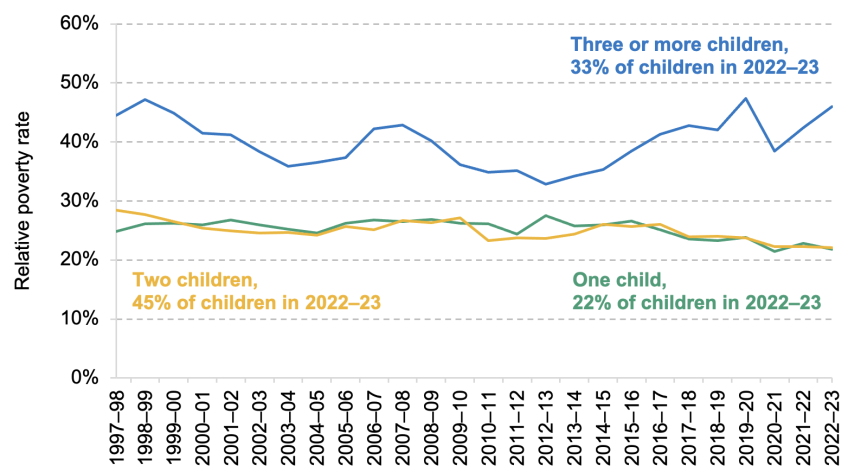
Figure 6.3 plots the relative child poverty rates between 1997–98 and 2022–23 by the number of children in the family. The poverty rate has always been higher for larger families, with three or more children (in which one-third of children live), than for smaller families. This is a result of two compounding reasons. First, households with three or more children on average have lower unequivalised household income, around 15% lower at the median compared with families with one or two children. Second, we adjust for the fact that the larger the number of people in a household, the more total household income is required to meet the same standard of living. This reduces the ‘equivalised’ income of large families further, to 36% less than the median income of families with one or two children.
Figure 6.3. Relative child poverty rates after housing costs are deducted over time, by number of children in family
Note: Incomes have been measured net of taxes and benefits. All incomes have been equivalised using
the modified OECD equivalence scale. Relative poverty is defined as having income less than 60% of contemporaneous median income. The 1997–98 to 2003–04 period excludes Northern Ireland.
Source: Authors’ calculations using the Family Resources Survey, 1997–98 to 2022–23.
Since 2013–14, there has been a particularly large increase in relative child poverty rates amongst large families – indeed this explains the entirety of the overall rise in child poverty. In 2013–14, 34% of children in families with three or more children were in relative poverty – a figure that had risen to 46% in 2022–23. This is in part explained by the two-child limit, which prevents claimants from receiving additional child tax credit or universal credit for (most3) third or subsequent children born after 5 April 2017. As time passes, more and more large families will have children born after this date such that the two-child limit will affect a growing proportion of large families, up until 2035 when the two-child limit will have been fully rolled out since at this point all children will have been born after this date. By the time the two-child limit (and family premium removal) is fully rolled out, we estimate that the two-child limit will have added 10 percentage points to the relative AHC poverty rate of larger families.
Work status of parents
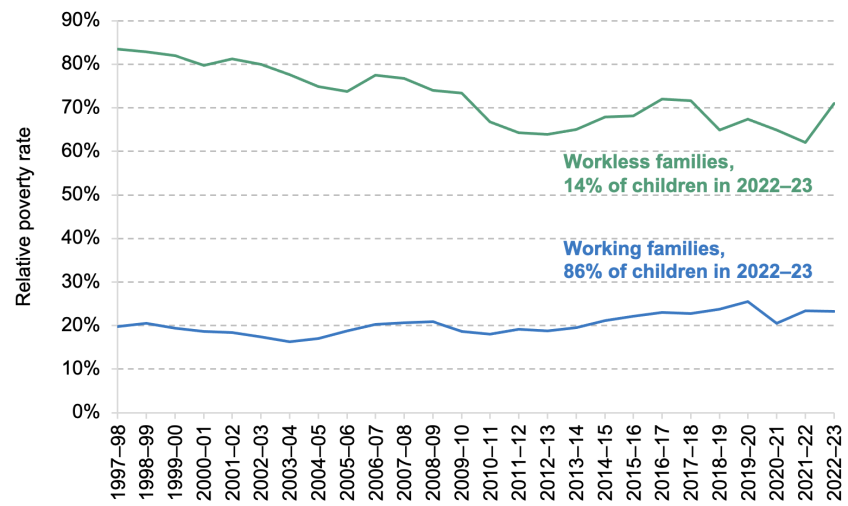
Figure 6.4 shows relative child poverty rates split by working and workless families (those where no parent is in work). Unsurprisingly, children in workless families (which is 14% of children) are much more likely to be in child poverty than children in families where at least one adult is employed, with poverty rates in the former group at more than two-thirds. However, the child poverty rate amongst workless families has been falling faster than the child poverty rate amongst working families.
Figure 6.4. Relative child poverty rates after housing costs are deducted in working and workless families over time
Note: Incomes have been measured net of taxes and benefits. All incomes have been equivalised using the modified OECD equivalence scale. Relative poverty is defined as having income less than 60% of contemporaneous median income. The 1997–98 to 2003–04 period excludes Northern Ireland.
Source: Authors’ calculations using the Family Resources Survey, 1997–98 to 2022–23.
The share of children who are in working families has increased over the past decade. In 2012–13, 81% of children were in working families, but by 2022–23 this figure was 86%. This increase of 5 percentage points is more than double the total increase over the 15 years between 1997–98 and 2012–13. As more and more children are in families where at least one adult is working, we would expect the overall rate of child poverty to fall. However, this composition effect is counterbalanced by increasing poverty rates amongst working families (Cribb et al., 2022). Therefore, the typical child in poverty is now much more likely to be in a working family than in a workless family – in 2022–23, around two-thirds of children in relative poverty lived in working families, compared with just over half in 2012–13.
Number of adults in household
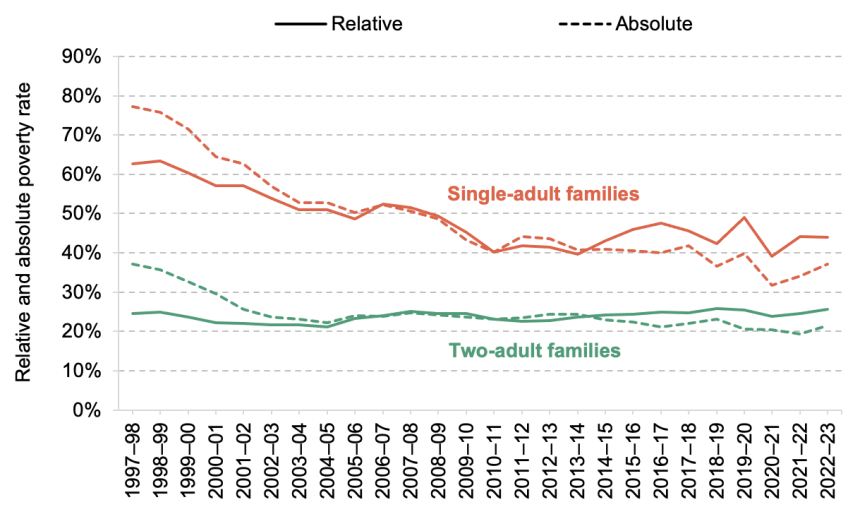
Poverty rates amongst lone-parent families have fallen substantially since the late 1990s. However, some of these gains have been eroded since 2013–14 as relative poverty rates have risen amongst this group. Figure 6.5 shows that by 2022–23, over 40% of children in lone-parent families were living in relative poverty. This was largely due to weak income growth for lone-parent families compared with median incomes. Lone-parent families draw higher proportions of their income from benefits, so were more exposed to cuts to benefits during the 2010s. Additionally, the gap in poverty rates between children living in lone-parent families and children living with more than one adult has narrowed over time. Figure 6.5 shows that relative child poverty rates in 1997–98 were 2.6 times higher for children with lone parents than for children living in a household with at least two adults. By 2013–14, this gap had shrunk to only 1.7 times higher. The gap in relative child poverty rates has stayed relatively stable since then, remaining 1.7 times higher in 2022–23.
Figure 6.5. Relative (solid lines) and absolute (dashed lines) child poverty rates after housing costs are deducted in single-adult and two-adult families over time
Note: Incomes have been measured net of taxes and benefits. All incomes have been equivalised using the modified OECD equivalence scale. Relative poverty is defined as having income less than 60% of contemporaneous median income. Absolute poverty is defined as having income less than 60% of median income in 2010–11. The 1997–98 to 2003–04 period excludes Northern Ireland. ‘Families’ are defined as a single adult or couple, plus any dependent children, living in the same household.
Source: Authors’ calculations using the Family Resources Survey, 1997–98 to 2022–23.
Housing tenure
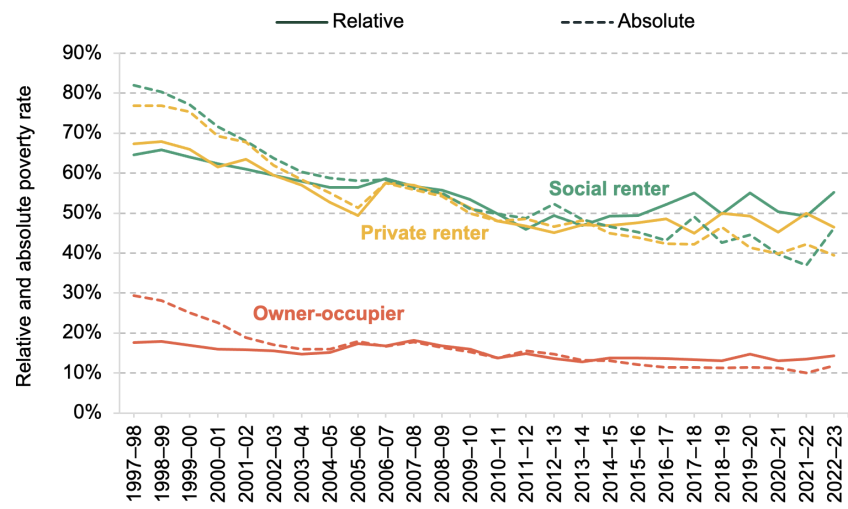
Child poverty rates also vary by the tenure of home the child lives in, with children living in owner-occupied homes less likely to be in poverty than their counterparts living in the private or social rented sector. Figure 6.6 shows that in 1997–98, private and social renters’ children were about four times more likely to be in relative poverty and three times more likely to be in absolute poverty than owner-occupiers’ children. Since 2013–14, the rate of relative child poverty for private renters has hovered between 45% and 50%. Over this same period, support received by low-income private renters from the government has become less generous – namely local housing allowance (LHA) rates, which determine the maximum amount of rent support a family can claim, have fallen, holding back after-housing-cost income growth for these families.
Figure 6.6. Relative (solid lines) and absolute (dashed lines) child poverty rates after housing costs are deducted by housing tenure over time
Note: Incomes have been measured net of taxes and benefits. All incomes have been equivalised using the modified OECD equivalence scale. Relative poverty is defined as having income less than 60% of contemporaneous median income. Absolute poverty is defined as having income less than 60% of median income in 2010–11. The 1997–98 to 2003–04 period excludes Northern Ireland.
Source: Authors’ calculations using the Family Resources Survey, 1997–98 to 2022–23.
What are the characteristics of children in poverty today?
Above, we have shown the share of children in poverty across various types of families. Table 6.1 now shows the characteristics of children in relative poverty in 2022–23, to get a better sense of which policies may be most effective in moving a large proportion of children out of poverty. Half of children in poverty in the UK were from families with three or more children, despite only a third of all children in the UK living in such families. Similarly, only 14% of all children do not live with a working adult, whereas children from workless families make up over a third of children in poverty. A third of children in poverty are living in privately renting households and 40% in socially renting households, despite the majority of all children living in owner-occupier households. Moreover, a third of children in poverty live with a lone parent, compared with just over a fifth among the whole child population. Poverty rates are higher amongst Black and Asian children and amongst children living in the North of England and in London.
Table 6.1. Characteristics of children in relative AHC poverty compared with all children, 2022–23
Household characteristics | Relative poverty rate amongst each group | Share of children in relative poverty who belong to each group | Share of |
All | 30% | 100% | 100% |
Lone parent | 44% | 34% | 23% |
Couple | 26% | 66% | 77% |
Working families | 23% | 67% | 86% |
Workless families | 71% | 33% | 14% |
One child | 22% | 16% | 22% |
Two children | 22% | 34% | 45% |
Three or more children | 46% | 50% | 33% |
Social renter | 46% | 40% | 21% |
Private renter | 40% | 33% | 21% |
Owner-occupier | 12% | 28% | 58% |
North East, North West, Yorkshire | 35% | 27% | 23% |
East and West Midlands | 33% | 18% | 17% |
East, South East, South West | 23% | 24% | 31% |
London | 35% | 17% | 14% |
Wales | 33% | 5% | 4% |
Scotland | 26% | 6% | 7% |
Northern Ireland | 25% | 3% | 3% |
White | 25% | 63% | 75% |
Mixed & Other | 36% | 10% | 8% |
Asian | 47% | 19% | 12% |
Black | 48% | 8% | 5% |
Source: Authors’ calculations using the Family Resources Survey 2022–23.
6.3 How can the benefits system be used to alleviate child poverty?
Child poverty has been pushed further up the policy agenda by the rises in relative poverty seen over the last decade. The new UK government has promised an ‘ambitious strategy’ to reduce child poverty, and the Scottish government has recently rolled out significant new benefits targeted at children in poverty (the Scottish Child Payment and Best Start Grants).
Having examined recent trends in child poverty in the previous section, we now briefly outline the role of benefits policy in supporting children in low-income families and discuss how this has changed over time. We will then analyse some of the options the government has for reducing child poverty through the benefits system. In this section, all calculations are based on Great Britain only, so exclude Northern Ireland.
How are low-income children supported through the benefits system, and how has this changed over time?
The main working-age benefit for low-income families is universal credit. Claimants receive a standard allowance (£4,721 per year for a single person, £7,411 for a couple4), plus an extra £3,455 per year for each child living in the family. However, for third and subsequent children born from 6 April 2017, no additional child element is received5 – a policy known as the two-child limit. If a household rents, they will receive housing support to help cover their rental costs. For private renters, this housing element may be up to a cap linked to local rents, known as the local housing allowance (LHA). Additionally, low-income families are typically eligible for council tax support to cover some or all of their council tax bill. These benefits are withdrawn as parents’ incomes increase. Families can also receive child benefit (£1,330 a year for the first child, £880 for subsequent children), which is not subject to the two-child limit and not targeted only at lower-income households.6 Families on universal credit with incomes (excluding benefits) of no more than £7,400 are eligible for free school meals during term time. If either parents or children are disabled, families may also receive incapacity or disability benefits.
The total benefit amount (not including council tax support) a family receives may not exceed the household benefit cap (£22,020 for a lone parent or couple outside London, £25,323 inside London, with lower caps for single adults without children). There are exemptions if the family receives any disability or incapacity benefits, and for the first nine months after a universal credit claim trigged by earnings falling below £793 a month if a claimant earned above the threshold in each of the preceding 12 months.
Figure 6.7 shows the average benefit entitlements for low-income out-of-work families since 1997. From 1997 to 2010, there were significant increases in means-tested support for parents and children – in working and non-working families. Since 2010, the generosity of the system has reduced. This is partly due to most benefits being frozen or uprated below inflation for most of the 2010s. Rates for children remain considerably higher than in 1997 despite these more recent cuts. But elements for parents are slightly lower than in 1997 and, with earnings having increased substantially over that period, provide significantly less insurance for a parent losing their job. Cuts have not only come through headline rates. For example, real-terms cuts to LHA rates from 2011, the introduction of the household benefit cap in 2013 (and its lowering following the 2015 general election), and the roll-out of the two-child limit and phasing-out of the family premium from 2017 have significantly reduced the generosity of the benefits system for families affected by these policies. Larger families have seen the largest falls in their entitlements.
Figure 6.7. Mean benefit entitlements of low-income out-of-work households with children, by family size (real terms, 2024–25 prices)
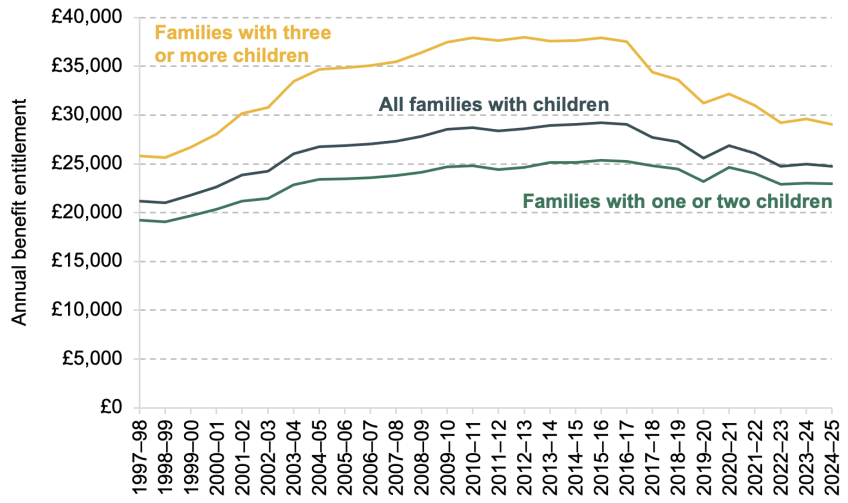
Note: Graph shows the mean total benefit income received by out-of-work households with children in the bottom 40th percentile of equivalised AHC income. We take data on the current population of workless families with children on low incomes and run these through uprated tax and benefit systems for each year from 1997–98 to 2024–25. Households in receipt of any disability income are excluded from the sample. Benefit entitlements are given in 2024–25 prices.
Source: Authors’ calculations using the Family Resources Survey 2022–23 and TAXBEN (the IFS tax–benefit microsimulation model).
Figure 6.7 shows changes over time for a household without any disability benefit income, but there have also been changes in the generosity of disability and incapacity benefits (which are beyond the scope of this chapter). The poverty rate amongst children living in households with at least one disabled adult has remained stubbornly higher than the poverty rate amongst all children: in 2022–23, the relative poverty rate amongst children living with at least one disabled adult was 35%, 5 percentage points higher than the relative poverty rate amongst all children.
Changing the benefit system has implications for work incentives. Figure 6.8 shows net income at different hours of work for a lone parent on the minimum wage, under the current tax–benefit system, and under the 2010–11 and 1997–98 tax–benefit systems uprated to today’s prices. Increases to benefits for out-of-work families will naturally decrease their incentive to enter paid work, but from 1997–98 to 2010–11, in-work benefits were also increased, helping to mitigate this effect by also increasing the incomes received when parents entered paid work. In a tight fiscal environment, it might not be feasible for increases to benefits targeted at the poorest families with children on lower incomes to be accompanied by large increases in in-work benefits. This means such policies may deter some parents from entering work, further increasing the costs to the exchequer beyond the direct cost of providing the additional benefits.
Figure 6.8. Net income at different hours of work for a lone parent on minimum wage with three children, under tax and benefit systems in 1997–98, 2010–11 and 2024–25 (real terms, 2024–25 prices)
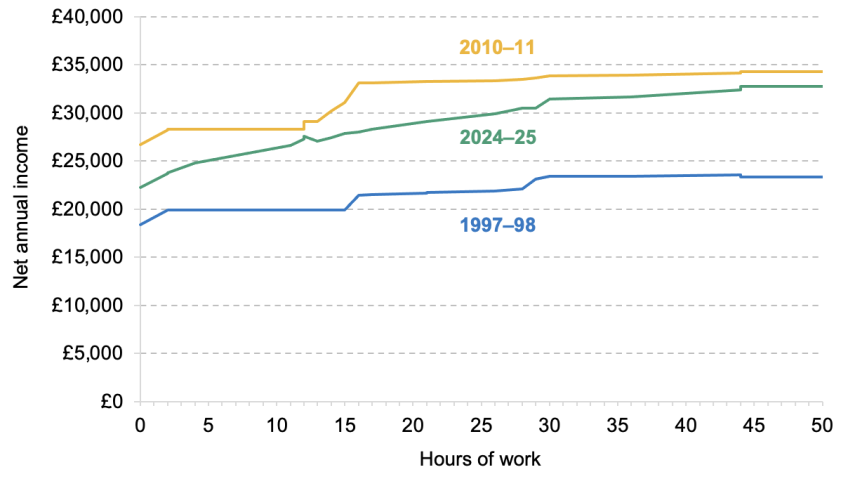
Note: Children are assumed to be 4, 6 and 8 years old. Lone parent is assumed to be a social renter paying £6,000 per year in rent.
Source: Authors’ calculations using TAXBEN (the IFS tax–benefit microsimulation model).
What are the government’s options for policy reform?
The tax and benefit system provides many levers to pull if the government wishes to redistribute income to reduce child poverty, including altering headline tax or benefit rates or making changes to the structure of the system, perhaps by reversing recent changes. First, we discuss a few of the policy levers available to the government through the benefits system to reduce child poverty. We consider a range of options, based on recent changes to the system that apply in England and Wales, as well as local and devolved initiatives. Later, we will compare the costs of the various policies and their impacts on absolute poverty (in order to focus purely on the effects on lower-income households, as explained in the next subsection) and household incomes.
Increase rates of child support in universal credit
The government could simply opt to increase the rates of benefits paid to parents per child, which would increase the household incomes of 2.9 million households and 5.7 million children: in particular, all households with children who are currently in receipt of Universal Credit, but who are not subject to the household benefit cap, would gain.
Increasing the child element of universal credit – currently £3,455 a year – would roughly mirror the approach taken in Scotland to provide an additional £1,390 per child to families on benefits, through the Scottish Child Payment. However, unlike with the Scottish Child Payment, families subject to the household benefit cap would not see any benefit increase from such a policy, and families subject to the two-child limit would not receive an additional payment for all their children, but only for their first two children. Increasing the child element by £26.70 in line with the Scottish Child Payment would cost £4.3 billion per year.
An alternative approach would be to increase the standard amount of benefits that any family with children receives (regardless of number of children). For example, the government could reinstate the family premium, also being phased out since 2017, which gave low-income families with any number of children an additional £545 per year. Reintroducing it at this level would cost £1.1 billion per year.
Another option would be to increase the standard allowance in universal credit for young parents. The standard amount of benefits received by adults under 25 (or couples who are both under 25) is lower than the amount received by older adults. For example, a single person under 25 receives £3,740 a year, compared with £4,721 for an older adult. The government could increase the standard allowance for young parents to match that of older parents, as proposed by the Liberal Democrats at the last election. This would cost £100 million per year.
Remove the two-child limit
Over time, more and more families are being affected by the two-child limit. The recent rise in child relative poverty has been entirely driven by families with three or more children, and half of children in poverty now belong to such families, so removing the two-child limit would be targeted at a specifically at-risk group. Households affected by the two-child limit are a disproportionately deprived subset of all those in receipt of universal credit (Latimer and Waters, 2024). The cost of removing the two-child limit would initially be £1.7 billion a year, and this would rise to £2.5 billion as the policy is rolled out (note that this assumes the household benefit cap is left in place, thereby limiting the gains for some households; see below).
Table 6.2 shows that over 30% of children in poverty today are affected by the two-child limit, rising to 40% by the time it is fully rolled out. This means the impact on children, and the cost to the exchequer, of removing the two-child limit will grow over time. As shown in Table 6.4 later, the two-child limit means benefit entitlements are less likely to push low-income families above the poverty line, though they still in general push families over the deep poverty line used here. Among those in poverty, children in the social rented sector, and in working households, are also particularly likely to be affected by the two-child limit. Households with an adult of Pakistani or Bangladeshi origin are also more likely to be affected – 43% of children in these households see their household incomes reduced by the two-child limit (Latimer and Waters, 2024).
Table 6.2. Share of children affected by the two-child limit, by group
Group | Share affected | Share affected |
All |
|
|
All children | 13.0% | 16.3% |
In absolute AHC poverty |
|
|
All children in poverty | 30.7% | 39.9% |
Lone parent | 25.9% | 35.6% |
Couple | 33.4% | 42.3% |
In work | 31.6% | 38.3% |
Out of work | 29.4% | 42.4% |
Social renter | 34.9% | 49.7% |
Private renter | 26.2% | 31.6% |
Owner-occupier | 30.4% | 35.8% |
White | 29.2% | 38.0% |
Mixed & Other | 35.3% | 44.0% |
Asian | 32.4% | 48.1% |
Black | 33.5% | 35.0% |
In deep poverty |
|
|
All children in deep poverty | 15.5% | 24.7% |
Note: Statistics do not include Northern Ireland. ‘In work’ indicates that at least one individual in the household is earning any non-zero amount of income from employment. ‘Deep poverty’ here corresponds to an income below 40% of median inflation-adjusted income in 2010–11 – an absolute definition.
Source: Authors’ calculations using Family Resources Survey 2022–23 and TAXBEN (the IFS tax–benefit microsimulation model).
Increase support for housing costs
With children in households that rent over three times as likely to be in poverty as children in owner-occupier households, increases in the generosity of housing support in universal credit would be targeted to a relatively high-poverty group.
The main option here is to increase LHA rates, which cap the amount of housing support received by private renters on benefits. The generosity of support was reduced in 2011, prior to which LHA rates would track median rents in their local area (specifically, their ‘broad rental market area’ or BRMA), meaning half of local properties could be fully covered. Local housing allowance rates were increased in April this year so that they cover the cheapest 30% of properties in each area based on September 2023 rents, but they are now frozen at this level in cash terms. The freeze means that, with rents growing rapidly (Office for National Statistics, 2024), the proportion of properties with rents that can be covered by housing benefit is shrinking over time. This is a pattern that has played out before: between 2020 and 2023, a freeze in LHA rates while rents were rising meant the proportion of new lets that could be covered by housing benefit fell from 23% to just 5% (Waters and Wernham, 2023). To avoid repeating this and seeing generosity eroded over time, government should index rates of LHA in line with growth in local rents over time. Increasing LHA rates in this way would prevent more households being pushed (deeper) into poverty by rising rents.
The government could go further and increase the proportion of local rents LHA is set to cover. Increasing LHA rates from the 30th to the 50th percentile of local rents would cost the government around £0.5 billion but this is a lower bound as it does not account for families deciding to live in more expensive properties as a result of the policy. To put this policy into context, it would see the LHA rate for a two-bedroom property in Leeds increase from £178.36 to £205.97, for instance. However, any increase in LHA rates would also boost the incomes of many households without children, so would not be particularly targeted at child poverty. Other options include relaxing the rules for how many children must share a bedroom or restoring the five-bedroom rate which was removed in 2011.
Housing benefit is not capped in the same way for social renters – typically, their full rent is covered if they have no other source of income. However, they can be subject to the under-occupancy charge or so-called ‘bedroom tax’, which reduces benefit entitlements for social renters who are deemed to have a spare bedroom. However, only a very small proportion of children are affected by the bedroom tax – it is particularly likely to affect a social renting household after adult children leave home, so the impact on child poverty of removing such a policy would be limited.
Remove the household benefit cap
Introduced in 2013, lowered in 2016 and raised in 2023, the household benefit cap limits the total amount of benefits a family can receive, based on the number of adults and whether they live in or out of London. Removing this cap is another measure the government could take to boost the generosity of the benefits system. Since 2023, the Scottish government has adopted a policy of mitigating the household benefit cap through discretionary housing payments.
Only families with the largest benefit entitlements are affected by the household benefit cap. The latest data from DWP show that 123,000 households were benefit capped in May 2024, which is equivalent to 1.8% of working-age households claiming housing benefit or universal credit (Department for Work and Pensions, 2024). As Table 6.3 shows, among children in poverty it is lone-parent families, out-of-work families, private and social renting families, and families with three or more children who are most likely to be affected. The families most likely to be hit by the household benefit cap are amongst the very poorest, with incomes (including benefits they receive) well below the poverty line.
Table 6.3. Share of children affected by the household benefit cap, by group
Group | Share affected | Share affected |
All |
|
|
All children | 2.2% | 1.6% |
In absolute AHC poverty |
|
|
All children in poverty | 9.5% | 6.8% |
Lone parent | 15.8% | 11.1% |
Couple | 5.9% | 4.3% |
In work | 4.8% | 3.4% |
Out of work | 16.9% | 12.2% |
One child | 1.5% | 1.5% |
Two children | 5.8% | 5.1% |
Three or more children | 15.2% | 9.9% |
Social renter | 14.8% | 9.1% |
Private renter | 10.4% | 9.4% |
Owner-occupier | 0.8% | 0.0% |
White | 8.6% | 6.3% |
Mixed & Other | 8.5% | 8.2% |
Asian | 12.2% | 6.5% |
Black | 9.8% | 7.6% |
In deep poverty |
|
|
All children in deep poverty | 14.4% | 12.1% |
Note: Statistics do not include Northern Ireland. ‘In work’ indicates that at least one individual in the household is earning any non-zero amount of income from employment. Households are exempt from the benefit cap if they claim universal credit but earn a combined after-tax income of at least £793 a month; thus the ‘in work’ group only refers to those working at a very low level of earnings.
Source: Authors’ calculations using Family Resources Survey 2022–23 and TAXBEN (the IFS tax–benefit microsimulation model).
Once the two-child limit and removal of the family premium are fully rolled out, the household benefit cap will save the exchequer about £0.5 billion per year, or about £3,900 per family affected. The household benefit cap is therefore a policy that affects a small number of families by a large amount each. Evidence produced by the Department for Work and Pensions (and peer reviewed by IFS researchers) suggests that the household benefit cap has incentivised small numbers of people to move into paid work (and, in even rarer cases, move to a cheaper area), but in the large majority of cases, affected claimants have not changed either their employment or their housing choice in response to the policy (Emmerson and Joyce, 2023).
The household benefit cap is set to affect fewer families over time (0.4% of families once the two-child limit is rolled out). As the two-child limit and removal of the family premium are rolled out, fewer large families will hit the cap, since having additional children will not confer as much additional benefit income through universal credit (though they can still receive additional child benefit and support for their housing costs, both of which do count towards the cap). And households that remain affected are increasingly likely to have the lowest disposable incomes. Over time, fewer households will be affected by the cap. In the same vein, the household benefit cap reduces the impact of policies mentioned earlier, as some families, particularly the very poorest families, would not benefit from any increases in universal credit if they have already reached the household benefit cap.
The two-child limit and benefit cap effectively represent caps on separate parts of the benefit system, one on child support and the other on housing support. The case for maintaining the benefit cap arguably becomes weaker as the two-child limit is fully rolled out – since fewer families are affected, its removal becomes cheaper, and those that remain affected are seeing a particularly large reduction in their benefit entitlement, relative to their needs incurred due to having both many children and high housing costs.
As an example of these interactions between different policies, Table 6.4 considers a lone parent with three young children. Suppose they were living in social rented accommodation paying about £6,000 a year in rent and not in paid work. They would be eligible for a £4,721 per year standard allowance, plus £10,365 of child element in the absence of the two-child limit (i.e. if all their children were born before 6 April 2017). They would also receive £3,102 in child benefit, typically have their rent fully covered through universal credit, and receive support for most or all of their council tax (Latimer and Waters, 2024). They would also be eligible for the £545 a year family premium. This would give them an income after housing costs of £18,733. The value of free school meals (if all their children receive them) would take their income to £20,175, above the poverty line (which for this family would be £19,756). But under the two-child limit and removal of the family premium, their income is further reduced by £4,000 or 20%, pushing them into poverty. And even in the absence of these two policies, the household benefit cap would kick in and reduce their income by £2,713 or 13%.
Table 6.4. Annual benefit income of an example out-of-work lone parent social renter with three children, under different policy measures (2024 tax–benefit system and prices)
| No No two-child limit or removal of family premium | With household benefit cap No two-child limit or removal of family premium | With household benefit cap With two-child limit and removal of family premium |
UC standard allowance | £4,721 | £4,721 | £4,721 |
Housing support | £6,000 | £6,000 | £6,000 |
Total child element | £10,365 | £10,365 | £6,910 |
Child benefit | £3,102 | £3,102 | £3,102 |
Family premium | £545 | £545 | £0 |
Total uncapped benefit income | £24,733 | £24,733 | £20,733 |
Impact of household benefit cap (£22,020 for this family) | n.a. | –£2,713 | £0 |
Housing costs | –£6,000 | –£6,000 | –£6,000 |
Free school meals | £1,442 | £1,442 | £1,442 |
Total income after housing costs | £20,175 | £17,462 | £16,175 |
Absolute poverty line for this family | £19,756 | £19,756 | £19,756 |
Note: Child benefit and support for housing costs, in contrast to the child element of universal credit, are unaffected by the two-child limit. The table assumes council tax is fully covered by council tax support, family lives outside of London in social rented property costing £6,000 per year with no spare bedrooms, and all the children are aged under 14. The poverty line used is the absolute poverty line from 2022–23, uprated by CPI.
Expand eligibility to free school meals
Free school meals are offered to all state-educated children in England in Reception, Year 1 and Year 2, during term time. They are also available to older children if their families receive means-tested benefits and earn no more than £7,400 a year – just under 25% of pupils in England (Cribb et al., 2023). Unlike some other kinds of non-cash support that low-income families receive, free school meals are included in official income statistics (valued at £2.53 per meal) and therefore have a bearing on the measured poverty rate.
Options for reducing poverty by expanding free school meal eligibility could include increasing the income threshold for universal credit recipients (as is the case in Northern Ireland) or removing the threshold entirely or making them universal.7 Free school meals are already offered regardless of income to primary children of older ages in state schools in Wales, Scotland and London due to devolved and local government policy. Whilst expanding free school meals universally would be a less well-targeted approach, it would come with the advantage of removing the cliff-edge in eligibility that currently exists for families subject to means testing – whereby lone parents with three children face the prospect of losing meals valued at around £1,400 by earning even a penny over £7,400 – as well as other potential advantages, such as reducing stigma and improving take-up (Cribb et al., 2023),
Impact of policy options on poverty rate and disposable income
We now compare the costs to the exchequer, and impact on household incomes and poverty, of various policy options, based on the above discussion.
To carry out this exercise, we use data from the Family Resources Survey – the survey used to calculate official income and poverty statistics – and calculate the benefit entitlements of each household. We then calculate how these entitlements would change under various policies based on the above discussion. Finally, we apply an adjustment to account for the fact that not everyone who is entitled to a benefit will take it up. See Appendix 6B for further technical details of adjustments we make to the data.
Table 6.5 shows, for each policy, the total cost (and, of that, the value of the increase in benefits going to various types of households with children), the number of children lifted out of absolute poverty, the cost per child lifted out of poverty and the reduction in overall absolute poverty. This exercise focuses on absolute poverty, because some of the policies could affect median incomes and therefore the relative poverty line. Measuring the change in absolute poverty allows us to focus solely on the impact on poorer children’s household incomes. The table shows the impact of these policy measures once the two-child limit and removal of the family premium are fully rolled out (which in fact is not scheduled to occur until 2035).
Table 6.5. Cost and impact on absolute poverty of various benefit policy measures, ordered by cost per child brought out of poverty
Policy | Annual cost | Of which transfers to households with children | Of which transfers to households with children | Of which transfers to households with children | Reduction in child poverty, ’000s (ppt change) | Annual cost per child brought out of poverty | Reduction in overall poverty, |
Remove two-child limit | £2,450m | 59% | 40% | 1% | 540 (4 ppt) | £4,510 | 780 (1 ppt) |
Remove two-child limit and household benefit cap | £3,340m | 63% | 31% | 1% | 620 (4 ppt) | £5,400 | 880 (1 ppt) |
Remove household benefit cap and two-child limit, and increase child element of UC by £26.70 p.w. | £9,180m | 51% | 42% | 4% | 1,189 (8 ppt) | £7,730 | 1,820 (3 ppt) |
Give young parents same standard allowance as older parents | £100m | 61% | 33% | 7% | 10 (0 ppt) | £8,810 | 20 (0 ppt) |
Expand free school meals to all children of families on UC | £1,110m | 38% | 52% | 9% | 110 (1 ppt) | £10,210 | 190 (0 ppt) |
Increase LHA rates to 50th percentile of local rents | £450m | 21% | 34% | 5% | 40 (0 ppt) | £11,040 | 90 (0 ppt) |
Increase child element of UC by £26.70 p.w. | £4,320m | 36% | 55% | 8% | 380 (3 ppt) | £11,410 | 660 (1 ppt) |
Reinstate family premium (£545 p.a.) | £1,110m | 37% | 53% | 10% | 90 (1 ppt) | £12,750 | 170 (0 ppt) |
Increase child benefit by £26.70 p.w. for each child | £15,270m | 26% | 36% | 39% | 867 (6 ppt) | £17,620 | 1,500 (2 ppt) |
Expand free school meals to all children aged under 18 | £3,160m | 16% | 29% | 55% | 120 (1 ppt) | £27,360 | 200 (0 ppt) |
Remove household benefit cap | £480m | 61% | 1% | 0% | 10 (0 ppt) | £46,560 | 20 (0 ppt) |
Remove under-occupancy charge | £490m | 7% | 12% | 1% | 0 (0 ppt) | £102,670 | 30 (0 ppt) |
Note: The baseline simulated absolute child poverty rate, assuming full roll-out of the two-child limit and removal of the family premium, is 23%. Northern Ireland is not included in this analysis.
Source: Authors’ calculations using Family Resources Survey 2022–23 and TAXBEN (the IFS tax–benefit microsimulation model).
First looking at the two-child limit, its removal would eventually cost the government £2.5 billion a year and lift around 540,000 children out of absolute poverty. At £4,510 per child brought out of poverty, this is the most cost-effective child poverty reduction policy of those we model. It is perhaps unsurprising that removal of the two-child limit has such a potent effect on this measure, given the extent of poverty amongst children in large families, as described in Section 6.2. The price tag of £2.5 billion is not a trivial sum, reflecting that affected families can gain up to an additional £3,455 per child per year – for example, a household with five children could see their income grow by over £10,000 a year (unless subject to the benefit cap). But this cost would be well targeted at lower-income children, and children in poverty in particular. The household benefit cap significantly dampens the impact of removing the policy – if the household benefit cap were removed as well, the policy would bring 620,000 children out of poverty, though at a much higher cost of £3.3 billion, and a higher cost per child lifted out of poverty as well.
The following policies cost between £8,800 and £12,800 per child brought out of poverty, and so in that sense are moderately ‘cost-effective’ at reducing the poverty rate: increasing LHA rates; increasing the child element of universal credit; restoring the family premium; increasing the standard allowance for young parents; and expanding free school meals to all on universal credit.8 However, the policies differ in terms of who they target – increasing the child element of universal credit or restoring the family premium would spread the benefit fairly broadly among poorer children, whereas increasing LHA rates would benefit only private renting families (and 40% of the cash would go to households without children); expanding free school meals would not benefit pre-school children or younger primary school pupils who are already provided with free school meals universally, while increasing the standard allowance for young parents would be very narrowly targeted at a specific group (parents aged under 25, and would naturally therefore also be targeted at younger children).
The least cost-effective policy for reducing child poverty among those shown is removing the under-occupancy charge (‘bedroom tax’). Very few children in poverty are affected by the under-occupancy charge, so abolishing it would lift very few out of poverty, though it would lift out 30,000 adults.
Another policy shown to have poor cost-effectiveness in reducing child poverty is abolishing the household benefit cap (without other policy changes), with a cost of almost £47,000 per child brought out of poverty. This is not to say that removing the household benefit cap would be ineffective at supporting poorer children’s living standards. In fact, Table 6.5 shows that 61% of the spending on removing the household benefit cap would go to children in absolute poverty, essentially the same proportion as for removing the two-child limit (59%). Additionally, abolishing the household benefit cap would provide a boost to the household incomes of children affected by the policy of just over £4,730 a year on average, as shown in Table 6.6. This is a higher per-household amount than for removing the two-child limit, albeit reaching far fewer households.
Table 6.6. Impact on disposable incomes of various benefit policy measures, among households with children
Policy | Number of households with children affected (thousands) | Average income change among affected households with children | % income change among affected households with children |
Remove two-child limit | 660 | £3,710 | 13% |
Remove two-child limit and household benefit cap | 760 | £4,430 | 17% |
Remove household benefit cap and two-child limit, and increase child element of universal credit by £26.70 a week | 3,020 | £3,050 | 12% |
Give young parents same standard allowance as older parents | 100 | £990 | 5% |
Expand free school meals to all on universal credit | 1,480 | £750 | 3% |
Increase LHA rates to 50th percentile of local rents | 950 | £480 | 3% |
Increase child element of universal credit by £26.70 a week | 2,920 | £1,480 | 6% |
Reinstate family premium (£545 per year) | 2,690 | £420 | 2% |
Increase child benefit by £26.70 a week for each child | 6,670 | £2,300 | 6% |
Expand free school meals to all children aged under 18 | 4,350 | £730 | 1% |
Remove household benefit cap | 100 | £4,730 | 33% |
Remove under-occupancy charge | 530 | £940 | 6% |
Note: The results assume full roll-out of the two-child limit and removal of the family premium. Northern Ireland is not included in this analysis.
Source: Authors’ calculations using Family Resources Survey 2022–23 and TAXBEN (the IFS tax–benefit microsimulation model).
The child poverty rate is a valuable measure allowing us to summarise how poorer children’s living standards have evolved over time, both in absolute terms and relative to middle-income families. Indeed, targets based on this measure were set by the UK government under New Labour, and these were then enshrined in law in 2010, before being dropped by the Conservative-led coalition government in 2015. The child poverty rate is still targeted by the Scottish government, and various policies – most notably, the Scottish Child Payment – have been pursued in order to meet the goal of reducing it.
However, whilst a valuable summary measure, the poverty line is necessarily arbitrarily drawn. There is nothing special about 60% of current median income (the relative poverty line) nor about 60% of the 2010 median real income (the absolute poverty line). Hence, focusing entirely on that line can in some ways be misleading: a policy that takes large numbers of children from just below the poverty line to just above could have a significant impact on the headline poverty rates while making little difference to anyone’s living standards. In contrast, another policy might significantly boost the incomes of many households just above the poverty line, or well below it, but make little difference to the headline poverty rate.
Another way of illustrating this point is to consider how an analysis of the impact of policies on poverty would change if the poverty line were drawn elsewhere. Table 6.7 shows the impact of the various benefit policies we considered above on the proportion of children in deep poverty, here defined as having a real income below 40% of 2010 median income.
Table 6.7. Impact on child deep absolute poverty (real household income below 40% of 2010 median) of various benefit policy measures
Policy | Reduction in ’000s (ppt change) | Cost per child brought out of deep poverty |
Remove two-child limit | 110 (1 ppt) | £22,050 |
Remove two-child limit and household benefit cap | 210 (2 ppt) | £15,770 |
Remove household benefit cap and two-child limit, and increase child element of universal credit by £26.70 a week | 300 (2 ppt) | £30,930 |
Give young parents same standard allowance as older parents | 10 (0 ppt) | £6,600 |
Expand free school meals to all on universal credit | 10 (0 ppt) | £76,590 |
Increase LHA rates to 50th percentile of local rents | 10 (0 ppt) | £59,340 |
Increase child element of universal credit by £26.70 a week | 120 (1 ppt) | £36,210 |
Reinstate family premium (£545 per year) | 40 (0 ppt) | £28,790 |
Increase child benefit by £26.70 a week for each child | 290 (2 ppt) | £52,720 |
Expand free school meals to all children aged under 18 | 20 (0 ppt) | £152,950 |
Remove household benefit cap | 30 (0 ppt) | £13,850 |
Remove under-occupancy charge | 10 (0 ppt) | £70,060 |
Note: The baseline simulated absolute child deep poverty rate, assuming full roll-out of the two-child limit and removal of the family premium, is 7%. Northern Ireland is not included in this analysis.
Source: Authors’ calculations using Family Resources Survey 2022–23 and TAXBEN (the IFS tax–benefit microsimulation model).
Abolishing the household benefit cap would take 30,000 children out of deep poverty and would do so far more cost-effectively than abolishing the two-child limit, at a cost per child of £13,850 compared with £22,050. Households affected by the household benefit cap tend to be much further below the 60% poverty line. Consequently, while abolishing the two-child limit would boost affected households’ incomes by 13% (see Table 6.6), abolishing the benefit cap would confer a much large proportional increase in incomes of 33% to the (fewer, and poorer) households affected by that policy. But it is also much less likely that this would be enough to bring them above the 60% poverty line, because they tend to be so far below it. Abolishing both the two-child limit and the household benefit cap would reduce the number of children in deep poverty by over 210,000 (or 2 percentage points, compared with a baseline of 7%). Increasing LHA rates looks rather less effective on this measure. Its cost-effectiveness at reducing official child poverty rates, despite much of the cash going to families without children, would come from the fact that it gives a relatively small boost to the incomes of many households with children who are just below the poverty line.
These examples illustrate the importance of considering a policy’s impact across the income distribution, and not just on one binary measure.
Again, it is important to note that these policies will have differing effects on work incentives. The policies that are most directly targeted at lower-income families, and therefore at reducing poverty or its depth, are likely to be the ones that weaken those incentives the most. Unlike during the more favourable economic conditions of the early 2000s, it will be very challenging for the government to mitigate any such reforms through concurrent large expansions of in-work benefits.
6.4 How can labour market policy impact the child poverty rate?
The benefits system is not the only means of increasing the incomes of low-income families. The Labour government has said it is targeting a significant increase in the employment rate to 80%, up from 75% at present – equivalent to a rise of 2.2 million people. This target is very ambitious: it would imply a rise in employment roughly equal to that seen between the depths of the Great Recession and the pre-pandemic peak. The historical peak employment rate was 76.2%, right before the pandemic in February 2020, and the Office for Budget Responsibility is not currently forecasting any large increase to employment.
There are plenty of reasons the government might want to raise the employment rate. One possible reason would be to contribute to goals around child poverty. This contribution could be both direct, by increasing the incomes of parents, and indirect – for example, by increasing parents’ labour market experience and therefore long-term earnings potential. How much it might contribute to reducing child poverty would depend to some degree on how increased employment was achieved and on precisely who is moved into paid work. For example, there would obviously be less effect on child poverty if many of those brought into employment are parents in households already above the poverty line or if many are non-parents. Indeed, in these cases, measures of relative child poverty could rise. But there is scope here for moving the dial on child poverty: as discussed in Section 6.2, the rate of child poverty is much lower among working households than among non-working households (19% versus 64% in absolute poverty).
With these uncertainties in mind, we have assessed a scenario for how child poverty might change if this employment target were reached. Our approach is as follows. We take the Family Resources Survey, and randomly select working-age individuals who are not in paid work (excluding lone parents or one parent in each couple with children under the age of 1, who are relatively unlikely to enter paid work). We then predict what their earnings might be if they moved into employment (based upon their characteristics – education, work experience, age, sex, region and lone-parent status – and the observed relationship between those characteristics and weekly earnings among employees). Finally, using TAXBEN, the IFS tax–benefit microsimulation model, we calculate what their in-work tax liabilities and benefit entitlements would be. This gives us the estimated change in their household income, and therefore the poverty rate, were they to move into paid work. For fuller details, see Appendix 6B.
Of course, not everyone is equally likely to be brought into work if there is a big increase in the employment rate. For example, we might expect those with long-term health conditions to be less likely to move into paid work. However, with the disability benefits bill rising considerably, the Labour Party manifesto stated a specific intention to ‘support more disabled people and those with health conditions into work’.9 As out-of-work individuals with long-term health conditions are less likely to have dependent children compared with out-of-work adults who do not have a long-standing health condition, who exactly is targeted will be an important factor in deciding how effective increasing the employment rate is at reducing child poverty. Table 6.8 shows illustrative results for two different possibilities. In the first row, we assume that the new workers are drawn from all working-age adults currently not in paid work (with equal probability, allowing their predicted earnings to depend on health status). In the second row, we assume that, once again, new workers are drawn from all working-age adults currently not in paid work; however, this time, individuals who have long-standing health problems are only half as likely to move into work. In the bottom row, we assume that only those not reporting long-term health conditions move into work.
Table 6.8. Possible impact of increase in employment on child absolute poverty
Scenario | Reduction in absolute child poverty, thousands (percentage point change) |
New workers drawn from all of working age | 230 (1.6 ppt) |
New workers drawn from all of working age, with working-age individuals with long-standing health problems half as likely to move into work | 280 (2.0 ppt) |
New workers only drawn from working-age individuals without long-standing health problems | 340 (2.4 ppt) |
Note: The baseline simulated absolute child poverty rate, assuming full roll-out of the two-child limit and removal of the family premium, is 23%. Northern Ireland is not included in this analysis.
Source: Authors’ calculations using Family Resources Survey 2022–23 and TAXBEN (the IFS tax–benefit microsimulation model).
The results show that the number of children who would be brought out of poverty is somewhat sensitive to who moves into employment – and, in any case, this is only one illustrative scenario, so one should not attach too much significance to these precise numbers. But a plausible number is a couple of hundred thousand children moving out of absolute poverty. However, it should be noted that the effect on relative poverty is even less clear-cut; as the employment rate increases, average household income will likely rise, which would move the relative poverty line up (whereas the absolute poverty line is fixed). Even if most of the entries into employment are into low-paid work, other members of the household may still bring total household income close to or above the median, so the relative poverty line could still move up. This could lead to either a fall or an increase in relative poverty, depending on the balance between households moving below the poverty line as it rises and households moving above it because of a boost to household income due to employment. Our simulations show a small fall in relative poverty rates, much smaller than the fall in absolute poverty rates.
The results for absolute poverty are middling compared with the benefit policies described above, despite a very large increase in employment. Part of this is because only 18% of working-age adults who are out of work (excluding main carers of children aged under 1) have children and are below the absolute poverty line, so a broadly focused drive to increase employment is simply not targeted at this group.
Another factor limiting any policy aiming to reduce child poverty by moving parents into paid work is that many lone parents who might move into work (those who are most likely to be in poverty) would be expected to go into lower-paid or part-time work (which is accounted for in our modelling). This reduces the potential for moves into employment to lift families out of poverty. For example, Codreanu and Waters (2023) found that following reforms requiring lone parents on benefits to move into paid work, almost all who did move into work went into part-time low-paid jobs.
But once again, if the government achieves broad increases in employment, this will have wider benefits beyond reducing child poverty, including providing substantial income boosts to families with children who might already be above the poverty line, and increasing revenues for the government as benefit entitlements fall and tax liabilities increase. Benefit increases, on the other hand, would add to spending and therefore require increased borrowing, tax rises, or cuts elsewhere.
Another approach to reducing child poverty through the labour market could be increasing the minimum wage. Two-thirds of children in poverty are already in working families, so increases in earnings have the potential to increase the household incomes of many poorer children. Further increases to the minimum wage are one possible means of achieving this (albeit only benefiting children whose parents are employed). Minimum wages provide a means of directly increasing the earnings and therefore household incomes of lower-earning employees, with the cost falling on employers (some of which may be passed on, for example, through price increases). One risk of raising the minimum wage is a reduction in employment. So far, there is little evidence of any large adverse effect on employment from previous large rises in the minimum wage (e.g. Giupponi et al., 2024), but that does not guarantee further increases would not have such an effect.
Another perhaps more immediate limitation of such an approach is that, while increasing the minimum wage would be well targeted at employees who are on low hourly wages, this does not necessarily mean it would be well targeted at households – and in particular households with children – that have low disposable incomes. Minimum wage workers are often second (or even third) earners in households, often in the middle of the income distribution (and hence already out of poverty), so the majority of beneficiaries would not be in poorer households. Moreover, since lower-income households, and particularly lower-income households with children, are more likely to be receiving benefits while in work, they tend to keep less of any earnings increase than middle-income households, since as well as paying tax on the additional earnings they also see some of their benefits withdrawn. This means that the minority of beneficiaries from a minimum wage increase who are in poorer households will often see less of a gain than beneficiaries in households that are less poor.
Indeed, Giupponi et al. (2024) show that it is middle-income households who see the largest cash income increases as a result of minimum wage rises. This decreases the effectiveness of minimum wage rises in reducing absolute poverty, and may mean they actually increase relative poverty, by boosting incomes at the median.
In summary, increases to the minimum wage would not be particularly well targeted at those with the lowest household incomes. They might be an effective instrument for achieving other policy objectives but are unlikely to be sufficient to deliver ambitious reductions in child poverty.
6.5 Conclusion
The government is developing a strategy to reduce child poverty, which is due to be published in the spring, and will be considering a range of policy options. This chapter has shown that some groups of children are at significantly higher risk of poverty than others, such as those in large families, those in workless households and those living in rented accommodation, with implications for the sorts of policies that will be most effective at reducing child poverty.
Options open to the government through labour market policy are unlikely to be well targeted at reducing child poverty – though they may have other desirable outcomes. Increases to the minimum wage provide larger boosts to household incomes in the middle of the income distribution than at the bottom. Increases to employment may bring some children out of poverty (around 200,000 to 350,000 by our estimates) but this relies on the government achieving its very ambitious goal to increase the employment rate to 80%. Efforts to incentivise parents in particular into work in the past have often led to them entering low-paid and part-time work.
Among the options available to the government on benefits policy, removing the two-child limit would be the single most cost-effective policy at reducing the number of children classified as in poverty. It would be a policy well targeted at the group who have driven the rise in child poverty in recent years and would provide a big boost to their incomes. It would cost about £2.5 billion a year in the medium term. But to evaluate policy options solely on that metric would miss important considerations when determining the best way to support poorer children.
The official measure of poverty is a binary indicator, but poverty is experienced in varying depths, and different policies will affect the depth of poverty in different ways. For example, scrapping the two-child limit alone would significantly reduce the number below the poverty line, but many of the poorest households affected by the policy would benefit less than those closer to the poverty line, as the household benefit cap would prevent them receiving the full additional child element. Removing the household benefit cap alone – at a cost of about £0.5 billion a year – would not lift as many above the poverty line but would target a smaller and much poorer group of children and give the average affected household a proportionally larger increase in income. Removing both policies would have a larger effect still, albeit at significantly increased eventual cost of £3.3 billion a year.
Therefore, when the government chooses which policies to pursue to reduce child poverty, and when the impact of these policies is evaluated, effects across the distribution of incomes should be considered, not just around the official poverty line.
Appendix 6A. The treatment of housing costs10
The analysis in this chapter is chiefly based on data from the Family Resources Survey (FRS), a survey of around 20,000 households a year, which contains detailed information on different sources of household incomes. We use household income variables derived from the FRS by the Department for Work and Pensions (DWP). These measures of incomes underlie DWP’s annual statistics on the distribution of income, known as ‘Households Below Average Income’ (HBAI).
The key housing costs captured in the HBAI data are rent payments and mortgage interest payments, but they also include water rates, community water charges, council water charges, structural insurance premiums for owner-occupiers, and ground rents and service charges. Mortgage capital repayments are not included, on the basis that these represent the accumulation of an asset (they increase net housing wealth) and are therefore better thought of as a form of saving than as a cost of housing. Costs such as maintenance, repairs and contents insurance are also not included.
When looking at changes in living standards, there is a case for focusing on income measured before housing costs are deducted (BHC). This is because most individuals exercise a choice over housing cost and quality, at least in the medium and long terms, and for those individuals housing should be treated as a good like any other (i.e. the amount that households choose to spend on it should not be deducted from income). For instance, consider two households with the same BHC income, one of which decides to spend a larger fraction of that income on a larger house in a better neighbourhood, while the other has different preferences and chooses to spend the difference on other things. On an after-housing-costs (AHC) basis, the former household would be considered poorer, but we might consider their living standards to be comparable.
There are, however, a number of reasons to focus on income measured AHC in certain circumstances.
First, income measured AHC may provide a better indicator of the living standards of those who do not face genuine choices over their housing, particularly if housing cost differentials do not accurately reflect differences in housing quality. This is likely to be the case for many in the social rented sector, where individuals tend to have little choice over their housing and where rents have often been set with little reference to housing quality or the prevailing market rents.
Second, the existence of housing benefit means that measuring income AHC has an advantage over BHC as a measure of living standards for housing benefit recipients. This is because housing benefit reimburses individuals specifically for their rent. Consider a household with no private income whose rent increases by £10 per week. This might trigger a £10 increase in housing benefit entitlement to cover the rent increase. Hence, AHC income would remain unchanged but BHC income would increase by £10 per week. Therefore, where rent changes do not reflect changes in housing quality – for example, when they simply reflect changes in the rules governing social rents – the subsequent changes in BHC (but not AHC) income can give a misleading impression of the change in living standards of households on housing benefit.
Third, measuring income AHC may be more appropriate than measuring it BHC when comparing households that own their home outright (and so pay no rent or mortgage interest costs) with those that do not. On a BHC basis, an individual who owns their house outright will be treated as being as well off as an otherwise-identical individual who is still paying off a mortgage; an AHC measure, though, would indicate that the former was better off.11 This is particularly important when comparing incomes across age groups – pensioners are much more likely to own their homes outright than working-age adults.
Fourth, comparing changes in AHC incomes may provide better information about relative changes in living standards when some households have seen large changes in their housing costs that are unrelated to changes in housing quality. This is particularly relevant when looking at the period between 2007–08 and 2009–10, as rapid falls in mortgage interest rates reduced the housing costs of those with a mortgage significantly, while the housing costs of those who rent their homes (or own them outright) were not directly affected. When incomes are measured BHC, changes over time in the incomes of all households are adjusted for inflation using a price index that accounts only for average housing costs. This will understate the effect of falling housing costs on living standards for those with a mortgage and overstate it for those without a mortgage. Changes in income measured AHC do not suffer from this issue, since changes in housing costs are accounted for by subtracting each household’s actual housing costs from its income. This difference is important to bear in mind when looking at changes in poverty and inequality. Those towards the bottom of the income distribution (around the poverty line), as well as the youngest and oldest adults, are less likely than average to have a mortgage.
Appendix 6B. Technical appendix
Benefit take-up adjustments
To carry out the policy analysis in this chapter, we use the Family Resources Survey (FRS) in conjunction with TAXBEN, the IFS tax and benefit microsimulation model. TAXBEN calculates the tax liabilities, benefit entitlements and net incomes of individual households for current and historical tax and benefit systems as well as hypothetical systems. Calculations in TAXBEN are usually on an ‘entitlements basis’, estimating net incomes based on the assumption that families claim all the benefits that they are entitled to. However, in reality, this might not be the case. Instead, we can also calculate net incomes on a ‘reported take-up basis’, which means that we assign individuals’ net incomes based on what they report that they are claiming in the FRS. We take this approach in the analysis for this chapter. The true take-up of benefits is somewhere between reported take-up and full take-up (entitlements): some people do not claim the benefits to which they are entitled, while others do take up benefits but neglect to say so in the household survey. Thus, our estimates may be an underestimate of the overall effects of changes in benefits policy.
Estimating the effect of an increase in the employment rate
As part of our analysis, we model the effects of an increase in the employment rate to the Labour government’s target of 80%. We do this in three steps.
First, we estimate the employment earnings of those who are currently not in work (and are also of working age and not in full-time education). We do this by first using a simple Mincer-style regression of those who are in employment. The model we estimate is specified below:
We estimate log earnings, Y, as a function of years of schooling, S, quadratic years of work experience, W, and a vector of characteristics that include age, gender interacted with whether the person has children and if so is a lone parent or in a couple, the region they live in and housing tenure. For the specifications that include individuals with long-standing health problems, we also include an indicator for this as a control. We estimate this model on a sample of working-age adults who are in work and not in full-time education. Once we have estimated the model, we predict the earnings of those who are not in work (but are also of working age and not in full-time education), were they to enter employment, using propensity mean matching.
Second, we take a random sample of those who are out of work to move into employment, with the sample size selected to meet the employment rate target of 80%. For the specification with no individuals with long-standing health problems moving into employment, the sample is taken from all out-of-work individuals of working age who are not in full-time education and who do not have long-standing health problems. We also do not include the lowest-earning parent of young children (under the age of 1), or lone parents of children under 1.
Finally, we run this modified dataset, containing both the actual reported earnings of those in work and the predicted earnings of the subset of out-of-work individuals we have chosen to move into work, through our tax and benefit microsimulation model, TAXBEN.
References
Bourquin, P., Cribb, J., Waters, T. and Xu, X., 2019. Living standards, poverty and inequality in the UK: 2019. Institute for Fiscal Studies, Report R157, https://ifs.org.uk/publications/living-standards-poverty-and-inequality-uk-2019.
Brewer, M. and O’Dea, C., 2012. Measuring living standards with income and consumption: evidence from the UK. Institute for Fiscal Studies, Working Paper W12/12, https://ifs.org.uk/publications/measuring-living-standards-income-and-consumption-evidence-uk-1.
Codreanu, M. A. and Waters, T., 2023. Do work search requirements work? Evidence from a UK reform targeting single parents. Institute for Fiscal Studies, Working Paper 23/02, https://ifs.org.uk/publications/do-work-search-requirements-work-evidence-uk-reform-targeting-single-parents.
Cribb, J., Farquarson, C., McKendrick, A. and Waters, T., 2023. The policy menu for school lunches: options and trade-offs in expanding free school meals in England. Institute for Fiscal Studies, Report R253, https://ifs.org.uk/publications/policy-menu-school-lunches-options-and-trade-offs-expanding-free-school-meals-england.
Cribb, J., Henry, A., Karjalainen, H., Ray-Chaudhuri, S., Waters, T. and Wernham, T., 2024. Living standards, poverty and inequality in the UK: 2024. Institute for Fiscal Studies, Report R329, https://ifs.org.uk/publications/living-standards-poverty-and-inequality-uk-2024.
Cribb, J., Waters, T., Wernham, T. and Xu, X., 2022. Living standards, poverty and inequality in the UK: 2022. Institute for Fiscal Studies, Report R215, https://ifs.org.uk/publications/living-standards-poverty-and-inequality-uk-2022.
Department for Work and Pensions, 2024. Benefit cap: number of households capped to May 2024. https://www.gov.uk/government/statistics/benefit-cap-number-of-households-capped-to-may-2024/benefit-cap-number-of-households-capped-to-may-2024.
Emmerson, C. and Joyce, R., 2023. What impact did lowering the benefit cap have? Institute for Fiscal Studies, Comment, https://ifs.org.uk/articles/what-impact-did-lowering-benefit-cap-have.
Giupponi, G., Joyce, R., Lindner, A., Waters, T., Wernham, T. and Xu, X., 2024. The employment and distributional impacts of nationwide minimum wage changes. Journal of Labor Economics, 42(S1), S293–333, https://doi.org/10.1086/728471.
Latimer, E. and Waters, T., 2024. The two-child limit: poverty, incentives and cost. Institute for Fiscal Studies, Comment, https://ifs.org.uk/articles/two-child-limit-poverty-incentives-and-cost.
Office for National Statistics, 2024. Private rent and house prices, UK: August 2024. https://www.ons.gov.uk/economy/inflationandpriceindices/bulletins/privaterentandhousepricesuk/august2024.
Ray-Chaudhuri, S., Waters, T. and Wernham, T., 2024. Living standards since the last election. Institute for Fiscal Studies, Report R304, https://ifs.org.uk/publications/living-standards-last-election.
Waters, T. and Wernham, T., 2023. Housing quality and affordability for lower-income households. Institute for Fiscal Studies, Report R260, https://ifs.org.uk/publications/housing-quality-and-affordability-lower-income-households.
Data
Department for Work and Pensions, NatCen Social Research. (2021). Family Resources Survey. [data series]. 4th Release. UK Data Service. SN: 200017, DOI: http://doi.org/10.5255/UKDA-Series-200017.
.
Endnotes
Authors


Tom Wernham
Tom's main research areas are living standards and poverty, the benefits system, and its interactions with the labour market.
More from IFS
Understand this issue


Policy analysis


Academic research


