
Downloads

Download chapter as a PDF
PDF | 1.88 MB
The most significant news for the fiscal outlook since the spring is higher inflation following increased conflict in the Middle East. Central bank interest rates are now expected to be higher for longer, while the outlook for economic activity has weakened. There is substantial uncertainty about the likely trajectory of prices, interest rates, earnings and economic growth. This chapter examines how the changing economic outlook, alongside a range of spending pressures and new ambitions, could affect the outlook for the public finances. It explores the key decisions that the Chancellor will have to make at the Budget.
Key findings
- Following the closure of the Strait of Hormuz, government borrowing costs have risen around the world. Interest rates on a 10-year UK government bond were around 0.5 percentage points higher in September than in March. Higher debt interest spending is now expected to push up borrowing across the parliament. This might reduce the margin by which the government meets its fiscal rules – often termed ‘headroom’ – by about £11 billion in 2029–30. While significant, this change is modest relative to the more-than-doubling of debt interest spending as a share of national income since 2019–20, a £65 billion rise in today’s terms.
- Higher inflation pushes up tax revenues because most taxes are levied on cash quantities. Spending on inflation-indexed debt and benefits also rises. At this forecast, revenues are likely to rise by more than the increase in inflation-linked spending. However, the Office for Budget Responsibility’s judgement of how nominal earnings are likely to grow in coming years will be crucial for determining the forecast for revenues from income taxes and therefore the extent to which the direct effects of higher inflation reduce borrowing.
- The OBR has, in recent years, taken a more pessimistic view of the likely course of nominal earnings than other forecasters. It seems plausible that the OBR will revise up its forecast for nominal earnings in light of recent inflation, but continue to expect lower earnings growth going forward than other forecasters. In an illustrative scenario in which nominal earnings rise more quickly for two years before returning to the OBR’s previously forecast growth rate, and before any changes in policy, borrowing would be slightly higher across the forecast period than expected in March; ‘headroom’ would be around £20 billion after accounting for higher borrowing costs (of around £12 billion) and higher other spending (of around £10 billion), largely offset by higher revenue (of around £19 billion). This would be a small change compared with the £24 billion of headroom implied by the OBR’s March forecast.
- Uncertainty around the forecast for tax revenues – and therefore around the whole forecast – is particularly high. Shifts in the forecast for earnings can, on their own, lead forecast income tax revenues (and therefore headroom) to be £10 billion higher or lower than in our illustrative scenario. How inflation is judged to feed through to other revenues also makes a substantial difference, as do judgements about employment, migration, disability benefits and other factors. But it is worth remembering that the borrowing rule targets the difference between two very large numbers: in March, forecast revenue was around £1,490 billion in 2029–30 and forecast day-to-day spending around £1,470 billion. In that context, a difference in headroom estimates of, say, £5 billion is small.
- Changes in headroom should not distract from challenges elsewhere. Higher inflation reduces the spending power of government departments’ cash budgets. Maintaining the real-terms generosity of day-to-day spending plans at its March level could require a £12 billion top-up in 2029–30, with £3 billion more needed to maintain the generosity of capital spending plans. Departments are already seeing budgets squeezed by more generous pay settlements and need to make ambitious productivity improvements to meet service delivery plans. It is spending pressures, including the ambition to increase defence spending and the cuts that might need to be made at next year’s Spending Review, rather than the borrowing forecast, that will present the main challenge at the Budget.
- Government investment is currently at its highest sustained level in 50 years. Raising investment further – as the government has indicated it would like to do – could deliver economic returns and support other government priorities. Investments in financial assets – such as those made by the National Wealth Fund – could be made without raising public sector net financial liabilities and therefore would not be constrained by the fiscal rules. But this would not make them costless: funding any investment through increasing debt would raise the cost of debt servicing. Investment decisions should be made based on whether the benefits outweigh the costs, and never based purely on how they are treated by a particular fiscal rule.
- The point of having significant headroom is to ensure that the public finances can withstand small, run-of-the-mill changes in forecasts without the government needing to immediately change policy for fear of breaking its fiscal rules. The Chancellor could choose to accommodate a small forecast downgrade through lower headroom; maintaining £24 billion of headroom should not be seen as a target. But lower headroom reduces the scope to absorb future shocks and forecast changes. The Chancellor should not use up existing headroom to fund new policy commitments.
- If the Chancellor wants to top up departmental budgets in the face of pressures, to fund new spending priorities or to cut borrowing (e.g. to restore headroom), he will need to consider raising taxes or cutting benefit spending. The options here are as familiar as they are difficult. All come with trade-offs. Rachel Reeves’s two Budgets have already made this the biggest tax-raising parliament on record. Further tax rises should be expected to drag on growth but, importantly, some tax rises would do more damage than others – the design of any tax-raising measures would be key.
- The broader fiscal context should be front of mind as the Chancellor makes his choices. Debt is high – it exceeds 90% of national income, has roughly tripled since the financial crisis and is still rising. The debt interest bill is high – it has more than doubled as a share of national income since 2019–20 and is now £1 in every £13 of government spending. Even if borrowing is cut substantially and tax revenues made to balance with day-to-day spending by 2029–30, debt will remain high and expensive. Future governments will need to manage this while also tackling the challenges of an ageing population, cost and demand pressures in healthcare, and any net-zero transition, alongside any future shocks.
- Recent governments have a poor track record of cutting borrowing. Since the OBR’s establishment in 2010, Chancellors have, on average, aimed to borrow 1.1% of GDP in the fifth year of the forecast. When that year arrived, however, the average out-turn for borrowing has been 4.8% of GDP (or 3.8% if excluding the first year of the pandemic). What will ultimately matter for the public finances is not whether John Healey meets the fiscal rules by pencilling in a fall in borrowing, but whether he actually goes on to deliver it.
2.1 Introduction
The new Prime Minister and Chancellor, Andy Burnham and John Healey, have come to office at a time when the economic outlook has worsened. War in the Middle East and the closure of the Strait of Hormuz have driven up inflation, leading central banks to keep interest rates higher for longer and weakening the outlook for growth.
This will undoubtedly make the Chancellor’s job more challenging. Government borrowing costs are substantially higher than they were expected to be in the OBR’s March forecast and will increase borrowing to the tune of £11 billion in 2029–30. But inflation will also increase the nominal size of the economy and therefore push up tax revenues. It is likely that revenues will rise by more than inflation-linked spending. In that event, the direct effects of inflation on the government’s inherited borrowing plans would be relatively muted. However, the path of revenues is highly uncertain: it will depend on exactly how the energy price shock feeds through to earnings, consumption and profits. Either way, inflation also has another effect: it erodes the value of budgets for government departments.
A new squeeze from higher inflation will come at a difficult time for government departments. As we detail in Chapter 6, a range of other pressures are already putting pressure on budgets and making it harder to deliver the planned quality and quantity of public services. This is also a government with new spending priorities, ranging from policies to help people with the cost of living which have so far been temporary and relatively small, through to large expansions in some parts of the state, particularly defence. Next year’s Spending Review has long looked difficult, and will be a key focus for the Chancellor in 2027.
John Healey has already said that he will navigate these challenges while sticking to the two fiscal rules set out by his predecessor, Rachel Reeves.1 These require the current budget – the difference between revenue and day-to-day spending – to be forecast to be at least in balance in the third year of the forecast, which is currently 2029–30. Public sector net financial liabilities (PSNFL) – a measure of debt – is required to be falling as a share of national income in the third year of the forecast.
The Chancellor is unlikely to need to change policy simply to stay within the fiscal rules. We expect the OBR’s ‘pre-measures’ forecast – before taking account of any new policy decisions since March – to show the fiscal rules still being met with a buffer. But that does not imply that the Budget will be easy.
John Healey will need to make big decisions at this Budget about how to address the spending challenges. The Chancellor does not have to increase public spending. He could choose to live within the plans he inherited and accept a lower quality and/or quantity of public services than previously planned. He could pare back his ambition for defence spending or cut other departments’ budgets to make room for it. He could even cut planned overall public spending, which is what Rachel Reeves did at the last Budget.
However, it should be noted that living within current spending plans would almost certainly imply large cuts to some departments, especially if defence spending is to be raised to 3% of GDP. The Chancellor does not need to decide how much to allocate to each department in the final years of the parliament – that decision can be left to next year’s Spending Review. But he must lay out a set of plans for overall government spending across the rest of the parliament that he would be willing to live within. If he already knows that he would not be willing to negotiate the next Spending Review without a higher spending ‘envelope’, it is crucial that he sets out – and funds – higher overall spending at this Budget. If the Budget contains public service spending plans that the government would not be willing to live within, the public finances outlook will be flattered and the consolidation needed to meet the fiscal rules will not be credible.
Recent years have demonstrated that fiscal forecasts can very quickly be changed by events in the world. The Chancellor should look not just at the central forecasts that he is handed by the OBR but at the uncertainty and risks around them. The risks are not all to the downside. As we illustrate below, investment in AI could improve productivity and, with it, the outlook for the public finances. But when making plans, the Chancellor should remember that things can get worse as well as better. He should also not lose sight of the broader fiscal picture. Under current plans, government debt is likely to stay at historically high levels over the rest of the parliament, while UK borrowing costs remain higher than those of other G7 governments.
The rest of this chapter is organised as follows. Section 2.2 summarises the most important fiscal changes since the COVID-19 pandemic and how Rachel Reeves’s decisions have shaped the new government’s inheritance. Section 2.3 discusses the key economic developments since March and how they impact the fiscal outlook. Section 2.4 outlines some of the policy pressures facing the government, while Section 2.5 discusses some of its emerging policy ambitions. Section 2.6 concludes with a broad view of the choices facing the Chancellor at the Budget.
2.2 The state of the public finances
We start by stepping back and describing the big shifts in the fiscal landscape since the COVID-19 pandemic. We then discuss the choices of the Labour government so far, before providing a broad overview of the fiscal outlook as it stood the last time the Office for Budget Responsibility (OBR) presented a forecast, in March of this year.
Three changes following the pandemic
Since the onset of the COVID-19 pandemic, the size of the state, government debt and the cost of servicing that debt have all grown significantly. This is a difficult backdrop for a Chancellor intending to bring debt down.
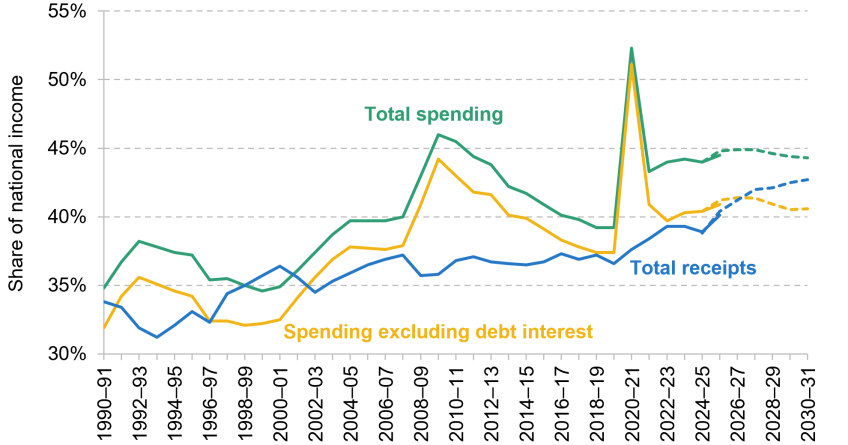
Figure 2.1 illustrates the shift towards a larger state, showing how spending and receipts have changed over time, and their expected trajectory based on the OBR’s March forecast (discussed in the next section). Total public spending was 44% of national income in 2025–26, around 5 percentage points higher than just before the pandemic. This is 4 percentage points higher than under the New Labour government on the eve of the financial crisis. The last time public spending was sustained at this level was during the Second World War. Part of this represents increases in debt interest costs, which we discuss in more detail below. But public spending excluding debt interest has also grown significantly, and is now over 3 percentage points higher than pre-pandemic levels.
Figure 2.1. Total spending, non-debt-interest spending and total receipts: out-turn and March 2026 forecast
Note: Non-debt-interest spending is total managed expenditure (ONS code KX5Q) minus central government debt interest spending (ONS series NMFX) net of transfers to and from the Asset Purchase Facility (ONS series MU74). Figures from 2026–27 onwards represent the OBR’s March 2026 forecast.
Source: Office for Budget Responsibility’s Public finances databank September 2026.
Receipts have been on a steady upward trend since the pandemic. The last time revenues were this high on a sustained basis was during the Attlee government in the early 1950s. But their growth has not been enough to match the increase in spending. This leaves borrowing – the gap between spending and receipts – higher as a share of national income than pre-pandemic.
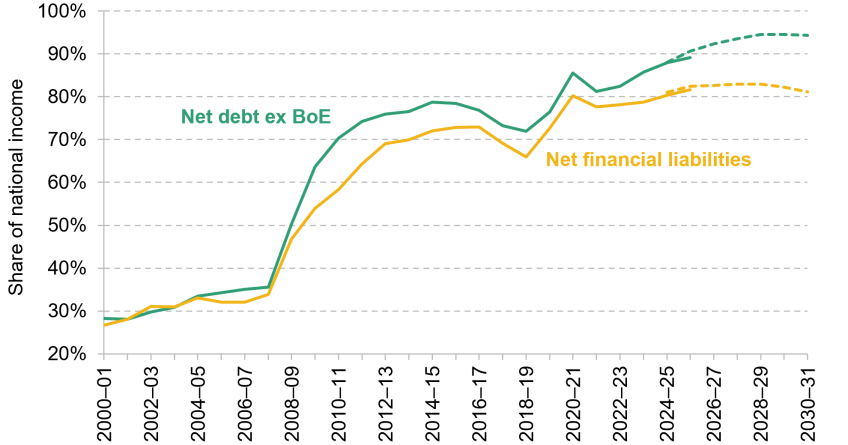
Spending and borrowing rose sharply during the Global Financial Crisis and the pandemic, leading to higher levels of debt, which successive governments have not managed to decisively reduce. This is true for whichever measure of debt is used; Figure 2.2 shows two common measures. The green line shows public sector net debt – the value of government debt after the value of liquid financial assets, such as foreign exchange reserves, is netted off. The yellow line shows public sector net financial liabilities. This is the measure of debt used in the fiscal rules, and includes a wider range of financial assets and liabilities than the net debt measure. Each measure was growing gradually before 2008, jumped up sharply between 2008 and 2010, increased steadily over most of the 2010s and then jumped up again during the COVID pandemic. Since the pandemic, debt has increased further, though by different amounts depending on the measure. Whichever measure we consider, debt is now at the highest level for half a century.
Figure 2.2. Public sector net debt excluding the Bank of England and net financial liabilities: out-turn and March 2026 forecast
Note: Figures from 2026–27 onwards represent the OBR’s March 2026 forecast.
Source: Office for Budget Responsibility’s Public finances databank September 2026.
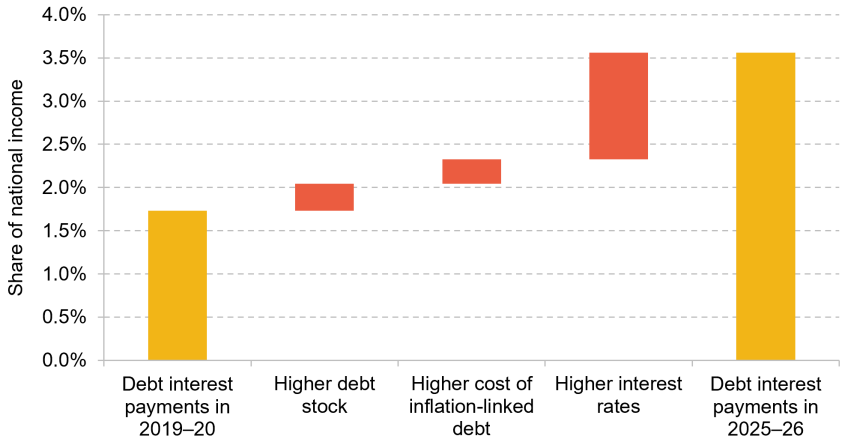
The third shift in the fiscal landscape is much higher debt servicing costs. Debt interest spending has more than doubled as a share of national income since 2019–20, from 1.7% on the eve of the pandemic to 3.6% of GDP in 2025–26, its highest level since 1988.2 Money spent on debt interest is unavailable for other government priorities such as hospitals, schools, tax cuts or, indeed, reducing the deficit. This is one of the reasons why, despite a much larger state than pre-pandemic, spending choices are tightly constrained.
Figure 2.3 breaks down the 1.8% of national income (£70 billion) increase in debt interest spending between 2019–20 and 2025–26 into three different components. The increase in the stock of debt mechanically pushes up debt servicing costs, which explains 0.3 percentage points of the increase. Around a quarter of the UK’s stock of debt is inflation-linked, which means interest payments change in line with inflation measured by the Retail Prices Index. Higher inflation has therefore contributed another 0.3 percentage points to the increase. But the main factor driving the increase is that the government is paying a much higher interest rate on newly issued non-inflation-linked debt. This has pushed up debt interest payments by 1.2% of GDP – £38 billion in 2025–26, or around two-thirds of the total increase in debt interest costs. A substantial share of government debt was issued before the recent increases in government borrowing costs, and so is still at lower interest rates. But as time passes, that debt will mature and be replaced by new debt at higher rates. Given this, without a substantial downward shift in interest rates, debt interest spending is likely to remain high, or even rise further, for the foreseeable future.
Figure 2.3. Change in debt interest payments as a share of national income between 2019–20 and 2025–26
Note: Decomposition splits the interaction between interest rates and the debt stock equally (the Bennet decomposition). ‘Interest rates’ are effective interest rates, calculated by dividing debt interest payments by outstanding debt. Debt interest is defined as central government debt interest spending (ONS series NMFX), net of transfers to and from the Asset Purchase Facility (APF, ONS series MU74), which reflect transfers of surpluses and losses of the quantitative easing programme between the Treasury and the Bank of England. ‘Debt’ is public sector net debt excluding the Bank of England (ONS series CPPH). See Chapter 4 of this Green Budget for a detailed discussion of the effect of the APF on the public finances.
Source: Authors’ calculations based on Office for National Statistics, Public sector finances borrowing by sub-sector: Appendix R, July 2026.
What has Labour done so far?
In 2024, Jeremy Hunt pencilled in plans for spending to fall substantially as a share of national income across the following five years, combined with a small tax rise. As we argued at the time, these spending plans looked challenging to deliver: once specific commitments for the NHS and schools were accounted for, other departments would have faced very steep cuts over time (Emmerson, Johnson and Zaranko, 2024). Under these plans, borrowing was set to fall from over 4% of national income in 2023–24 to 1.2% over the following five years, bringing the current budget into a small surplus.
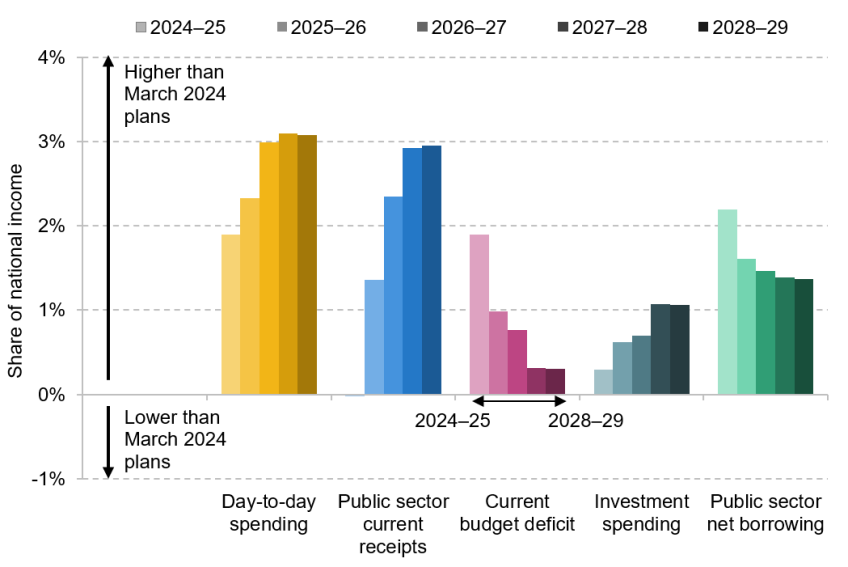
Rachel Reeves set out her own plans to bring borrowing down, but they took a very different shape from her predecessor’s. Three key differences between Jeremy Hunt’s plans and those of Rachel Reeves can be seen in Figure 2.4.
Figure 2.4. Increase in spending, receipts and borrowing in out-turns and March 2026 forecast compared with Conservative government’s plans as of March 2024
Note: Differences between the March 2024 OBR forecast and the latest out-turn or forecast available. Investment spending measured as public sector net investment. Restated GDP is used for March 2024 values, based on out-turn GDP growth rates instead of forecast GDP growth rates in March 2024, to account for revisions to 2024–25 GDP.
Source: Office for Budget Responsibility’s Economic and fiscal outlook March 2024 and Public finance databank July 2026.
First, Rachel Reeves chose to substantially increase day-to-day spending (the yellow bars) – by the end of the parliament, it is due to be 3% of national income (£104 billion) higher than in the plans she inherited. The spending plans were front-loaded; growth was fastest in the first two years of the parliament.
Second, Rachel Reeves chose to fund the higher spending with additional borrowing in the short run and higher taxes in later years. This has meant that borrowing is higher in every year of the forecast and the consolidation – the reduction in the current budget deficit (the pink bars) – has been more back-loaded.
Finally, Rachel Reeves chose to keep public investment spending as a share of national income roughly flat at around 2.6% over the parliament (the grey bars), rather than let it fall, as Jeremy Hunt had planned. This is a level not sustained since the 1970s. Higher investment was paid for by higher borrowing (green bars) – even by 2028–29, when the gap between current plans and previous Conservative plans for the current budget deficit is narrowing, overall borrowing is set to be 1.4% of national income (£46 billion) higher. Debt is forecast to be higher as a result of these choices.
The increase in borrowing was made easier by a change Rachel Reeves made to the debt rule. She chose to use public sector net financial liabilities (PSNFL) as the measure of debt that the government aims to get on a falling path as a share of national income. PSNFL captures a wider range of financial assets and liabilities than public sector net debt (excluding the Bank of England), the measure targeted by the previous government’s debt rule. In recent years, PSNFL has risen more slowly, and this is expected to continue – as shown in Figure 2.2 – making it easier for the government to meet its falling debt rule while still borrowing more overall.3 This has made a meaningful difference, given the government would have been closest to breaking the debt rule – and in some cases would have broken it, on the plans it announced – at every forecast since Rachel Reeves took office, had she not changed the measure of debt. She also chose to target the current budget deficit with the borrowing rule rather than the overall deficit. This means that investment spending decisions are not directly constrained by this rule at all, only by the debt rule.4
Despite this higher borrowing compared with the 2024 Conservative government plans, Rachel Reeves’s plans still imply a significant fall in borrowing over the course of the parliament. In the OBR’s March forecast, borrowing is set to fall from 4.3% of national income in 2025–26 to 3.6% in 2026–27, around a quarter of the fiscal consolidation of 2.6% of national income planned over the course of this parliament. We discuss the preliminary fiscal out-turn data for 2026–27 available so far in Box 2.1.
Box 2.1. Public sector finance data so far this year
The Office for National Statistics (ONS) publishes monthly data on the public finances, covering revenues, expenditure and borrowing, which can be compared with the OBR’s monthly projections. Initial data out-turns are prone to significant later revisions. Part of the data for the most recent months is based on assumptions and forecasts, which are only gradually replaced with out-turns. All of this means that it would be unwise to over-interpret the data released in the first five months of the financial year.
That said, the OBR forecast in March that public sector net borrowing in the first five months of 2026–27 would be £69 billion. Provisional out-turns for the first five months of 2026–27 show that it has been £77 billion – £8 billion higher than forecast. The difference comprises:
- higher spending on debt interest by around £2 billion;
- higher spending by central government on other areas by around £5 billion; and
- higher tax receipts by around £1 billion.
The provisional out-turn also shows a £2 billion smaller-than-expected surplus run by public corporations, although the data on these are described by the ONS as ‘highly provisional’ and therefore even more susceptible to future revisions. Even though inflation has exceeded the forecast, cash revenues from VAT so far have been very close to forecast. These effects may unwind as the year goes on, but we discuss the possibility of higher-than-expected inflation not being associated with higher-than-expected revenues going forward in Section 2.3. Net benefit spending in the five months to August was running 1.8% above the March forecast. This effect, too, may not persist throughout the full year, much less over the forecast horizon, but we discuss the risk that it might in the same section.
In addition to her tax and spending plans, Rachel Reeves also leaves some welcome improvements to the fiscal policymaking process for John Healey. The horizon of the fiscal rules was shortened from five years to three, and aligned with the length of a Spending Review period. One effect of this is to place greater limits on borrowing: borrowing tends to be lower in the fifth year of the OBR’s forecast than the third. Another effect is to increase the credibility of the government’s plans. With a shorter horizon, it is more likely that a government – or Chancellor – will still be in place when in the horizon year, and so harder to make plans that they do not intend to stick to. And by aligning with the horizon of Spending Reviews, it is harder for a government to pencil in plans for spending cuts to boost its performance against the fiscal rules without specifying where they will come from.
Another change is increased ‘headroom’ against the current budget rule,5 which was £24 billion, or 0.7% of national income, in the March 2026 OBR forecast. This is higher than had been the case throughout Jeremy Hunt’s chancellorship and in Rachel Reeves’s first two forecasts. Operating with very small levels of headroom left them overly beholden to small, run-of-the-mill movements in the OBR’s forecast and thus generated an overly volatile policy environment (Emmerson, Miller and Zaranko, 2025). Nevertheless, the present level of headroom is still low by the standards of the 2010s. Similarly, whilst previous governments have often made commitments to limit themselves to one fiscal event a year, Ms Reeves is one of the few who actually honoured it, with the March 2026 Spring Forecast a genuine non-event. John Healey would do well to continue the practice.
A broader view of medium-term fiscal sustainability
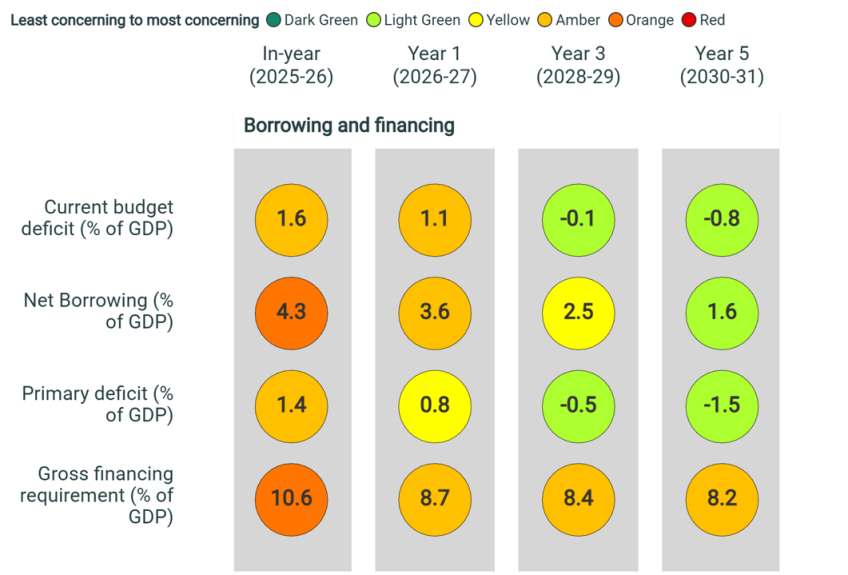
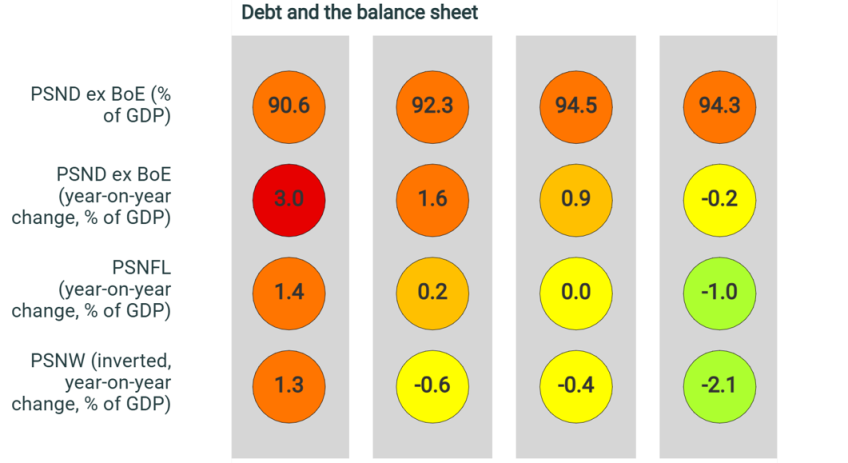
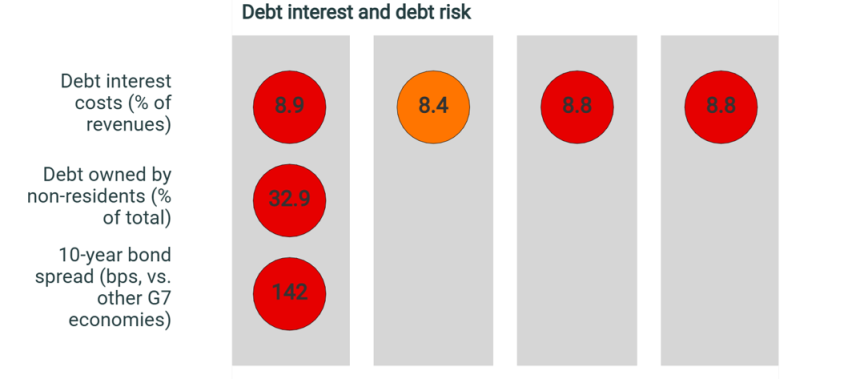
So far, we have focused on plans for debt and borrowing. This subsection summarises the broader state of the public finances, as measured at the time of the OBR’s March 2026 forecast, using ‘fiscal traffic lights’ (Figure 2.5). The figure sets out forecasts of a range of fiscal indicators in 2025–26 and into the medium term, building on Zaranko (2026). The colours reflect our judgements on when the value of a particular indicator is more or less concerning; dark green indicates the least concerning position while red indicates the most concerning position.6 No single indicator can fully encompass all aspects of fiscal sustainability; looking across a range of indicators paints a fuller picture.
Figure 2.5. Fiscal traffic lights for the March 2026 OBR forecast
Note: A forthcoming appendix to this chapter sets out the methodology in detail, particularly the colour thresholds.
Source: Office for Budget Responsibility’s Economic and fiscal outlook March 2026; Debt Management Office; Federal Reserve Economic Data.
We start from a concerning place. In 2025–26 – the financial year in which this forecast was made – all measures of borrowing were high; debt was high as a share of GDP and rising in all measures. The amount spent on debt interest, the share of debt owned by non-UK residents (an indicator of the government’s exposure to sudden changes in global market conditions) and the UK’s higher debt interest costs relative to other G7 countries (indicated by the ‘10-year bond spread’7 row) all looked very concerning.
The overall picture was expected to improve in coming years. As discussed above, Rachel Reeves had set out a plan to reduce borrowing in every year going forward and deliver a current budget surplus by 2028–29. If achieved, this would have put borrowing in a more sustainable position and started to get all measures of debt falling slightly as a share of national income – hence the move towards green on those measures.
However, this plan follows a common pattern: since the OBR was created, successive forecasts have shown a relatively concerning picture in the short run that improved by the end of the forecast. But it is easier for Chancellors to make plans to improve the state of the public finances over the coming five years than to actually deliver them.8 In every single one of the 33 forecasts the OBR has produced, debt was projected to fall by the end of the five-year forecast; instead, it has risen by an average of 15% of national income over that same period. In part, this reflects adverse shocks that have hit the UK, but planned fiscal consolidations have also been abandoned or pushed back. If the government does not deliver the fall in borrowing in its current plans, the borrowing picture will remain concerning. We discuss some of the challenges that could make delivering the planned consolidation politically difficult in Sections 2.4 and 2.5.
But even if these, or an alternative set of, plans were used to deliver a fall in borrowing, the overall stock of debt is slow-moving and would remain concerningly high. It is important that the government has a credible plan to stop the rise in debt. Clearly, a future crisis (whatever its particular nature and exact timing) may require a sharp, temporary increase in borrowing before too long. Given this, there is a strong case that debt should be stabilised and brought down gently outside these moments of crisis. This could also help ease borrowing costs relative to peer economies, which have become of one of the main areas of concern, as has the high ongoing cost of servicing debt.
2.3 Changes to the fiscal outlook since March
The main development since March has been increased conflict in the Middle East. This has driven up inflation around the world, which in turn has fed through to higher central bank interest rates – in expectation and in practice.
One resulting impact on the public finances has been well publicised: the cost of government borrowing has risen sharply, and this will reduce the amount of ‘headroom’ the Chancellor has against his fiscal rules in 2029–30. Another likely change in the state of the public finances has received relatively little attention: higher inflation can be expected to increase tax receipts. Any extra revenue from inflation is likely to be larger than the automatic increase in public spending, because of the way spending on public services is controlled. This, all else equal, means higher inflation will increase headroom.
In this section, we discuss how changes to a range of economic factors will likely feed through to the fiscal outlook facing the Chancellor at the Budget. Our analysis draws heavily on the Barclays ‘baseline forecast’ for the UK economy, discussed in Chapter 1 of this year’s Green Budget, but also considers other forecasters’ views, including those of the Bank of England. A theme throughout is that the level of uncertainty is high. At this moment, it is not possible to know how long the Strait of Hormuz will be closed or exactly how the supply shock will feed through to prices, economic activity or wages. Independent forecasters take a range of views on how various factors are likely to play out. How they actually play out will matter enormously for the health of the public finances over the coming years.
The level of uncertainty is high, but the Office for Budget Responsibility (OBR) will have to make specific judgements about how it expects the energy price shock to feed through to the wider economy and, in turn, how those effects will change tax revenues and benefit spending. A particularly important judgement will be how the OBR expects nominal – that is, in cash terms and not adjusted for inflation – earnings to grow in coming years, since this is key for forecasting receipts from income taxes. We discuss how different factors and assumptions will likely affect the OBR’s ‘pre-measures’ fiscal forecast – including the performance against the fiscal rules – that John Healey faces when making policy decisions at the Budget.
Given the level of uncertainty, the Chancellor would be well advised to not over-focus on the particular ‘headroom’ number the OBR delivers. The broader picture of the public finances is key; we discuss that broader picture at the end of this section. We also set out that there are both downside and upside risks to the public finances going forward, illustrating this with the economic scenarios produced by Barclays and discussed in Chapter 1.
Key determinants of the fiscal outlook
Interest rates on government debt
Government borrowing costs have risen sharply since the spring, not just in the UK but in many countries. In large part, this has been driven by war in the Middle East, which pushed up global energy prices and increased expectations for inflation. Markets now expect central banks across the world – including the Bank of England – to raise interest rates to try to control inflation. Expectations of higher central bank interest rates tend to increase interest rates (or yields) on government debt.
Government bond yields have also been pushed up by longer-term developments: governments are issuing large quantities of debt, while demand from some traditional buyers of long-term government bonds has weakened. Investors require higher interest rates to buy this debt (Chapter 3 of this Green Budget discusses this in more detail). Higher yields push up government spending on debt interest: a sustained, 1 percentage point increase across short- and longer-term borrowing costs might be expected to increase debt interest spending in 2029–30 by £14 billion.9
To construct its forecast, the OBR uses market expectations for both Bank Rate (set by the Bank of England and relevant for overnight or very short-term borrowing) and long-term government interest rates. Both have risen since March. Market expectations are for the Bank of England to increase Bank Rate above 4.75% – a more than 1 percentage point increase – by 2028.10 Figure 2.6 shows that the interest rates that the government faced for new 10-year debt in September were around 0.8 percentage points higher than before the Iran war. Market participants in the week commencing 14 September – roughly the time when the OBR is likely to measure expectations – expected higher interest rates on government debt to persist for the next five years.
Figure 2.6. Interest rates on 10-year government debt
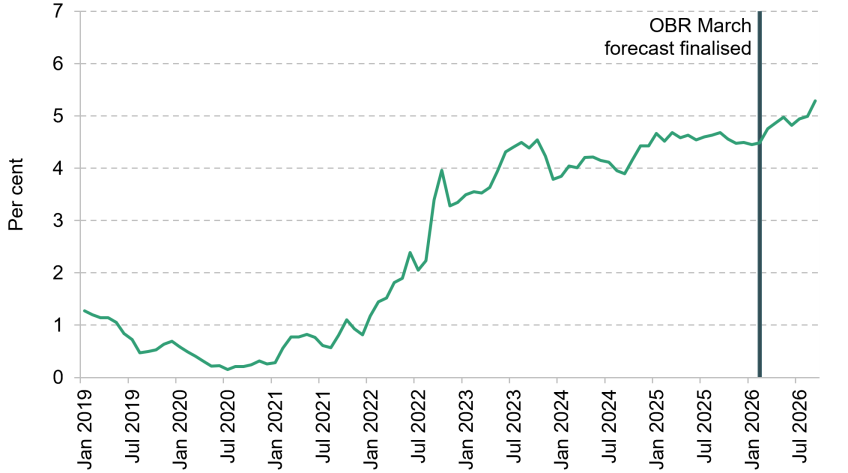
Note: The figure shows monthly average interest rate, on a government bond (an agreement by the government to pay back borrowed money) that needs to be repaid (potentially being replaced by another bond) after 10 years.
Source: Debt Management Office, Historical average daily conventional gilt yields.
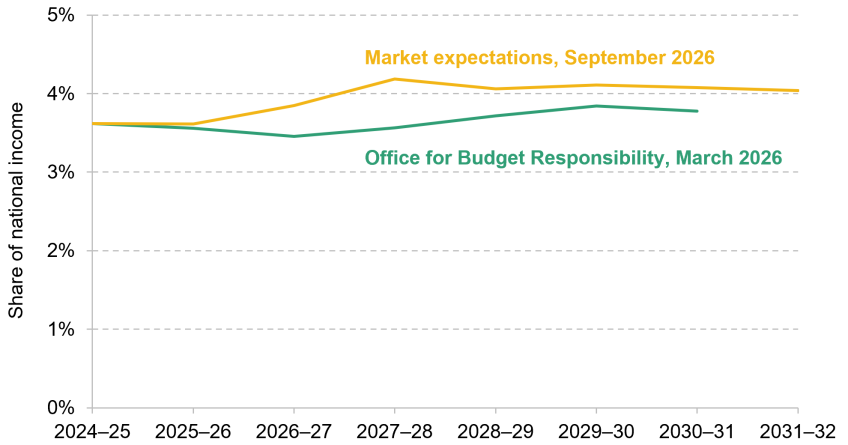
Combined, these increases in interest rates would be expected to add around £8 billion to debt interest costs by the end of the forecast period (see Figure 2.7). In addition, because around a quarter of the UK’s debt is index-linked, the cost of servicing the stock of debt rises automatically with inflation. Higher inflation therefore mechanically pushes up debt interest spending in addition to the rise in interest rates. In the Barclays scenario, this effect would add a further £2 billion to debt interest spending in 2029–30. Effects of the Bank of England’s decision in September to slow the rate of quantitative tightening are expected to add around £1 billion more.
Figure 2.7. Debt interest spending: different forecasts
Note: Based on market expectations for Bank Rate and 20-year gilt rate.
Source: Market expectations from Bank of England and Barclays; debt interest spending estimates based on authors’ calculations.
The OBR has a set process for incorporating interest rate expectations into its forecast. This means that there is essentially no uncertainty about the impact of higher interest rates on the forecast the OBR will present at the Budget. However, there is, of course, a lot of uncertainty about the actual path for interest rates going forward. One way to illustrate this is to consider past changes to interest rates. The increase that the OBR will score at this forecast – around £11 billion – is substantial and we would expect it to materially impact on the Chancellor’s choices at the Budget. But it is modest compared with the overall change in debt interest costs we have seen since the pandemic. In November 2020, the OBR forecast debt interest spending in 2025–26 to be just £29 billion; out-turn spending was £109 billion, mostly due to higher-than-expected interest rates.
Inflation and its effects on the public finances
Since March, UK imports have become more expensive relative to exports. This largely reflects higher prices for imported goods, especially oil and gas. This has pushed up consumer prices, although the speed of adjustment varies by product. For example, petrol and diesel prices adjust quickly, while household gas and electricity prices are capped every quarter and so adjust around three months in arrears.
In March, the OBR expected consumer price inflation to fall rapidly over the first half of 2026, then remain around the Bank of England’s 2% target. Instead, inflation in August – the most recent available data at the time of writing – stood at just over 3%. Barclays now expect that inflation will peak at 3.4% at the start of 2027 and will not return close to the 2% target until early 2028, almost two years later than the OBR had forecast in March. Both the Bank of England and most other forecasters polled by HM Treasury are in agreement that inflation is going to remain higher than the OBR’s March forecast this year and, to a lesser extent, next year.11
Inflation increases both government spending and revenues. Over the forecast period, we expect the increase in revenues will be bigger than the automatic increase in the parts of spending that are mechanically linked to inflation, and so the overall effect will be to reduce borrowing.
In addition to its direct effect on debt interest for inflation-linked debt, inflation automatically pushes up spending on many benefits such as universal credit and disability benefits, which are uprated annually in line with inflation.12 Using the Barclays inflation forecast, spending on benefits would increase by £6 billion a year from 2028–29 onwards because of higher inflation.
Higher prices also put pressure on public service spending – inflation erodes the spending power of departments’ budgets. Because departmental budgets are set in cash terms, there is no automatic mechanism to compensate departments for higher-than-expected inflation. Instead, the government faces a choice as to whether to top up departmental spending or allow the real-terms generosity of spending allocations to decline (see Chapter 6 for an in-depth discussion).
On the revenue side, taxes are typically levied on cash quantities such as wages, prices and profits. This means that when inflation pushes up cash values, revenues increase, even if underlying economic activity is no stronger, or even weaker, than before. The Barclays forecast assumes that economic activity will grow more slowly as a result of the higher prices and reduced supply of oil and gas through the Strait of Hormuz. In that scenario, cumulative growth from 2025–26 to 2031–32 in real GDP is 0.5 percentage points lower than under the OBR’s March forecast. But in cash terms, the economy will be grow cumulatively by 2 percentage points more over the same period, due to higher inflation more than offsetting the slower growth in economic activity. This will push up revenues from a range of taxes. Below we provide estimates of how overall tax revenue could change. Here we discuss the uncertainties around what higher inflation could mean for VAT and corporation tax and how it may feed through into labour income taxes.
Taking the Barclays forecast, we might expect higher prices and profits to push up revenues from VAT and corporation taxes by some £5 billion in 2029–30. However, the effects are uncertain and depend not only on how high inflation turns out to be and how long-lasting it is, but also on how ‘tax-rich’ it is.
Starting with VAT, an important uncertainty comes from the fact that higher-than-expected inflation driven by energy prices might shift spending towards goods and services taxed at lower rates of VAT, reducing the increase in revenues. Energy is a necessity, and so people may not reduce their energy consumption by very much even if it becomes more expensive. Higher energy prices could therefore leave households with less cash to spend on other, less essential goods and services. Energy is taxed at a lower rate of VAT – 5%, reduced to zero for the second half of 2026–27, rather than the standard 20% – which could mean that consumer spending as a whole becomes less tax-rich, and does not translate into as much revenue as a broader increase in prices would. A similar argument could be made about spending on food, which is mostly zero-rated; food prices have not increased significantly in recent months, but could do so in response to higher transport costs. Chapter 1 also highlights potential risks to food prices from weather and climate conditions.
A shift in spending towards goods taxed at lower rates might temper the increase in VAT revenues, but by how much is uncertain. As we discussed in Box 2.1, it is too early in the year to gauge information about revenues for the whole of 2026–27 from recent out-turn data on government revenues. And because the most acute pressure on household budgets will be felt in winter, when energy needs are highest, it will be some time until we have a full picture of how expenditure is translating into VAT revenues in out-turn. There is also some uncertainty as to how the OBR might incorporate some of these effects into its forecast. If the OBR judges that they are significant, it might include a lower standard-rated share of consumption expenditure in its forecast, which might mean a more muted boost to revenues.
We also expect corporation tax revenues to increase with higher inflation as businesses make higher profits in cash terms. But energy is an input into nearly all production processes, meaning that profits do not rise as much as in the case of more generalised inflation. And how much profits rise is also related to how inflation feeds through into earnings, which we discuss in detail next. The more earnings rise, the more will be raised from income tax and National Insurance contributions but the lower will be some of the additional revenues from corporation tax as inflation feeds through to earnings rather than profits.
How will higher prices feed through to earnings?
How earnings will evolve over the next five years is perhaps the most important judgement that the OBR will have to make in its upcoming forecast. Almost half of tax receipts come from the two main taxes on income – income tax and National Insurance contributions – and taxes on income are levied at a higher rate than on most other parts of the economy.
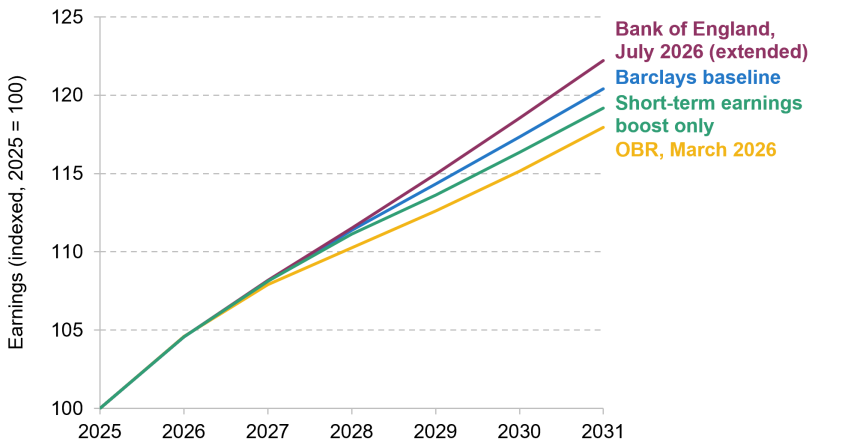
The path of nominal earnings is therefore very important for the fiscal outlook, but is subject to significant uncertainty. Figure 2.8 shows a range of different scenarios for nominal earnings over time. In March, the OBR forecast that nominal earnings would grow by around 3.2% in 2027, and then by just around 2.2% per year for the rest of the decade. This meant that earnings were forecast to be 15% higher in 2030 than in 2025.
Figure 2.8. Nominal earnings forecasts: different scenarios
Note: Bank of England forecast is only published up to 2028, but assumes a constant growth rate of 3.1% in the final two years of its forecast. We assume that this continues until 2031, in line with the Bank’s estimate of target-consistent wage growth (Bank of England’s Monetary policy report February 2026).
Source: Authors’ calculations using economic scenarios from Chapter 1, Office for Budget Responsibility’s Economic and fiscal outlook March 2026 and Bank of England’s Monetary policy report July 2026.
The blue and purple lines show the latest forecasts from Barclays and the Bank of England respectively. In line with most forecasters, both expect that nominal earnings will remain in line with the OBR’s March forecast this year (2026). However, both Barclays and the Bank of England expect higher growth from 2027 onwards. Relative to the OBR’s March forecast, this leaves nominal earnings 1.9% higher in 2030 in the Barclays forecast and 3.0% higher in the Bank of England’s forecast. Such differences can have large impacts on the public finances: we would expect a 1 percentage point higher cumulative earnings growth over this period to increase tax revenues by roughly £8 billion in 2029–30.
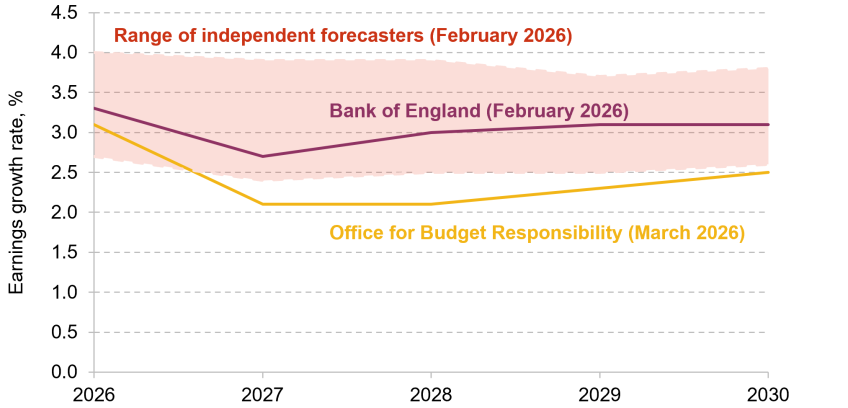
There are two main reasons that forecasters have different paths for nominal earnings. The first is that the OBR has, in recent years, forecast lower wage growth than other forecasters, including the Bank. One key reason for this is that, since 2023, the OBR has taken the view that a falling share of the economy would go towards wages, as firms recoup profits lost during the 2022 inflation spike and, more recently, pass on the cost of higher employer National Insurance contributions. As shown in Figure 2.9, other forecasters took different views of likely nominal earnings growth even before the outbreak of war in Iran.13 In every year but 2026, the OBR’s forecast is below all independent forecasts surveyed by the Treasury, and well below the Bank of England’s, which was in the middle of the range of independent forecasters. The Barclays forecast in Chapter 1 is also towards the pessimistic end, close to the bottom of the range. However, the gap between the Barclays forecast and the OBR’s – which existed before the March forecast – is enough to cause a large part of the divergence in the medium term seen in Figure 2.8.
Figure 2.9. Nominal earnings growth forecasts before the start of the war in Iran
Note: Bank of England forecast is only published up to 2028, but assumes a constant growth rate of 3.1% in the final two years of its forecast. We assume that this continues until 2030, in line with the Bank’s estimate of target-consistent wage growth (Bank of England’s Monetary policy report February 2026).
Source: Authors’ calculations using Office for Budget Responsibility’s Economic and fiscal outlook March 2026, Bank of England’s Monetary policy report February 2026 and HM Treasury’s Independent forecasts February 2026.
The second reason for different paths relates to how the conflict in the Middle East could affect wages, through its impact both on inflation and on economic activity. A key judgement for forecasters is how well workers will be able to bargain for higher wages to compensate for higher prices. All independent forecasters (that were surveyed by the Treasury both before and after the start of the conflict) have increased their nominal wage forecasts since the closure of the Strait of Hormuz – thereby assuming that workers will be able to command at least some degree of compensation for inflation. But the extent to which forecasters have revised their expectations over nominal wages varies a lot – some have increased their forecast for earnings in 2030 by as much as 2%, while the Bank of England has only made a very small change.
The OBR could decide that conflict in the Middle East will have little impact on nominal wages – i.e. that workers will not be able to command higher wages, such that real wages decline. In this case, it may stick with a forecast close to the March 2026 forecast. It could instead decide that nominal wage growth will be substantially higher, and move more in line with the Barclays or Bank of England forecasts – this would imply both that the OBR thinks that nominal wages will grow following the recent rise in inflation and that, more generally, it has become less pessimistic relative to its March forecast. The green line in Figure 2.8 shows an illustrative middle option: the OBR could revise up its forecast nominal earnings growth in the short term (in 2027 and 2028) but leave subsequent growth the same as in its March forecast. In this illustrative scenario, nominal earnings would be 1% higher in 2030 than its March forecast. In our view, it is reasonable to expect that the OBR will forecast a path for earnings that is higher than its March forecast, but lower than the Barclays forecast. This could follow a similar pattern to the ‘short-terms earnings boost only’ scenario, but many other scenarios are possible; there is considerable uncertainty around this judgement. We discuss how these assumptions could feed through into tax revenues, and therefore the ‘headroom’ against the Chancellor’s fiscal rules, in the next section.
So far, we have focused on nominal earnings, as these are what is most important for the public finances. But real earnings – i.e. earnings after accounting for inflation – are more important for household living standards. All forecasters expect real earnings to grow more slowly this year than the OBR did in March. But there are then differences in the expected levels of real earnings in future years, with forecasters having both different expectations about long-run real earnings growth, and different expectations over whether conflict in the Middle East will leave real earnings permanently lower or whether there will be some level of ‘catch-up’ growth in real earnings to compensate for falls this year.
While the OBR’s assumptions over earnings growth will be very important for the Budget, the health of the public finances will ultimately be determined by what actually happens to earnings in the coming years. Alongside the scenarios discussed above, in which nominal earnings might fall below Barclays’ primary forecast, there are other scenarios, which the OBR is less likely to forecast at the Budget, but which could see even higher earnings growth over the medium term.
One such scenario – discussed in Chapter 1 – revolves around an increase in investment in artificial intelligence (AI). Recent preliminary growth out-turns have suggested an uptick in investment in AI-intensive industries in the UK. If this were to continue, and we saw levels of investment similar to those seen in the United States in recent years, we might expect a small increase in nominal earnings relative to the Barclays baseline forecast, of around 0.3% by 2032, driven by the increase in investment increasing overall capital stock and demand in the economy. In an alternative scenario, if this investment fed through to higher economy-wide productivity growth, Barclays forecasts that this could lead to a 1.3% increase in nominal earnings compared with the same baseline by 2032. This shift in earnings would increase receipts by £10 billion, though there would also be other effects on receipts via higher investment and a small fall in employment.
Employment and migration
The outlook for employment can also have a significant impact on the public finances: as a rule of thumb, every additional 100,000 workers would be expected to add around £1.5 billion to revenues from taxes on income per year.
There have been two substantial but countervailing changes to the employment picture since March. The first is that recent data suggest that employment this year is around 180,000 higher than the OBR thought back in March.14 This would add between £2 and £3 billion to this year’s tax revenues. However, employment is likely to fall back towards the OBR’s March forecast in the medium term. The primary reason for this is migration: recent projections from the Office for National Statistics expect net migration in the medium term to be 230,000 per year, substantially lower than previous projections. The OBR pre-empted some of this downward shift in its March forecast, but this still means that net migration is expected to settle at 60,000 fewer people per year compared with the OBR’s March forecast.15 This is likely to slow employment growth over the next several years, and so employment by the end of the forecast may be similar to the level expected by the OBR in March. If this were the case, shifts in employment would have only a very small effect on the overall outlook for the public finances.
However, there remains significant uncertainty over the path of employment. Recent visa data suggest net migration could have fallen by 130,000 this year, while the OBR’s most recent forecast did not expect any fall this year. This could cause the OBR to push its net migration forecast down further, which would in turn lead to lower revenues. More broadly, net migration has been very volatile in recent years, rising by 800,000 in two years at the start of the decade, before falling back down almost as quickly. Against that backdrop, it seems plausible that net migration will not settle at its current level, and instead may continue to move around sharply, with substantial implications for the public finances. For any given level of net migration, the composition of migration flows (e.g. by route, as discussed in Chapter 5) further adds to the uncertainty around the employment forecast.
The trajectory of the unemployment rate is also uncertain. In recent years, the unemployment rate has crept up, and the Barclays forecast now expects it to be higher than previously expected by the OBR, reaching 5.7% by 2027. This pushes down the employment forecast, and also pushes up expectations for benefit spending. This higher unemployment rate is expected to add £3 billion to spending on universal credit by 2029–30 relative to the OBR’s forecast in March. The judgement the OBR makes on the unemployment rate will therefore also have consequences for the overall employment forecast.
Health- and disability-related benefits
Sharply rising caseloads since the pandemic have driven up spending on benefits to support children and working-age adults with disabilities and health conditions.16 Between 2019–20 and 2024–25, spending on these benefits increased from 1.3% of national income to 1.9% of national income – equivalent to an £18 billion rise in today’s terms. The OBR projects spending on these benefits to continue growing but to slow. It expects spending to hit 2.2% of GDP by 2029–30, a further increase equivalent to 0.3% of national income or £9 billion. Rising health-related benefit spending is a pressure on the public finances, but existing forecasts are already baked into current plans.
However, if the OBR increased its forecast of health-related benefit spending further, this would pose an additional pressure on the government’s fiscal position. In-year data on benefit spending is running 1.8% ahead of the OBR’s March forecast (see Box 2.1 earlier). We should be cautious of putting too much weight on these monthly snapshots, which are prone to significant revision as more data become available, but it is possible that this will prove an early indicator of faster spending growth going forward.
The OBR may decide to increase its forecast for health-related benefit spending because of higher-than-expected inflation, which could increase health-related spending through two channels. First, benefits are uprated in line with inflation, so higher inflation mechanically leads to higher spending, which is accounted for in the scenarios discussed above. Second, cuts to real incomes from higher inflation could increase the number of people claiming health-related benefits – and there is some evidence that previous cuts to real incomes have increased health-related benefit claims (Cribb et al., 2025). It is therefore plausible that the OBR could respond to the higher-than-expected inflation by increasing its forecast for the number of health-related benefit claimants. This would place another pressure on the public finances above and beyond the mechanical effect of benefits rising with inflation.
Health-related benefits are also an area where the government may look to make reforms at the budget. We discuss options for reforming disability benefits in Chapter 7.
Where does this leave the Chancellor?
The ‘headroom’ picture
The combination of these economic shifts could have a significant impact on the Chancellor’s ‘headroom’ against his more constraining fiscal rule – running a current budget surplus in 2029–30. In March, the OBR forecast a current budget surplus of £24 billion in 2029–30. As discussed, economic changes since March will feed through to revenues, debt interest spending and spending on benefits. It bears repeating that the exact shape and size of these effects are very uncertain, and any forecast – the OBR’s included – will be a matter of judgement. We now discuss the different judgements that are likely to be most important, using illustrative adjustments to the Barclays baseline. We focus on the impact of different judgements on the ‘pre-measures’– that is, before the impact of new policies – headroom forecast.17
A shift in debt interest costs has taken centre stage of the fiscal debate in recent weeks. As discussed in the previous subsection, we can be fairly certain about the impacts of this on the OBR’s headroom forecast. Specifically, we expect higher interest rates and inflation will push up forecast net debt interest costs by around £11 billion by 2029–30. On its own, this would almost halve the Chancellor’s headroom against the borrowing rule.
The government also looks set to spend around £9 billion more than forecast in March on non-debt-interest spending, mostly benefit spending. This comes mostly from higher CPI inflation, which means higher benefit uprating, but also from a higher unemployment forecast.
However, the impact of inflation on tax revenues – which pushes in the other direction – is more uncertain. We would expect the extra tax revenues from higher inflation to be greater than automatic increases in (non-debt-interest) spending, reducing forecast borrowing overall – but there is a high degree of uncertainty about the extent of that reduction.
The most consequential component of the judgement on inflation will be the path for nominal wages, which is crucial for determining how inflation feeds through into higher income tax and National Insurance revenues.
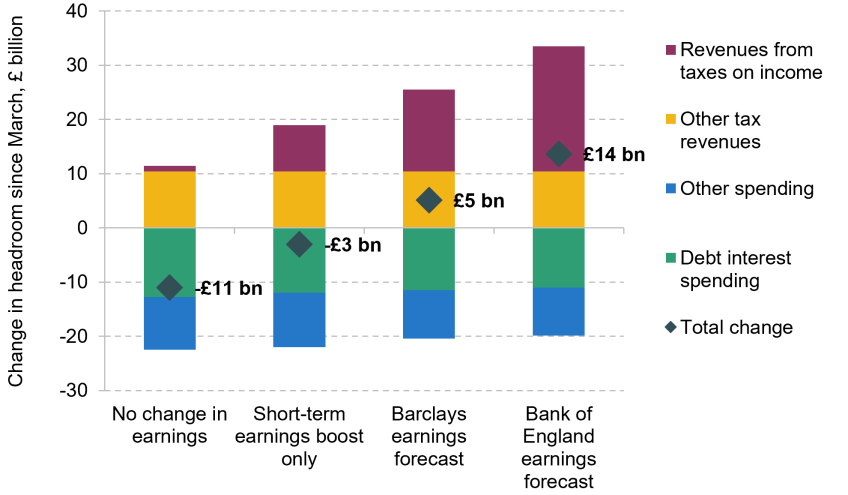
Figure 2.10 shows the change in headroom under four illustrative scenarios, each of which makes a different assumption about the earnings forecast (as discussed above).18 In each case, the overall change since the OBR’s March forecast (the diamond) is broken down into the change coming from higher debt interest spending, higher ‘other spending’ (mostly on benefits) and higher tax revenues.
Figure 2.10. Changes in headroom relative to March OBR forecast: different illustrative scenarios for the OBR earnings forecast
Note: The figure shows changes to the forecast current budget surplus in 2029–30 (‘headroom’ against the borrowing rule) relative to the March 2026 OBR forecast of £24 billion. Debt interest effect and non-income tax revenues effect in all scenarios based on market expectations for Bank Rate and longer-term interest rate expectations in the week commencing 14 September, the Barclays inflation forecast from Chapter 1, and recent Bank of England announcements on quantitative tightening.
Source: Office for Budget Responsibility’s Economic and fiscal outlook March 2026, Barclays earnings forecast from Chapter 1, Bank of England’s Monetary policy report July 2026 and authors’ calculations.
These highlight that changes to the assumed path of nominal earnings make a huge difference to ‘headroom’, with a spectrum of estimates from £13 billion (an £11 billion decrease relative to March) if the OBR assumed that earnings do not rise at all to compensate for higher inflation, to £37 billion (a £14 billion increase) if the OBR were to adopt the Bank’s much more optimistic view of earnings growth.
Whilst very consequential, this is by no means the only source of uncertainty for the OBR forecast. There is also uncertainty over how higher inflation will feed into other tax receipts beyond income tax and National Insurance contributions. In the Barclays forecast, and relative to the March OBR forecast, higher inflation leads to a £25 billion increase in tax revenues (as shown in the yellow and purple bars in Figure 2.10), approximately £10 billion of which comes from an increase in non-labour-income tax revenues. Figure 2.11 decomposes how this additional £10 billion is split across different taxes. As we discussed above, actual revenue effects may turn out smaller (or larger) than these estimates, depending on how the energy price shock feeds through to profits and consumer spending.
Figure 2.11. Illustrative increase in revenues from tax bases other than income in Barclays scenario, 2029–30
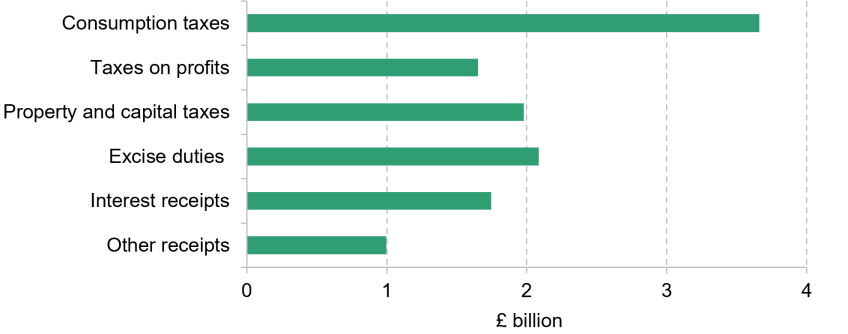
Note: Consumption taxes include VAT, insurance premium tax and customs duties. Taxes on profits include corporation taxes and energy profits levy. Property and capital taxes include capital gains tax, inheritance tax, stamp taxes and business rates. Excise duties include fuel, alcohol, tobacco, betting and gaming, air passenger and vehicle excise duties, and the climate change levy. Other receipts include the licence fee.
Source: Authors’ calculations using Office for Budget Responsibility’s Ready reckoner March 2025.
Other judgements will also affect the fiscal forecast. For example, with housebuilding lagging behind forecasts, the OBR may choose to revisit the impact of planning reform it scored in 2025. However, this would likely only have a very modest effect. The original forecast was that reforms would lead to a 0.2% boost to national income by 2029–30 (box 3.3 of the OBR’s Economic and fiscal outlook March 2025). If this were cut in half, as a pessimistic scenario at the time suggested, we might expect a decrease in forecast revenues of £1–2 billion.
In summary, a set of OBR judgements will be key to determining how much headroom John Healey faces. These include: how nominal earnings will evolve in coming years; whether the revenue increase that results from higher inflation will be more muted than we would usually expect; and whether spending on health-related benefits will be higher than previously forecast. It seems unlikely that the OBR would either make no revisions to its nominal earnings forecast or move it in line with the Barclays forecast. If the OBR took some form of middle path – for example, an increase in nominal earnings in the short run but without an increase in the longer-term path (as shown in the ‘short-term earnings boost only’ scenario above) – the headroom would be around £20 billion. But there is substantial uncertainty, and not just about the path of earnings. To highlight just one of the many examples where the OBR’s judgements could make a significant difference: if the OBR decided not to revise up employment estimates on the basis that there are concerns about the quality of the LFS data, that judgement alone could lower headroom by around £2 billion. More broadly, while we judge that there are good reasons to expect headroom to be higher than £13 billion (which would be the headroom if only the effects of higher debt interest are accounted for), it would be no surprise if the OBR forecast headroom lower than £20 billion. The OBR could also make a set of judgements that would leave headroom higher than it was in March. It is also always worth bearing in mind that, in the context of overall levels of government revenues and spending, a swing of £5 billion one way or the other is a relatively inconsequential change.
If the Chancellor is facing an increase in borrowing (and therefore a fall in headroom against the main fiscal rule) in the pre-measures forecast, he will have to decide whether to pursue a fiscal consolidation to increase headroom and, if so, on what scale.
There are good reasons to not meet the fiscal rules exactly, but to leave some headroom against them. The OBR forecast is necessarily uncertain – adequate headroom can absorb the inevitable fluctuations from one forecast to the next and avoid Chancellors being forced into overly frequent policy changes in response. This should limit damaging policy volatility and free up capacity for higher-quality policymaking with a longer-term view (Zaranko, 2026).
If the Chancellor is faced with a small change in forecast borrowing – and especially if he judges that the forecasts may improve in future – he could choose to absorb the forecast downgrade (i.e. accept lower headroom), rather than responding with a compensating tax rise or spending cut. There is nothing special about £24 billion and no reason to see it as a target for headroom.
However, if the downgrade were large – and especially if the Chancellor judges that the effect is likely to prove persistent – there would be a greater case to rebuild headroom. Allowing headroom to remain at a lower level for an extended period would permanently increase borrowing. Accommodating higher borrowing would mean higher debt and higher spending on servicing it going forward. Operating with low headroom would also raise concerns that plans were less likely to be deliverable, and could lead to damaging policy volatility should a future run-of-the-mill forecast downgrade push the government the wrong side of its fiscal rules.
An important piece of context is that past Chancellors have responded asymmetrically to changes in the forecasts handed to them by the OBR, absorbing the cost of forecast deteriorations but spending the proceeds of forecast improvements (Emmerson et al., 2023). This leads to a ratchet effect on debt over time and means that the forecast is no longer central once typical policy responses are taken into account. Since this effect is well known, a Chancellor looking to strengthen the credibility of their stated plans may wish to demonstrate that they are as willing to raise taxes or cut spending in response to bad fiscal news as they are to do the opposite in response to good news. For all these reasons and more, John Healey may wish to add to his headroom, or rebuild it in case of a downgrade.
If the Chancellor were to find himself with higher headroom than in March (before any policy decisions), he should consider very carefully whether to ‘spend’ the extra headroom, or instead operate with a larger headroom – more in line with levels in the 2010s – and use it to reduce borrowing more quickly.
It is also important to remember that, to the extent that higher revenues are pushing down on borrowing and up on headroom, that effect is coming through inflation which is simultaneously putting pressure on departmental budgets. Were that pressure to be offset through top-ups to departmental budgets, the (post-measures) headroom would go down. Whether the increase in revenues would partially, fully or more than offset spending impacts of inflation depends on exactly how higher inflation feeds through into tax revenues, including the path of earnings.
A view of the broader public finances
Ultimately, the wider outlook for the public finances – across different indicators and across time – and the uncertainty inherent in it are what matter for fiscal sustainability. These, rather than a single, spuriously precise ‘headroom’ number – should be the focus of fiscal debates. We now present a few headline indicators in a range of different scenarios, and examine how they compare with the OBR’s expectations back in March. We continue to focus on economic uncertainties. Of course, the trajectory of borrowing and debt will also crucially depend on policy choices of this and future governments – we will turn to their potential fiscal impacts in Section 2.5.
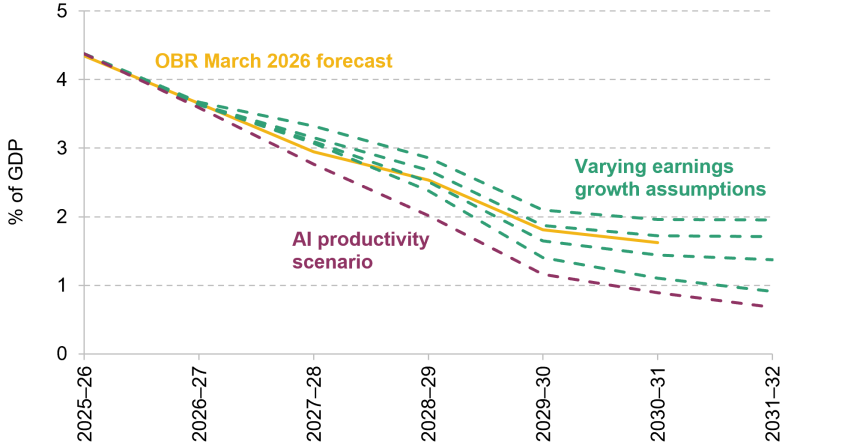
Figure 2.12 shows the expected course of overall borrowing (public sector net borrowing, PSNB) as a share of national income. Unlike the current budget, which is the target of the borrowing rule, this measure includes borrowing for investment spending. By the end of the forecast, different nominal wage growth assumptions could lead to a borrowing forecast that is essentially the same as, lower than or higher than the OBR’s in March, as a share of national income. However, in all these scenarios, we would expect an increase in the borrowing forecast for this year and next, as the high cost of servicing inflation-linked debt outpaces other effects.
Figure 2.12. Public sector net borrowing as a share of national income: OBR March 2026 forecast and Barclays/IFS scenarios
Note: Debt interest effect and non-income-tax revenues effect in earnings growth scenarios (dashed green) based on market expectations for Bank Rate and longer-term interest rate expectations in the week commencing 14 September and the Barclays inflation forecast from Chapter 1.
Source: Office for Budget Responsibility’s Economic and fiscal outlook March 2026. Barclays economic forecast, using authors’ calculations based on Office for Budget Responsibility’s Ready reckoner March 2025.
We also show the trajectory of borrowing under an optimistic scenario where higher investment in AI boosts productivity growth, much closer to the levels seen before the Global Financial Crisis. This is unlikely to be something the OBR would forecast at this point, but it shows that there are possible upside, as well as downside, scenarios that could materialise in coming years. Higher investment and productivity in this scenario boost real GDP growth to 1.9% per year over the next five years, leaving the level of economic activity over 2% higher by 2031–32 than in the central scenario. Under this scenario, overall borrowing would fall to 0.7% of national income in 2031–32, which would be the lowest level since 2001–02.19
Figure 2.13 shows what each of these scenarios would mean for the total stock of government debt, as measured by public sector net debt excluding the Bank of England (PSND ex BoE). In March, the OBR forecast PSND ex BoE to fall very slightly as a share of national income at the end of the forecast period. All the scenarios we have set out have debt lower as a share of GDP in the next few years, as higher-than-expected growth out-turn data in the first half of 2026 and a larger expected economy in cash terms reduce debt’s share of it. The range of assumptions for earnings growth makes the difference between debt rising or falling as a share of national income towards the end of the forecast horizon. However, the differences across scenarios are relatively modest: only in the most optimistic earnings growth scenario does debt get on a meaningfully falling path as a share of national income, though that is only enough to bring it back to its current level by the end of the forecast period.
Figure 2.13. Public sector net debt (excluding the Bank of England) as a share of national income: OBR March 2026 forecast and Barclays/IFS scenarios
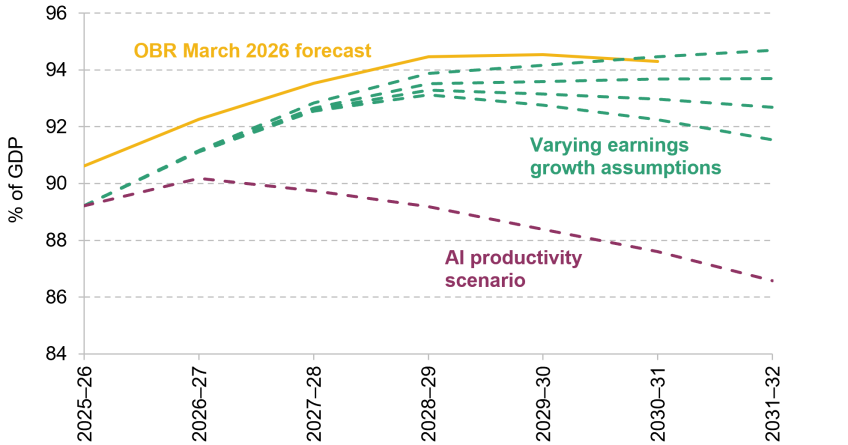
Note: Forecast trajectories start from a different level from the OBR March 2026 forecast due to higher-than-expected nominal growth towards the end of 2025–26, which pushes up the denominator and brings down the level as a share of GDP.
Source: Office for Budget Responsibility’s Economic and fiscal outlook March 2026. Barclays economic forecast, using authors’ calculations based on Office for Budget Responsibility’s Ready reckoner March 2025.
In the more optimistic scenario for productivity, we do see more of an improvement: debt as a share of national income ends up 5 percentage points lower than even in the most optimistic earnings scenario. This is a result of meaningfully higher real growth in this scenario, highlighting how important economic growth is for the sustainability of the public finances. However, even in this very optimistic case, debt is only falling by 1% of national income per year: it would take 14 years of that trajectory to get debt back to the level seen just before the pandemic.
Of course, one lesson from the recent past is that unexpected crises do happen, and can ratchet debt up sharply. Moreover, all this discussion has centred on what the forecast might look like before the effects of any policies announced at the Budget. The situation may look very different when John Healey sits down again after announcing his policy decisions in his speech. These decisions could be driven by the challenges he has inherited or by the new government’s fresh ambitions. We briefly discuss both of these in the next two sections.
2.4 Inherited pressures
John Healey has inherited a substantial set of pressures on the public finances from his predecessors. Above, we focused on economic developments that trigger an automatic change in the fiscal outlook – higher interest rates lead to more debt interest spending, more consumption in cash terms brings in additional revenue, and so on. In contrast, we now focus on areas where the government will face pressure to change its currently stated policy, but has a choice over whether to and to what extent it responds. Chapter 6 analyses public service spending pressures in much more detail; here, we briefly outline the range of uncertainty for the public finances as a whole from pressures on departmental spending plans from inflation, ambitious productivity assumptions and a difficult looming Spending Review, as well as from a potential set of temporary measures, including a freeze to fuel duties.
Departmental spending plans
Departmental spending makes up around half of total public spending and is mostly spent on delivering public services, including the NHS, schools, defence and the justice system. Under the framework set by Rachel Reeves, the upcoming Budget would be the last clear opportunity to make changes to the total amount of planned departmental spending for 2028–29 to 2030–31, which are the years for which departments are due to be allocated budgets at the Spending Review next year. 2029–30, the year the fiscal rules currently target, is part of that period. This is no accident but a helpful consequence of 2024 reforms to avoid over-optimistic spending plans artificially flattering reported performance against the fiscal rules. The government must also set spending totals for 2031–32, the new fifth year of the forecast, and will set capital budgets for departments for that year at the upcoming Spending Review too.
John Healey could choose to stick to the inherited totals, or even cut them back. If he wants to increase them, and stick within the existing framework, spending increases would have to be made at this Budget. Alternatively, he could depart from the spending framework set by Rachel Reeves, but doing so would mean either conducting the Spending Review within the current spending plans, holding a second fiscal event next year or conducting the Spending Review alongside the Autumn Budget. There are good reasons for the government not to settle every detail about departmental spending this autumn, especially given the change in Prime Minister and Chancellor. Importantly, however, the spending totals published at this Budget should be ones that the Chancellor could credibly stick to in the Spending Review. But if he already expects to increase spending at the Spending Review, postponing the announcement of this increase until next year would understate future spending and flatter the outlook for the public finances at the Budget.
On current plans, real-terms growth in day-to-day departmental spending in 2029–30 is set to be very modest, at 0.5%, followed by 1.3% in 2030–31.20 Chapter 6 considers a scenario where the government decides to grow health spending at 2.7% per year in real terms, the same as planned at the 2025 Spending Review, and maintains defence spending at 2.7% of GDP between 2027–28 and 2030–31. These decisions would imply average real-terms cuts of 0.9% per year for other departments over this period under the current spending totals.
Current plans look tight in part because of plans set out for ambitious efficiency savings between 2025–26 and 2029–30. Departments were asked to set out how they will use automation, improve procurement, and reallocate funding between programmes to reduce overall costs. If the hoped-for efficiency savings cannot be found, the government may be left looking at a choice of finding extra funding or lower quality of public services. If only half of the planned efficiencies were delivered, for example, and the government wanted to maintain its intended quality of public services, this could require an £11 billion top-up to total day-to-day spending in 2029–30.
This picture is made more challenging by the persistently high inflation coming from the closure of the Strait of Hormuz, which is likely to reduce the real-terms generosity of existing spending plans. If the government wanted to just keep its current pencilled-in plans for 2029–30 unchanged in real terms since the spring, that might require £15 billion of additional funding under the Barclays inflation forecast. £12 billion would be for day-to-day spending, and so would affect performance against the borrowing rule, while £3 billion would be for capital spending.
There are signs that this higher inflation may already be feeding through in the form of higher public sector pay settlements. Public sector pay deals this year mean that average pay growth will be approximately 3.9% in 2026–27, compared with the OBR’s forecast for public sector pay growth of 2.2% when budgets were first set and 3.0% this spring. Higher pay this year will on its own have persistent effects: relative to the OBR’s expectations when budgets were set (its March 2025 forecast), pay could be £4 billion higher in 2029–30. There is also a risk that pay growth will be higher in future years too: Barclays forecasts that wages will begin to grow faster than the OBR was previously expecting over the medium term, which could continue to push up public sector pay and further squeeze departmental budgets.
Temporary giveaways
Given the large rise in energy prices, the government may decide to announce a temporary giveaway to help households with ‘cost of living’ pressures. All else equal, this would push up on borrowing this year.
It would not be a surprise either to see fuel duties frozen again. Fuel duties are statutorily set to increase in line with inflation, but have instead been frozen in cash terms in a series of ‘temporary’ policies since 2011–12. A similarly ‘temporary’ 5p cut has been in place since 2022. A gradual unwinding of these cuts was planned to begin last month, but in May the cut was once again extended, this time to the end of 2026. This four-month delay is expected to have a one-off cost of around £200 million. Shortly after the Prime Minister took office, the government also announced a cut to VAT on household electricity bills from 5% to 0%, initially for a period of six months, which the Treasury estimated would cost around £850 million.
The cost of these temporary measures in themselves is not particularly large in the context of the public finances, and the OBR’s forecast at the Budget will be predicated on these freezes and temporary cuts being unwound, since this is stated government policy. But history clearly suggests that the fuel duty freeze is likely to be extended, and there may be pressure to do the same for the recent VAT cut. Making the 5p cut permanent and freezing fuel duties for an extra year would cost £2.7 billion, while if the freeze were extended until 2029–30 the cost would reach £4 billion a year by then under the OBR’s March forecast for inflation. But higher inflation would push the cost higher: under the Barclays inflation forecast, those figures would be £3.2 billion and £4.5 billion respectively. Making the cut in VAT on household electricity bills permanent would have an annual cost of around £1.5 billion, although the exact cost would depend on future household electricity spending. Of course, if the government does announce a further ‘temporary’ extension to some of these policies, this will increase borrowing or require other tax rises or spending cuts to offset. Importantly, these temporary policies also make the forecast for future years less transparent and more uncertain because it no longer represents a central expectation of what is likely to happen. Ultimately, this can erode the credibility of the forecast.
2.5 Policy ambitions
The new government has stated ambitions to increase defence spending and public investment. We discuss the potential implications of new spending commitments in these areas. We do not consider recent announcements on the pensions triple lock (discussed in Cribb, Karjalainen and Miller (2026)) or social care, since these are plans that would come into force after the next election and are therefore unlikely to have major impacts on spending in the final years of the forecast.
Defence spending
In June 2025, NATO members including the UK committed to spending 3.5% of national income on defence by 2035. Under current plans, spending will rise from 2.1% in 2023–24 to 2.7% next year. This includes top-ups announced in the Defence Investment Plan at the end of June, funding for around a third of which – an average of around £1 billion per year – still needs to be set out at the Budget.
In his resignation letter as Defence Secretary, John Healey called for the government to go further and spend 3% of national income on defence by 2030. If he were to follow through with this in his new role as Chancellor, this would mean spending £11 billion more on defence in 2030–31, relative to keeping defence spending at 2.7% of national income. If he decided to increase defence spending on a steady path from 2026–27 onwards to reach 3% in 2030–31, this would mean an increase in defence spending of £7 billion by 2029–30. This is the year in which the fiscal rules apply, though it is worth noting that a large share of any increase in defence spending is likely to be extra capital spending, which will not impact the current budget deficit.
In the longer term, the government has an ambition to spend 3.5% of GDP on defence in 2035. This is equivalent to a £25 billion increase in spending in today’s terms – more than the increase in spending implemented by the Labour government so far. Chapter 6 provides more detail on the spending implications of different policy options for the defence budget and how these interact with decisions on the timing of the Spending Review.
Investment spending
New Chancellor John Healey told the press in August 2026 that he saw ‘scope for more and more rapid investment’. The Prime Minister has suggested he would like to significantly increase council housebuilding, which could come from new investment spending or cutting back other, already planned investments. It is hard to predict the exact scale of any additional investment: one proposal from the Resolution Foundation suggested increasing investment by £9 billion per year, in order to match the amount invested in the UK by the European Investment Bank prior to Brexit (Christensen et al., 2026). As described in Section 2.2 above, after a significant top-up of inherited investment spending plans at the 2024 Autumn Budget, investment spending is already set to reach its highest sustained level since the 1970s. This is not necessarily in conflict with the Chancellor’s statement, but does underline its ambition.
One oft-cited argument in favour of higher public investment – and one made, for example, by now First Secretary of State Louise Haigh in May 2026 – is that UK public investment is low by international standards. Figure 2.14 shows that UK governments have indeed invested less than most G7 peers since the turn of the century relative to the size of their respective economies. In 2024, the last year for which comparable data are available for all countries, only the German government was investing less than the UK government, and government investment in Canada, France, Germany and Italy was on a sharp upward trajectory.
Figure 2.14. Government investment spending as a share of national income in the UK and other G7 countries
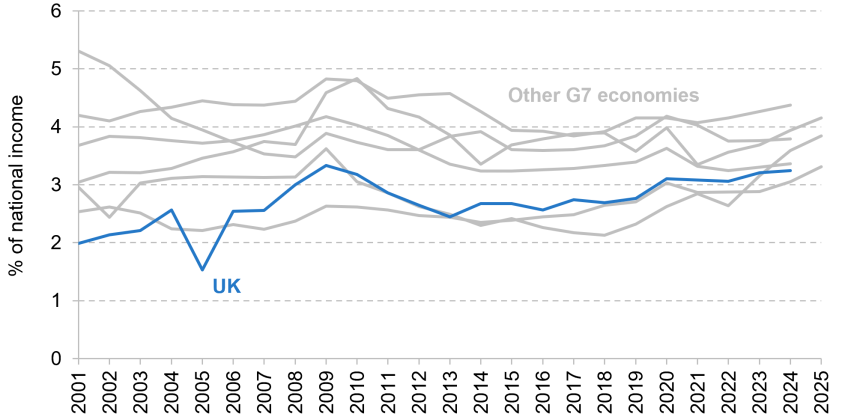
Note: Government investment is defined as general government gross fixed capital formation.
Source: OECD National Accounts at a Glance (NAAG), chapter 3: expenditure, dataset DSD_NAAG@DF_NAAG_III.
The same argument could be made for overall investment in the economy: on standard measures, economy-wide investment (public and private) is lower in the UK than in other G7 countries, and has been for most of this century. It is not obvious, however, that every country should dedicate the same share of national income to either public or private sector investment. For example, the UK economy has a large service sector, which relies less on capital investments than manufacturing does.21
If the government would like higher economy-wide investment, it could choose to directly target some of the factors that hinder private sector investment, which might include policy uncertainty, regulatory costs, poor tax design or insufficient competition. Of course, the government can also increase public investment – ideally without replacing private sector investment or even while encouraging (‘crowding in’) additional investment by firms.
Investment spending, like any other kind of government spending, can be funded through cuts to other areas of spending, tax rises or borrowing. There is a principled case that borrowing for investment is more justifiable than borrowing for day-to-day spending: if done well, investments should create a return that future generations benefit from, which may reconcile them to the additional debt servicing cost they will have to pay. If the investment generates economic growth, the additional tax revenue may help offset, and in some cases could outweigh, the cost of servicing the additional debt. This approach is not risk-free, however, and does not justify unlimited borrowing for investment. The hoped-for return on investment might not materialise, and investments precommit spending for future generations: given the option, a future generation may choose to spend money on something other than the benefit created by a past investment, if that benefit does not come in the form of additional tax revenues. Moreover, even though some investments can have large payoffs, this will not necessarily be true for all investment – the details of what a government invests in matter. There are also reasons to place constraints on government borrowing and to prevent debt from being on an ever-rising path, such that, even if more investment is deemed desirable, it does not automatically mean that it should be funded through more borrowing.
The current borrowing rule reflects the idea discussed above – that borrowing for investment is preferable to borrowing for day-to-day spending – by aiming to balance the current budget: in other words, to raise enough revenue to pay for day-to-day spending, but potentially still borrow to invest. The debt rule – which requires public sector net financial liabilities as a share of GDP to be falling by the third year of the forecast – can constrain borrowing, whether for day-to-day spending or investment. However, the degree to which this rule constrains borrowing for investment depends on the type of investment. As outlined in Box 2.2, investment spending that involves acquiring a financial asset, such as a loan to be repaid or an equity stake in a private company, does not necessarily affect performance against the debt rule.
Box 2.2. The effect of different types of investment on public sector net financial liabilities
After changes made to the fiscal rules in 2024, the measure of debt targeted by the government is public sector net financial liabilities (PSNFL) instead of public sector net debt excluding the Bank of England (PSND ex BoE). When the rule targeted PSND ex BoE, additional borrowing for investment would simply add to the measure of debt. For PSNFL, this is still the case for most forms of borrowing for investment – for example, direct investment by government departments in infrastructure. However, when the government invests through a financial transaction that creates a financial asset, the value of this financial asset is netted off PSNFL. Assets netted off this measure include loans to and equity stakes in companies, such as those held by the National Wealth Fund and other public sector financial institutions (so-called PuFins). If these assets are of equivalent value to the borrowing that was used to finance the investment, these types of investments do not increase PSNFL and are therefore not constrained by the fiscal rules, except in their indirect effects via additional debt interest spending.a There would only be an effect on PSNFL if there were future changes in the value of these assets.
Alongside shifting the debt rule to target PSNFL, the Treasury also instituted a framework governing the use of financial transactions. This requires them to be used only in pursuit of clear policy objectives and places an emphasis on additionality – using public investment to enable activity that would not otherwise occur, while avoiding unnecessary displacement of private sector investment. Public financial institutions are generally expected to target a return – across all their investments – at least equal to the government’s cost of borrowing. The framework also permits investments that are expected to earn less than this where there is a policy justification and provided that the resulting subsidy or expected cost is transparently recognised. For example, subsidised loans – such as student loans – are treated as a combination of spending (for the portion of the loan that the government expects to eventually write off) and an asset included in the measure of PSNFL (for the portion it expects to receive back).
a These types of investments also do not increase public sector net borrowing: provided a financial asset is acquired at fair value, its acquisition is recorded separately from PSNB.
Of course, while investments in financial assets can leave PSNFL unchanged, any additional borrowing used to fund this type of financial transaction would still increase public sector net debt and, consequently, debt interest spending (which also affects performance against both fiscal rules). As such, although there can be a good economic rationale to invest through public financial institutions (PuFins) – especially where a public investor can provide coordination and attract additional private investment (King and Jameson, 2024) – it is not costless. The Treasury’s framework for financial transactions provides some guard rails against these transactions being used excessively as a replacement for regular government spending. If the government follows the spirit of the guidelines, and aims to construct a portfolio of investments that align with government priorities and generate a profit, the cases where investment can occur through PuFins may turn out to be relatively limited. The government should avoid trying to use investments by PuFins as a way to mask the impact of subsidies or other spending on the fiscal rules.
In summary, if the government decides to increase investment, the types of additional investment that it chooses to use will determine how that interacts with the fiscal rules. Some types of investment could be straightforwardly accommodated within the fiscal rules. Others would push up PSNFL. In either case, higher borrowing would push up public sector debt and government should have a clear rationale for why that would be justified – in both of these respects, borrowing for investment is no different from any other kind of borrowing.
2.6 Choices for the Chancellor
John Healey inherits the same fiscal challenges faced by his predecessors. Debt levels, spending on debt interest and borrowing are high. These challenges must be tackled at a time when tax revenues are already historically high and in the face of large spending pressures.
War in the Middle East has added to the scale of the challenge. Compared with the OBR’s March forecast, interest rates on government debt are higher, inflation is higher, and real growth is expected to be slower in the short term. The net effect on borrowing, and therefore on the much watched ‘headroom’ against running a balanced current budget in 2029–30, is uncertain. Higher interest rates will undoubtedly push up debt interest spending and therefore borrowing. But higher inflation will raise the nominal size of the economy, increase revenues and thereby reduce borrowing. Under a plausible set of assumptions about the effects of inflation, the headroom forecast handed to the Chancellor by the Office for Budget Responsibility could be around £20 billion. But it would be no surprise to see the OBR forecast lower or higher headroom: differences in judgements around the path of earnings can, on their own, leave headroom £10 billion higher or lower. It is worth noting that in the context of forecasting around £1,470 billion of spending and £1,490 billion of tax receipts, a difference between the two numbers of, say, £10 billion is very small. It is also important to remember that the same inflation that is pushing up on tax revenues is also reducing the spending power of departments’ budgets, adding to the already significant pressure on public spending.
Whatever the exact OBR ‘pre-measures’ forecast, the Chancellor will need to answer a set of interrelated questions. His choices will determine the path of the public finances.
If headroom is forecast to be lower, should it be rebuilt? The £24 billion of headroom forecast in March should not be seen as a target. Headroom can – and sometimes should – be used to absorb shocks and avoid fine-tuning tax or spending policy in response to small changes in forecasts. However, £24 billion was a relatively low level of headroom to start with, and a further fall would reduce the scope to absorb future shocks, and could thereby reduce the credibility of the planned consolidation and lead to damaging speculation in advance of future fiscal events. It is also worth emphasising that operating with lower headroom would mean more borrowing; with very high levels of debt and debt servicing costs, there would be clear risks to adding further to this.
How quickly should borrowing for day-to-day spending be brought down? Sticking to the fiscal rules requires the forecast current budget to at least be in balance in 2029–30. In principle, this could be achieved while allowing higher borrowing in the short run than was previously planned. This could, for example, be used to fund a package of cost-of-living support or to top up public spending. But there would be costs in terms of higher debt and debt servicing costs. It would also weaken credibility if a more back-loaded consolidation was deemed less likely to be delivered.
Should the government borrow more to fund investment and should any additional investment be in financial assets? Investments in financial assets could be made without increasing public sector net financial liabilities and therefore without being constrained by the fiscal rules. But the nature of the fiscal rules should not drive the type of investments the government makes. The key question should always be whether the government thinks there are investment opportunities that would drive growth or achieve some other policy goal and not be undertaken by the private sector while achieving value for money. Even if such opportunities are found that do not count against the fiscal rules, there should be no illusion that higher borrowing is costless. Sticking to the fiscal rules would not prevent higher debt and debt servicing costs. Fiscal rules can only ever be one part of a government’s broader strategy to ensure the sustainability of the public finances and signal fiscal credibility. Ultimately, it is important for both that borrowing is not simply forecast to fall in coming years but actually falls.
Should public service spending be topped up in the face of pressures and/or to accommodate new ambitions? Inherited plans for departmental spending already looked challenging when first set out by Rachel Reeves, as we warned at the time. They were based on historically ambitious growth in public sector productivity and, under reasonable assumptions about growth in the NHS budget, almost certainly implied cuts for some departments. Higher inflation is now expected to significantly reduce departments’ spending power. On top of this, meeting the ambition for defence that the new Chancellor stated when he resigned as Defence Secretary would imply spending an additional £11 billion on defence by 2030. Growing the NHS and defence budgets within current spending plans would imply large cuts to other departments. Without top-ups, we should expect the quality and/or quantity of some public services to decline relative to previous plans. This is a choice the government could make, and one that inflation may make politically easier – previous governments responded to inflation after the 2022 energy crisis with relatively small top-ups – but it would nevertheless be a choice. The Chancellor should not attempt to avoid this choice by producing spending plans that he has no intention of delivering when the time comes. To do so would unduly flatter the outlook for the public finances, making the Budget and the fiscal rules less credible.
Should plans for taxes and benefit spending be changed? If the Chancellor wants to cut borrowing (by more than expected in the pre-measures forecast) and/or significantly increase public service spending, he will have to consider raising taxes or cutting benefit spending. The options here are as familiar as they are difficult. The commitments in the 2024 Labour manifesto severely restrict the options for using the simplest, most reliable levers to raise tax – income tax, National Insurance and VAT. The remaining tax-raising options – which are discussed in Adam, Delestre and Miller (2025) – are also narrower following two Budgets in which Rachel Reeves made this the biggest tax-raising parliament on record. If the Chancellor chooses further tax rises, they should be expected to drag on growth but, importantly, some tax rises would do more damage than others – the design of any tax-raising measures would be key. Similarly, the design of any reforms to the benefit system will be key – we discuss options for reforming disability benefits in particular in Chapter 7.
In making all of these choices, the Chancellor will, understandably, be focused on the next few years – the years in the run-up to the next general election and those covered by the OBR’s fiscal forecast. He should also cast his view further ahead. Even if a current budget surplus is reached by the end of the parliament – which would be an achievement – warning lights will still be flashing on the fiscal sustainability dashboard. Debt and the cost of servicing it will still be high. An ageing population, cost and demand pressures in healthcare, and any net zero transition will still confront fiscal policymakers with difficult choices. The Budget should not be judged merely on whether the fiscal rules are met. That is a necessary but far from sufficient condition for more sustainable public finances.
References
Adam, S., Delestre, I. and Miller, H., 2025. Options for tax increases. IFS report, https://ifs.org.uk/publications/options-tax-increases.
Christensen, E., Hale, S., Hunsaker, S. and Willetts, D., 2026. Much ado about PuFins: how the UK’s public financial institutions can unlock billions for investment. Resolution Foundation, https://doi.org/10.63492/seu4444.
Competition and Markets Authority, 2025. Industrial policies: new evidence for the UK. https://www.gov.uk/government/publications/industrial-policies-new-evidence-for-the-uk/industrial-policies-new-evidence-for-the-uk.
Cribb, J., Karjalainen, H., Latimer, E., Ray-Chaudhuri, S. and Waters, T., 2025. Do disability benefit claims rise when other benefits are cut? IFS report, https://ifs.org.uk/publications/do-disability-benefit-claims-rise-when-other-benefits-are-cut.
Cribb, J., Karjalainen, H. and Miller, H., 2026. How will the new triple lock work and what effects will it have? IFS comment, https://ifs.org.uk/articles/how-will-new-triple-lock-work-and-what-effects-will-it-have.
Emmerson, C., Johnson, P. and Zaranko, B., 2024. Public finances and the 2024 general election. IFS comment, https://ifs.org.uk/articles/public-finances-and-2024-general-election.
Emmerson, C., Miller, H. and Zaranko, B., 2025. How frequently should the OBR produce forecasts? IFS comment, https://ifs.org.uk/articles/how-frequently-should-obr-produce-forecasts.
Emmerson, C., Stockton, I., van de Schootbrugge, S. and Zaranko, B., 2023. Chancellors’ responses to economic news. IFS report, https://ifs.org.uk/publications/chancellors-responses-economic-news.
European Commission, 2025. Debt Sustainability Monitor 2025. European Economy Institutional Paper, https://economy-finance.ec.europa.eu/publications/debt-sustainability-monitor-2025_en.
HM Treasury, 2026a. Charter for Budget Responsibility: Autumn 2025. https://www.gov.uk/government/publications/draft-charter-for-budget-responsibility-autumn-2025.
HM Treasury, 2026b. Forecasts for the UK economy: September 2026. https://www.gov.uk/government/statistics/forecasts-for-the-uk-economy-september-2026.
King, A. and Jameson, D., 2024. Designing a UK fiscal framework fit for the climate challenge. LSE, Centre for Economic Transition Expertise, https://cetex.org/publications/designing-a-uk-fiscal-framework-fit-for-the-climate-challenge/.
Office for Budget Responsibility, 2025. Ready reckoner. https://obr.uk/ready-reckoner/.
Zaranko, B., 2026. From fiscal rules to fiscal traffic lights: rethinking the UK fiscal framework. IFS report, https://ifs.org.uk/publications/fiscal-rules-fiscal-traffic-lights-rethinking-uk-fiscal-framework.
Acknowledgements
This chapter has been produced as part of the IFS Green Budget 2026. The 2026 edition of the IFS Green Budget is funded by the Nuffield Foundation, Barclays and the Economic and Social Research Council (ESRC) through the Centre for Microeconomic Analysis of Public Policy (CPP). IFS is an independent Research Institute. As with all pieces of work, IFS has full editorial control over its analysis and conclusions. In addition to providing funding, Barclays authors will write chapters for the 2026 Green Budget, covering topics (the macroeconomic outlook, Asset Purchase Facility and bond markets) where their expertise complements that of IFS.
Endnotes
Authors

Nick Ridpath
Nick joined the IFS in 2023 and works in the Education and Skills sector, focusing on the long-run impacts of education policy.

João Sousa
João is a Senior Research Economist, with a focus on public finances and devolved government finances.

Isabel Stockton
Isabel works in the Healthcare sector, and on the public finances. Their research focuses on retaining and developing the NHS workforce.
More from IFS
Understand this issue


Policy analysis


Academic research


