
Downloads
Download the report as a PDF
PDF | 901.22 KB
Executive summary
The UK’s working-age benefit system includes two types of health-related benefits: incapacity benefits for those whose health limits their ability to work and disability benefits for those whose health imposes significant additional living costs. There were big cuts to the generosity of the UK’s benefit system in the 2010s which fell mostly on the elements unrelated to health. At the same time, the number of people receiving health-related benefits rose significantly. Various commentators have suggested that these two changes may be linked, that cuts to other benefits may have increased the number of people claiming health-related benefits. This could be because the cuts to non-health-related benefits worsened the health of those affected or because take-up of health-related benefits may have increased.
This report investigates the extent to which the generosity of the non-health-related benefit system affects the number of people claiming health-related benefits (primarily disability benefits). To do this, we apply econometric techniques to estimate the causal effect of reforms to non-health-related benefits on the number of people receiving health-related benefits. We study four reforms: the 2011 cuts to housing benefit for private renters; the increase in the female state pension age between 2010 and 2018; the lowering of the benefit cap in 2016; and the introduction of the ‘lone parent obligation’ between 2008 and 2012, which required more single parents on out-of-work benefits to look for paid work. In each case, we find the reform increased the number of people receiving disability benefits, and we also find that two of the reforms increased the number of people receiving incapacity benefits.
Key findings
- Cuts in 2011 to the maximum amount of housing benefit that private renters can receive led to more people claiming disability benefits. We estimate that the policy led to an average fall in housing benefit income of £667 per year (3.3% of income) after two years for those affected, and a 3.5% increase (from 221,000 to 229,000) in the number of claimants of disability benefits among those affected. This suggests an ‘income elasticity’ of disability benefit claiming of –1.1, meaning that, for those affected by this reform, a 1% fall in income led to a 1.1% increase in the number of people claiming disability benefits. We can use ‘income elasticities’ to compare the size of the effects – how much disability benefit receipt increases in response to cuts to income – across different reforms.
- The increase in the female state pension age (SPA) from 60 in 2010 to 65 in 2018 made the women affected more likely to claim disability benefits. We find that the increase in the female SPA led to a significant increase in both applications and receipt of disability benefit – even though the rules for eligibility for working-age disability benefits did not change over this period. Women affected by the increase in the SPA saw on average a 20% reduction (£8,100 a year) in their annual income until they reached their new – higher – state pension age. This increased the proportion of women receiving disability benefit by 0.9 percentage points from 11.4% to 12.3% – in proportional terms a 7% rise. This implies an income elasticity of –0.4 (i.e. a 1% fall in income leads to a 0.4% increase in the number of people receiving disability benefits for this group). The elasticity is smaller than the one we found for the reform to housing benefits, meaning that fewer people respond to the cuts in income. This may be because the increase in the state pension age affected all women in certain birth cohorts, rather than just those on low incomes.
- The lowering of the benefit cap in 2016 also increased disability benefit receipt. This reform reduced the maximum amount of total benefit income for out-of-work households that are not claiming health-related benefits, cutting incomes by 11% for those affected by the policy. After one year, 3.2% of those affected by the lower benefit cap received disability benefits, compared with 2.6% among those with benefit income just below the cap (who were unaffected by the policy) – a proportional increase of 20%. Together, this implies an elasticity of –1.8, suggesting that a 1% decline in income increases the likelihood of claiming disability benefits by 1.8%. This elasticity is larger in magnitude than those in the other two studies, but not directly comparable since this reform also increased the financial return to claiming disability benefits. This is because disability benefit receipt confers exemption from the benefit cap, meaning that receipt of disability benefits also increases non-health-related benefit incomes for the affected households.
- Requiring single parents to prove that they are looking for a job to continue to get out-of-work benefits also increased receipt for both incapacity and disability benefits. The ‘lone parent obligation’, rolled out between 2008 and 2012, applied these job search requirements to most single parents. While this policy did increase employment (by 4.4 percentage points), it also led to a 3.3 percentage point increase in the share of single parents receiving incapacity benefits – which do not have job search requirements attached. The number of recipients of disability benefits also rose, by 0.7 percentage points. This contributed to the policy generating virtually no fiscal saving.
- Overall, a back-of-the-envelope calculation suggests that all changes to non-health-related benefits and direct taxes from 2010 to 2019 increased disability benefit spending by £900 million. This represents 13% of the £7 billion increase in disability benefit spending during the 2010s. This estimate assumes that the effect (the elasticity) of all benefit cuts and tax changes over the 2010s on disability benefit receipt was the same as the effect we find from studying the 2011 cut to housing benefits. It should therefore be taken as a rough estimate – the true effect could be higher or lower than this. Despite this uncertainty over the exact magnitude of the total effect, taken together our results show that while cuts to non-health-related benefits did increase disability benefit receipt, this shift can only explain a relatively small share of the total rise in disability spending from 2010 to 2019. And since there have not been significant net benefit cuts since 2019, this factor is unlikely to explain much of the post-pandemic rise in disability benefit spending. However, our results do suggest that disability benefit receipt rises when incomes fall, so provide some indicative evidence that the sudden price rises in 2022, which cut real incomes, may be part of the explanation for the post-pandemic rise in disability benefit receipt.
1. Introduction
The UK’s working-age benefit system can be split into two parts: a health-related part, which makes payments only to those who are assessed as having a disability or condition that limits their ability to work or do certain activities, and other benefits which are unrelated to health. The generosity of the non-health part of the system was cut back considerably in the 2010s. At the same time, the number of people claiming health-related benefits increased gradually over the 2010s and has increased dramatically since the pandemic (Latimer, Pflanz and Waters, 2024).1
This has led to some researchers raising the possibility that the nature of the UK’s non-health-related benefits system might be pushing more people to claim health-related benefits (Judge and Murphy, 2024; Centre for Social Justice, 2025). But there is not much concrete, causal evidence on the existence or size of these effects to date, at least in the UK.2
The aim of this report is to fill that gap. We primarily focus on disability benefits, which provide additional income for those whose condition raises their living costs, rather than incapacity benefits, which are received by people assessed as having a limited ability to work.3 Disability benefits are not means-tested, and eligibility is determined by an assessment of the degree to which the applicant’s condition affects their day-to-day activities. Just over half of those assessed are accepted and the outcome often depends on somewhat subjective scoring judgements made by assessors. For instance, someone judged to need assistance with ‘simple budgeting decisions’ would score more highly than someone who is judged to only need help with ‘complex budgeting decisions’, but there is no hard-and-fast distinction between the two.4
The two key working-age disability benefits in this period are disability living allowance (DLA) and personal independence payment (PIP), which gradually replaced DLA from 2013.5 Unless otherwise stated in our analysis, we aggregate adult DLA and PIP receipt. In this report, we will use disability benefits ‘receipt’ to mean the stock of people in a relevant group receiving disability benefits and ‘applications’ to mean the flow of new applications to disability benefits, which may be either successful or unsuccessful.
There are two ways that the generosity of the non-health-related part of the system might affect the number of people claiming disability benefits. First, the cut in income could negatively impact health, thereby increasing the number of people eligible. For example, lower incomes could raise stress, or lead to worse-quality housing or a lack of nutritious food, all of which could impact health. It seems likely that, at least over the two-year time horizons we study in this report, if this were to happen, the main route would be through greater mental (rather than physical) health problems, though it is possible that lower income could have physical health effects over the longer term.6
Second, the benefit cut may make those whose health has not changed more likely to apply for disability benefits or change their approach to the assessment. While disability benefits obviously provide a source of income to the claimant, applying for them comes with costs, including the effort required to research the benefit and its eligibility criteria; stigma associated with the benefit; and costs related to the application and assessment process, including that the assessment could be unpleasant or demeaning (see Hoynes, Joyce and Waters (2024) and Ko and Moffitt (2024) for recent reviews of research on non-take-up). Reductions in other income sources – such as making the non-health-related part of the benefits system less generous – increase the value of getting disability benefits, since an extra £1 is generally regarded to be more valuable for people on lower incomes than for those on higher incomes. This raises the incentive to put in a claim for disability benefits, or to do more costly activities that increase the chances of being accepted. These include researching the assessment criteria in advance and approaching the assessment accordingly, asking for medical professionals to provide evidence for the claim, or appealing initially unsuccessful claims. These are all potentially relevant responses given the somewhat subjective nature of the assessment, as described above.
We refer to this second impact as the ‘take-up effect’, as separate from the (first) ‘health effect’ explanation. Our approach does not allow us to distinguish between the health and take-up explanations, and so our results should be interpreted as incorporating any effects from both channels.
We begin this report by laying out the two key trends motivating our analysis, by showing that the 2010s saw a significant decline in spending on non-health-related benefits, primarily on low-income households, and a rise in spending on health-related benefits – which are generally received by lower-income households. However, the coincidence of these two trends does not necessarily imply that one caused the other. Therefore, using both existing and new evidence, we examine four specific case studies – reforms that cut the generosity of the non-health-related benefit system in such a way that their causal effects on disability benefit receipt can be evaluated.7 We describe these briefly here, and in more detail in each reform’s section below. They are:
- Cuts to housing benefit in 2011, when several reforms were made which cut the generosity of the housing benefit system for private renters.
- Increases in the female state pension age between 2010 and 2018, which cut state support for women in their early 60s.
- The reduction in the benefit cap in 2016. The benefit cap applies an overall limit on the amount a family can receive in benefits, unless they are entitled to an exemption (including because they receive disability benefits). This limit was lowered in 2016, reducing support primarily for families with several children in rented accommodation.
- The ‘lone parent obligation’, enacted between 2008 and 2012, which had the effect of requiring a much greater share of single parents to look for work in order to receive out-of-work benefits. Unlike the other reforms we study, the lone parent obligation does not change the financial support the system provides, but rather changes the ‘conditionality’ rules by imposing job search requirements on more people.
These reforms differ in terms of who they targeted and also in how big an income cut they caused for those affected. To help compare them, for the first three reforms we calculate their impact on the average incomes of those affected (excluding disability benefits), as well as the impact on the number claiming disability benefits.8 These two figures can then be used to calculate an ‘income elasticity of disability benefit claiming’ – the relationship between income and disability benefit receipt. We give more detail on this in Box 1.
The rest of the report proceeds as follows. Section 2 documents the changes to the tax and benefit system since 2010 and illustrates trends in health-related benefit spending over the same period. Sections 3 to 6 cover, in turn, each of the case study reforms listed above. Section 7 compares the results across our four case studies and discusses what our results mean for the potential effects of all non-health-related benefit cuts on disability benefits. Section 8 concludes.
Box 1. The income elasticity of disability benefit claiming
To give a sense of the scale of the effects – the responsiveness of the disability benefit claim rate to cuts to income – that we estimate, and to help us compare the magnitude of effects from different reforms, we quantify the income elasticity of disability benefit claiming. Here the question we ask is: ‘If a reform causes average income among a group to decline by 1%, what is the proportional – not absolute – impact on the number of people in that group claiming disability benefits?’. For example, if average income fell by 10%, and the share of people receiving disability benefits rose from 5% to 6% – a 20% increase – the income elasticity we measure would be –2 (20% divided by –10%).
To estimate the income elasticity for each reform, we first measure the average income of those affected by the policy in question prior to its implementation. We then measure the mechanical effect of the policy on their incomes – i.e. how much their income would change if their behaviour (in terms of employment, disability benefit claiming and anything else) did not respond to it. These two numbers give us the proportional change in income as a result of the reform. Likewise, we measure the share of those affected by the policy that were already receiving disability benefits prior to its implementation, and estimate the impact of the policy on the number of claimants. This allows us to calculate the proportional change in disability benefit receipt. The ratio of the two gives the income elasticity.
For two of the four case study reforms we examine (cuts to housing benefit and the increase in the female state pension age), the reforms themselves do not change, or only change very marginally, the cash increase in income that claimants would get from being on disability benefits. In those cases, the effect can be thought of as what economists call an ‘income effect’ – the effect of a change in income on disability benefit receipt. In the case of lowering the benefit cap, those affected by it see their income decline, but at the same time the additional income they could now get from claiming disability benefits also increases: as well as getting the additional payments from disability benefits, they would also be exempted from the cap and would therefore receive more income from other benefits. This induces a ‘substitution effect’ – meaning that there is a greater financial return to claiming disability benefits. While we can still calculate the impact of the reform on incomes and disability benefit claiming in the same way, the ratio of the two is not a measure of the income elasticity alone because the effects we observe will incorporate both income and substitution effects. In this case, the substitution effect would also be expected to increase receipt (as the return from claiming is higher), so the elasticity will be larger in magnitude than if we were just measuring an income effect. It should therefore be considered an upper bound on the income elasticity. The final reform we study – the implementation of conditionality on single parents – does not have a natural income elasticity interpretation as it did not directly affect incomes.
2. Reforms to benefits and disability benefit receipt since 2010
Disability benefits are cash payments designed to help cover additional living costs that people with disabilities face. Applicants undergo an assessment based on their inability to carry out a range of tasks which determines eligibility and the level of award.9 This process typically takes a number of months. These benefits are not means-tested (related to income or work status).
Personal independence payment (PIP) is the main disability benefit for working-age adults. It was introduced in 2013 and has since been gradually rolled out to replace disability living allowance (DLA). The government intended to reduce spending by replacing DLA with PIP, but the savings did not materialise. PIP recipients live with a wide range of conditions relating to both mental and physical health and receive between £1,520 and £9,750 per year depending on the severity of their condition. Incapacity benefits, for those whose health condition limits their ability to work, are mostly means-tested.
The rest of the working-age benefit system is not related to health and is largely made up of benefits aimed at families with low incomes. There were a number of reforms to this part of the system during the 2010s, including benefits being uprated by less than inflation, cuts to housing benefit and the introduction of the ‘two-child limit’.10 There were also changes to the pensioner benefit system over this period, including the increase in the female state pension age, which we explain in more detail in Section 4. The overall impact of working-age tax and benefit changes between 2010–11 and 2019–20, as shown in Panel A of Figure 1, was a reduction in incomes for households in the poorest 40% of the income distribution. Panel B shows that these households were also the most likely to receive disability benefits.
Figure 1. Impact of changes to taxes and (non-disability) benefits, and share of individuals receiving disability benefits, by equivalised household income decile
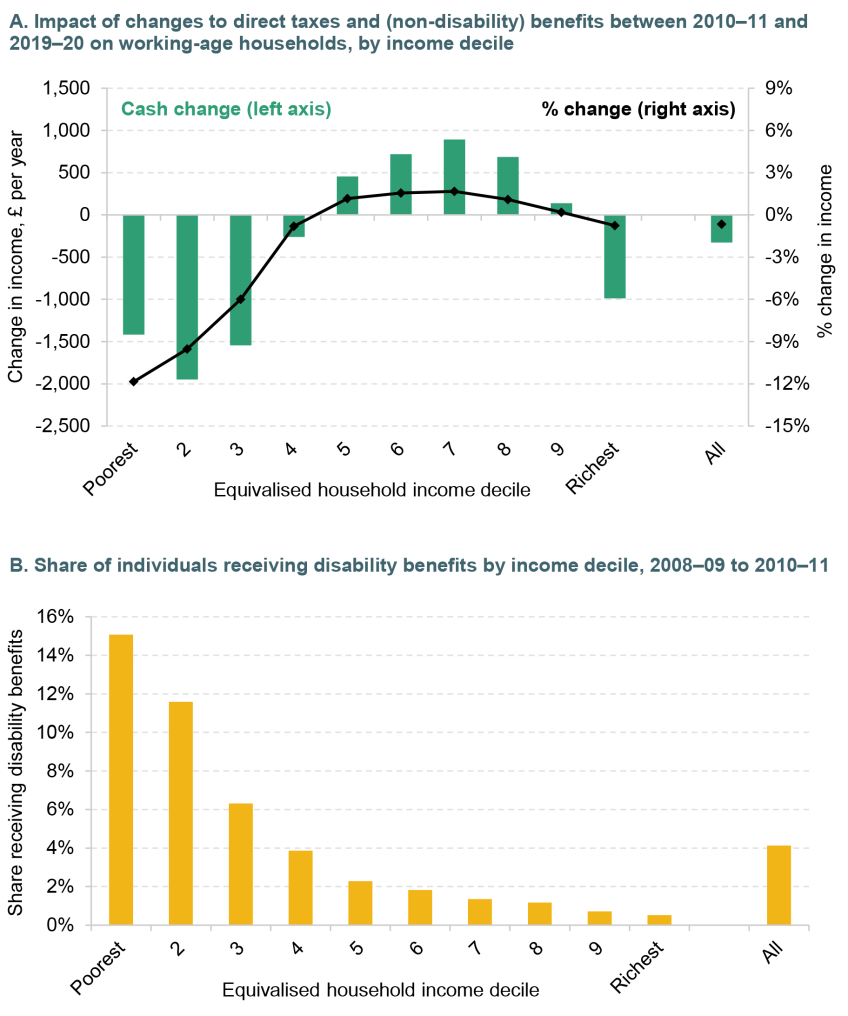
Note: Includes working-age households only. Cash amounts in 2025–26 prices. When calculating income deciles, incomes do not include disability benefit income and are equivalised using the OECD equivalence scale. No children are included in disability benefit figures, although some aged 16 or 17 claim working-age disability benefits.
Source: Authors’ calculations using Family Resources Survey 2008–09 to 2010–11 and TAXBEN, the IFS tax and benefit microsimulation model.
Figure 2. Annual spending on health-related benefits and other working-age benefits, 2002–03 to 2025–26
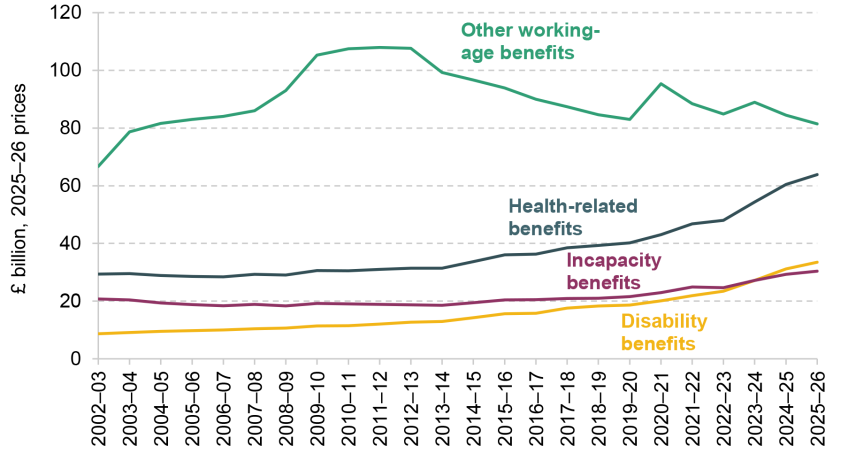
Note: Figures include all spending targeted at working-age adults and children. ’Health-related benefits’ is the sum of spending on incapacity and disability benefits. Spending includes disability benefits in Scotland, but excludes all other Scottish devolved benefits. Figures are based on policy as of Spring Statement 2025. Carer’s benefits are included in other working-age benefits.
Source: Authors’ calculations using DWP benefit expenditure and caseload tables 2025 (https://www.gov.uk/government/publications/benefit-expenditure-and-caseload-tables-2025).
These cuts to benefits have contributed to a decline in spending on non-health-related benefits. Figure 2, which plots annual working-age benefit spending, shows that between 2010–11 and 2019–20 spending on non-health-related working-age benefits fell by 23% – from £107 billion to £83 billion (in 2025–26 prices). This is partly due to policy decisions to cut benefit spending and partly due to improving economic circumstances. At the same time, health-related benefit spending grew gradually in the 2010s from £30 billion in 2010–11 to £40 billion in 2019–20, driven particularly by rises in disability benefit spending. The cut in working-age benefit spending has been suggested as a contributor to the rising health-related benefit spending, although we cannot confidently conclude that simply from the trends in this graph.11
While health-related benefit spending was rising steadily throughout the 2010s, the rise in spending accelerated significantly after the COVID-19 pandemic, especially from 2022 onwards. In contrast, (inflation-adjusted) spending on other working-age benefits is virtually at the same level in 2025–26 as it was in 2019–20. This suggests that even if cuts to non-health-related benefits did cause disability benefit receipt to rise in the 2010s, it is difficult to see how they could explain the substantial post-pandemic rise in health-related working-age benefit spending, as non-health-related spending has remained roughly stable.
However, a defining feature of the post-pandemic period has been the high rates of inflation beginning in 2022. A rapid rise in the cost of essential goods and services reduced the real incomes of many low-income households in a similar way to the way the benefit cuts did in the 2010s. It is then possible that if benefit cuts led to a rise in disability benefit receipt, the reductions in real incomes as inflation spiked in 2022 could have had a similar impact. We return to this point in the conclusion.
It is also possible that while the benefit cuts during the 2010s are unlikely to have directly caused a sudden rise in disability benefit receipt in 2022, the resulting thinner social safety net could have amplified the effects of the shocks that followed, such as the pandemic or the cost of living crisis. In this report, we focus on the short-run effect of benefit cuts and leave this point for future research.
3. The impact of cuts to local housing allowance on disability benefit receipt
Policy context
Prior to the introduction of universal credit, which integrated most working-age means-tested benefits together, low-income renters in the UK received cash support for housing costs through a means-tested benefit called housing benefit (HB). In this part of the report, we study a 2011 reform to housing benefit which reduced entitlements for some HB recipients.
Housing benefit is available to low-income working-age renters in both private and socially rented accommodation. In both cases, there is a maximum amount of support a claimant can receive if they have no other income, and this amount is withdrawn as their income increases. For claimants in socially rented housing, the maximum amount of HB a claimant could receive (over the period we study) was equal to their rent. For claimants in privately rented housing, maximum HB was, prior to April 2011, equal to the lower of their local housing allowance (LHA) or their rent plus an ‘excess’ of £15 per week. The LHA rate was equal to the median of local rents among privately rented properties with the number of bedrooms that the family was deemed to need based on family size and structure.
From April 2011, several reforms were implemented that reduced the generosity of HB for private renters:
- Most significantly, LHA rates were reduced from the median (50th percentile) to the 30th percentile of local rents.
- The £15 per week excess was removed.
- Families previously assessed as needing a five-bedroom property were only entitled to the four-bedroom LHA rate.
- Overall national caps on LHA rates were implemented, though in practice these only had effect in parts of central London.
- From January 2012, single claimants under 35 without dependent children were entitled only to the LHA rate that corresponded to living in shared accommodation (previously the age threshold had been 25).
Existing claimants received temporary transitional protection which had the effect of the reforms being steadily rolled out between April 2011 and December 2012 (see Brewer et al. (2019) and Fetzer, Sen and Souza (2023) for a detailed explanation). Importantly for our study design, there were no reforms to housing benefit for social renters until April 2013, when the so-called ‘bedroom tax’ was implemented.
Study design and data
We use a ‘difference-in-differences’ strategy at a local area level to estimate the impacts of these housing benefit reforms. We exploit the fact that they only affected private renters and use social renters as an unaffected ‘control group’. Intuitively, our strategy is to compare how disability benefit receipt changes following the reform in lower super output areas (LSOAs, a low-level geographic area of around 800 households and 2,000 people) where the same share of households are in receipt of HB, but where the share of HB recipients in the private (versus the social) rented sector varies.
Because private and social renters face similar means tests for entitlements to HB, we would expect LSOAs with the same share of HB recipients to be similarly exposed to wider macroeconomic shocks and other policy reforms. But because they have different numbers of private and social renters, those areas that have more private renters on HB are more exposed to the reform than those areas with more social renters on HB. Given this difference in the level of exposure, we can learn about the impact of the reforms by comparing how outcomes differ for the more and less exposed areas before and after the reform.
We use administrative data counts obtained from DWP Stat-Xplore. Specifically, we extract the number of working-age (ages 16–60) claimants of disability living allowance (DLA) in every LSOA in every quarter. We use data on the number of DLA claimants from 2008, when the LHA regime was introduced, to February 2013, just before the introduction of the ‘bedroom tax’ (which reduced HB entitlements for social renters) and before the replacement of DLA with PIP. We also extract data on the number of working-age HB claimants, their average award (amount of HB they receive) and the number who are private renters, in every LSOA and every month. We combine these together with statistics from the 2011 Census on the total number of working-age individuals and households in every LSOA.
Formally, our regression specification is as follows:
where is an outcome for LSOA within local authority in time period t. and are respectively LSOA and time fixed effects, controlling respectively for systematic differences between LSOAs and for trends over time that affect all LSOAs. We also control for time-varying local authority fixed effects (). Local authorities are a bigger geographical unit than LSOAs, with working-age populations of between 20,000 and 700,000 in 2011. Including these time-varying fixed effects helps control for any other geographically concentrated trends that were not captured by the time fixed effects. is the share (between 0 and 1) of all working-age households in LSOA in 2011 (prior to the implementation of the reforms) that were in receipt of HB. This is a control variable, included to ensure that we compare LSOAs with similar shares of households receiving HB. We allow the effect of this to vary over time, therefore allowing for outcomes of LSOAs with more HB recipients to evolve differentially from LSOAs with fewer HB recipients. Finally, is the share (between 0 and 1) of all households in LSOA in 2011 that both received HB and rented privately. This is our measure of exposure to the HB reforms, and so is our parameter of interest.
We run this regression with two key outcome variables: the percentage of all working-age individuals in the LSOA claiming disability living allowance; and the average amount of housing benefit received in the LSOA averaged over all working-age individuals in the LSOA. We construct the latter of these by multiplying average award (amount of HB) among recipients by number of recipients, and dividing this by total number of working-age individuals in the LSOA.
In order for this difference-in-differences approach to identify the causal effect of the HB reforms on DLA receipt, we require a ‘parallel trends assumption’: that is, had these reforms not occurred, DLA receipt in areas with the same number of HB recipients but varying private versus social shares would have evolved similarly (in parallel). We provide evidence for the validity of this assumption by investigating trends in DLA receipt prior to the implementation of the HB reforms.
Results
Figure 3 shows our estimates of the coefficients in the equation above, which measure the impact on DLA caseload of being in an LSOA with a higher share of HB claimants in the private rented sector, compared with an LSOA with the same share of households on HB but more of them being in the social rented sector. In other words, these estimates measure the difference in the prevalence of disability benefit receipt between areas that were more and less exposed to the cuts in HB induced by the reform. We estimate the effect for each quarter, allowing us to compare effects before and after the introduction of the HB reforms.
Figure 3. Estimated impact of share of households both renting privately and on housing benefit on disability living allowance caseload
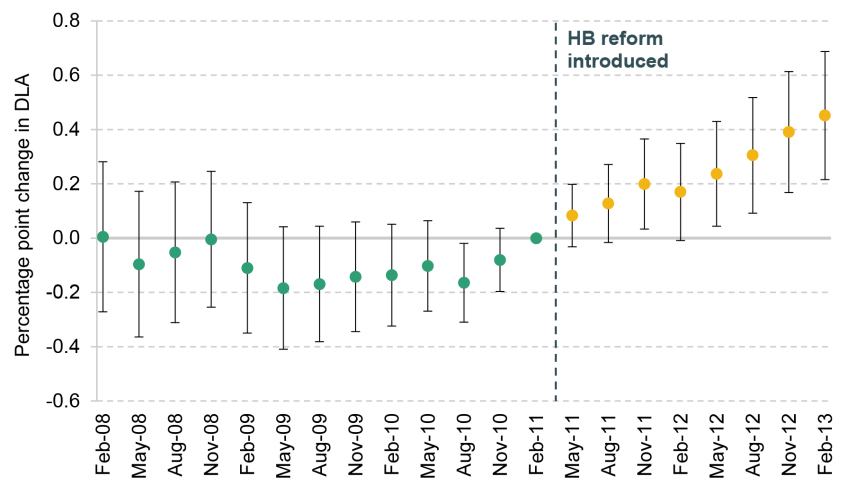
Note: Error bars show 95% confidence intervals. Each point represents coefficient on interaction between share both on housing benefit and renting privately and a quarter dummy. Includes local authority and time fixed effects. Green points show estimates of pre-intervention differences and yellow points show estimates of post-intervention differences. Estimates from a standard two-way fixed effects model.
Source: Authors’ calculations using DWP Stat-Xplore and 2011 Census via Nomis.
Prior to the reform to LHA rates, the coefficients we estimate are stable and near zero. This suggests that trends in the DLA caseload were similar in LSOAs that had the same proportion of households on HB, but differing shares of those HB recipients in the private rented sector. This provides evidence that, for the period before the reform, the parallel trends assumption mentioned above is met.
Turning to the effects after the introduction of the HB reforms, we see that the estimated coefficients are now positive and statistically significantly different from zero from the third quarter after the reform onwards. This means that there was an increase in the share of individuals claiming DLA in areas more exposed to the HB cuts. The estimated coefficient one year after the reform was introduced is 0.17, suggesting that an area with 100% of households on HB and renting privately would see DLA cases rise by an additional 0.17 percentage points as a result of the reform, compared with an area with no households on HB and renting privately. The effect grows when looking at later periods, increasing to 0.45 percentage points after two years.
The fact that the effect is increasing over time is consistent with two features of the policy context. First, as mentioned above, due to the transitional protections, the reform was steadily rolled out between April 2011 and December 2012. Second, there is a time lag between an individual submitting a successful application for disability benefits and actually claiming them. If individuals were only induced to apply once their benefits are reduced, then we would expect to see changes in the DLA caseload some months afterwards. Despite this lag, it appears that the increase in DLA cases begins almost immediately following the reform. This could perhaps be explained by private renters on HB applying for DLA before the reform came into force, since the policy was announced in Summer 2010, several months before the start of the roll-out in April 2011.
As was described in Box 1 earlier, an income elasticity gives us a measure of the magnitude of the change in disability benefit in response to the income cut, and allows us to compare the size of these effects across reforms. In order to estimate the income elasticity of disability benefit claiming, we focus on the results for two years after the reform. Given that, in 2011, 13% (221,000) of individuals in households both on HB and renting privately were in receipt of DLA, the 0.45 percentage point increase from Figure 3 implies a proportional increase in DLA receipt of 3.5% and an absolute increase from 221,000 to 229,000.12 This increased incomes for those induced to claim disability benefits by £5,700 per year, more than offsetting any direct loss from the benefit cut. However, as only 0.45% of those affected responded by claiming disability benefits, increased disability benefit receipt only increased average incomes for those affected by £26 a year.
We run the same regression as above with average HB receipt amount as the outcome, and find that households affected by the reform saw a decline in income of £12.80 per person per week (£667 per year) as a direct result of the cut. This is equivalent to a proportional fall of 3.3%.13 This is partially offset by the £26 per year increase in average incomes due to higher disability benefit receipt. After adjusting for this, the reform reduced average incomes by £642 per year for those affected.
We can divide the proportional change in DLA receipt by the proportional change in income to calculate the implied income elasticity of disability benefit claiming. A 3.5% increase in disability benefits for a 3.3% fall in income gives an income elasticity of –1.1, as shown in this equation:
The findings of this first study suggest that the cuts to housing benefit in 2011 did lead to an increase in disability benefit receipt. The income elasticity we estimate, –1.1, implies that a 1% fall in income led to a 1.1% increase in the probability of claiming disability benefits. It is important to note that this is in terms of proportional changes, implying disability benefit receipt is 1.1% higher than its initial level (rather than 1.1 percentage points higher).
This elasticity estimate is larger in magnitude than most of those found in the international literature on the impact of different shocks to earnings on health-related benefit receipt (Black, Daniel and Sanders, 2002; Charles, Li and Stephens, 2018). One reason for this could be the fact that we focus on a welfare reform – individuals affected by the cut to housing benefit tend to have low incomes and also have experience interacting with the benefit system, which might make them more likely to respond by claiming disability benefits. They may also be more likely to have health conditions that make them eligible for disability benefits. On the other hand, our elasticity could be higher than in other studies due to differences in the disability benefit systems themselves, such as eligibility criteria and assessments.
4. The impact of increasing the female state pension age on disability benefit receipt
Policy context
The state pension age (SPA) has increased significantly over the last 15 years.14 Between 2010 and 2018 the SPA for women rose incrementally from 60 to 65, and between 2018 and 2020 it rose for both men and women from 65 to 66. Once people reach their SPA, they can claim the (non-means-tested) state pension, entitlement to which is based on the number of ‘qualifying years’, where currently those with 35 qualifying years are entitled to the full new state pension. Individuals can build up qualifying years either by being in employment and making National Insurance contributions, or by receiving National Insurance credits due to circumstances such as unemployment, incapacity or caring for young children. The state pension is an important source of income for most pensioners, making up on average 44% of household income of recent pensioners (Cribb, Emmerson and Karjalainen, 2025).
During most of the 2010s, people aged above the female SPA (or couples where one member was above the female SPA) were also eligible for more generous means-tested support than people below the female SPA. On the other hand, over this same period, the age of eligibility for working-age disability benefits was tied to the male SPA, which was 65 from 2010 to the end of 2018.
The substantially lower levels of state support below the SPA mean that increasing the SPA leads to lower household incomes for people in their early and mid 60s (Cribb and Emmerson, 2019). One way people respond to this is by remaining in employment for longer. But a higher SPA may also induce people to apply for disability benefits. People in poor health who previously would not have applied for disability benefits but are affected by the rising SPA may decide to apply now when their income is lower, as the benefit of doing so is higher. This is perhaps a particularly plausible response for those around the SPA, since the incidence of poor health and disability rises with age (Banks, Karjalainen and Waters, 2024) and there is a significant minority of people in their 60s who do not have the health capacity to work (Banks, Emmerson and Tetlow, 2017). Some people also may not have been aware of their eligibility in the past, and the SPA rise could induce them to check their eligibility for other benefits. This increased awareness could also then lead to more applications.
The rising SPA could also have worsened health and therefore increased the number of people eligible for disability benefits. There is some evidence that the rising SPA increased depressive symptoms amongst affected women (Carrino, Glaser and Avendano, 2020), although other evidence suggests the rising SPA improved cognition and reduced physical disability for those in work (Banks et al., 2025).
In this section, we test this hypothesis empirically, examining the effect of increasing the female SPA on women’s disability benefit applications and receipt.15 A key feature of the reforms between 2010 and 2018 (the period we study) was that people could apply for (non-means-tested) disability benefits until their 65th birthday, a date unchanged by the increase in the female SPA. This means that changes to the female SPA that we study had no effect on either eligibility for disability benefits or marginal financial incentives to apply for disability benefits. This allows us to identify the change in disability benefit receipt arising from women having to wait longer for their state pension (and so having lower income on average), rather than a mechanical effect where the eligibility age for working-age disability benefits is changing.
There is existing international evidence showing the importance of ‘programme substitution’ for people in their 60s – where changes to pension eligibility lead to additional disability benefit receipt. Atalay and Barrett (2015) and Rabaté, Jongen and Atav (2024) find spillovers into disability benefits from increasing the pension eligibility ages in Australia and the Netherlands respectively. Staubli and Zweimüller (2013) find that an Austrian reform that increased the ‘early retirement age’ resulted in substantial spillover effects to unemployment insurance, but not the disability insurance programme.
Geyer and Welteke (2021) distinguish between the ‘mechanical’ effect or ‘passive’ programme substitution and ‘active’ programme substitution. Passive programme substitution in this context refers to the fact that a higher pension age increases disability insurance receipt as it simply extends the age range over which people can apply for disability insurance. If in response to the reform people simply continue doing what they were doing previously (e.g. continue applying for disability benefits at the same rate), this mechanical effect will not reduce the fiscal savings from a higher SPA as long as the generosity and/or coverage of the alternative programme are lower than the state pension, as is the case in the UK context. However, active programme substitution, where people change claiming behaviour as a result of a higher SPA and apply for benefits they would not have otherwise applied for, may attenuate fiscal savings. Geyer and Welteke (2021) find that while a large increase in age of pension eligibility in Germany increased both employment and unemployment rates of affected women, there was no active substitution into alternative social support programmes – rather, the employed women remained employed and the unemployed women remained unemployed for longer. The reform we study captures active programme substitution, as there was no change to the age of eligibility for disability benefits.
Study design and data
Over our study period of 2010 to 2018, there were two disability benefits: disability living allowance (DLA) and personal independence payment (PIP). We study both new applications for PIP (as data on DLA applications are not available) and the number of recipients of working-age disability benefits (adding together PIP and DLA recipients) for women as outcomes. Studying PIP applications allows us to more easily assess the timing of changes in disability benefit application behaviour.16 However, to understand whether these applications are successful and thus also reflected in higher benefit receipt, we also use disability benefit receipt as an outcome. This also allows us to study a longer period (from 2010 onwards) – as the PIP roll-out only began in 2013, we cannot study changes in application behaviour before then.
We have administrative data on monthly PIP applications (which include both successful and unsuccessful applications) by sex and age in months, and quarterly DLA and monthly PIP caseloads (number of recipients, reflecting the number of people successfully claiming disability benefits), also split by sex and age in months. These data were provided through a Freedom of Information request to the Department for Work and Pensions (DWP).17
We use data up to December 2018 for women aged 59–64. The figures refer to England and Wales and are rounded to the nearest 10. Age of the claimants and applicants is calculated based on their age on the 6th of the month, meaning that we accurately know whether the people of any given age in months in a given month are above or below the state pension age, as the rise in the SPA happened incrementally on the 6th of the month. We also use ONS data on population by sex and single year of age to calculate benefit recipients as a share of the population.
In order to identify the effect of being above the female SPA on disability benefit applications and receipt, we exploit the gradual increase in the female SPA that began in April 2010. Women born in successive months faced slightly higher SPAs, meaning that while all women eventually reach the SPA, some do so at a later age.
This variation in the age at which women reach the SPA naturally lends itself to a difference-in-differences approach for estimating the impact of being above the female SPA on disability benefit applications and receipt. This methodology is in line with related papers that have assessed the impact of the SPA reform on other outcomes (e.g. Cribb, Emmerson and Tetlow (2016) on employment and Della Giusta and Longhi (2021) on a wide range of outcomes).
Intuitively, our approach tracks women born between 1950 and 1953 who reach the state pension age (our ‘treatment’) at different ages. We compare outcomes for women who are above the SPA with those for women who have not yet reached it (‘untreated’). Specifically, we compare trajectories of disability benefit applications and benefit receipt across the month-and-year-of-birth cohorts reaching the SPA at different ages, and estimate the effect of being above the SPA as the difference in the outcomes between those above and below the SPA (called the ‘treatment effect’). We estimate our results using the approach proposed by Borusyak, Jaravel and Spiess (2024).18
Importantly, a higher SPA could have an effect on disability benefit applications and receipt before people reach their actual SPA. For example, someone only a month away from the SPA may be less likely to apply for disability benefits given the proximity of being able to claim the state pension. We assume that this type of behaviour is limited to the 12 months before women reach the SPA. In our set-up, that means we define the ‘event’ – the point from which we expect the treated and untreated women to begin to be affected differentially by the SPA – as being 12 months before the SPA.
For our results to identify the causal effect of the SPA increase on disability benefit applications and receipt, we need there to be ‘parallel trends’ in disability benefit outcomes by birth cohort – in other words, that the cohorts affected by the change in SPA and those unaffected would have evolved similarly in the absence of the increase in the SPA.
Results
In order to descriptively assess whether the increase in the SPA for women led to an increase in disability benefit applications, Figure 4 illustrates the share of women making a new PIP application each month by single year of age over time. Our data on PIP applications start in 2014, meaning we examine the increase in the female state pension age from 62 to 65. The dashed part of each line shows when the female SPA among the age group was rising. For example, the dashed part of the green line (for 62-year-old women) reflects the months when the state pension age was rising from 62 to 63. Therefore the women of that age to the left of the dashed portion were above the SPA whereas the women to the right of the dashed portion were below the SPA. The figure clearly shows that application rates were increasing when female SPA was increasing for the age group, generally from around 0.10% of the age-specific female population applying in each month, to a little above 0.15% of the age-specific female population applying in each month. These sharp increases in disability benefit applications for those age groups were not matched at the same time by similar changes for the other age groups.
Figure 4. Number of new PIP applications over time, by single year of age for women

Note: The dashed part of each line shows when the female SPA among the age group was rising. For example, the dashed part of the green line (for 62-year-old women) reflects the months when the state pension age was rising from 62 to 63. Therefore the women of that age to the left of the dashed portion were above the SPA whereas the women to the right of the dashed portion were below the SPA.
Source: Authors’ calculations using DWP administrative data.
It is also instructive to examine how these changes in applications have fed through to disability benefit receipt as the state pension age has increased. Figure 5 shows the share of women receiving disability benefits (DLA and PIP) over time, where we have ‘de-trended’19 the prevalence figures over time to make it easier to see how SPA increases relate to disability benefit receipt. Data availability means we can track this outcome back to early 2010, just before the first increase in the state pension age for women started.
Similar to Figure 4, we see the prevalence of disability benefit receipt rising within the 62-, 63- and 64-year-olds, for whom the SPA is increasing. This shows that the increase in applications is also feeding into higher prevalence of disability benefits. We see less of an effect for the younger age groups, who experienced the SPA increase earlier (those aged 60 and 61).
Figure 5. Prevalence of disability benefit receipt among women over time – de-trended, by single year of age

Note: This figure shows the residuals (and constant) from a regression of prevalence on time period (quarter) dummies for the relevant sample. The dashed part of each line shows when the female SPA among the age group was rising.
Source: Authors’ calculations using DWP administrative data.
While these figures provide visual evidence of a relationship between increases in the state pension age for women and disability benefit applications and receipt, in order to better understand the magnitude of these effects, and to calculate income elasticities in line with the other reforms examined elsewhere in this report, we also estimate the impact of increasing the female state pension age on disability benefit applications and receipt using a difference-in-differences methodology, as described in more detail in the previous subsection and Appendix B. It is worth noting that our approach here estimates the effect of being above the SPA on disability benefit applications. Given that increasing the state pension age delays the point at which people are above the state pension, the negative effects shown here imply that increasing the SPA increases the number that apply for disability benefits.
These results are illustrated in Figure 6, which shows how disability benefit applications change in the run-up to and following state pension age. First, the left-hand-side coefficients (shown in green) – showing trends more than a year before SPA (‘period 0’) – are generally close to zero, indicating that there are no significant differences in the application rates before people get within 12 months of their state pension age. This supports our parallel trends assumption. Disability benefit applications then start to fall in the year before SPA (quarters 0–3), and are then stable at a lower level once women have reached the SPA (quarters 4 and later). The treatment effect estimates show that being above the SPA has a negative and significant effect on new PIP applications, of around –0.05 percentage points lower than the baseline mean application rate of 0.09% among women above SPA aged 62–64 in 2014–18. This means that women of a given age who were above the SPA (receiving the state pension) were less likely to apply for disability benefits than women of the same age who were still below the SPA (still waiting to receive their state pension), despite no difference in eligibility to apply for these benefits. In other words, having to wait longer to receive the state pension leads to an increase in disability benefit applications.
Figure 6. Estimated impact of reaching (one year before) state pension age on disability benefit applications (PIP) for women

Note: Error bars indicate 95% confidence intervals. Periods are quarters. Treatment time is defined as being 12 months before the SPA. The estimates on the left are presented relative to the pre-estimation periods, whereas the estimates on the right are shown relative to both the pre-estimation and pre-trend periods. New applications for PIP only. Time period: 2014 to 2018.
Source: Authors’ calculations using DWP administrative data.
Figure 7. Estimated impact of reaching (one year before) state pension age on disability benefit receipt (DLA and PIP) for women
Note: Error bars indicate 95% confidence intervals. Periods are quarters. Treatment time is defined as being 12 months before the SPA. The estimates on the left are presented relative to the pre-estimation periods, whereas the estimates on the right are shown relative to both the pre-estimation and pre-trend periods. Disability benefit receipt refers to DLA and PIP added together. Time period: 2010 to 2018.
Source: Authors’ calculations using DWP administrative data.
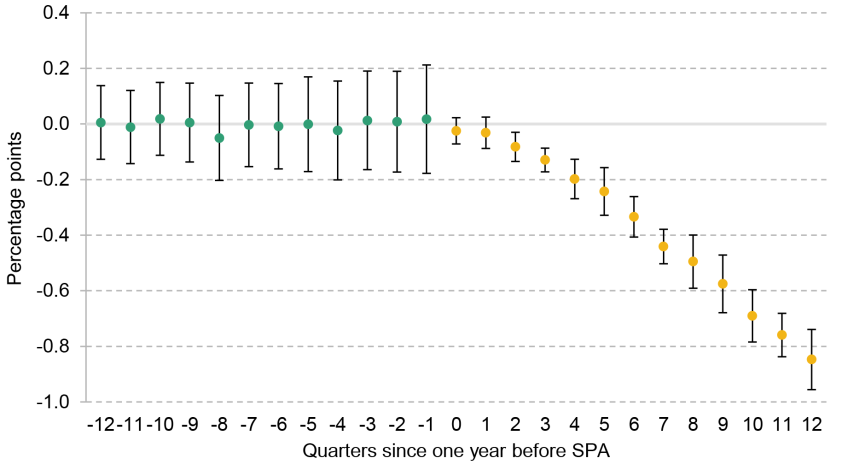
Figure 7 shows the same analysis as in Figure 6, except this time examining the effect of reaching the state pension age on the likelihood of being in receipt of (rather than applying for) disability benefits. Again, the left-hand-side ‘pre-treatment’ coefficients show that, more than a year prior to reaching the SPA, there are no systematic differences in the disability benefit caseload trends between those with different SPAs. The post-treatment estimates show that being above the SPA has a negative and significant effect on the likelihood of receiving disability benefits. In other words, this figure shows that increasing the SPA leads to an increase in disability benefit prevalence among the affected group. This effect gets larger over time – the falling prevalence is consistent with the consistently lower application rate.
In order to get a sense of the average effect, and to enable us to calculate the income elasticities using this analysis, we calculate the average treatment effects from Figures 6 and 7, by taking the average of the treatment effects for the first three years of being above the SPA. These are shown in Table 1.
Table 1. Average treatment effects of being above the state pension age on disability applications and receipt

Note: 95% confidence intervals in brackets. * p<0.05, ** p<0.01, *** p<0.001. Average treatment effect on the treated (ATT) across all treated observations, excluding the year immediately before reaching the SPA (and periods further than three years from SPA). Estimates can be interpreted as percentage point effects.
Column 1 shows that being above the SPA leads to a statistically significant reduction of about 0.05 percentage points in disability benefit applications, on a baseline prevalence of 0.09% among 62- to 64-year-olds above SPA in 2014–18. Column 2 shows the average treatment effect corresponding to Figure 7. In columns 3 and 4, we also split the sample into a later and earlier period (2014–18 and 2010–13) to show how the effects have changed over time. Column 3 shows that the average treatment effect for the later period is 0.6 percentage points. The effect for the earlier period (2010 to 2013) is smaller in magnitude at 0.3 percentage points.
In order to create an estimate of the magnitude of these effects that we can compare with the other reforms studied in this report, we calculate an income elasticity of disability benefit receipt.20 We use the estimates from the period 2010–18. The baseline income and caseload among women aged 60–64 who were above the SPA in 2010–18 was £778.91 per week (in 2025–26 prices) and 11.4%, respectively.
In order to calculate a comparable elasticity to the other reforms, we want to use the estimates of effects two years after reaching the state pension age. When estimating the change in disability benefit receipt focusing on the 2010–18 period, the effect on receipt two years after reaching the SPA is 0.85 percentage points, meaning the percentage change in caseload was an increase of 7.4%. The change in individual-level state benefit income (excluding disability benefits) as a result of the increase in the SPA was a reduction of £156.24 per week on average, meaning a reduction in total income of 20.1%.21
To calculate the implied income elasticity of disability benefit claiming, we divide the proportional change in DLA receipt by the proportional change in income. A 7.4% increase in disability benefits for a 20.1% fall in income gives an income elasticity of –0.37.
Compared with the income elasticities obtained from the other reforms we study, this figure is considerably smaller in magnitude. One reason for this might be differences between the people affected by the different reforms. The increase in the SPA affects all women in their early 60s between 2010 and 2018, whereas the other reforms we study only affect people receiving means-tested benefits. People on means-tested benefits are less likely to be able to absorb an income cut through other means – such as drawing on savings or reducing consumption – so may be more likely to apply for disability benefits to replace their lost income.
Another reason that the SPA rise has a smaller effect on disability benefit receipt relative to the other reforms we study is the nature of the income cut. It delays the point at which people can start receiving their state pension, rather than cutting the amount once people are already in receipt of it. It may be that those who see a cut to their existing state support (as with the reforms studied in Section 3 and 5 of this report) are more likely to seek other sources of benefit income, compared with those who experience a delay in seeing their state support rising (as with the increase in the SPA).
5. The impact of lowering the benefit cap on disability benefit receipt
Policy context
In April 2013, the government introduced the ‘benefit cap’, which limited total receipt of benefits among working-age households to £26,000 per year (£18,200 for single claimants without children). In November 2016, this cap was lowered to £23,000 for households living in Greater London and to £20,000 for the rest of Great Britain (£15,410 and £13,400 respectively for single claimants without children). In practice, the cap primarily affects those with both significant rents and several children.22
Those in receipt of disability living allowance or personal independence payment, or some other health-related benefits including incapacity benefits and carer’s allowance, are not subject to the cap; nor were those in receipt of (the now discontinued) working tax credit.23 In this section, we will refer to the health-related benefits (not working tax credit) that confer exemption from the benefit cap as ‘exempting benefits’. For those who had been continually working for at least a year prior to losing their job, there is also a ‘grace period’ of nine months during which the benefit cap is not applied.
Importantly for the interpretation of our results, exemption from the benefit cap affects the financial return to receiving disability benefits. Exempt households do not have their total benefits limited at all, meaning that the total increase in benefit income from claiming disability benefits is equal to the amount of benefits lost due to the cap, as well as the value of the disability benefits themselves. For example, take a family (outside London) who would have received £21,000 per year in (non-disability benefits) without the benefit cap policy, but due to the cap they receive only £20,000. If they were to successfully claim disability benefits, in addition to receiving the income from the disability benefits, they would also become exempt from the benefit cap and therefore receive an additional £1,000 of non-disability benefits.
As a consequence, the impact of the lowering of the benefit cap on disability benefits will be driven by an increase in the value of disability benefits, as well as the fall in incomes. This means that the elasticity of claiming disability benefits in this context captures both ‘substitution effects’ (as a result of the higher marginal financial incentive to claim disability benefits) and ‘income effects’ (as people change their behaviour when faced with lower incomes). Given that both of these effects would be expected to increase disability benefit receipt in response to a benefit cut, we expect the elasticity measure from this reform to be higher than if a pure income effect was being estimated. We will need to take this into account when comparing the estimates from this study with the estimates from other contexts where the reform only changes income, rather than the potential gain from claiming disability benefits.
Study design and data
Our approach begins by drawing upon an existing evaluation of the effects of the benefit cap on exempting benefit receipt by the Department for Work and Pensions (2023). Using administrative benefits data, DWP constructed a treatment group of those whose benefit income was above the new (lower) cap but below the old (higher) one – and so had become subject to the cap because of the reform. This group was compared with a control group made up of those whose benefit income was £0–25 per week below the new lower cap, and so were not (quite) affected by the reform. Both the treatment and control groups are selected from families that were not receiving an exempting benefit at the time of the implementation. To estimate the impacts of the lower benefit cap, DWP compared outcomes for the treatment and control groups from 12 months before to 12 months after the implementation of the lower cap.
In order for this method to robustly recover the causal impact of the benefit cap lowering on disability benefit receipt, it needs to be the case that the treatment and control groups (those affected and unaffected by the new cap) would have had similar trajectories in disability benefit receipt, absent the reform. Suggestive evidence for the validity of this assumption can be found by examining their trajectories prior to the implementation of the reform.
We use the results from this evaluation to obtain the effect of the lower cap on the likelihood of claiming DLA and PIP. We then combine this with additional information on baseline income and disability benefit claim rates to calculate the resulting elasticities.
Results
We first reproduce figure 5.1 from Department for Work and Pensions (2023), which shows the share of families in receipt of an exempting health-related benefit (including disability benefits) in a two-year window around the roll-out of the lower benefit cap. The series for the treatment group – those affected by the lower benefit cap but not the original higher benefit cap – is shown by the green line in Figure 8. The yellow line plots outcomes for the control group, those receiving benefit amounts just below the lower cap.
Figure 8. Share of households in receipt of exempting benefit, from 12 months before to 12 months after roll-out of the lower benefit cap

Source: Reproduced from figure 5.1 of Department for Work and Pensions (2023).
By construction of the treatment and control groups, no families are receiving an exempting benefit at the time of the policy introduction in month ‘0’ since roll-out. Over the year preceding the introduction, the share of families receiving an exempting benefit in both the treatment and control groups was declining. This is a consequence of selecting a sample of families who were not receiving exempting benefits at the time of roll-out – the further back in time we go before the roll-out, the more likely it is to have households claiming an exempting benefit that they stopped receiving before the lowering of the cap. Figure 8 shows that the shares receiving an exempting benefit in the treatment and control groups were similar in the lead-up to the introduction. As mentioned above, this supports our assumption that exempting benefit receipt among the treatment group would have followed a similar trend to the control group if the benefit cap had not been lowered.
After the lowering of the benefit cap, we see that there was a rise in the share receiving an exempting benefit among both the treatment and control groups. Part of this is the inverse of what we saw for the estimates before the roll-out – as time goes on, there is more time to claim an exempting benefit – but we observe a bigger rise among the group of families affected by the lower benefit cap. After 12 months, the share of families that were affected by the cap receiving an exempting benefit was 2.3 percentage points (33%) higher than the share among families in the control group. Under our assumption that the treatment group would have followed the same path as the control group in the absence of the benefit cap reform, this is the impact of lowering the benefit cap on receipt of exempting benefits.
For the purposes of calculating the income elasticity of the reform on disability benefit receipt, we need to know the proportional change in disability benefits. DWP estimates the impact of the lowering of the benefit cap on the proportion of families receiving disability benefits using the same approach as for all exempting benefits described above. The first row of Table 2 shows the estimates of the effect of lowering the benefit cap on all exempting benefits and on disability benefits (DLA or PIP), focusing on the effect after 12 months. The second row shows the counterfactual baseline, which is the proportion of families in the control group receiving an exempting benefit after 12 months. The ratio of these is the percentage increase in likelihood of claiming those benefits and is reported in the third row. The proportional increase in working-age disability benefit receipt that we estimate is 20%, around two-thirds the size of the estimate for all exempting benefits. The larger effect on all exempting benefits is explained by larger increases in households claiming carer’s allowance and child disability benefits, although the impact on incapacity benefit receipt was smaller than the impact on disability benefits.
Table 2. Impact of lower benefit cap on all exempting benefits and disability benefits

Source: Figure 5.1 of Department for Work and Pensions (2023) and additional supplementary data provided by DWP.
Drawing upon information in Department for Work and Pensions (2023), we estimate that, for families affected by the lower cap only, the cap policy reduced income by 11%.24 Similar to the previous reforms we have studied, dividing the effects on claiming exempting benefits by the effect on income gives us an income elasticity. These are reported in Table 3 for claiming any exempting benefit and for claiming DLA or PIP. The elasticity of claiming disability benefits is –1.8, suggesting that a 1% decline in income increases the likelihood of claiming disability benefits by 1.8%.
Table 3. Implied elasticity of claiming exempting benefits or disability benefits

Source: Authors’ calculations using Department for Work and Pensions (2023).
The elasticity estimated here is larger in magnitude than we find for either of our other studies. As mentioned at the beginning of this section, this will partly be due to the fact that the financial incentive to apply for disability benefits increases as a result of the reform, since they confer exemption to the benefit cap and will thus increase income from non-health-related benefits as well as the income from the benefit themselves. This means that the elasticity estimated here is not directly comparable to the previous elasticities. That said, this example still highlights that reforms to other parts of the welfare system can have a significant impact on the decision to claim disability benefits.
6. The impact of job search conditionality on incapacity and disability benefit receipt
Policy context
Out-of-work benefit claimants are typically required to look for work and attend regular meetings at a Jobcentre Plus to prove they are looking for work – a policy sometimes referred to as ‘job search conditionality’ or simply ‘conditionality’. Those who do not attend meetings or who are deemed to be doing an insufficient amount of job search can have their benefits reduced through a ‘sanction’. Exemptions from conditionality can be provided for those assessed as having a limited capability for work due to ill health and for those with significant caring responsibilities.
Prior to 2008, single parents could claim income support – an out-of-work benefit without any job search conditionality requirements – as long as their youngest child was 15 or younger. Between 2008 and 2012, that age threshold was cut over four phases – to 11, then 9, then 6, then 4, a policy known as the ‘lone parent obligation’. Single parents who lost eligibility to income support could instead claim jobseeker’s allowance, another out-of-work benefit that provided the same financial entitlements as income support, but required its claimants to look for work. The effect of the reform was therefore to apply job search conditionality to a wider group of single parents.
The intended goal of the lone parent obligation was to encourage more single parents into work. Another possible way they could respond, however, was to claim incapacity benefits (the key one at the time being employment and support allowance, ESA), since these come with no or only very limited job search requirements.
Study design and data
In this section, we summarise the results of Codreanu and Waters (2023), who study the lone parent obligation. An earlier study of the first three phases of the lone parent obligation (Avram, Brewer and Salvatori, 2018), using a different design and data, also found directionally similar results.
Because the lone parent obligation affects single parents with different-aged children at different times, it is suitable for a ‘staggered difference-in-differences’ design, using the Borusyak, Jaravel and Spiess (2024) estimator, which is discussed in Section 4 and Appendix B in the context of estimating the effects of the increase in the female state pension age. Two groups of single parents are unaffected by the policy: those with a youngest child aged 16–18 (who were already subject to conditionality prior to the policy) and those with a youngest child aged 0–4 (who were still not subject to conditionality even after the policy’s implementation25). Codreanu and Waters (2023) use these two groups, and any other single parents whose youngest child’s age means they are not yet affected by the lone parent obligation, as the control group. These are then compared with single parents who have become subject to conditionality because of the reform – the treatment group. This design is applied using several survey datasets (the Labour Force Survey, the Family Resources Survey, and the UK Household Longitudinal Study).
For this approach to identify the causal impact of the reform, it needs to be the case that, absent the policy, trends in employment and benefit outcomes would have evolved similarly for single parents with different-aged children – the ‘parallel trends assumption’.
Results
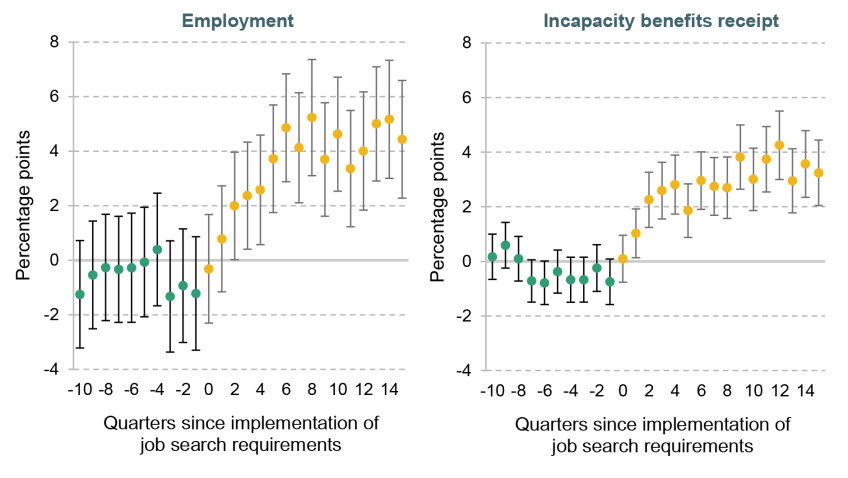
The key results from the analysis by Codreanu and Waters (2023) for the purposes of this report are presented in Figure 9, which shows the effects of the policy on employment and the claiming of incapacity benefits among all single mothers with a child aged 5–15. The green ‘pre-testing’ series check whether the trends in the outcome for the treatment and control groups are similar prior to the implementation of the policy. The fact that they are stable and close to zero is evidence supporting the parallel trends assumption. The yellow ‘estimated treatment effect’ series show the estimated effect of the policy on the outcomes, with the employment rate in the left-hand panel and the incapacity benefit claim rate in the right-hand one. Shortly after the policy is implemented (at the ‘0’ point on the horizontal axis), both employment and incapacity benefit claiming begin to rise, plateauing at around six quarters after the implementation of the reform.26
The introduction of the job search conditionality increased the share of single parents in work by 4.4 percentage points and the share claiming incapacity benefits by 3.3 percentage points. In other words, for every four people the policy got into work, it got three onto incapacity benefits. Codreanu and Waters (2023) also show a small effect on disability benefit claiming (0.7 percentage points). Moreover, they find that because claiming incapacity or disability benefits raises benefit entitlements (relative to being on income support alone), and because the work that the newly employed parents got into was generally part time and low paid (meaning they still received in-work benefits and paid little in tax), the policy made no significant fiscal saving.
Figure 9. Impact of the lone parent obligation on employment and incapacity benefit receipt
Note: Results for single mothers with a child aged 5–15. Error bars indicate 95% confidence intervals. The estimates in green are estimated relative to the pre-estimation periods, whereas the estimates in yellow are estimated relative to both the pre-estimation and pre-trend periods.
Source: Adapted from figure 3 of Codreanu and Waters (2023).
Unlike the other reforms studied in this report, the lone parent obligation was not a cut in financial support. But it was still a cut in what we might broadly think of as the ‘value’ of a non-health-related benefit as the costs associated with claiming increased: searching for work and attending Jobcentre Plus meetings take time, and claimants also face a higher risk of sanctions. This therefore makes incapacity benefits more ‘valuable’, in relative terms. Consistent with what we found for the other three reforms, these findings highlight that some claimants respond to cuts to the non-health-related benefits system by claiming health-related benefits.
7. Implications of results for other non-health benefit cuts
Comparison of results across reforms
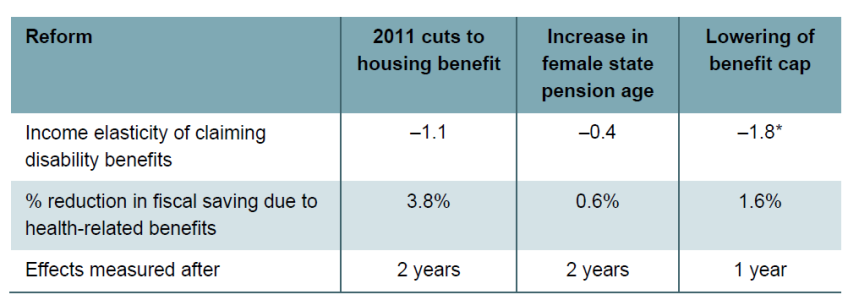
In this report, we have examined the extent to which reforms to other parts of the benefit system affected the number of people claiming health-related benefits. In all four of the settings that we study, we find that benefit cuts led to an increase in the number of people claiming health-related benefits. The extent to which this happened varied across different contexts, as shown in the first row of Table 4. The income elasticity of claiming disability benefits in response to cuts to housing benefit was almost three times as large in magnitude as the elasticity implied by the reform to the female state pension age (–1.1 versus –0.4). These two studies are most comparable, since both involve a cut to income (from housing benefit or state pension) without a significant change to the financial return to claiming disability benefits. In the study of the lowering of the benefit cap, where being affected by the policy also increased the value associated with claiming disability benefits, the scale of the effect is even larger, as one might expect. The example of the lone parent obligation highlights that these effects are not limited to policies that cut the cash value of other benefits.
Table 4. Fiscal savings from benefit reforms, accounting for changes in health-related benefits
*Benefit cap elasticity is an upper bound.
Note: When calculating fiscal savings, we assume that average disability benefit receipt among those affected by benefit reforms is the same as the average among all disability benefit recipients.
Source: Authors’ calculations using DWP administrative data, 2011 Census via Nomis and Department for Work and Pensions (2023).
The fact that some individuals are induced to start claiming health-related benefits reduces the fiscal saving from benefit changes compared with if there were no such response, due to the increase in spending on disability benefits. The middle row of Table 4 reports the percentage reduction in fiscal saving for the three cuts to benefit amounts that we study. The first column shows that accounting for the increase in disability benefits reduces the fiscal saving from the cuts to local housing allowance by 3.8%. By contrast, the short-term effect of increased disability benefit claims on the fiscal saving from the change in the female state pension age is almost negligible. Although the elasticity of claiming disability benefits is largest for the lowering of the benefit cap, the impact on the fiscal saving is much smaller than for the local housing allowance change.
These estimates do not capture the full spillover effects from non-health-related benefit cuts to health-related benefits for two reasons. First, they only capture the short-term fiscal spillover effects of increased disability benefits. The long-term fiscal spillover effects may be bigger or smaller. This is particularly important for the increase in state pension age, where there is good reason to think the long-term effects are larger than the short-term effects – the SPA increase leads to a temporary income cut for those affected, but is likely to have a lasting impact on disability benefit receipt as those who start receiving working-age disability benefits before SPA can continue receiving them also above SPA as long as their care or mobility needs continue, which often means receiving these benefits until death (Lane Clark and Peacock, 2023).
Second, there may be additional spillover effects through higher incapacity benefit or higher carer’s allowance spending. We have two examples of this from our work. When the lone parent obligation was introduced, more people moved onto incapacity benefits following the reform than moved onto disability benefits. The lowering of the benefit cap also increased the number of people claiming incapacity and carer benefits, as well as disability benefits.
Despite these two limitations, our estimates still provide a sense of scale for the size of fiscal spillovers from non-health-related benefit cuts to disability benefit receipt.
Modelling the impact of all non-health-related benefit cuts on disability benefit receipt
We can also use the results from these studies to provide an estimate of the indirect effects of all personal tax and benefit policy changes since 2010–11 on disability benefit receipt. We include taxes here since, as they also affect disposable incomes, one would expect them to have a similar effect to benefits. In practice, however, it makes little difference to our results, since the large proportional changes in income since 2010–11 have been induced by benefit reforms. We apply the elasticity derived from the 2011 housing benefit reforms (Section 3) to estimate the spillover effect of changes to non-health-related benefits and direct taxes between 2010–11 and 2019–20 (Section 2) on disability benefit receipt. We use the elasticity from the 2011 housing benefit reform as, of the three non-health benefit cuts we study, this most closely represents the overall cut to non-health-related benefits we have seen since 2010 – it only affects means-tested benefit claimants (unlike the SPA rise) and does not change the cash reward from claiming disability benefits (unlike the lowering of the benefit cap). We do this separately by income decile because non-health benefit cuts disproportionately fell on low-income households who are also more likely to claim disability benefits. More detail on these calculations is available in Appendix D.
We estimate that changes to tax and benefit policy between 2010–11 and 2019–20 – excluding disability benefit changes – increased the number of people claiming disability benefits by 130,000 (0.3% of working-age adults). This is a 7% increase in the number of people receiving disability benefits relative to 2010–11. This increases the fiscal cost of disability benefits by £900 million in real terms, an 8% increase relative to 2010–11 spending.
While these disability benefit rises are substantial in absolute terms, they are fairly small relative to the broader changes in the benefit system since 2010–11. We estimate that the additional £900 million in spending due to the indirect effect on disability benefits offsets 5% of the £20 billion in direct savings due to benefit reforms between 2010–11 and 2019–20.27 It also explains 13% of the £7 billion increase in disability benefit spending over that time. This effect worked against the then government’s stated aim to try to reduce disability benefit spending.
These modelled figures should be thought of as indicative of the likely scale of effects rather than precise estimates. If we used elasticities from the other reforms we studied, the estimated increase in receipt could range from 43,000 to 210,000 at a cost from £306 million to £1,497 million, and it is also possible that the true effect could be larger or smaller than this range if the effects of other benefit cuts differed from the ones studied here. However, the true effects would need to be orders of magnitude bigger than our estimates if non-health benefit cuts were to fully explain the rise in disability spending seen during the 2010s.
8. Conclusion
Our findings offer a broad lesson for policymakers – changes to the benefits system can rarely be made in isolation. A change in the generosity of one part is likely to have knock-on effects on the rest, and the hoped-for savings from benefit cuts are likely to be, to a small but meaningful degree, undermined by offsetting rises in disability benefit receipt.
These spillover effects from non-health-related benefit cuts to disability benefits are also important because they change the type of support that people get. First, they mean that more people go through the application process for disability benefits, which requires a considerable amount of work and which some claimants report to be stressful (Department for Work and Pensions, 2018). Second, our results suggest that each cut to non-health-related benefits tips the balance of the benefit system towards health-related benefits, both through the direct cuts to non-health benefits and due to the indirect increase in disability benefits.
This may be a positive outcome if the government thinks that disability benefits are the best available support for those induced to claim. However, in some cases, it could lead to people claiming disability benefits who would have been better supported by other bits of the system. This is particularly true as people often claim disability benefits for many years, and policymakers might worry about how receipt of these benefits might change people’s behaviour. For example, while it is possible to do paid work at the same time as claiming disability benefits, qualitative evidence suggests that many recipients worry about losing access to disability benefits if they start work (Department for Work and Pensions, 2025). For these reasons, the government should take the spillover effects into account when making future policy decisions about the level of support provided by the benefit system independent of health conditions.
One explanation for our results is that cutting people’s incomes worsens their mental and/or physical health. This worsening in health could then lead those affected to claim disability benefits. More investigation is needed to know whether this is the case, as there are alternative explanations for our results, such as increased take-up amongst the already disabled. The government should do more work to understand how benefit cuts impact health and take these potential health effects into account when making future policy decisions around benefit levels.
In terms of understanding benefit trends, our results suggest that while non-health-related benefit cuts do explain some of the post-2010 rise in disability benefit spending, they only explain a minority. Part of the reason is that almost all of the net cuts to non-health benefits occurred in the 2010s, while the big growth in disability benefits began in 2021 where the cuts are unlikely to have played a major role.28
A combination of other factors likely contributed to the post-2010 rise in disability benefit spending. First, and most prosaically, part of the increase is due to the increasing size of the working-age population.29 The working-age population increased due to an underlying increase in population and due to the rising state pension age which classifies more people as working-age. Overall spending on disability benefits for working-age adults and children grew by 192% between 2010 and 2025, while spending per working-age adult grew by 151%.
Second, there is some evidence that health, and especially mental health, has worsened since the pandemic. This is also likely to have contributed to the rise in disability benefits, and is consistent with the composition of the disability benefit caseload shifting towards mental health. (Latimer, Ray-Chaudhuri and Waters, 2025.)
Third, some people may have responded to the sharp rise in the cost of living between 2021 and 2023 by claiming disability benefits to supplement their income. This report shows that disability benefit receipt increases when people’s incomes fall through benefit cuts. Unexpected price rises also cut households’ real-terms incomes, so we might likewise expect disability benefits to rise in response. The price rises have particularly hit those on low incomes who spend a larger share of their overall expenditure on gas, electricity and food, which saw the largest price increases, and who are also most likely to claim disability benefits (Cribb et al., 2024; Chen, Levell and O’Connell, 2025). While this issue certainly merits more research, our results suggest that this fall in real incomes is likely to explain part of the rise in disability benefit receipt since 2019.
Appendix A. Correlation between changes to tax and benefits and changes in disability benefit claims
Methodology
To study the impact of tax and benefit reforms, we first define groups based on families’ demographic characteristics. Box A1 describes how we define the groups in more detail.
Box A1. Defining groups of families
We restrict our sample to families with adults aged at least 25 and below state pension age throughout the period of analysis (under 60 for women, under 65 for men). We define groups based on the following set of characteristics, which we observe in both of the survey datasets that we draw upon (the Family Resources Survey and the Quarterly Labour Force Survey):
- single/couple;
- number of children (0, 1, 2, 3+);
- tenure (owner-occupier, social renter, private renter);
- education (GCSE or below, A level or equivalent, degree or equivalent);
- age of oldest family member (25–39, 40–49, 50+).
For example, lone parents with one child, living in private rented accommodation, with education up to A levels and aged 25–39 are one group.
To model the impact of all reforms on each group, we take data from three years of the Family Resources Survey, 2008–09 to 2010–11, and assign the families in these data to one of our groups. We then use TAXBEN, the IFS tax and benefit microsimulation model, to calculate the average household income for each group under the 2010–11 tax and benefit system and under the 2019–20 tax and benefit system.30 Our measure of the impact of reforms to the tax and benefit system during the 2010s for each group is the percentage change in income between the 2010–11 and 2019–20 systems.
Our outcome of interest is the proportion of families within each group with at least one family member claiming disability benefits. The disability benefits we include are disability living allowance (DLA) and personal independence payment (PIP). We draw upon the Quarterly Labour Force Survey (QLFS), calculating for each group the proportions of families in 2010–11 and 2019–20 receiving disability benefits, and then the percentage difference between the two.
One critical issue with using the QLFS for this analysis is that the aggregate disability benefit trends do not match those seen in the administrative data (QLFS shows a 3% decrease in the proportion of 16- to 64-year-olds receiving disability benefits between 2010 and 2019 whereas official data show that the share receiving disability benefits actually rose in proportional terms by 10%). While this does not necessarily invalidate our strategy, it does mean that these results should be treated with some scepticism. If the undercount of disability benefits in QLFS is larger for certain family types than others, this would lead our estimates to be biased.
Results
Figure A1 plots, for each group, the percentage change in the share of families claiming disability benefits against the percentage change in average income due to tax and benefit reforms between 2010–11 and 2019–20. We exclude any groups for which we observe fewer than 25 families in either the FRS or QLFS data. The horizontal spread of the dots highlights that the impact of tax and benefit reforms over the 2010s varied widely across our different groups. For some, tax and benefit reforms increased average incomes by more than 3%, whereas for others the reforms reduced average incomes by more than 10%. We also observe a large spread in the vertical direction, which reflects variation in group-level changes in disability benefits. Some of this can be attributed to sampling variation, as our calculations rely on relatively small samples of different families in both 2010–11 and 2019–20. This differs from our calculations for income changes which use the same families but different tax and benefit systems. Given this caveat, there does not appear to be a systematic relationship between the impact of tax and benefit reforms during the 2010s and changes in claims to disability benefits.
To test more precisely whether there is a statistical relationship between changes in disability benefit claims and changes in income due to tax and benefit reforms, we run regressions at the group level of the percentage change in disability benefits on the percentage change in income. This is equivalent to estimating the slope of the line of best fit for the points in Figure A1. We use weights so that groups that represent a larger proportion of families are given higher weight than those that are less prevalent. The first column of Table A1 shows the estimated relationship when we use all groups, and the second column shows the relationship when we restrict to groups with at least 25 observations (as we do in Figure A1). They are similar, with the latter suggesting that a group that saw income rise by 10% due to tax and benefit reforms would see disability benefit claims rise by 3.74%. There is a high degree of imprecision in these results though, as highlighted by the large standard errors. A standard error of 1.038 indicates that we can only be confident that the estimated elasticity is not just driven by variation in the data if it were larger in magnitude than 2. This implies that the elasticity could be bigger in magnitude than the biggest we estimate (–1.8 for the lowering of the benefit cap policy) and we would still be unable to confidently state there was an effect. As a result, it is difficult to learn much from this analysis.
Figure A1. Percentage change in disability benefits versus percentage change in income due to tax and benefit reforms between 2010–11 and 2019–20

Note: QLFS under-records the rise in disability benefits during the 2010s. Each point represents a group defined based on demographic characteristics (see Box A1). We drop groups for which we observe fewer than 25 families in FRS or QLFS.
Source: Authors’ calculations using Quarterly Labour Force Survey 2010Q2–2011Q1 and 2019Q2–2020Q1, Family Resources Survey 2008–09 to 2010–11 and TAXBEN, the IFS tax and benefit microsimulation model.
Table A1. Estimated relationship between percentage change in disability benefits and percentage change in income due to tax and benefit reforms, 2010–11 to 2019–20

Note: Standard errors shown in parentheses. Groups weighted based on sample weights from Quarterly Labour Force Survey 2010Q2–2011Q1.
Source: Authors’ calculations using Quarterly Labour Force Survey 2010Q2–2011Q1 and 2019Q2–2020Q1, Family Resources Survey 2008–09 to 2010–11 and TAXBEN, the IFS tax and benefit microsimulation model.
Appendix B. Estimating the effect of increasing the SPA for women
We use a staggered difference-in-differences methodology to estimate the impact of being above the female SPA on disability benefit prevalence and new applications, comparing women aged 59–64 across different cohorts. We also use this methodology to estimate the effect of the rising SPA on state (non-disability) benefit income as the outcome, using data from the Family Resources Survey. We use this estimate for the income elasticity calculations.
The descriptive evidence in Figures 4 and 5 suggests that the treatment effects may vary over time. It has become widely understood that in the presence of heterogeneous treatment effects and staggered treatment, the two-way fixed-effects estimation approach can provide misleading estimates of the true treatment effect. Thus we run our results using the estimation approach proposed by Borusyak, Jaravel and Spiess (2024; henceforth ‘BJS’).
The BJS estimator is used to estimate the causal effects of a binary treatment when treatment roll-out is staggered and treatment effects potentially heterogeneous. The treatment in our setting is being above the SPA. Each cohort (based on month and year of birth) gets treated in a different period – some cohorts are never treated (those who do not reach the SPA over the observation period).
We can denote the potential outcome of cohort who are never treated (always under the SPA) as . The causal treatment effect for this cohort is then . The overall treatment effect is then the average of these observation-level treatment effects for cohorts over SPA.
The BJS estimator can be represented as an imputation procedure. The first step involves specifying a model for the potential outcome and estimating the parameters of this model. We specify this model as
where and are cohort and time-period fixed effects, measured in quarters of time and birth. The parameters , and are estimated in the first step using ordinary least squares (OLS) on the sample of all untreated observations.
In the second step of the procedure, is estimated as for all treated observations. Cohort-specific treatment effects are then estimated as . The overall average treatment effect is obtained as the average of these cohort-specific treatment effects over all treated observations. We also show the average treatment effect at event time by averaging the estimated treatment effects only for the set of treated observations that are periods post-treatment. We follow the methodology outlined in Borusyak, Jaravel and Spiess (2024) to calculate standard errors clustered at the month-of-birth cohort level.
Appendix C. Other reforms
Alongside the four reforms analysed in this report, we experimented with analysis for two further reforms: the two-child limit and the removal of the work-related activity group amount.
In the case of the two-child limit, we obtained (via Freedom of Information request) data from August 2024 on the number of universal credit claimants with a third or subsequent child born around the implementation of the policy, split by the month of the child’s birth, whether the family received disability benefits and whether their universal credit entitlement exceeded the child element for one child. Our plan had been to compare those with a third child born a little before April 2017 and those with a third child born a little after (a regression discontinuity design). We did not have data on those who did not claim universal credit, including those still on tax credits. There seemed to be ‘bunching’ in the number of universal credit claimants with a third child born just before the implementation of the policy, which renders a regression discontinuity approach invalid, and so we did not take the analysis further.
In the case of the cut to support for those in the work-related activity group, evaluation is significantly hampered in two ways. First, the policy was announced almost two years in advance of implementation. Based on the administrative data available, this seems to have resulted in more people applying for employment and support allowance – who would eventually be assigned to the work-related activity group – prior to April 2017, potentially indicating that they made their applications earlier than they would have otherwise, thereby changing the composition of future applicants and complicating evaluation. Second, by the time the policy was rolled out, an increasing number of people were being assessed for incapacity through universal credit, but data on universal credit incapacity assessments are not available until April 2019.
Appendix D. Modelled impact of all personal tax and benefit changes on disability benefit claims
This appendix explains how we model the indirect effect of all personal tax and benefit changes on disability benefit claims. First, we use our estimates from Section 2 of the impact of tax and benefit changes on incomes (excluding any changes to disability benefits). Panel A of Figure 1 showed the estimated percentage change in income for different income deciles due to tax and benefit changes between 2010–11 and 2019–20. Tax and benefit changes since 2010–11 have reduced incomes for low-income households, had little effect on average for middle-income households and reduced incomes for those in the richest tenth of households.
Second, we multiply these percentage changes in income by an elasticity to get an estimate of the percentage change in disability benefit claimants by decile. We use three different elasticities (–0.4, –1.1 and –1.8) from the three different non-health-related benefit cuts we studied to give us a range of estimates. We focus on the central estimate, which uses results from the 2011 housing benefit reform. This reform most closely represents all non-health-related benefit cuts in the 2010s as it only affects claimants receiving means-tested benefits and it does not change the cash value of claiming disability benefits. Third, for each decile, we multiply these estimates of the percentage change in disability benefit claims by the baseline share of households claiming disability benefits (see Panel B of Figure 1).
Figure D1. Modelled change in disability benefit claims due to the indirect effects of non-disability-related changes to tax and benefit system between 2010–11 and 2019–20
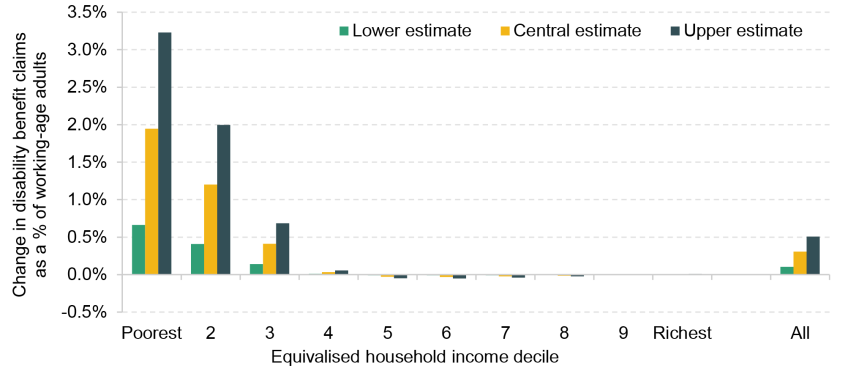
Note: Includes working-age households only. When calculating income deciles, incomes do not include disability benefit income and are equivalised using the OECD equivalence scale. No children are included, although some aged over 16 claim working-age disability benefits. Lower estimate uses elasticity from state pension age reform, central estimate uses elasticity from housing benefit cut and upper estimate uses elasticity from lowering of benefit cap.
Source: Authors’ calculations using Family Resources Survey 2008–09 to 2010–11 and TAXBEN, the IFS tax and benefit microsimulation model; DWP administrative data; ONS population data; and Department for Work and Pensions (2023).
Figure D1 shows our estimates for the change in the share of working-age adults claiming disability benefits across each income decile. We can see that the modelled increase in disability benefit claims is highly concentrated amongst lower-income households. This is for two reasons. First, tax and benefit changes have cut incomes most for lower-income households. Second, at baseline, people in lower-income households are much more likely to claim disability benefits, so a given percentage change in disability benefit claims leads to a larger change in absolute claim numbers for lower-income households than for higher-income households.
The final step in our calculation is to estimate the fiscal consequences of our modelled changes in disability benefits caseload. We do this by scaling up the estimated change in caseload by the population of working-age adults by decile and summing across deciles to get a total change in caseload.31 We then assume each person receives the average PIP award as of July 2025 and multiply that average award by the estimated change in caseload to get an estimate of total increase in spending.
References
Atalay, K. and Barrett, G. F., 2015. The impact of age pension eligibility age on retirement and program dependence: evidence from an Australian experiment. Review of Economics and Statistics, 97(1), 71–87, https://www.jstor.org/stable/43554980.
Autor, D. H., Dorn, D. and Hanson, G. H., 2013. The China syndrome: local labour market effects of import competition in the United States. American Economic Review, 103(6), 2121–68, https://doi.org/10.1257/aer.103.6.2121.
Autor, D. H. and Duggan, M. G., 2003. The rise in the disability rolls and the decline in unemployment. The Quarterly Journal of Economics, 118(1), 157–206, https://doi.org/10.1162/00335530360535171.
Avram, S., Brewer, M. and Salvatori, A., 2018. Can’t work or won’t work: quasi-experimental evidence on work search requirements for single parents. Labour Economics, 51, 63–85, https://doi.org/10.1016/j.labeco.2017.10.002.
Banks, J., Cribb, J., Emmerson, C. and Sturrock, D., 2025. The impact of work on cognition and physical disability: evidence from English women. Labour Economics, 94, 102730, https://doi.org/10.1016/j.labeco.2025.102730.
Banks, J., Emmerson, C. and Tetlow, G., 2017. Health capacity to work at older ages: evidence from the United Kingdom. In D. A. Wise (ed.), Social Security Programs and Retirement around the World: The Capacity to Work at Older Ages, University of Chicago Press. https://www.nber.org/books-and-chapters/social-security-programs-and-retirement-around-world-capacity-work-older-ages/health-capacity-work-older-ages-evidence-united-kingdom.
Banks, J., Karjalainen, H. and Waters, T., 2024. Inequalities in disability. Oxford Open Economics, 3(Supplement 1), i529–48, https://doi.org/10.1093/ooec/odad091.
Black, D., Daniel, K. and Sanders, S., 2002. The impact of economic conditions on participation in disability programs: evidence from the coal boom and bust. American Economic Review, 92(1), 27–50, https://doi.org/10.1257/000282802760015595.
Borusyak, K., Jaravel, X. and Spiess, J., 2024. Revisiting event-study designs: robust and efficient estimation. The Review of Economic Studies, 91(6), 3253–85, https://doi.org/10.1093/restud/rdae007.
Brewer, M., Browne, J., Emmerson, C., Hood, A. and Joyce, R., 2019. The curious incidence of rent subsidies: evidence of heterogeneity from administrative data. Journal of Urban Economics, 114, 103198, https://doi.org/10.1016/j.jue.2019.103198.
Carrino, L., Glaser, K. and Avendano, M., 2020. Later retirement, job strain, and health: evidence from the new state pension age in the United Kingdom. Health Economics, 29(8), 891–912, https://doi.org/10.1002/hec.4025.
Centre for Social Justice, 2025. Sickness benefits pay £2,500 more than a job, new data reveals. https://www.centreforsocialjustice.org.uk/newsroom/cost-of-welfare-2025.
Charles, K. K., Li, Y. and Stephens, M., Jr, 2018. Disability benefit take-up and local labour market conditions. The Review of Economics and Statistics, 100(3), 416–23, https://doi.org/10.1162/rest_a_00692.
Chen, T., Levell, P. and O’Connell, M., 2025. Measuring cost of living inequality during an inflation surge. Institute for Fiscal Studies, Working Paper 25/21, https://ifs.org.uk/publications/measuring-cost-living-inequality-during-inflation-surge.
Codreanu, M. and Waters, T., 2023. Do work search requirements work? Evidence from a UK reform targeting single parents. Institute for Fiscal Studies, Working Paper 23/02, https://ifs.org.uk/publications/do-work-search-requirements-work-evidence-uk-reform-targeting-single-parents.
Cribb, J. and Emmerson, C., 2019. Can’t wait to get my pension: the effect of raising the female early retirement age on income, poverty and deprivation. Journal of Pension Economics and Finance, 18(3), 450–72, https://doi.org/10.1017/S1474747218000057.
Cribb, J., Emmerson, C. and Karjalainen, H., 2025. The future of public pension provision in the UK: challenges and trade-offs. Oxford Review of Economic Policy, 41(1), 153–66, https://doi.org/10.1093/oxrep/graf008.
Cribb, J., Emmerson, C. and Tetlow, G., 2016. Signals matter? Large retirement responses to limited financial incentives. Labour Economics, 42, 203–12, https://doi.org/10.1016/j.labeco.2016.09.005.
Cribb, J., Henry, A., Karjalainen, H., Ray-Chaudhuri, S., Waters, T. and Wernham, T., 2024. Living standards, poverty and inequality in the UK: 2024. Institute for Fiscal Studies, Report R329, https://ifs.org.uk/publications/living-standards-poverty-and-inequality-uk-2024.
Della Giusta, M. and Longhi, S., 2021. Stung by pension reforms: the unequal impact of changes in state pension age on UK women and their partners. Labour Economics, 72, 102049, https://doi.org/10.1016/j.labeco.2021.102049.
Department for Work and Pensions, 2018. Personal independence payment claimant research – final report: findings from three waves of qualitative and quantitative research exploring claimants’ experiences of the PIP claim process. https://assets.publishing.service.gov.uk/media/5b924998ed915d4d716e0403/personal-independence-payment-claimant-research-final-report.pdf.
Department for Work and Pensions, 2023. Lower benefit cap: quantitative analysis of outcomes of capped households. https://www.gov.uk/government/publications/lower-benefit-cap-quantitative-analysis-of-outcomes-of-capped-households/lower-benefit-cap-quantitative-analysis-of-outcomes-of-capped-households.
Department for Work and Pensions, 2025. Applicants’ journeys to claiming PIP: research. DWP Research Report 1091, https://www.gov.uk/government/publications/applicants-journeys-to-claiming-pip-research/applicants-journeys-to-claiming-pip-research.
Fetzer, T., Sen, S. and Souza, P. C. L., 2023. Housing insecurity and homelessness: evidence from the United Kingdom. Journal of the European Economic Association, 21(2), 526–59, https://doi.org/10.1093/jeea/jvac055.
Geyer, J. and Welteke, C., 2021. Closing routes to retirement for women: how do they respond? Journal of Human Resources, 56(1), 311–41, https://doi.org/10.3368/jhr.56.1.0717-8947R2.
Gray, P., 2017. Second independent review of the personal independence payment assessment. https://assets.publishing.service.gov.uk/media/5a7574f140f0b6397f35e915/pip-assessment-second-independent-review.pdf.
Hoynes, H., Joyce, R. and Waters, T., 2024. Benefits and tax credits. Oxford Open Economics, 3(Supplement 1), i1142–81, https://doi.org/10.1093/ooec/odad022.
Judge, L. and Murphy, L., 2024. Under strain: investigating trends in working-age disability and incapacity benefits. Resolution Foundation, https://www.resolutionfoundation.org/publications/under-strain/.
Ko, W. and Moffitt, R. A., 2024. Take-up of social benefits. National Bureau of Economic Research, Working Paper 30148, https://doi.org/10.3386/w30148.
Lane Clark and Peacock, 2023. Could early intervention prevent a retirement disability benefit timebomb? LCP on point paper, https://www.lcp.com/media/v4zh5a2x/could-early-intervention-prevent-a-retirement-disability-benefit-timebomb.pdf.
Latimer, E., Pflanz, F. and Waters, T., 2024. Health-related benefit claims post-pandemic: UK trends and global context. Institute for Fiscal Studies, Report R333, https://ifs.org.uk/publications/health-related-benefit-claims-post-pandemic-uk-trends-and-global-context.
Latimer, E., Ray-Chaudhuri, S. and Waters, T., 2025. The role of changing health in rising health-related benefit claims. Institute for Fiscal Studies, Report, https://ifs.org.uk/publications/role-changing-health-rising-health-related-benefit-claims.
Miller, S., Rhodes, E., Bartik, A. W., Broockman, D. E., Krause, P. K. and Vivalt, E., 2024. Does income affect health? Evidence from a randomized controlled trial of a guaranteed income. National Bureau of Economic Research, Working Paper 32711, https://www.nber.org/papers/w32711.
Office for Budget Responsibility, 2019. Welfare trends report – January 2019. https://obr.uk/wtr/welfare-trends-report-january-2019/.
Rabaté, S., Jongen, E. and Atav, T., 2024. Increasing the retirement age: policy effects and underlying mechanisms. American Economic Journal: Economic Policy, 16(1), 259–91, https://doi.org/10.1257/pol.20210101.
Staubli, S. and Zweimüller, J., 2013. Does raising the early retirement age increase employment of older workers? Journal of Public Economics, 108, 17–32, https://doi.org/10.1016/j.jpubeco.2013.09.003.
Waters, T. and Wernham, T., 2024. The distributional impact of tax and benefit reforms since 2010. Institute for Fiscal Studies, Report 319, https://ifs.org.uk/publications/distributional-impact-tax-and-benefit-reforms-2010.
Data
Department for Work and Pensions, NatCen Social Research. (2021). Family Resources Survey. [data series]. 4th Release. UK Data Service. SN: 200017, DOI: http://doi.org/10.5255/UKDA-Series-200017.
Office for National Statistics. (2022). Quarterly Labour Force Survey, June - August, 2021. [data collection]. 2nd Edition. UK Data Service. SN: 8858, DOI: http://doi.org/10.5255/UKDA-SN-8858-2.
Office for National Statistics. (2024). Labour Force Survey. [data series]. 11th Release. UK Data Service. SN: 2000026, DOI: http://doi.org/10.5255/UKDA-Series-2000026.
Acknowledgements
The authors gratefully acknowledge the support of the Joseph Rowntree Foundation (F-240302M), the Health Foundation (FR-0006314) and the ESRC Centre for the Microeconomic Analysis of Public Policy (ES/Z504634/1). The authors would like to thank David Finch, Helen Miller and Iain Porter, and participants at seminars at IFS, Ifo Institute for Economic Research, Netspar International Pension Workshop, and International Institute of Public Finance Annual Congress for providing comments on this report and the analysis contained in it. The authors would also like to thank Adam Hillmore and Richard Ward for help accessing data relating to the benefit cap used in this analysis. Any errors are the responsibility of the authors alone.
Endnotes
Authors

Jonathan Cribb
Jonathan joined IFS in 2011. His research areas includes: pensions, ageing and demographic change, public sector pay, housing, and inequalities.

Heidi Karjalainen
Heidi is a Senior Research Economist in the Retirement, Saving & Ageing sector. Her current research is on pensions and saving for retirement.

Eduin Latimer
Eduin is a Senior Research Economist in the Income, Work and Welfare sector. His research focuses on benefits policy and the low-paid labour market.

Sam Ray-Chaudhuri
Sam joined the IFS in 2022 and works as a research economist in the Income, Work and Welfare sector.

Tom Waters
Tom is an Associate Director at the IFS and Head of the Income, Work and Welfare sector.
More from IFS
Understand this issue


Policy analysis


Academic research


