
Downloads
Download report as a PDF
PDF | 441.74 KB
The past 14 years have witnessed an enormous amount of reform to the tax and benefit system. While it is tempting for politicians to draw attention to one set of reforms or another, what matters for household incomes is the whole system. In this report, we study the impact of policy changes to direct taxes (income tax, National Insurance contributions and council tax), indirect taxes (VAT, duties) and welfare benefits. We examine reforms implemented since 2010–11, as well as those that have been announced and (on current plans) will be implemented by 2027–28. As well as highlighting how these reforms have affected richer and poorer households, those of different ages, and different family types, we draw out some key themes that have emerged – intentionally or otherwise – from successive Chancellor’s decisions. Whoever forms the next government, it is this tax and benefit system that they will inherit and which departures from will be measured against.
Key findings
1. The tax and benefit system has undergone significant changes since April 2010, with cuts to both benefits and direct taxes for most working-age households, the opposite for pensioners, and a tax rise for those on the highest incomes. Tax freezes over the next three years are set to increase tax liabilities, but with inflation down this is not set to change the distributional pattern significantly. Someone on average earnings (around £35,000) today pays about £1,600 less in income tax and National Insurance contributions than someone on the same real level of earnings would have paid in 2010–11.
2. Broadly, the effect of tax and benefit reforms from 2010–11 to 2024–25 has been to reduce incomes of the bottom 40% and the top 10% of households, and increase incomes in between. The poorest fifth of households have lost an average of £1,800, or 10.2% of income, while the richest tenth have lost £2,200 (1.7% of income) on average. The middle and upper middle of the income distribution have gained on average; for example, among the 7th decile incomes have risen by almost £1,300 (2.5%). Overall, direct personal taxes have been cut, and the bottom 90% of the distribution have seen tax liabilities reduced because of policy changes over this period.
3. The period 2019–20 to 2024–25, corresponding to the most recent parliament, marked a change in direction from the years from 2010–11 to 2019–20. Whilst the most recent parliament has seen taxes and benefits rise, the previous period saw both cut.
4. Families with children have been especially affected by benefits changes, both because of their greater reliance on benefits, and because some of the reforms are specifically targeted at this group (such as the ‘two-child limit’). Out-of-work families with children have lost £5,500 a year on average as a result of benefit reforms; in-work families with children with below the 40th percentile of household earnings have lost £3,100 on average. But while cash benefits have been reduced, there have been significant expansions of free childcare for working families.
5. Pensioners, unlike working-age adults, have seen benefits and taxes go up. The triple lock has ensured the state pension has risen faster than inflation – but pensioners have not benefited from cuts to National Insurance contributions, which they do not pay anyway, nor from increases in the personal allowance, since they no longer have a higher personal allowance than working-age adults. As a result, they have seen little change in average disposable income from tax and benefit changes from 2010–11 to 2024–25.
1. What has happened to tax and benefits since 2010?
It is worth briefly mentioning some of the key reforms over this period that drive our results (a fuller list of policies we model is available in Appendix A). All cash values are given in 2024–25 prices.
On the direct tax side, the income tax and National Insurance contributions (NICs) paid by low-to-middle earners have been substantially reduced, through increases to the point at which these taxes begin to be paid and a cut in the main rate of NICs. This has been partly undone by a freeze to all the main tax thresholds since 2021–22 (which is not due to end until 2027–28). The net effect is that someone on average earnings (around £35,000) today pays about £2,000 less in income tax and NICs than someone on the same real level of earnings would have paid in
2010–11.
For higher earners, taxes have generally gone up. In current prices, the higher rate threshold (the point at which 40% income tax begins to be paid) has fallen from £67,700 in 2010–11 to £50,270 today, while the additional rate threshold (at which 45% tax is due) has fallen from £230,000 in 2010–11 to £125,140 today. The number of higher rate taxpayers has more than doubled from 3.3 million to 7.4 million since 2010. A number of restrictions to tax relief on pension contributions for higher earners have added up to a sizeable tax rise, despite a recent reversal of direction. The major policy going in the opposite direction was cutting the additional tax rate from 50% to 45%.
Pensioners have also seen taxes rise. In 2010, their personal allowance was significantly higher than that of working-age adults, whereas now it is the same, amounting to a real-terms cut in the personal allowance. Moreover, they do not benefit from cuts to National Insurance, since they are not liable to pay it.
The single most important indirect tax reform was increasing value added tax (VAT) from 17.5% to 20% in 2011 – a tax rise worth £20 billion. This has been offset by a number of cuts to alcohol and – especially – fuel duty. Had fuel duty increased every year by the retail prices index (RPI) measure of inflation, as is officially government policy, today it would be 101p per litre. This is a tax cut now worth £19 billion per year. Changes to indirect taxes over the period as a whole largely cancel each other out.
The working-age welfare system has been reshaped entirely. It has been subject to a number of cuts, including the value of most benefits being uprated by less than inflation each year from 2013–14 to 2019–20. The jumble of benefits previously available has also been – mostly, though not entirely – replaced by universal credit (UC)1. UC is, today, on average more generous than the ‘legacy’ system it replaces, though with a large number of winners and losers.
Conversely, the pensioner benefit system has been relatively protected with the triple lock to the state pension resulting in the basic state pension rising by 74% in nominal terms – compared to a rise in prices of 52%, and a rise in earnings of 53%.
2. Distributional analysis
Our approach
First, it is worth highlighting a few key points on our method. A discussion on some more detailed points is available in Appendix A.
In broad terms, our goal is to establish real-terms changes in the tax and benefit system. Where any parameters are frozen, or rise faster than prices (e.g. the state pension being uprated by the triple lock), this is counted as a reform.2
Second, throughout we restrict our analysis to the ‘pre-behavioural’ effect of reforms – in other words, how they change household incomes if individuals do not alter their patterns of work and spending as a result.
Third, our analysis covers changes to income tax, NICs, council tax, VAT, duties on fuel, alcohol and tobacco, state pension rates, benefits and tax credits. We do not include:
most ‘business taxes’ such as corporation tax, though we do include employer NICs, assuming that changes in employer NICs are passed on to employees in higher or lower wages such that the total cost to employers remains constant;
capital taxes such as capital gains tax or inheritance tax;
reforms to taxes and benefits made by the Scottish or Welsh devolved administrations – in other words, when putting a past year’s tax–benefit system into today’s prices, we implement the devolved parts of the system as they currently stand;
the increase in state pension ages or the introduction of the single-tier pension;
increases in minimum wages, as the minimum wage is neither a tax nor benefit policy;
in-kind provision of ‘free childcare’, though we do include cash subsidies for childcare (through the benefit system and so-called ‘tax-free childcare’);
the replacement of Disability Living Allowance with Personal Independence Payment for working-age adults.
Results
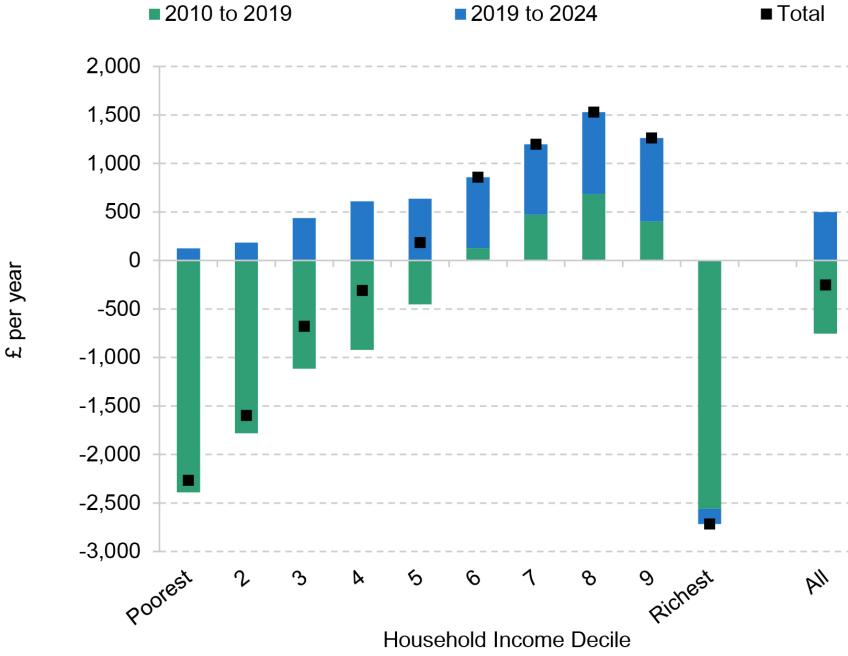
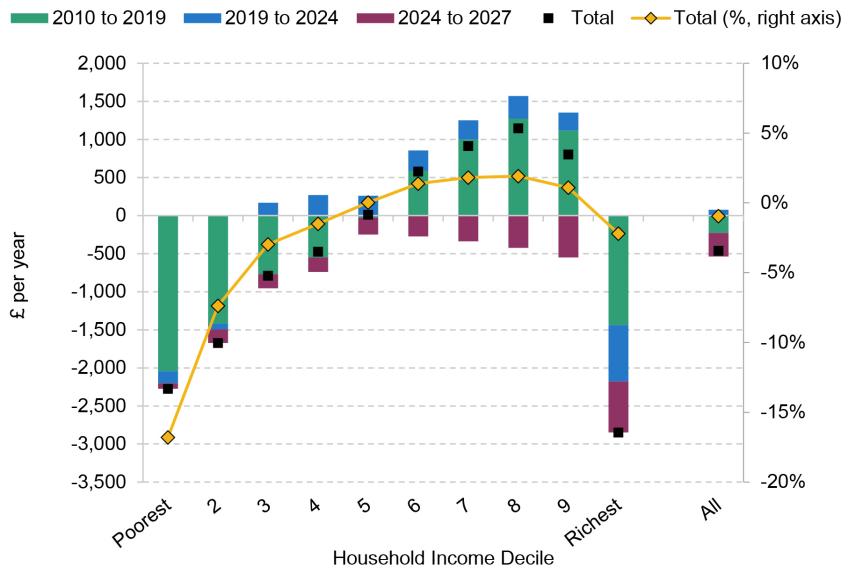
We first show the effect of these changes for each decile (tenth) of the disposable income distribution, split out by two time periods: 2010–11 up to 2019–20 (prior to the most recent parliament); and 2019–20 to 2024–25 (the parliament just finished). In Figure B5 we add in 2024–25 to 2027–28 (announced but not yet implemented reforms). An interactive tool which shows the impact of reforms across different periods and demographics groups is available on the IFS website.3
The period from 2010–11 to 2019–20 saw:
Significant cuts to means tested benefits, principally falling on lower-income households. These include
o benefits being uprated by less than inflation in the years 2013–14 to 2019–20 inclusive.
o cuts in local housing allowance rates which cap private-sector housing benefit,
o the introduction of the so-called ‘two-child limit’, which limits entitlements to the child element in UC – currently worth £3,455 per year per child – to the first two children in a family, if born after April 2017.
Significant direct tax cuts, through increases in the personal allowance, which principally fell on middle- and higher-income households.
Tax rises for higher earners, including restrictions on tax relief for pension contributions and the freezing of the points at which the personal allowance begins to be withdrawn and the point at which additional rate tax begins to be paid.
The combined effect was a take-away from households on average, with the poorest 40% and richest tenth losing out on average, and the other 50% gaining on average (though there will be households within each of these groups who did significantly better or worse than the average within the group, depending on their particular circumstances). While the richest tenth benefited from the high profile cut to the additional rate of tax (from 50% to 45%), that was, on average, more than offset by other tax rises.
If we incorporate indirect taxes, most notably the increase in VAT, then this period represents a considerably bigger take-away from households on average, as shown in Figure B1 in Appendix B.
The period from 2019–20 to 2024–25 saw increases in benefits and direct taxes overall, which largely cancel each other out in aggregate, marking a reversal in direction from the 2019–20 years.
Tax rises include:
freezes to the personal allowance and higher rate thresholds;
a freeze to the point at which employer NICs begin to be paid;
a nominal cut to the additional rate threshold.
These meant taxes rose across most of the distribution. But increases in the point at which employee and self-employed NICs begin to be due and cuts to the main rates of NICs offset these on average for the upper middle of the household income distribution. There were also cuts to various duties, affecting households across the distribution.
There were relatively few permanent benefit reforms over this period; the two key changes were both giveaways, in the form of a restoration of Local Housing Allowance (LHA) rates to the 30th percentile (followed by an immediate freeze), and the decrease in the UC taper rate, increasing in-work benefits4.[Incorporating indirect taxes shows a larger gain to households from this period, due to cuts to alcohol and fuel duties, as shown in Figure B1 in Appendix B.
Going forward to 2027, freezes to personal taxes will continue to increase income tax and National Insurance liabilities, while freezes in some benefits parameters, perhaps most notably LHA rates, will also reduce disposable incomes. This modestly reduces incomes across the distribution, and does not significantly change the overall distributional picture.
The black squares and yellow line in Figure 1 sum up the net effect of policies implemented by Conservative Chancellors between 2010–11 and 2024–25 as a whole (i.e. excluding upcoming changes). These are regressive across most of the distribution. The incomes of the upper middle of the distribution are about 2% higher on average as a result of direct tax and benefit changes, while the poorest 20% see large falls in their income, of 10% on average for the poorest fifth. Notably, the income falls among poorer households are almost entirely driven by the 2010–11 to 2019–20 period, with little change since then. The richest tenth of households also see their incomes fall by 1.7% as a result of these policies, reducing inequality between the top and the rest of the distribution. This is driven by freezes in tax thresholds, which affect many households in the top tenth, as well as restrictions in pension tax relief and a cut in the additional rate to 45p, which largely offset each other, and fall only on the highest earners.
Having shown how results vary by time of policy implementation, we now examine how reforms to taxes and benefits over the period up to now (2010–11 to 2024–25) separately impact incomes5. Figure 2 shows that benefits changes have had the largest effect for the poorest half of the distribution – the poorest 20% have seen benefits cut by around £2,100 per year on average. Taxes have been cut across the bottom 90% of the distribution, especially boosting incomes in the upper middle of the income distribution. For the richest tenth, tax liabilities have on average increased by £1,900 a year.6 The historically high tax burden is driven by increased income tax liabilities among the highest earners, as well as increased revenues from other taxes, such as corporation tax. Including indirect taxes, as Figure B2 in the appendix does, makes relatively little difference to this picture, taking a further £100 per year from households on average.
Including the sum of changes to 2024–25 to 2027–28 also makes little difference to the distributional picture, but tax freezes take just over £300 a year from households, as shown in Figure B5.
So far, our focus has been on how reforms have affected richer and poorer households differently. We now turn to how they have affected households according to other characteristics. We first focus on different household compositions and work statuses in Figure 3. As well as splitting households according to the presence of pensioners and children, we also split them by whether they are out of work, working and earning in the bottom half of the household earnings distribution, or working and earning in the top half of the earnings distribution.
There are several things to note about this figure. First, benefit cuts have fallen more on households with children (although working-age adults without children were starting from a much lower base). This is partly simply because families with children are more likely to be eligible for (higher levels of) benefits, and are therefore more exposed to broad-based cuts in benefits (such as below-inflation uprating from 2013–13 to 2019–20, and cuts to housing benefit). But a number of policies specifically target benefits for families with children, including:
the two-child limit;
the restriction of the family premium in tax credits – prior to 2011–12 a premium (which has been frozen at £545 per year) was paid to all but the richest parents; this was restricted to only poorer families, and abolished entirely for those with a first child born after April 2017.
the high income child benefit charge (which functionally reduces child benefit entitlements for higher-earning families)
the benefit cap (which places an overall cash limit on benefit receipt for out-of-work non-disabled families – 88% of those capped are families with children7).
Second, while benefit cuts have been greater for lower-earning or out-of-work households with children, higher-earning households with children (above the 40th percentile of household earnings) have also lost an average of £1,500 per year in benefits – representing 30% of their benefit entitlement. This reflects two policies which have reduced benefits for higher-income families with children specifically – both the restriction of the family premium in tax credits to poorer families, and the high income child benefit charge. For example, a single-earner couple earning £80,000 per year, with two children aged 3 and 5, would under the 2010–11 tax–benefit system have been entitled to £3,200 a year in tax credits and child benefit (in today’s prices); they would now be entitled to nothing. While working families with children have gained from reductions in direct taxes, these have not, on average, been enough to offset the loss in benefits, even for those in the top half of the earnings distribution. Table 1 shows some examples of families with two children, and how much benefit income they have lost as a result of the reforms. Note that some of these losses would be larger still for families who have more than two children, or who are renting.
Table 1. Examples of families with two children affected by cuts to benefits, 2010–11 to 2024–25
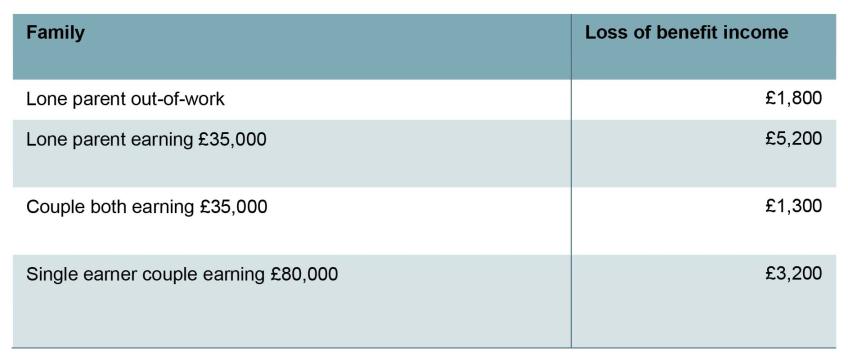
Note: Assumes a 3-year-old and a 5-year-old, in an owner-occupier household. Excludes free school meals.
Third, while cash benefits to those with children have fallen, there have been substantial expansions in state-funded childcare – this is not reflected in the figure as we do not include in-kind benefits.8 But for working families with young children the numbers can be substantial. For example, a working family with a 4-year-old and a 2-year-old would have been eligible for 12.5 hours free childcare per week during term-time for the 4-year-old in April 2010, and nothing for the 2-year-old. By April 2027, they will be eligible for 30 hours per week for both children during term time. Based on forecast hourly cash funding in 2027, this will be worth an additional £13,000 (in today’s prices). For families with young children, who use paid childcare, and where all present parents work – a minority of families with children – they will often find that the losses in cash support are more than offset by increases in in-kind support. For most families with children, for most of the time their children are growing up, this will not be the case. Total spending on free childcare is set to increase to £8 billion per year, as a result of the increase in hours for 3 to 4 year olds, and expansion to 9 month to 2 year-olds (the latter of which alone accounts for a £4 billion increase in spending).9 But the cuts to cash benefits for families with children since 2010 amount to almost £17 billion.
Fourth, the patterns for pensioners are the opposite of those seen for working-age households:
Pensioners have largely been protected from benefit cuts, due to the above-inflation uprating of the state pension from the triple lock, and earnings-uprating of pension credit.
However, these benefit rises are offset on average by tax rises for this group. Unlike working-age adults, pensioners have not benefited from cuts to NICs since they are not liable for them anyway. Moreover, while they now have the same personal allowance as working-age people, they had a higher personal allowance in 2010–11. This means that their personal allowance has been cut in real terms.
For example, a pensioner receiving the basic state pension and £7,000 private pension has seen their state pension increase by £1,000 in real terms, but taxes rise by almost £600, as a result of changes between 2010–11 and 2027–28.
Fifth, it is important to note that we are only modelling policy changes here, and not including the significant rise in claims for disability benefits that has occurred in recent years.10 This partially offsets the reduction in benefit entitlement among out-of-work households on average, though likely only by a modest amount.
In Appendix B, we show the distributional impact of reforms by the age of the head of the household and region (Figures B3 and B4, respectively). We see again how pensioners’ tax and benefit changes have acted in the opposite direction to working-age households, with benefits rising and taxes falling. Tax cuts have also fallen more on younger households, and benefits cuts more on households in their 30s and 40s – a function of younger households being less likely to earn high amounts (and therefore more likely to get a tax cut), and because households in their 30s and 40s are more likely to have children. Looking across regions, London stands out: its concentration of higher earners means that taxes have been cut substantially less among Londoners on average.
Appendix A
Notes on methodology
Indexation
In broad terms, our goal is to establish real-terms changes in the tax and benefit system. When comparing the current system to the 2010 system, for example, we inflate all the cash thresholds, benefit amounts and other cash parameters in the 2010 system in line with prices. Therefore, where any parameters are frozen, or rise faster than prices (e.g. the state pension being uprated by the triple lock), this is counted as a reform.11
In almost all cases, we use the consumer prices index (CPI) to measure how prices have increased, with two exceptions,
1. At certain points and for certain parameters, the default rule in the public finances has been to uprate with RPI, rather than CPI. All duties, many tax thresholds up to 2011–12, and many benefit values up to 2010–11 were uprated with RPI. We use the prevailing inflation measure for the relevant years when putting a given year’s system into 2024–25 prices. This means that we do not count the switch from RPI to CPI for taxes and benefits as a reform (when uprating the 2010–11 system, we use RPI to uprate many tax thresholds in the first year), and duties are measured against a baseline of RPI uprating.
2. LHA rates, which govern the maximum amount of housing support that private renters can get through the benefit system in different parts of the country, were in 2010–11 set at the median of local rents. When putting the 2010–11 system into 2024–25 prices, we set LHA rates to the current median local rent level, meaning that the fact that LHA rates in 2024–25 are below the median is counted as a benefit cut.12
Additional notes
We model the impact of reforms on benefit entitlements, rather than benefit receipt. These can differ because some people do not take up their full entitlement.
For policies that only affect very-high-income individuals, we use administrative data and (pre-behavioural) costings to assess their total effects, and apportion those effects across household income deciles using our household survey data. We also calculate total income in high-income deciles using information from the Survey of Personal Incomes.
List of policies included
The policies modelled as having been implemented between 2010–11 and 2019–20 include:13
reduction in the additional rate of income tax from 50% to 45%;
reductions in annual and life allowances for tax relief on pension contributions;
introduction of the transferable marriage allowance;
increases in NICs rates;
real-terms increases in the personal allowance;
real-terms reductions in the higher rate threshold and upper earnings limit;
increase in the main VAT rate;
fuel duty freezes;
increases in insurance premium tax;
increases in tobacco duty;
real-terms reductions in duties on alcohol;
real-terms changes in council tax;
cuts to council tax support;
transition from the legacy system to UC;
introduction of high income child benefit tax charge;
introduction of the so-called ‘bedroom tax’;
introduction of (and cut in) the benefit cap;
abolition of the Limited Capability for Work Related Activity element in UC;
limiting the child element in UC to two children or third or subsequent children born before April 2017 (the ‘two-child limit’);
removal of the family element UC for those with a first child born after April 2017;
support for mortgage interest switched from a benefit to a loan;
increase in UC work allowances;
reduction of local housing allowance rates from the median to the 30th percentile of the Broad Rental Market Area, and subsequent real terms cuts;
removal of the local housing allowance ‘excess’;
1% nominal cap on increases in most working-age benefits and tax credits from 2013–14 to 2015–16;
freeze of most working-age benefits from 2015–16 to 2019–20;
the state pension ‘triple lock’ increasing the real value of the state pension;
real-terms reductions in a range of parameters that are, by default, frozen in cash terms.
The policies modelled as having been implemented between 2019–20 and 2024–25 include:
abolition of Class 2 NICs;
increase in, then freeze of, the primary threshold in NICs and equivalent for self-employed;
freezes in the NICs secondary threshold and upper earnings limit;
freezes in the income tax personal allowance and higher rate threshold;
reduction in the additional rate threshold;
freeze in fuel duty;
increases in tobacco duty;
real-terms reductions in duties on alcohol;
increase in LHA rates to the 30th percentile of local rents in 2024–25;
increase in the benefit cap;
cut to the UC taper rate and increase to the UC work allowances;
increases in the maximum amount of support available for childcare through UC;
increase in the thresholds for the high-income child benefit charge;
further rollout of the ‘two-child limit’ and removal of the family premium;
the state pension ‘triple lock’ increasing the real value of the state pension;
real-terms reductions in a range of parameters that are by default frozen in cash terms.
The policies modelled as being implemented between 2024–25 and 2027–28 include:
freezes in the NICs primary threshold, secondary threshold and upper earnings limit;
freezes in the income tax personal allowance and higher rate threshold;
further rollout of the ‘two-child limit’ and removal of the family premium;
the state pension ‘triple lock’ increasing the real value of the state pension;
real-terms reductions in a range of parameters that are by default frozen in cash terms.
Appendix B
Figure B1. Effect of direct and indirect tax and benefit reforms on disposable incomes, 2010–11 to 2024–25, split by time period, including indirect taxes
Note: Income changes shown are before any behavioural response from households.
Source: Calculations using the FRS 2022–23, the Living Costs and Food Survey (LCFS) 2019–20, and TAXBEN, the IFS tax and benefit microsimulation model.
Figure B2. Effect of direct and indirect tax and benefit reforms on disposable incomes, 2010–11 to 2024–25, split by taxes and benefits
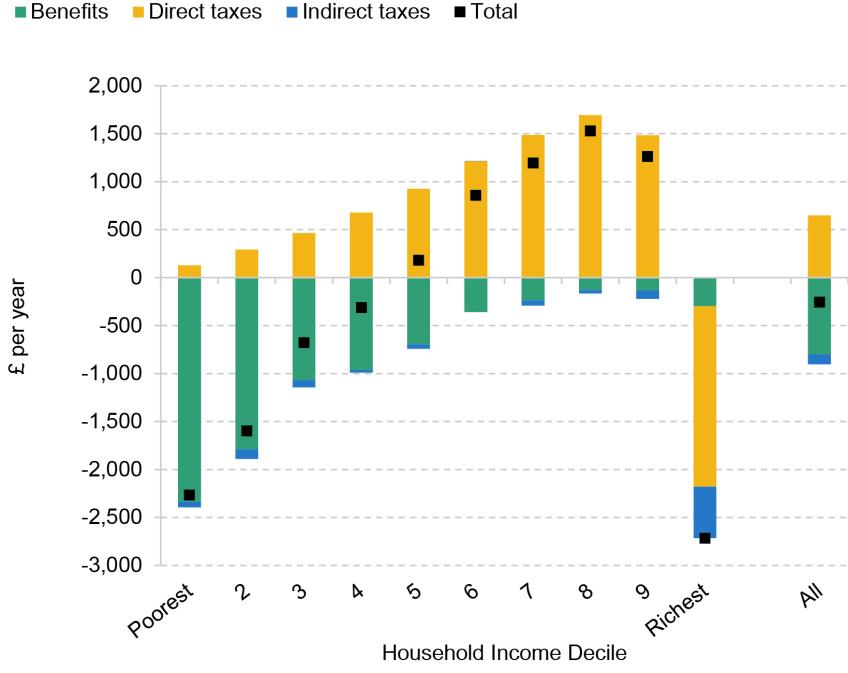
Note: Income changes shown are before any behavioural response from households. We separate the effects of direct taxes and benefits by measuring benefits changes, holding the tax system constant
(at 2024–25).
Source: Calculations using the FRS 2022–23, LCFS 2019–20, and TAXBEN, the IFS tax and benefit microsimulation model.
Figure B3. Effect of direct tax and benefit reforms on disposable incomes, 2010–11 to 2024–25 split by age of head of household
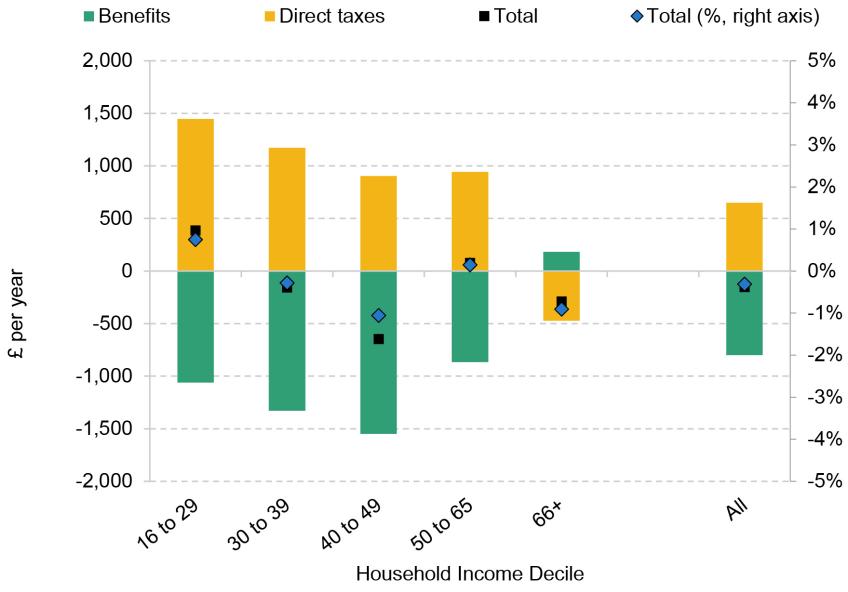
Note: Income changes shown are before any behavioural response from households. We separate the effects of taxes and benefits by measuring benefits changes, holding the tax system constant (at 2024–25).
Source: Calculations using the FRS 2022–23 and TAXBEN, the IFS tax and benefit microsimulation model.
Figure B4. Effect of direct tax and benefit reforms on disposable incomes, 2010–11 to 2024–25, split by region
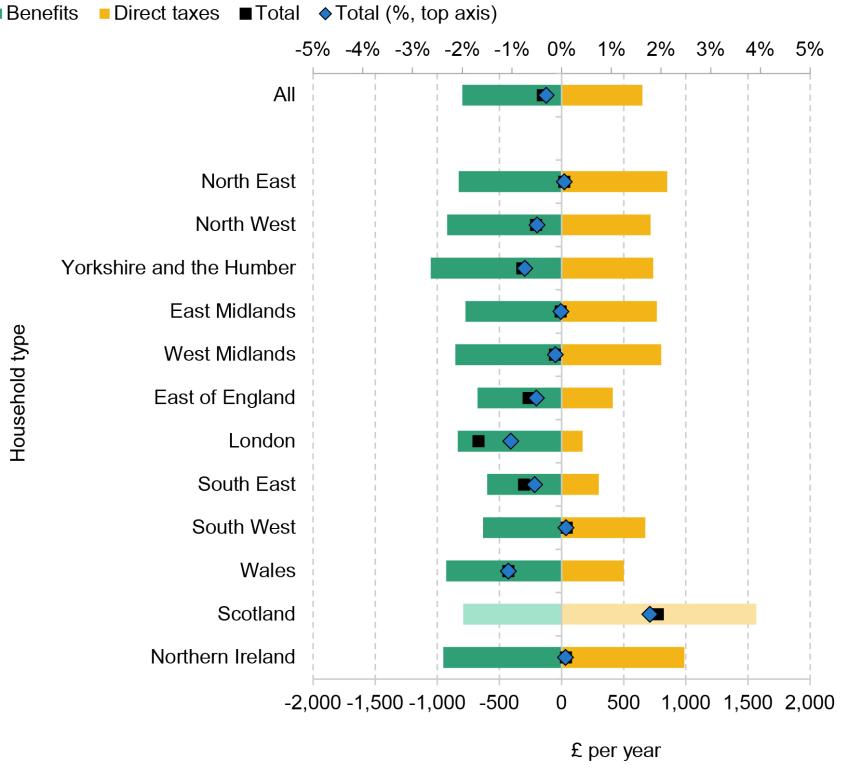
Note: Income changes shown are before any behavioural response from households. Changes in Scottish income tax and benefits are not modelled, so the Scotland datapoints only show the impact of changes by the UK government. Income changes shown are before any behavioural response from households. We separate the effects of taxes and benefits by measuring benefits changes, holding the tax system constant (at 2024–25).
Source: Calculations using the FRS 2019–20 and TAXBEN, the IFS tax and benefit microsimulation model.
Figure B5. Effect of direct tax and benefit reforms on disposable incomes, 2010–11 to 2027–28, split by time period
Note: Income changes shown are before any behavioural response from households.
Source: Calculations using the FRS 2022–23, the Living Costs and Food Survey (LCFS) 2019–20, and TAXBEN, the IFS tax and benefit microsimulation model.
Endnotes
Authors

Tom Waters
Tom is an Associate Director at the IFS and Head of the Income, Work and Welfare sector.

Tom Wernham
Tom's main research areas are living standards and poverty, the benefits system, and its interactions with the labour market.
More from IFS
Understand this issue


Policy analysis


Academic research


