
Downloads

Download the report as a PDF
PDF | 843.18 KB
Key findings
- This October, the new Chancellor, Rachel Reeves, will conduct a one-year Spending Review, setting detailed departmental allocations for 2025–26. Alongside this, she will update plans for the overall level of departmental spending – the ‘spending envelope’ – for 2026–27 onwards. Next spring, she will hold a multi-year Spending Review, setting departmental spending totals for 2026–27 onwards. Her decisions at these Spending Reviews will be of great economic, fiscal and political importance.
- Shortly after taking office, Ms Reeves published Treasury analysis that claimed to reveal £22 billion of additional in-year spending pressures for 2024–25. Some of these pressures – most notably, additional spending on public sector pay – will be permanent. This only adds to the scale of what was already a daunting challenge: the new government has inherited a tight set of spending plans that would see day-to-day spending on public services grow by just 1% per year (implying cuts to some unprotected departments) and cuts to capital budgets.
- The overarching challenge facing the Chancellor is that – as has been apparent for some time – those spending plans for future years are almost certainly going to need to be topped up. Given the pressures on a whole range of public services and the ambitious promises in the Labour manifesto, the only question is one of scale.
- The one-year Spending Review to be concluded this autumn will agree final departmental budgets for 2024–25 (in light of in-year overspends) and set detailed allocations for 2025–26. Here, the key issue is the extent to which budgets for this year and next are increased to reflect recent public sector pay deals and other in-year pressures, and the extent to which departments are instead asked to absorb higher costs. Which departments are prioritised for additional funding – and which, if any, are left facing real-terms cuts – will be revealing, as will the extent to which investment is prioritised over immediate day-to-day pressures.
- Alongside these short-term allocations, the even more fiscally consequential choice to be made this autumn is over the spending envelope for the rest of the parliament. Just to maintain the 1% real growth assumption bequeathed by Jeremy Hunt, fund this year’s pay pressures on a permanent basis and honour the specific spending commitments in the Labour manifesto, we estimate that day-to-day departmental spending (RDEL) will need to be topped up by £14 billion in 2028–29. This is, in effect, the ‘status quo’ scenario. Given commitments on areas such as the NHS, defence, aid and childcare (which would see spending on those areas increase more quickly), this would still mean making cuts to some unprotected public services.
- If Ms Reeves also wishes to avoid making cuts to unprotected budgets, we estimate that she would need to increase her day-to-day spending plans for 2028–29 by a further £16 billion (£30 billion in total, enough to deliver average real-terms growth of 2.0% per year). Even if these budgets are spared real-terms cuts and rise with inflation, maintaining delivery of public services such as prisons and the police could still be challenging. To instead increase funding for these areas in line with national income would require funding to be topped up by a further £17 billion (or £47 billion in total) in 2028–29. These are illustrative scenarios but highlight that the required top-ups can get quite large, quite quickly, under seemingly reasonable assumptions. Even this £47 billion top-up to the day-to-day spending total would only take average real-terms growth to 2.8%: less generous than the 3.3% initially planned at the 2021 Spending Review (though the subsequent surge in inflation eroded that to 2.2%).
- Ms Reeves and Sir Keir Starmer have indicated that they intend to prioritise capital investment. We estimate that the Labour manifesto implies an additional £6 billion of capital spending in 2028–29. Even with this increase, capital spending (CDEL) would fall by 0.8% per year in real terms over the next four years. Avoiding real-terms cuts to departments’ capital budgets would require spending to be £10 billion higher in 2028–29 than under previous government plans (£4 billion on top of our £6 billion estimate of Labour’s manifesto commitment). Growing capital spending in line with national income would require spending to be £19 billion higher in 2028–29 than previous government plans. This would still be considerably less ambitious than the original Labour plan for £28 billion of additional green investment per year.
- Taking day-to-day and capital spending together, we estimate that just delivering the manifesto and funding additional public sector pay pressures would require total departmental spending (TDEL) to be £20 billion higher than current plans in 2028–29. Avoiding real-terms cuts to unprotected RDEL and overall CDEL on top of this would require a total increase of £40 billion. And growing unprotected RDEL and overall CDEL in line with national income would require a total increase of £66 billion.
- Some of the in-year spending pressures identified by Ms Reeves stem from the poor budgeting practices of the previous government. But most stem from the fact that the generosity of departmental budgets has become detached from what those departments have been asked to deliver. Cumulative economy-wide inflation over the three years covered by the last Spending Review is now forecast to be more than twice as high (15% versus 7%). Departments budgeted for pay awards of around 3%, 2% and 2% in those three years; in the event, they turned out closer to 5%, 6% and 6%. Had day-to-day funding grown at the rate originally planned, it would have been £10 billion higher in 2023–24 (even after the ad hoc top-ups to budgets for that year). On top of that, the UK population has grown by 1.8 million (2.7%) since 2021–22, versus a forecast of 800,000 (1.1%) in October 2021, which will have added to the pressures on (some) departmental budgets.
- There was no crystallising moment since the last Spending Review to force the previous government to reassess the adequacy of departmental budgets in light of substantially higher inflation and population growth. Ms Reeves has set out proposed changes to the fiscal framework that would, if kept to, go some way towards addressing this. In particular, holding a three-year Spending Review every two years would reduce the extent to which planning assumptions can be overtaken by events, and reduce the extent to which the generosity of departmental budgets and the demands on departments can diverge. This is sensible, but the Treasury should also consider introducing a force majeure clause that automatically triggers a new Spending Review when inflation or pay awards come in outside of a pre-agreed range.
3.1 Introduction
Since the new government took office, there has been significant focus on the spending pressures facing departments in the current financial year, 2024–25. According to the Treasury, these pressures amount to some £22 billion over and above what had been budgeted for. It is, of course, customary for a new Chancellor taking office after a change of government to declare, aghast, that the government’s finances are in a worse state than they had expected. Nonetheless, Rachel Reeves does have some grounds for her claim: the extent of some of the pressures does indeed seem to be greater than could be discerned from the outside, and some of the previous government’s budgetary practices leave a lot to be desired.
Yet she cannot claim to have been caught unawares by the broader fiscal challenge awaiting her on entering HM Treasury. This has been long apparent and long ignored by both the Conservative and Labour parties. It can be ignored no longer.
The new government has inherited spending plans that would see day-to-day funding for public services grow by 1% per year in real terms after this year. Given commitments on the NHS, defence, overseas aid and childcare, this implies cuts to some unprotected areas of government. These plans also imply cuts to government investment. Avoiding these cuts would require spending plans to be topped up by tens of billions. This was the problem all political parties knew would be waiting if they won the election. To the extent that any of the in-year overspends identified by Ms Reeves prove permanent, they add to the scale of this challenge but leave its broad contours unchanged.
The key problem of the last few years has been that the purchasing power of public service budgets has become detached from the demands and expectations on those budgets. Higher-than-expected inflation (which has unsurprisingly fed through into higher-than-expected pay awards) has eroded the real-terms value of the budget increases set out in the 2021 Spending Review, and higher-than-expected population growth has further reduced the generosity of per-person budgets. In other words, budgets are lower than anticipated and intended, but the pressures on public services have not reduced in line (or at all). This, combined with disappointing public service productivity, helps to explain why public services are in such a poor state.
Given the poor state of many public services, the ambitions and commitments in the Labour manifesto, and the scale of the public sector pay awards announced over the summer, it seems inevitable that the previous government’s spending plans will need topping up. The only questions are by how much, and from where this funding will come, given the Chancellor’s stated commitment to ‘ironclad’ fiscal rules and her promise not to raise the main rates of income tax or to increase National Insurance and VAT. It is one thing to sidestep these trade-offs when running for office. But it will not be possible to sidestep them at the Budget and one-year Spending Review this autumn, or at the multi-year Spending Review concluding next spring, when these issues will need to be confronted and considered in the round.
In this chapter, we consider the Chancellor’s options at the imminent one-year Spending Review and the forthcoming multi-year Spending Review1. The focus throughout is on spending by departments – roughly speaking, spending on public services – as it is this spending that will be subject to the Spending Review process. The reader should bear in mind that this is less than half of all government spending, and that policy decisions on areas such as social security benefits and state pensions (e.g. on the winter fuel payment, the two-child limit, or the freeze to local housing allowance rates) and debt interest (e.g. on changes to reserve remuneration) will also need to be weighed alongside any changes to funding for public services. Changes in the assumptions and drivers of spending on those areas (e.g. the future path for global interest rates, or the rate at which people flow onto health-related benefits) could also ease or heighten the funding constraints on public services.
We begin in Section 3.2 by setting out the spending framework, defining key terms and describing what happens at a Spending Review. In Section 3.3, we draw out lessons from the last Spending Review and suggest ways in which the framework might helpfully be reformed. In Section 3.4, we explore the nature and scale of the future spending challenge, taking into account the previous government’s spending plans, Labour’s manifesto promises and the in-year spending pressures unveiled in the July spending audit. In Section 3.5, we bring all of this analysis together and assess the options facing the Chancellor, including a number of scenarios for how much of a top-up to existing spending plans might be required. Section 3.6 concludes.
3.2 A beginner’s guide to public spending
Some definitions
Total UK government spending in 2023–24 (total managed expenditure, or TME) amounted to a little more than £1.2 trillion. Since 1998, this total has been split into two categories:
Departmental expenditure limits (DEL) can be broadly thought of as spending by central government on public services. The idea is for DEL to encompass spending that can be predicted and controlled by departments (rather than being driven by, for example, the economic cycle). It includes spending on things such as the NHS, the courts system and schools. Within DEL, departments are set separate limits for resource (current, or day-to-day) and capital (investment) spending. These are referred to as resource DEL (RDEL) and capital DEL (CDEL). It is RDEL and CDEL allocations that are agreed with departments, often for multiple years at a time, at Spending Reviews. The measure of RDEL used as the Treasury’s ‘control total’ excludes depreciation.
Annually managed expenditure (AME) includes the categories of spending that are more volatile, demand-led and difficult to plan. This spending – which the government argues cannot reasonably be subject to firm multi-year limits – includes things such as debt interest payments, social security benefits and state pensions. It also includes spending by devolved or local governments financed through the taxes that they control.
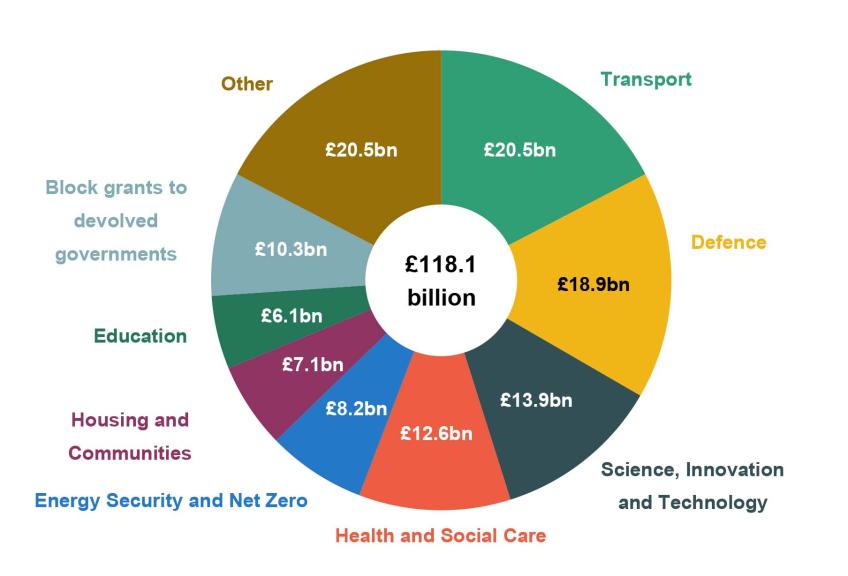
Figure 3.1 breaks down TME into its subcomponents within DEL and AME. Around 35% of all spending is classified as resource DEL, or RDEL, and can be thought of as day-to-day spending on most public services, including things such as staff costs. A further 8% of total spending is classified as capital DEL, or CDEL, which covers money spent by departments on building or maintaining physical government assets, such as roads and buildings. Combined, resource DEL and capital DEL make up total DEL (TDEL), which amounted to around 43% of total government spending in 2023–24 (at around the level it has been since 2014–15, down from 48% in 2009–10 which was prior to big cuts to some departmental budgets).
Figure 3.1 Components of total managed expenditure (TME) in 2023–24
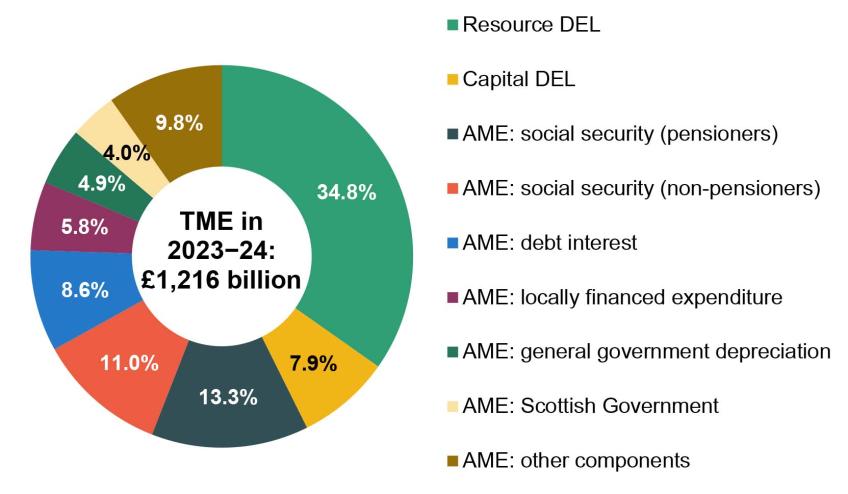
Note: £ billion figure shown is nominal (cash terms). Resource DEL refers to OBR definition of public sector current expenditure in resource DEL (PSCE in RDEL). Capital DEL refers to OBR definition of public sector gross investment in CDEL (PSGI in CDEL). ‘Other components’ of AME includes, for example, net public service pension payments, spending by funded public sector pension schemes, spending by the BBC and public corporations, current VAT refunds, environmental levies, expenditure transfers to the EU, spending on energy support schemes and student loans.
Source: Authors’ calculations using table A.7 of OBR March 2024 Economic and Fiscal Outlook, with the pensioner/non-pensioner split calculated based on DWP Benefit Expenditure and Caseload Tables 2024.
Within AME, the biggest items are spending on social security for pensioners (i.e. the state pension and other pensioner benefits, 13.3% of TME), social security for working-age adults and children (11.0%) and debt interest (8.6%). Locally financed expenditure (such as spending by local authorities financed out of council tax and business rates revenues) makes up a further 5.8% of TME. General government depreciation (the reduction in the value of central and local government assets over time) is 4.9% of TME and spending by the Scottish Government (which was moved from DEL to AME in October 2018) accounts for a further 4.0%.
The Spending Review framework
The introduction of the DEL/AME distinction in 1998 also saw the introduction of the Spending Review process. This framework has several key features:2
Limited in scope. Only spending classified as DEL is subject to the Spending Review process. The previous section showed that DEL makes up well under half of overall government spending, and a smaller fraction than it did in the past3. More than half of all spending therefore falls outside of the scope of the Spending Review process.
The current/capital distinction. Resource and capital budgets (RDEL and CDEL) are set separately. The aim behind this was to encourage departments to undertake the public investment that had been budgeted for, and to discourage them from cutting back investment budgets to meet day-to-day pressures (HM Treasury, 1998). Transfers from CDEL to RDEL are possible but discouraged and must be approved by the Chief Secretary to the Treasury; transfers from RDEL to CDEL are subject to fewer controls (HM Treasury, 2024a).
Cash spending limits. Departmental expenditure limits are set as an annual cash ceiling, with no automatic adjustment or reassessment if costs turn out to be different from what was initially expected. The intention is to provide departments with a greater incentive to control costs.
Multi-year budgeting. Historically, Spending Reviews have tended to cover a period of three years but have covered as few as one (in 2013, 2019 and 2020) and as many as four (in 2010 and 2015) – see Table 3.1. The most recent Spending Review, held in October 2021 when Rishi Sunak was Chancellor and Boris Johnson was Prime Minister, set departmental allocations for 2022–23, 2023–24 and 2024–25. The idea behind multi-year budgeting is to provide departments with some degree of certainty to allow them to plan more effectively and efficiently.
Flexibility to move funding between years. To discourage wasteful spending at year-end,departments have some ability to carry forward unspent funds into future years via ‘Budget Exchange’, though any underspends must be surrendered in advance and there are limits on how much can be carried forward.4
A contingency Reserve. As well as detailed departmental allocations, the overall expenditure limits agreed at Spending Reviews include an unallocated ‘Reserve’ set aside for ‘unforeseen, unaffordable and unavoidable’ spending pressures (HM Treasury, 2024a).
Integrated into the broader fiscal framework. Spending Reviews have typically, but not always, been concluded alongside a major fiscal event, such as a Budget or Autumn Statement. One useful purpose they serve is as a crystallising moment, when the government is forced to choose between competing priorities in the round – for instance, whether to give funding to one department or another, whether to prioritise public service spending over social security spending, or whether to prioritise higher public spending over tax cuts or reductions in borrowing.
Table 3.1 Periods covered by Spending Reviews
Date of Spending Review | Number of years covered | Financial years for which departmental limits set |
July 1998 | 3 | 1999−00 to 2001−02 |
July 2000 | 3 | 2001−02 to 2003−04 |
July 2002 | 3 | 2003−04 to 2005−06 |
July 2004 | 3 | 2005−06 to 2007−08 |
October 2007 | 3 | 2008−09 to 2010−11 |
October 2010 | 4 | 2011−12 to 2014−15 |
June 2013 | 1 | 2015−16 |
November 2015 | 4 (5 for capital DEL) | 2016−17 to 2019−20 (to 2020−21 for capital DEL) |
September 2019 | 1 | 2020−21 |
November 2020 | 1 | 2021−22 |
October 2021 | 3 | 2022−23 to 2024−25 |
October 2024 | 1 | 2025–26 |
Spring 2025 | (at least) 3 | 2026–27 to (at least) 2028–29 |
Note: Rows in italics refer to Spending Reviews for which the timetable has been announced but which have not taken place yet.
Source: HM Treasury Spending Review documents (various).
Announcements from the new government
In the spending audit presented to parliament on 29 July, Ms Reeves focused on the scale of the in-year spending pressures facing the government (discussed in the next section), but she also revealed the timetable on which departmental spending plans will be set for the coming years. Alongside the Budget on 30 October, the Chancellor will confirm final spending totals for 2024–25, set detailed departmental allocations for 2025–26 and, presumably, set an overall path for public spending – set what is known as the ‘spending envelope’ – for the subsequent years. The government has then committed to a multi-year Spending Review in Spring 2025, which will set departmental allocations – i.e. allocate the overall envelope – for a minimum of three further years (from 2026–27 to at least 2028–29).
This strikes a welcome balance, sensibly giving departments notice of their budgets for next year while leaving enough time for the government to develop more of a fiscal strategy and decide upon its public service priorities for the remainder of the parliament, ahead of the main event next spring. The options and choices facing the government at these events are discussed in more detail in Section 3.5.
The Chancellor also announced several sensible reforms to the spending framework on 29 July. First, she announced that the Treasury would be required to share its assessment of departments’ financial positions in the current and following financial years with the Office for Budget Responsibility (OBR) before forecasts are made. The intention is to improve the OBR’s ability to forecast under- or over-spends, though one might question why this information was not previously flowing from HM Treasury, and other departments, to the OBR.
Second, she committed to holding a Spending Review every two years, each covering a minimum duration of three years. Having reviews more frequently should prevent planning assumptions from becoming too out-of-date (an issue discussed in more detail below) and make it more difficult for a Chancellor to pencil in unrealistically low spending plans for future years that they have no intention of sticking to. A regular review every two years will also force a crystallising moment upon the government and make it more difficult to kick problems down the road. This is a welcome change and is in line with previous recommendations from the Institute for Government (Tetlow, Bartrum and Pope, 2024).
All that said, one potential risk with this new set-up is that the third year of each set of spending plans – the overlapping year, budgets for which will be revisited at the Spending Review two years later – might come to be disregarded, because departments view them as likely to change. This was the experience of the 2000s, when the third year of overlapping Spending Review plans tended to get topped up (Crawford, Johnson and Zaranko, 2018). That could undermine departments’ ability to plan: rather than having three years of budgets they can confidently regard as firm and fixed, they may have to manage with just two. But even that would be an improvement on the practice of the last few years.
The (intended) generosity of previous Spending Reviews
Figure 3.2 shows the rate of average annual real-terms growth planned for departments’ day-to-day budgets (Panel A) and investment budgets (Panel B) at previous Spending Reviews. Note that this is what was planned, not what actually happened in the out-turn. These graphs do not reflect any inflation forecast errors nor any subsequent changes to budgets (an issue to which we return below). But they do give an indication of how generous previous Chancellors intended to be at each Spending Review. In both panels, one can see the relative largesse of the 2000s, followed by the sharp cuts of the 2010s, followed by steady real-terms increases planned since 2019.
Figure 3.2 Planned average annual real-terms spending growth, by Spending Review

Note: Figures denote the planned average annual growth rate in Treasury definitions of RDEL (excluding depreciation) and CDEL, and not the out-turn. The Spending Review 2020 figure is the average real-terms growth rate between 2019−20 and 2021−22 due to the atypical movement of the GDP deflator during the pandemic. The colour of each bar denotes the party in government at the time of each Spending Review.
Source: Authors’ calculations using HM Treasury Spending Review documents (various) and HM Treasury GDP deflators (various).
3.3 Lessons from the last Spending Review
We now turn to a discussion of the experience since the October 2021 Spending Review, which was conducted under the Chancellorship of Mr Sunak, and draw out some lessons for the future. Readers interested only in the outlook for departmental funding at the forthcoming Spending Review may wish to skip this section.
Challenges during the 2021 Spending Review period
Unexpected inflation and the erosion of planned real-terms increases
The main challenge during the 2021 Spending Review period has been that inflation has been much higher than was expected when budgets were set in October 2021. At a Spending Review, departmental budgets are set in cash terms. But what really matters for departments is what those cash budgets can purchase: the number of staff that can be hired, the number of school textbooks that can be purchased, and how many offices can be kept warm in the winter. Higher-than-expected inflation has meant that budgets were less generous in real terms than originally intended.
The Treasury uses the GDP deflator, a measure of domestic economy-wide inflation, to measure the inflation faced by departments5. In October 2021, the GDP deflator was expected to grow by 2.3% per year on average between 2021–22 and 2024–25. In the event, inflation over this period has been much higher than that forecast. This is in part because Russia’s invasion of Ukraine pushed up global energy and food prices, and in part because of tightness in the UK’s labour market (Office for Budget Responsibility, 2023). The latest official forecasts suggest that the GDP deflator will have increased by an average of 4.7% per year over the Spending Review period, more than double the initial forecast of 2.3% per year. Put another way, cumulative economy-wide inflation over the three years is now forecast to be more than twice as high (15% versus 7% – as shown in Figure 3.5 later).
This higher-than-expected increase in prices has reduced the real-terms generosity of departmental spending plans. At the 2021 Spending Review, cash budgets and inflation forecasts together implied that total day-to-day departmental spending would grow by 3.3% per year in real terms between 2021–22 and 2024–25. Had those cash budgets been left unchanged, higher inflation means that spending would in fact have grown over this period by an average of just 0.9% per year.
In reality, cash budgets did not remain fixed at the levels set out at the 2021 Spending Review: various departments received top-ups to spending at subsequent fiscal events. In some cases, this was to compensate for higher inflation: at the 2022 Autumn Statement, for instance, NHS England was given an extra £3.3 billion for each of 2023–24 and 2024–25 to address financial pressures on the system. In some cases, the top-up was to fund genuinely new policy commitments (not, therefore, increasing the real generosity of core budgets): the 2023 Spring Budget allocated an additional £2.4 billion to the Department for Education in 2024–25 to enact childcare reforms and an extra £250 million to the Department for Work and Pensions to introduce a new employment support programme for disabled people. Figure 3.3 shows how the planned real-terms growth rate in selected day-to-day budgets has in fact changed between the 2021 Spending Review and the 2024 Spring Budget.
Figure 3.3 Planned average real-terms growth in selected day-to-day budgets over 2021 Spending Review period, in October 2021 and March 2024

Note: Figures for 2024–25 are as stated in the Spring Budget 2024, and do not account for any in-year top-ups some budgets will receive at the Supplementary Estimates, nor for any allocations of SCAPE funding, nor any other in-year changes.
Source: Spring Budget 2024, Spending Review 2021 and GDP deflators (various).
The 2024 Spring Budget implied that overall day-to-day spending would grow by 2.2% per year in real terms between 2021–22 and 2024–25, compared with the 3.3% initially planned at the 2021 Spending Review6. Had day-to-day spending grown at the real-terms rate planned in October 2021, departmental budgets would have been around £15 billion higher in 2024–25 than they were set to be at the 2024 Spring Budget.
The reduction in the real-terms generosity of plans since October 2021 has not been distributed equally across public services, not least because some departments have been compensated for higher inflation to a greater degree by the Treasury. The Department of Health and Social Care, for instance, has received billions of additional funding and so has seen a smaller reduction in its real growth rate (from 4.1% to 2.8%) than justice (from 4.0% to 0.8%) or the Home Office (from 2.3% to minus 2.1%)7. The Department for Education has seen a particularly small reduction, with its average real-terms funding growth rate dropping from 2.2% to 1.8% – though this largely reflects additional funding for additional responsibilities, most notably the expansion in childcare subsidies for working families8.
The point is that all departments considered here – even those that have received funding top-ups – are worse off than was intended at the time of the last Spending Review. That said, it is also important to stress that day-to-day spending was still growing overall at a rate of more than 2% per year – less generous increases than the recent past, but considerably more generous than the period between 2007 and 2019 (see Figure 3.2).
An additional pressure on (some) departmental budgets has come from faster-than-expected population growth. In October 2021, the UK population was forecast to grow by 1.1% (around 800,000) between 2021–22 and 2024–25. Forecasts from March 2024 point instead to population growth of 2.7% (around 1.8 million) over that period9. This has further reduced the generosity of real-terms budgets per person. In some cases (e.g. defence), it is not obvious that a larger population will meaningfully alter the pressures on budgets (though if a bigger population pushes up GDP, then more spending would be required to meet the 2% of GDP NATO target); in others (e.g. GP services), it is more obvious that it will.
When setting budgets for the future, it is necessary to rely on forecasts (of inflation, population growth and much else besides). Economic forecasts will always differ from the subsequent out-turn, to a greater or lesser extent. The problem is that the gap between forecast and out-turn has been much greater over this Spending Review period than in the past and that has coincided with a period when economic conditions have worsened considerably. Departments have, as a result, been asked to absorb much greater unexpected cost pressures than in previous periods.
Figure 3.4 shows the difference between the expected average growth in the GDP deflator over each Spending Review period since 1998 and the eventual out-turn (excluding the two one-year Spending Reviews in 2019 and 2020 which were affected by measurement issues with the GDP deflator during the pandemic). The forecast error over the 2021 Spending Review period – a 2.4 percentage point difference between the forecast of 2.3% and the out-turn of 4.7% – is by far the largest. Indeed, most of the other errors have been in the opposite direction, with inflation coming in below forecast, meaning that, all else equal, departmental budgets turned out more generous than expected when they were set – with this being particularly true of the Spending Reviews that reported in 1998 and 201310. Below, we consider possible changes that could make the spending framework more resilient to such shocks.
Figure 3.4 Percentage point difference between expected average annual GDP deflator growth and the out-turn over Spending Reviews since 1998

Note: We exclude the two single-year pandemic Spending Reviews (2019 and 2020) as these were affected by measurement issues with the GDP deflator. Figures for SR 2021 include forecasts for GDP deflator inflation in 2024–25.
Source: Office for Budget Responsibility, Economic and Fisal Outlook (various).
Public sector pay pressures
Public sector pay is an important mechanism through which higher-than-expected inflation affects the generosity of cash-terms departmental budgets. Staff costs account for close to half of departments’ day-to-day budgets, and so changes to pay settlements have large overall effects on budgets’ purchasing power. Higher inflation and pay growth in the wider economy put pressure on public sector wages to rise, to support the ability of the public sector to recruit and retain workers. Higher public sector wages then mean that departments have to spend a larger amount of their fixed cash budget on staff costs if they want to continue to employ their existing workforce.
At the time of the 2021 Spending Review, the government assumed that pay awards would be around 3% in 2022–23, 2% in 2023–24 and 2% in 2024–25 when setting departmental budgets (HM Treasury, 2024b) – though these assumptions were not made public at the time. These assumptions were made based on forecasts for the two key benchmarks for public sector pay – inflation (typically measured for these purposes by consumer price indices such as CPI rather than the GDP deflator) and private sector earnings growth. As discussed above, inflation turned out much higher than expected. Private sector wage growth was also much higher than previously forecast (with latest forecasts indicating 16.0% growth between 2021–22 and 2024–25, versus a forecast 9.0% in October 2021 – see Figure 3.5). Reflecting this, public sector pay settlements have been higher than expected, averaging 5% in 2022–23 and 6% in 2023–24. The new government has recently agreed pay deals in the range 5–6% for 2024–25.
Figure 3.5 Evolution of OBR forecasts for cumulative growth in average earnings, CPI and GDP deflator between 2021–22 and 2024–25
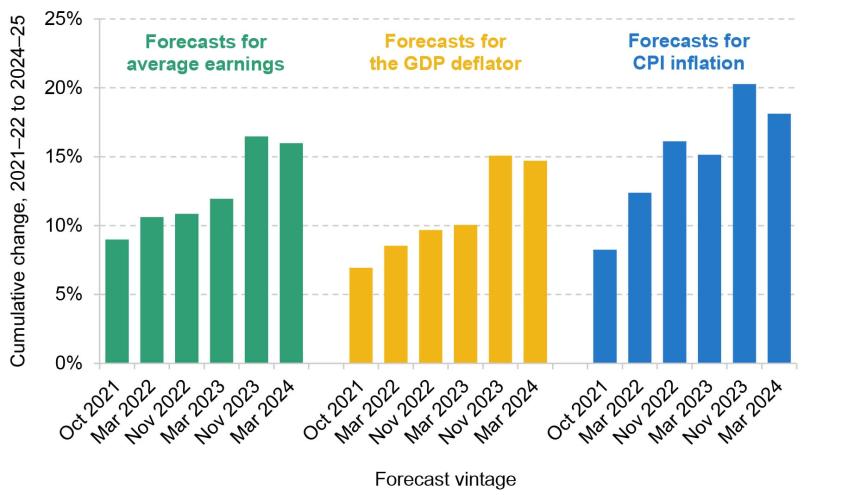
Source: Office for Budget Responsibility, Economic and Fiscal Outlook (various).
So far, departments have, to a large extent, absorbed the pressures from higher-than-expected pay deals within existing budgets. The Treasury estimated these pressures to have been in the region of £11–12 billion for 2024–25 before accounting for the new pay deals (HM Treasury, 2024b). Departments can absorb pay pressures either by reducing spending on other areas or by holding down the number of staff employed. In practice, departments have done both.
Figure 3.6 shows the public sector pay bill over time and compares this with the anticipated public sector pay bill at the time of the Spending Review in October 2021 (constructed using contemporaneous assumptions about pay bill and workforce growth from the OBR). As we might expect, the public sector pay bill has grown much faster than anticipated at the 2021 Spending Review, consistent with the higher-than-expected pay deals. We estimate that the pay bill will, after accounting for the pay awards agreed by the new government in July, come in more than £20 billion (or around 9%) higher in 2024–25 than might have reasonably been expected in October 2021. This compares with a £10.8 billion increase in overall resource DEL in 2024–25, relative to October 2021 plans, as of the March 2024 Budget.
Figure 3.6 Public sector pay bill, as expected in October 2021 and in September 2024

Note: Figures are in nominal terms. We construct October 2021 expectations by taking Office for National Statistics (ONS) figures for the 2019–20 and 2020–21 pay bill and growing these with October 2021 OBR expectations for general government pay bill growth. We construct September 2024 expectations by taking ONS figures (from June 2024) for the general government pay bill until 2023–24, then growing these figures to 2024–25 by 5.5% (average pay deal), 0.5% (pay drift), and expected growth in general government employment according to the OBR.
Source: Office for National Statistics, series NMXS (various); Office for Budget Responsibility, Economic and Fiscal Outlook (various).
Higher-than-expected public sector pay has been a major challenge during the last Spending Review period. But as we will discuss in more detail later in this chapter, these past increases in pay also matter for the next Spending Review, for at least two reasons. First, a higher pay award in any given year that is not offset by lower employment or lower awards in future leads to a permanently higher pay bill in subsequent years. Second, just as departments have been asked to absorb most of the costs of higher-than-budgeted pay awards in recent years, Ms Reeves has asked departments to absorb a third of the costs of recently agreed pay increases for 2024–25 (£3.2 billion of the £9.4 billion of costs from 2024–25 awards). Departments have already had to cut back spending on other areas and hold back workforce growth to stay within budget. There is unlikely to be much in the way of low-hanging fruit for a Chancellor seeking further in-year savings. Some of the broader policy challenges around public sector pay are discussed in Chapter 4.
Public service productivity
Another pressure on departmental spending is the large decline in measured public service productivity that has occurred since the start of the COVID-19 pandemic. Lower productivity means that the same set of public service inputs (e.g. doctors and hospital buildings) produce a lower quantity or lower quality of outputs (e.g. hospital treatments). That means that departments can deliver less with the same level of spending. In the absence of productivity improvements, maintaining – let alone improving – the provision of public services requires more inputs and more spending.
Figure 3.7 shows the official ONS measure of UK public service productivity between 1997 and 2023 (relative to 2019). This measure compares the quantity of inputs used to produce public services with the quantity of services produced, with some adjustments for quality. A higher value means that the same quantity of inputs can produce a greater quantity or quality of services. The measure of productivity for 2022 and 2023 does not yet feature a quality adjustment, as this is produced with a greater lag. Figures for 2022 and 2023 should therefore be seen as provisional.
Figure 3.7 ONS measure of UK public service productivity
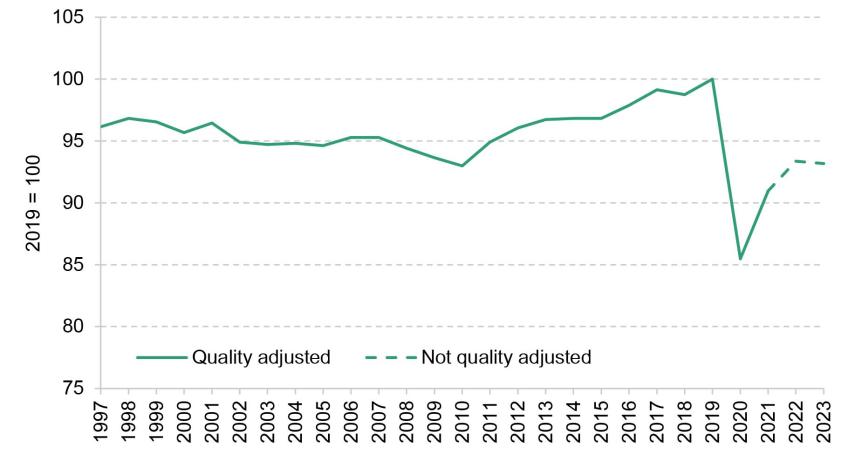
Note: Data for 2022 and 2023 (dashed lines) measure public service outputs without any quality adjustments and will be subsequently updated by the ONS to include quality adjustments.
Source: ONS, public service productivity, quarterly, UK, https://www.ons.gov.uk/economy/economicoutputandproductivity/publicservicesproductivity/datasets/publicserviceproductivityquarterlyuk.
Measured public service productivity declined between 1997 and 2010, and then increased between 2010 and 2019. At the start of the COVID-19 pandemic in 2020, measured productivity fell by 15% in a year. This was because many public services had higher inputs but could not provide many of their normal services during the pandemic. Measured productivity recovered somewhat in 2021, but in both 2022 and 2023 it remained at 7% below its pre-pandemic level (without taking into account any changes in quality since 2021). We see something similar if we look just at the NHS, the biggest public service (Warner and Zaranko, 2022 and 2023a). These measures are not perfect, as it is hard to value public sector outputs, but they speak to a key challenge facing the government at the Spending Review: many departments and services are requiring more inputs just to achieve pre-pandemic levels and standards of provision.
Finding a way to improve the productivity of public services would ease the pressure on departmental budgets – it would allow smaller budget increases for the same range and quality of service provision or would allow bigger service improvements from the same amount of spending. But one of the challenges at the forthcoming Spending Review will be that many of the reforms and policies that we might expect to have beneficial impacts on productivity (thereby reducing spending pressures in future years) would incur up-front costs. This is true of capital investments in buildings, equipment and digital infrastructure that might allow staff to work more efficiently (the importance of which was highlighted in the recent Darzi (2024) report) but also of any major reform to how services are organised and delivered. That only adds to short-term spending pressures – yet those short-term costs must be weighed against any long-run benefits from improvements in productivity. One way of interpreting the recent period is as a cautionary tale on the costs of neglecting such efforts. Of course, another challenge is ensuring that any investments or reforms do in fact increase productivity.
Management of in-year spending pressures and use of the Reserve
Another (related) challenge, which has come to the fore since the new government took office, is the emergence of considerable in-year spending pressures for 2024–25. In-year pressures occur when the budgets agreed between the Treasury and departments at the beginning of the fiscal year prove insufficient to meet the demands on services throughout the year.
While the exact sources of pressures on departmental budgets are hard to know in advance, it is more certain that there will be some pressures, somewhere. Shocks can and do come along. For this reason, the resource and capital DEL totals include a Reserve: an unallocated pot intended to fund ‘genuinely unforeseen contingencies that departments cannot absorb within their DELs’, as well as ‘certain special cases of expenditure that would otherwise be difficult to manage, as agreed with the Chief Secretary [to the Treasury]’ (HM Treasury, 2024a).
Over the last Spending Review period, there have been a range of unexpected spending pressures. These include providing energy support to households, firms and public services; spending on military support for Ukraine; and the unexpectedly high costs associated with asylum seekers. Many of these pressures have been met from the Reserve. But in some years the Reserve has proved insufficient to meet the pressures upon it, and the government has met spending pressures by topping up the overall envelope. In 2023–24, for instance, the overall spending envelope was topped up by £4.8 billion at the 2023 Autumn Statement, notionally to meet NHS funding pressures.
Upon taking office, Ms Reeves asked the Treasury to undertake an audit of public spending, which was published on 29 July this year. The audit estimated that the in-year pressures on day-to-day spending stood at £35.3 billion in 2024–25. After accounting for the £9.2 billion Reserve and £4.2 billion of potential underspends (as departments generally do not spend every penny of their budgets, and if anything have a bias towards underspending), this left £21.9 billion of net total pressures on the total RDEL envelope in 2024–25. Table 3.2 breaks down the pressures identified by the Treasury. These were partially offset by £5.5 billion of in-year cuts (including £3.2 billion of cuts to departmental budgets and a £1.4 billion saving from the means-testing of winter fuel payments).
Table 3.2 Day-to-day spending pressures in 2024–25 identified by Treasury audit (‘Fixing the Foundations’)
Pressure | Value |
Public sector pay | £11.6bn |
‘Normal Reserve claims’ | £8.6bn |
Asylum | £6.4bn |
Railways | £2.9bn |
New policy commitments | £2.6bn |
Ukraine | £1.7bn |
Health | £1.5bn |
Total pressures | £35.3bn |
Reserve | –£9.2bn |
Adjustment for previous forecast underspend and anticipated ‘fallaway’ | –£4.2bn |
Total pressures after allowance for shortfall and Reserve | £21.9bn |
Source: HM Treasury, 2024b.
A detailed assessment of each of these spending items is beyond the scope of this chapter. Here, we draw out four key takeaways.
First, some of these in-year pressures were foreseeable. Given that, the new government might reasonably complain about the fact that funding had not been set aside to meet them, but they ought not to have come as a complete shock. The largest single spending pressure comes from the government’s decision to accept in full the recommendations of the public sector Pay Review Bodies (for pay awards of between 5% and 6% – see Chapter 4). These are perhaps a little higher than might have been anticipated but were always going to come in higher than the 2% budgeted for and built into departments’ plans.
Second, while some of the pressures were foreseeable, the total in-year spending pressures do nonetheless appear to be greater than could be discerned from the outside. Of particular note is the fact that £8.6 billion has already been spent on (or allocated to) ‘Normal Reserve claims’ – a somewhat impenetrable category which seems to include a raft of classification changes, as well as additional funding for things such as the restoration of the Northern Ireland executive and the costs of various public inquiries, such as the COVID-19 inquiry and the inquiry into the NHS infected blood scandal. Given the scale of these claims relative to the overall £22 billion, and the prominence of these in-year pressures in the recent debate, the Treasury ought, at some point, to publish a transparent breakdown11. If we take the £8.6 billion figure as given, even before considering the costs of public sector pay deals, the asylum system or support for Ukraine (which have been funded from the Reserve in previous years), almost all of the Reserve appears to have already been allocated by the previous government just a few months into the financial year.
Third, some of these in-year spending pressures stem from poor budgeting practices of the previous government that the new government could and should address. The way that the Home Office and the Treasury have budgeted and planned for asylum costs leaves a great deal to be desired, with the Home Office repeatedly submitting plans to parliament that it knows to be insufficient and relying on large top-ups from the Treasury later in the year (see Warner and Zaranko (2024) for a detailed discussion). More generally, the previous government appears to have been overly reliant on the Reserve, using it to fund things that it ought not to have been used for. Recurrent asylum costs are one example. The previous government also appears to have met the costs of new permanent policy commitments from the Reserve, to avoid having to top up the 2024–25 envelope and having this feed forward into future years and affect performance against the fiscal rules (we return to the topic of the baseline in Section 3.4). This is not what the Reserve is for: any new permanent policy commitments should have been met from equally permanent increases in the spending envelope.
Fourth, and most importantly for the purposes of this chapter, the scale and nature of the in-year spending pressures make the Chancellor’s life more difficult as she heads into the Budget this autumn and the multi-year Spending Review next spring. This is because some of the spending pressures – most notably public sector pay – are likely to be largely or even wholly permanent in nature. This, in effect, means that the government will have to spend more in each and every year of the next Spending Review period, even before thinking about any increases in funding for service improvements. We discuss this in more detail in Section 3.4 and consider scenarios and choices for the Spending Review in Section 3.5.
Some suggestions for improvement
A force majeure clause for Spending Reviews
The overarching problem of the last few years is that the generosity of departmental budgets has become detached from what those budgets have been asked to deliver. In large part this is because unexpected adverse shocks have meant that the planning assumptions on which budgets were based have proven far from what has actually happened.
Despite large differences between planned and actual inflation and pay awards, there was no ‘crystallising moment’ to force the government to re-examine the adequacy of departmental settlements. Although the previous government could have held a Spending Review at any point, it decided not to. Instead, the boost to nominal tax receipts from higher inflation (and a larger population) was used to cut taxes (most notably rates of National Insurance – a cut which the Labour Party supported in opposition) rather than to compensate departments systematically for higher costs (Institute for Fiscal Studies, 2023). Some favoured departments such as the NHS received ad hoc top-ups to compensate for higher costs, but pressures on the Reserve were left to mount, culminating in the £22 billion of in-year spending pressures outlined by Ms Reeves in July.
The Treasury’s 29 July ‘Fixing the Foundations’ document recognises this problem, and the reforms to the spending framework proposed by the new Chancellor go some way towards addressing it. Holding a multi-year Spending Review every two years would help, because it limits the period over which plans and reality can diverge. But it is still only a partial solution.
To see why, consider the experience since the October 2021 Spending Review, when budgets for 2022–23, 2023–24 and 2024–25 were set. Under the new government’s proposed framework, another Spending Review would have needed to be held by the end of 2023. This would have reassessed the 2024–25 budget and set budgets for future years. That would have done nothing to address the fact that budgets for 2022–23 and 2023–24 were eroded by unexpectedly high inflation (with the inflation spike occurring shortly after the 2021 Spending Review was concluded – see Figure 3.5 earlier). Had resource DEL grown at the real-terms rate set out at the October 2021 Spending Review, it would have been £10 billion higher in 2023–24 than it actually turned out to be (even after the ad hoc top-ups to budgets for that year).
This is not to say that the previous government necessarily should have topped up budgets for 2023–24 by an additional £10 billion rather than cut taxes, or that departments should always be fully protected against inflation risk. But policy might have benefited from a ‘crystallising moment’ that forced the government to weigh up and confront the reality of its choices in a comprehensive and transparent way.
To that end, the government might helpfully add a force majeure clause to trigger a crystallising Spending Review when its planning assumptions are rendered obsolete12. This would force the government to undergo a thorough reassessment of its spending allocations when economic circumstances drastically change, rather than relying on discretional ad hoc adjustments.
Specifically, alongside each Spending Review, HM Treasury should specify its planning assumptions for inflation and private sector pay growth along with a (relatively wide) pre-specified range which the Treasury deems reasonable for departments to manage within their pre-agreed budgets13. The OBR already produces forecasts for the GDP deflator and economy-wide average earnings growth; these could be supplemented with a forecast for private sector pay growth and used as the planning assumptions. The range should be set sufficiently wide that run-of-the-mill forecast errors and department-specific shocks do not fall outside of it; the idea is that the force majeure clause would be triggered relatively infrequently – only by extreme macroeconomic events, such as the energy price shock of 2022.
If inflation and/or private sector pay growth comes in outside of that pre-specified range, this would trigger the clause and kickstart a Spending Review. In a world where Spending Reviews take place every two years anyway, all that such a clause would trigger is bringing the review forward by a year. It would be there to introduce a degree of automaticity, rather than relying on government discretion. Box 3.1 discusses in more detail how a force majeure clause might be designed, in the context of the period covered by the 2021 Spending Review.
Box 3.1 One possible design of a force majeure clause
In designing any force majeure clause, the Treasury would need to carefully specify the indicators used and the conditions that trigger it. Take the GDP deflator. Any sensible force majeure clause would likely need to reflect OBR forecasts for the GDP deflator, so as to respond in a timely manner to changes in expected inflation and departmental costs. But a clause defined solely in terms of forecasts for future inflation might entirely miss a sharp, short-lived inflation spike that appears only in the out-turn.
One potential option would be to design the clause in terms of cumulative GDP deflator inflation over the first two years of the Spending Review period (after which point another Spending Review will happen anyway). If at any point official forecasts suggest that cumulative inflation over those first two years will deviate from a pre-specified range (say, 2.0 percentage points in either direction, relative to the forecasts for those years published alongside the spending plans), the clause would be triggered. This would make use of both out-turn data and the latest forecasts. For example, at the October 2021 Spending Review, cumulative GDP deflator inflation over 2022–23 and 2023–24 was forecast to be 5.0%. By March 2022, this had risen to 6.6%; and by November 2022, this had risen to 8.2% (by that point partially reflecting inflation out-turns for the first half of 2022–23). Under this proposal, this would have triggered the force majeure clause and triggered a formal reassessment of spending plans for 2023–24 and 2024–25 in late 2022, when cumulative inflation was forecast to be 3.2 percentage points higher than forecast at the Spending Review (whereas under the new government’s proposals, without a force majeure clause, this would not have happened until the autumn of 2023).
Other possible changes
Other possible changes to the framework that might enhance the planning and control of spending include:
Align the planning horizons for budgets and pay. If departments are to be allocated two years of firm and fixed spending plans (with the third year subject to potential revision in a future Spending Review), consideration could be given to whether pay deals also should be set on a two-year basis as standard (with a similar force majeure clause to reopen settlements in the case of unexpected changes in inflation or private sector pay).
Consider an expansion of the scope of the Spending Review envelope. The sharp distinction between DEL and AME can create peculiar incentives. For example, the Department for Work and Pensions may be incentivised to seek DEL savings by cancelling an employment support programme, even if that results in higher spending on AME because some people stay out of work for longer. More generally, bringing some components of AME – such as non-cyclical social security spending, like child benefit and the state pension – into the Spending Review envelope might promote better consideration of the trade-offs involved. Reducing AME by £10 billion and transferring this amount to RDEL would increase the average annual real growth rate between 2024–25 and 2028–29 by 0.5%; transferring £10 billion to CDEL would increase the growth rate by 2.0%.
Leave the Reserve for genuine unforeseen emergencies. New permanent policy commitments should not be funded from the Reserve. Nor should recurrent spending items that can be foreseen and planned for in advance. That would leave the Reserve available for what it is intended for: ‘genuinely unforeseen contingencies that departments cannot absorb’ (HM Treasury, 2024b). If a spending item is so volatile and unpredictable that it is extremely difficult to plan for (an argument that could be made about asylum costs), then it may be better classified as AME rather than DEL.
Build in a separate unallocated provision for overseas aid. For a given desired level of spending on official development assistance (ODA), the government might helpfully allocate a certain fraction to specific programmes and departments and leave an unallocated ‘ODA Reserve’ to meet unexpected demands and world events. This would lessen the need for inefficient in-year cuts to aid programmes and allow the aid budget to be managed more efficiently – see Mitchell, Tyskerud and Zaranko (2024) for more detail.
3.4 The future spending challenge
Pressures and commitments
Public services face considerable pressures across the board, with performance in most public services worse than pre-pandemic (Institute for Government, 2023). Given these pressures, it is perhaps unsurprising that a large part of Labour’s manifesto was dedicated to setting out how the party would improve public service performance. Box 3.2 discusses the range of promises in the Labour manifesto and what they might mean for the forthcoming and future Spending Reviews.
Box 3.2 Manifesto promises and implicit commitments
To understand the implications of Labour’s manifesto for the Spending Review, we can group manifesto commitments for public services into three broad categories.
The first category of manifesto commitments is the specific and ‘fully costed’ policies relating to public services. For these, the manifesto set out how Labour intended to raise additional funding to pay for them (e.g. charging VAT on private school fees), thereby increasing the overall spending envelope. Such policies include hiring 6,500 more teachers and delivering 40,000 more appointments per week in the NHS. Taken together, this first category amounts to an additional £4.8 billion in day-to-day departmental spending in 2028–29. These policies are relatively straightforward for the Spending Review: Labour has already set out how much it expects them to cost and been clear that the overall spending envelope will be increased accordingly.
The second category of commitments is the concrete and specific policies that were not included in the manifesto costings. The manifesto reports that these policies ‘will be funded from existing budgets or do not have a cost’. These include commitments to return NHS elective waiting times to their 18-week standard, introduce collective wage-setting in adult social care, introduce specialist rape and sexual offences teams in every police force, and transform further education colleges into specialist technical colleges. The Labour manifesto also committed to setting out the path to spending 2.5% of GDP on defence but did not provide a date for this target (unlike the Conservative manifesto). Even if all these manifesto policies can be delivered within the current overall spending envelope (a very big if), they will have implications for how funding is allocated between departments.
The third category is the large number of promises for new reviews and strategies, including a comprehensive strategy for post-16 education, a strategy to reduce child poverty (see Chapter 6), a long-term strategy for transport, an unspecified programme of reform to create a National Care Service, and many others. These commitments themselves might not prove to be particularly expensive over the next Spending Review period. But implementing the many potential recommendations from these reviews could well have serious implications for future Spending Reviews: not least because none seems particularly likely to recommend big reductions in what the state is doing.
All public services will undoubtedly be seeking additional funding to improve performance and to deliver on any relevant manifesto commitments. Funding is not the only thing that matters for performance (productivity improvements, discussed in the previous section, would be most welcome), but it would be hard to achieve sustained improvements in service performance without some funding increases. In the rest of this section, we set out the additional funding that may be needed in a range of scenarios.
The outlook for day-to-day spending under the status quo
It’s all about that baseline (and subsequent growth assumption)
In the March 2024 Budget, then-Chancellor Mr Hunt set out an ‘envelope’ for day-to-day public services that would see overall spending grow by 1% per year in real terms between 2024–25 and 2028–29. These are the spending plans Ms Reeves has inherited. Because the future increases are calculated relative to the total in 2024–25, the level of spending in that year – the ‘baseline’ – takes on outsized importance.
A key question is the extent to which the £22 billion of net in-year spending pressures for 2024–25 (outlined by Ms Reeves in her July spending audit and discussed above) are permanent and feed through into future years. Consider the pay awards of between 5% and 6% for most public sector workers this year. This adds to the pay bill in 2024–25, but because staff will be paid this higher amount in all future years, and because future percentage increases will apply to this higher amount, it will also increase the pay bill for future years: it is permanent. Here, we make the relatively conservative assumption that it is only these pressures from public sector pay that enter the baseline and affect future years. After accounting for the fact that departments have been asked to make £3.2 billion of offsetting savings, this leaves a net pay pressure of £8.4 billion in 2024–25 that feeds through into future years. Box 3.3 explains the calculation of this baseline in more detail. We then assume that the 1% annual real-terms increases apply to the higher staring point. £8.4 billion extra in 2024–25 grows to £9.4 billion extra by 2028–29.
On top of that, as discussed in Box 3.2, the Labour Party manifesto set out around £4.8 billion of additional spending in 2028–29. (For the purposes of simplicity, we assume that it grows linearly, from £1.2 billion in year 1, to £2.4 billion in year 2, and so on.) That would see overall resource DEL grow by an average of 1.2% per year (up from 1.0% per year without this extra spending).
Combined, this means that just to maintain Mr Hunt’s spending assumption and deliver on Labour’s specific manifesto commitments, Ms Reeves will need to top up her day-to-day spending plans by £9.8 billion in 2025–26, rising to £14.2 billion in 2028–29 (both in cash terms). This is illustrated in Figure 3.8. More details of the assumptions underpinning this and subsequent analysis are set out in Box 3.3. Different assumptions would give a different answer.
Figure 3.8 Estimated spending top-ups from baseline changes and manifesto promises

Note: See Box 3.3 for details of assumptions.
Source: Authors’ calculations using HM Treasury Spring Budget 2024, HM Treasury ‘Fixing the Foundations’ and Labour Party 2024 general election manifesto.
Box 3.3 Assumptions behind our resource DEL ‘status quo’ baseline
We start from the Spring Budget 2024 figure for resource DEL excluding depreciation in 2024–25 (£462.2 billion). We then add £11.6 billion of public spending pressures (£9.4 billion from 2024–25 pay deals, and £2.2 billion ‘overhang’ from 2023–24 pay deals which spill over into this financial year), subtract £3.15 billion of departmental savings, and subtract £30 million of savings from the cancellation of the social care charging reforms. This gives a net increase in the 2024–25 baseline of £8.42 billion. We note that some of the other spending pressures outlined in the 29 July spending audit could also prove permanent (the £1.5 billion winter top-up for the NHS, for instance), but we make the conservative assumption that all bar public sector pay will prove temporary and do not enter the baseline (in other words, the additional pressures either fall to zero or are funded from within the existing envelope). To be consistent, we assume that all of the immediate savings in the spending audit, bar savings in departments to fund pay pressures and the scrapping of adult social care charging reforms, also do not affect the baseline.
For subsequent years, we assume that the 1.0% real-terms increases (as pencilled in by Mr Hunt) apply to this higher baseline (£470.6 billion, the sum of £462.2 billion and £8.4 billion), using GDP deflator forecasts from the OBR’s March 2024 Economic and Fiscal Outlook. Labour’s manifesto set out £4.84 billion of additional resource spending in 2028–29. We assume that this is additional to the ‘1% envelope’, and grows linearly over time, to the tune of £1.21 billion in 2025–26, £2.42 billion in 2026–27, £3.63 billion in 2027–28 and the full £4.84 billion in 2028–29. Combined, this gives the values shown in Figure 3.8.
To produce a departmental breakdown, we make a number of further assumptions. The Spring Budget 2024 numbers include £5.35 billion of unallocated ‘SCAPE funding’ (extra funding for departments to compensate for a reduction in the discount rate used to calculate employer pension contributions – see O’Brien and Zaranko (2023) for more details). We allocate this to departments in line with each department’s share of resource DEL in 2023–24. Similarly, the net additional spend from public sector pay deals is allocated according to each department’s share of overall resource DEL in 2023–24. These estimated departmental budgets for 2024–25 act as the baseline for the scenarios set out below.
Implications for unprotected departments
We now consider what might lie in store for day-to-day public service spending (RDEL) of particular departments under a central, ‘status quo’ scenario – a scenario where spending plans are updated to reflect changes to the baseline and manifesto commitments, and nothing else.
This exercise involves a large number of assumptions, and the figures we present should not be considered to be firm or final; rather, they are indicative of the broad scale of the challenge ahead. The baseline for 2024–25 is constructed using the assumptions outlined in Box 3.3, with most of the public sector pay pressures feeding through as a permanent spending increase, and Labour manifesto commitments adding to the envelope. Combined, as discussed above and shown in Figure 3.8, this means that spending plans for 2025–26 need to be topped up by £10 billion, rising to £14 billion by 2028–29, just to maintain the existing growth assumption and deliver manifesto promises.
We then make the following (somewhat conservative) assumptions about spending on particular public services:
The NHS England budget grows by 3.6% per year in real terms, in line with the historical average for UK health spending and our previous estimate of the funding increases required to deliver the NHS workforce plan, which the Labour manifesto committed to implementing (Warner and Zaranko, 2023b). Note that this may not be sufficient to implement all of the other promised improvements to the health service.
Spending on defencegrows in line with GDP, at 1.8% per year in real terms. Note that this would maintain defence spending at its current level as a share of GDP and would not be enough to increase spending to 2.5% of GDP (which the Labour government has committed to, but without a specific time frame).
The Foreign, Commonwealth and Development Office (FCDO) budget also grows in line with GDP, to maintain UK ODA spending at 0.5% of GDP, as legislated. Note that the Labour government has (like the previous government) promised to restore aid spending to 0.7% of GDP ‘as soon as fiscal circumstances allow’, and doing this would require aid spending to grow faster than is assumed here.14
Spending on new childcare entitlements grows by 31% per year in real terms (from a very low base in 2024–25), in line with previous OBR estimates. Note that this applies to spending only on the new, expanded childcare offer currently being rolled out, and not the total amount spent on childcare.
The Reserve is assumed to grow in line with overall RDEL so as to remain at the same (relatively high) percentage of the total.
Combined, these ‘protected’ areas account for around 47% of overall resource DEL in 2024–25. Block grants to the devolved governments of Scotland, Wales and Northern Ireland (which are determined by the Barnett formula) account for a further 14%, leaving ‘unprotected’ departments with a 38% share. These ‘unprotected’ areas include education, central government grants to local government, and justice15. In all of our analysis, we account for the Barnett consequentials of both increases to protected budgets and cuts to unprotected budgets.
The implied changes in spending on different areas are displayed in Figure 3.9. These are shown in real terms rather than cash terms, in 2024–25 prices, to illustrate better the ‘real’ budget changes implied by these plans.
Figure 3.9 Illustrative scenario for changes in day-to-day funding (relative to IFS estimated ‘status quo’, adjusted for baseline adjustments and manifesto promises)

Note: RDEL is resource departmental expenditure limits excluding depreciation. ‘Barnett’ refers to the payments to the devolved governments of Scotland, Wales and Northern Ireland under the Barnett formula. For details of assumptions, see Box 3.3 and the main text.
In Panel A, we show the change between 2024–25 and 2025–26 (the period to be covered by the one-year Spending Review this autumn). There are two key takeaways. First, the (likely) increases for the NHS are far larger in scale than those for other protected areas: what happens to the health budget is the most important single determinant of the overall funding picture. This is both because the health service is much larger than other areas of spending and because we assume it receives a higher real growth rate than most other areas (in line with historical experience). Second, after accounting for the likely increases in protected budgets, unprotected services would be facing real-terms spending cuts. In today’s prices (i.e. 2024–25 prices), these cuts would amount to around £2.5 billion, or 1.4%. Avoiding those cuts would require a top-up to 2025–26 spending plans of around £3 billion16. This would be in addition to the £10 billion required to maintain the baseline and honour manifesto promises.
In Panel B, we examine the four-year period from 2024–25 to 2028–29 (i.e. the one-year period to be covered at this autumn’s Spending Review, and the three years to be covered by the Spending Review in the spring). The picture is similar, but with bigger sums involved. Unprotected departments would be facing cuts of £13 billion in today’s prices, equivalent to around 1.8% per year. Avoiding those would require a cash-terms top-up of around £16 billion in 2028–29, over and above the £14 billion of baseline- and manifesto-related top-ups. In Section 3.5, we consider some options for Ms Reeves, were she to decide to top up the spending plans she inherited.
Finally, it is important to stress that these numbers are only illustrative. If the new government decided, for example, to allocate even more money to the NHS, to return aid spending to 0.7% of GDP, or to increase defence spending to 2.5% of GDP by the end of this parliament, the implied cuts to remaining budgets would be larger. In addition, there is nothing particularly special about flat real-terms budgets. In some cases, declining real-terms spending might be perfectly manageable. School pupil numbers are set to fall over the coming years, for instance (Sibieta, 2024). Local authorities may be able to offset real-terms reductions in central government grants if they were permitted to raise council tax bills in real terms (Ogden and Phillips, 2024). Nonetheless, flat real-terms budgets serve as a useful reference point.
The outlook for capital spending
The focus above was on day-to-day spending on public services. We now consider the outlook for investment spending.
Existing plans
Previous government policy was for the overall amount of public investment to fall slightly in cash terms after this year. The most commonly used measure of investment spending, public sector net investment (PSNI), nets off depreciation (roughly, the amount of wear and tear on government assets) to give an estimate of the amount of investment in new assets (taking off the spending needed to maintain the assets we already have). This measure of investment was set to fall in cash terms under previous government plans, from £66.6 billion in 2024–25 to £53.1 billion in 2028–29.
In real terms (i.e. after adjusting for inflation, as measured by the GDP deflator), that would equate to cuts to net investment of around 7% per year. This reduction, combined with a growing economy, was set to result in a decline in PSNI from 2.4% of national income in 2024–25 (a relatively high starting point, by UK standards) to 1.7% of national income in 2028–29. This is illustrated in Figure 3.10. Note that this measure of investment includes things not traditionally considered ‘investment’ (such as the component of student loans that is not expected to be repaid – see Zaranko (2024)). Relatedly, PSNI in 2022–23 was in some sense artificially depressed (by changes to the student loan system, and ‘negative’ investment by funded public sector pension schemes), which makes the spike in 2023–24 in Figure 3.10 appear more dramatic – though there was also a genuinely big increase in capital spending by departments that year.
Figure 3.10 Public sector net investment since 1978–79
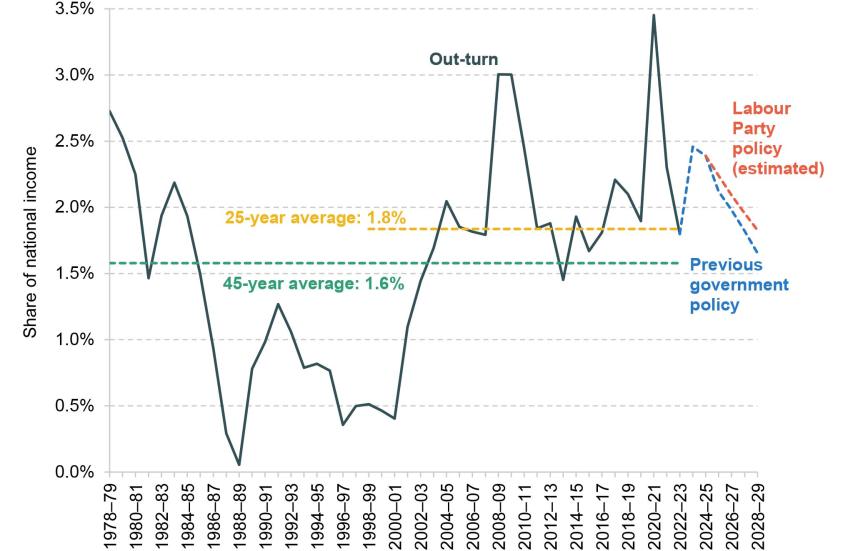
Note: ‘Labour Party policy’ line assumes that a Labour government increases public sector net investment (PSNI) by a cumulative £23.7 billion between 2025–26 and 2029–30 (inclusive), relative to previous government policy, and that the additional investment is scaled up such that PSNI grows at a constant nominal rate between 2024–25 and 2029–30. This means that £16.7 billion of the £23.7 billion is spent between 2025–26 and 2028–29. We additionally allow for a demand boost to GDP from higher net investment spending.
Source: Authors’ calculations using the Office for Budget Responsibility’s Public Finances Databank and March 2024 Economic and Fiscal Outlook.
Having rowed back from its previous £28 billion-a-year green investment plan, Labour’s election manifesto promised an average of £4.7 billion per year over the parliament, or an extra £23.7 billion in total. We interpret this as applying to the five years from 2025–26 to 2029–30 and, in the absence of a confirmed spending profile, assume it will be set such that PSNI grows at a constant rate over time. That would see the additional green investment rise from £3.5 billion in 2025–26 to £5.6 billion in 2028–29 (the final year considered in this chapter)19. The impact of this additional spending on the path of PSNI is shown by the red line in Figure 3.10. Overall investment would still fall as a share of national income (and in real terms), just a little more slowly than under previous government policy.
To avoid making real-terms cuts to PSNI after this year would require the previous government’s spending plans for 2028–29 to be topped up by around £18 billion – some £12 billion more than implied by Labour’s election manifesto. To maintain net investment at its 2024–25 level of national income (2.4%) would require 2028–29 spending plans to be topped up by £24 billion – around £18 billion more than Labour’s plans would imply.
The measure of investment most relevant for the Spending Review is capital DEL – the investment spending done by departments. Spring Budget plans were for capital DEL to fall slightly in cash terms from £118.1 billion in 2024–25 to £116.7 billion in 2028–29. That would equate to an average real-terms cut of 2.0% per year. With (our estimate of) Labour’s extra green investment, this would fall to a real-terms cut of 0.8% per year. To avoid making real cuts to overall capital DEL would require a top-up to existing plans of around £10 billion in 2028–29 (or around £4 billion over and above manifesto promises); to maintain capital DEL as a share of national income would require a top-up of around £19 billion (or around £14 billion on top of implied manifesto promises). Section 3.5 discusses this further.
The need to prioritise
The challenge for the new government, then, is that it inherits a set of spending plans that imply large cuts to capital spending. There will be many competing demands upon the total. The government will need to prioritise. Rachel Reeves has already shown some signs of doing so: in her spending audit, she cancelled a number of ‘low value, unaffordable’ transport projects (including the A303 Stonehenge tunnel and the Restoring Your Railway programme) and announced a ‘full and comprehensive review’ of the New Hospital Programme (HM Treasury, 2024b). At the Spending Review, absent a big top-up to planned spending, the overall envelope will be tight. Just as with the resource budget, increases in capital funding for priority areas are likely – given the tight overall envelope – to mean cuts to other areas. That will mean a further round of difficult choices about which projects and programmes to cancel.
Consider health and defence, two of the departments with the largest capital budgets (Figure 3.11). To deliver the productivity improvements built into the NHS workforce plan, the government may decide that it needs to increase the health capital budget at the same rate as the resource budget, to maintain its capital intensity (if anything, a case could be made that the capital intensity of the NHS should increase; this case was strongly made in the recent Darzi report (Darzi, 2024)). If the Ministry of Defence resource budget is growing in line with GDP, then the defence capital budget would also need to grow in line with GDP to maintain total defence spending as a share of national income. Delivering those increases would require other departments’ capital budgets to be cut by 3.8% per year in real terms, or more than 14% in total over the next four years. That is before considering the need for more capital investment in the prisons estate, in research and development, in transport infrastructure, or anything else.
Figure 3.11 Capital funding by department, 2024–25
Source: HM Treasury, Spring Budget 2024.
Another likely area of focus is green investment. Labour pared back its plans for green investment while in opposition, but may now wish to spend more in government. There is no single definition of green spending, and the government does not typically report any consistent measure of how much it spends on green projects. The exception was the 2021 Spending Review, which set out the government’s planned emissions-reducing spending. While not perfectly comparable, this gives us a sense of the scale of Labour’s plans and how they might compare (shown in Figure 3.12). Even the latest, pared-back version of Labour’s green investment plans would – if delivered – represent a considerable increase on the recent past.
Figure 3.12 Breakdown of planned green expenditure at Spending Review 2021 and our estimate of Labour’s plans

Note: The 2021 Spending Review reported emissions-reducing DEL and AME expenditure, excluding administration budgets. The Labour manifesto uses a broader measure of green spending.
Source: Authors’ calculations using HM Treasury Spending Review 2021 and Labour Party manifesto 2024.
One notable feature of Labour’s recent discussion of its investment plans has been the focus on ‘crowding in’ private investment. The new ££7.3 billion National Wealth Fund is explicitly aimed at doing so, for example. It is interesting therefore to put the latest spending plans in the context of the OBR’s previous analysis of how much public and private investment might be required to deliver the transition to net zero (Office for Budget Responsibility, 2021). The Climate Change Committee’s ‘balanced path’ to net zero estimates the total economy costs of the transition. The OBR then varies the share of these total costs that are borne by the government. In the lower variant, the government only pays costs that relate to its own assets; in the central and higher variants, the government pays a share of private sector costs too. Figure 3.13 shows that the 2021 Spending Review and Labour’s plans sit somewhere between the lower and central OBR estimates, consistent with a greater role for the private sector in securing the net zero transition. If the government instead needs to take on a greater share of the costs, that would require higher levels of public investment – meaning either the overall envelope would need topping up, or other areas of capital spending would need to be cut back. Chapter 2 discusses longer-term fiscal consequences of the transition to net zero.
Figure 3.13 OBR estimates of public spending costs of the transition to net zero, alongside plans
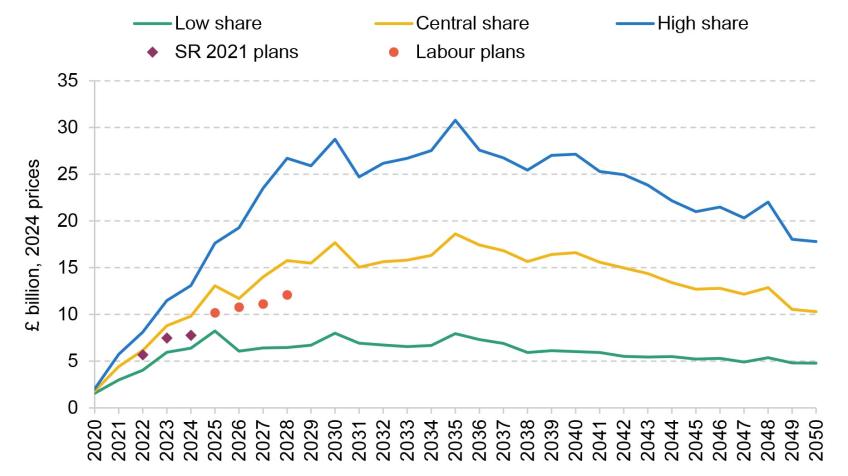
Source: Authors’ calculations using OBR Financial Risks Report July 2021, HM Treasury Spending Review 2021 and Labour Party manifesto 2024.
3.5 Options and choices for the Chancellor
We now bring together the analysis of previous sections and discuss the high-level public spending choices facing Ms Reeves in the Spending Reviews this autumn and next spring. To be clear, this is a subset of the choices she will face. For one, we do not discuss here the choices about spending classified as AME (e.g. spending on social security benefits and state pensions). And choices over how much to spend – and on what – will be bound up in questions around the Chancellor’s fiscal strategy and fiscal rules – including how to define government debt (Stockton and Zaranko, 2024). These issues, and the broader public finance implications of potential public spending plans, are discussed in Chapter 2. The focus here is public services and options for departmental spending. The bulk of our analysis focuses on the medium term, as it is the medium-term spending totals which are of most fiscal relevance, but we also consider the specifics of the 2025–26 allocations in Box 3.4.
Box 3.4 Decisions for the one-year Spending Review this autumn
The amount of public spending in 2025–26 is largely irrelevant for the question of whether the government is acting within its fiscal rules. The fiscal rule likely to be binding for this government is that debt should be falling between the fourth and fifth years of the forecast (see Chapter 2), so what matters in the coming Budget will be the forecast levels of debt in March 2029 and March 2030.
In that sense, the most significant decision this autumn will be the setting of the spending envelope for the rest of the parliament. The multi-year Spending Review next spring will be the ‘main event’ in fiscal terms, with 2025–26 budgets significant only to the extent that they affect spending in later years. Nonetheless, the finalising of departmental budgets for 2024–25 (in light of in-year overspends) and the setting of detailed allocations for 2025–26 are still important choices for the Chancellor in her first Budget and will be important for public services over the next year – not least in determining what sorts of pay awards for public sector workers are affordable.
Consider first the budgets for 2024–25. Here, the key choice is the extent to which the £22 billion of in-year spending pressures discussed above are met through additional spending, and the extent to which departments are asked to find offsetting savings. In addition to savings from the ending of the Rwanda migration partnership and the means-testing of winter fuel payments, the July spending audit asked departments to find £3.2 billion of in-year cuts to fund higher pay pressures. Newspaper coverage suggests that this has been met by a ‘Whitehall revolt’.a The final allocations for 2024–25 at the October Budget will confirm whether these cuts – or, indeed, further cuts – have been found, and from where.
The spending envelope for 2025–26 may then need topping up, to the extent that the net in-year pressures identified in 2024–25 reoccur next year. As discussed in Section 1.4, the additional spending on public sector pay, at the least, will be permanent. This, combined with manifesto promises, might require a top-up to 2025–26 plans of around £10 billion straight off the bat (see Figure 3.8). Even with such a top-up, Panel A of Figure 3.9 shows that under reasonable assumptions for what might happen to the NHS, defence, aid and childcare budgets, remaining ‘unprotected’ day-to-day budgets would be facing cuts. Avoiding these would require a further top-up of around £3 billion (taking the required top-up to £13 billion). This estimate is sensitive to the assumptions underpinning the analysis: if the NHS England budget grows a bit more slowly (at 2.0% per year, rather than 3.6% per year as we assume) then unprotected budgets might even rise on average without a need for that additional £3 billion top-up. On the flip side, if asylum costs remain elevated and are assigned to the Home Office up front (rather than being met ex post from the Reserve), the cuts for other budgets could be even greater.
The point is that funding is likely to be tight. Ms Reeves might need to increase plans for 2025–26 by something like £13 billion just to meet the ongoing costs of recent public sector pay deals, honour manifesto commitments and avoid cuts to unprotected departments (with uncertainty on either side of this figure). Providing meaningful increases to unprotected departments – which include, under our definition, things such as schools, job centres, prisons and grants to local councils – would very likely require an even bigger funding injection.
Under existing plans (those of the previous government), capital budgets will also face real-terms cuts between 2024–25 and 2025–26. Whether or not this is still the case come the October Budget will depend largely on how much of the funding in Labour’s ‘Green Prosperity Plan’ (£23.7 billion over five years) comes on stream in 2025–26. More generally, the extent to which capital budgets are prioritised in the one-year Spending Review this autumn will provide a concrete indication of this new government’s economic and fiscal strategy and attitude towards public investment.
ahttps://www.ft.com/content/5e4cbe80-c759-4c1c-9f3f-bd8a0f4dacc2.
Possible top-ups to spending plans
Sequencing
The new Chancellor has indicated that departmental allocations for 2025–26 will be set at the Budget and Spending Review on 30 October, alongside a final overall envelope for 2024–25 and 2025–26 (see Box 3.4 for a discussion). At the same time, she will need to update the overall spending plans – the ‘envelope’ – for later years through to 2029–30 (needed for evaluation of performance against the fiscal rules), even if detailed allocations for 2026–27 onwards will not be set out until the multi-year Spending Review in Spring 2025 (and if we are then to have biennial spending reviews that cover three years, then budgets for 2029–30 would not be allocated until a 2027 Spending Review). At the Budget, then, she will need to decide not only how much funding to provide to individual public services in the coming year, but also how much she wants to spend overall for the rest of the parliament.
These spending totals for future years will not be set in stone. Previous governments have shown a clear tendency, when they actually come to allocate funding between departments at a Spending Review, to top up the spending envelope. At the last four Spending Reviews (between 2015 and 2021), the RDEL envelope for the final year was topped up by an average of 3.7%, relative to the provisional totals that were in place beforehand (which, if history repeats, would correspond to a top-up of £19 billion in 2028–29)20. The Treasury may, as part of its negotiations with spending departments, decide to lowball these provisional totals in the expectation of a top-up later. In what follows, we abstract away from this and focus on the amount by which spending totals for the rest of the parliament might eventually need to be topped up, as this is what is most relevant from a fiscal perspective.
How big a top-up in 2028–29?
For the reasons discussed earlier in the chapter – not least the promises in the Labour Party manifesto and the scale of recent public sector pay offers – existing spending plans will almost certainly be increased at the October Budget. The key question is by how much. Figures 3.14 and 3.15 present some possible answers to that question for resource and capital funding, respectively.
Figure 3.14 Options for topping up the resource (day-to-day) envelope in 2028–29

Source: Authors’ calculations based on assumptions outlined in the text.
Taking resource funding first, Figure 3.14 shows that increasing the spending envelope to reflect this year’s public sector pay announcements would require a £9 billion top-up to plans for 2028–29. Delivering Labour’s manifesto promises would require a further £5 billion. This suggests that, at a minimum, Ms Reeves will need to increase day-to-day spending totals for 2028–29 by £14 billion. That would see overall resource DEL grow – from a higher 2024–25 starting point – by 1.2% per year over the next four years (versus 1% per year under the plans she inherited).
If the Chancellor also wishes to avoid making real cuts to unprotected budgets, she would need to find an extra £16 billion, taking the total to £30 billion. That would result in average RDEL growth of 2.0% per year in real terms – a less generous Spending Review settlement than seen in recent years, never mind during the 2000s (see Figure 3.2).
Flat real budgets for areas such as prisons, courts and adult skills would still be tight and could prove to be incompatible with the government’s objectives for public services. Increasing unprotected budgets in line with GDP instead (to maintain spending as a share of national income) would require an additional £17 billion in 2028–29 (a total top-up of £47 billion), taking average real-terms RDEL growth to 2.8% per year. In other words, even with a near £50 billion top-up, the day-to-day spending settlement would be less generous than what was announced by the then Chancellor Mr Sunak at the 2021 Spending Review (where original plans implied average real growth of 3.3% per year, though higher-than-expected inflation has reduced that to 2.2% per year – see Figure 3.3). To match that would require a top-up of around £60 billion.
Turning to capital, our interpretation of Labour’s ‘Green Prosperity Plan’ is that it will mean a £6 billion increase in capital DEL plans for 2028–29 (Figure 3.15). In that scenario, departmental capital budgets would still be falling over the next four years by an average of 0.8% per year. Avoiding those cuts would require a further £4 billion, taking the total top-up to £10 billion in 2028–29. If the Chancellor instead wishes to maintain capital DEL as a share of national income (i.e. to increase it in line with GDP, by 1.8% per year in real terms), a further £10 billion in 2028–29 would be needed, making £19 billion in total (after rounding). The government could, of course, decide to go even further; maintaining capital DEL as a share of national income should not be seen as an upper bound.
Figure 3.15 Options for topping up the capital (investment) envelope in 2028–29
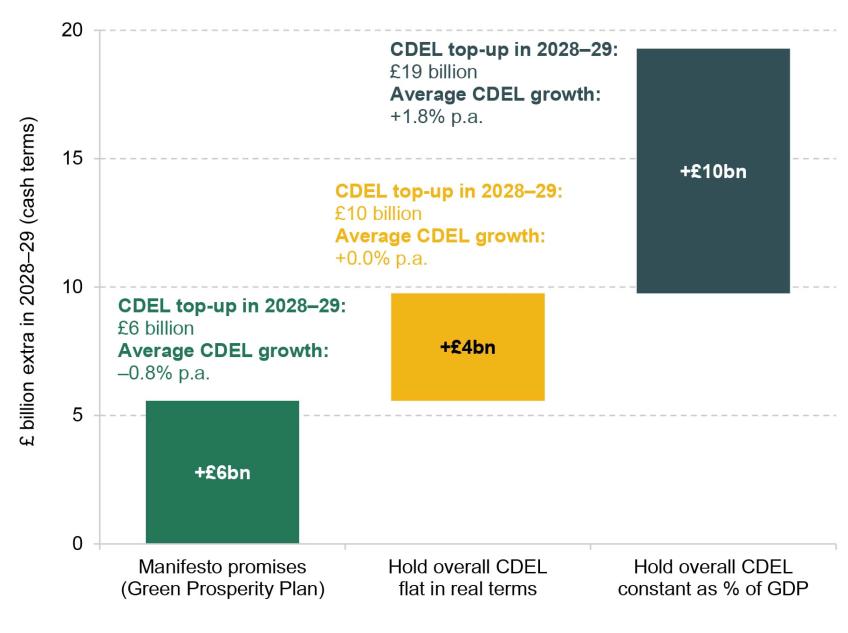
Source: Authors’ calculations based on assumptions outlined in the text.
Table 3.3 brings all of this together and considers four high-level scenarios:
Status quo. Increasing the day-to-day spending baseline to reflect public sector pay pressures, maintaining the growth assumptions bequeathed by Mr Hunt, and delivering on manifesto promises would require a total top-up to departmental budgets of £20 billion in 2028–29 (made up of £14 billion of resource and £6 billion of capital).
Avoid real-terms cuts. Increasing the day-to-day baseline and delivering the manifesto, but also increasing the envelope to avoid real-terms cuts to unprotected day-to-day budgets and to avoid real-terms cuts to overall capital budgets, would require a total top-up of £40 billion in 2028–29.
Avoid cuts as a % of GDP. Increasing the baseline and delivering the manifesto, and also maintaining unprotected resource budgets and overall capital budgets as a share of national income, would require a top-up of £66 billion in 2028–29.
Prioritise capital. Increasing the day-to-day baseline and delivering the manifesto, and maintaining overall capital budgets as a share of national income – thereby prioritising investment within the total – would require a top-up of £33 billion in 2028–29.
Table 3.3 Summary of options for 2028–29 DEL top-ups at the Budget
Top-up scenario | Extra spending in 2028–29 (relative to SB 2024 plans) | Average annual real growth rate |
Resource DEL scenarios |
|
|
Spring Budget 2024 plans | - | +1.0% |
| £9 billion | - |
| £5 billion | - |
Memo: baseline change and manifesto (A+B) | £14 billion | +1.2% |
| £30 billion | +2.0% |
| £47 billion | +2.8% |
Capital DEL scenarios |
|
|
Spring Budget 2024 plans | - | –2.0% |
| £6 billion | –0.8% |
| £10 billion | +0.0% |
| £19 billion | +1.8% |
Total DEL scenarios |
|
|
Spring Budget 2024 plans | - | +0.4% |
Status quo: Increase RDEL baseline, deliver manifesto (A+B+E) | £20 billion | +0.8% |
Avoid real-terms cuts: Increase RDEL baseline, deliver manifesto, avoid real-terms cuts to unprotected RDEL and overall CDEL (C+F) | £40 billion | +1.6% |
Avoid cuts as a % of GDP: Increase RDEL baseline, deliver manifesto, maintain unprotected RDEL and overall CDEL as a share of national income (D+G) | £66 billion | +2.6% |
Prioritise capital: Increase RDEL baseline, deliver manifesto, maintain CDEL as a share of national income (A+B+G) | £33 billion | +1.4% |
Note: SB 2024 = Spring Budget 2024. Average annual real growth rate is for the period from 2024–25 to 2028–29.
a Note that the estimates for C and D have been produced on the assumption that A and B are implemented (i.e. the modelling of the cost of avoiding cuts to unprotected budgets assumes that the envelope is topped up to reflect pay pressures in the baseline and manifesto promises).
Source: Authors’ calculations using assumptions outlined in the text.
These scenarios are not prescriptive, nor are they exhaustive. Note, for example, that even our most generous top-up to the capital budget (of £19 billion per year by 2028–29) would still be considerably less ambitious than the £28 billion of additional green investment each year originally announced by Ms Reeves. The scenarios are also sensitive to all manner of assumptions. They do, however, illustrate the fact that the required top-ups can get quite large quite quickly under quite modest assumptions. Chapter 2 puts these in the context of the broader public finances and performance against the new government’s fiscal rules.
Prioritise capital?
The previous subsection considered a possible ‘prioritise capital’ scenario, in which capital budgets would increase more quickly than day-to-day budgets. But more generally, when considering its spending options, an important question for the government is the extent to which it wants to prioritise capital spending – investment – relative to day-to-day public services. In her March 2024 Mais Lecture, Ms Reeves, as Shadow Chancellor, promised to ‘prioritise investment within a framework that would get debt falling as a share of GDP over the medium term’ (Labour Party, 2024), and Sir Keir Starmer recently warned the public to expect ‘short term pain for long term good’ (Prime Minister’s Office, 2024). These statements might point to a Spending Review that prioritises higher investment spending, at the cost of lower spending on day-to-day public services – possibly as part of a shift to a higher-investment, lower-consumption economy (Resolution Foundation & Centre for Economic Performance, 2023). This choice is clearly bound up in questions around the fiscal rules and the government’s economic and fiscal strategy more generally. Here, we focus just on the spending side of things and what it might mean to prioritise investment.
Within a fixed overall public spending envelope, there is a direct trade-off between spending an additional £1 on capital and spending an additional £1 on day-to-day spending. Even if the envelope is topped up, there is a choice of whether to prioritise investment or day-to-day spending.
For a government aiming to improve public service performance and productivity, and to focus on long-term solutions rather than short-term sticking plasters, there is a strong case to be made for prioritising capital investment. Across a range of public services – the NHS, prisons, courts, schools – the quality and quantity of buildings and equipment are a key limiting factor on performance (Warner and Zaranko, 2022; Hoddinott et al., 2024; Darzi, 2024). Higher levels of investment – particularly in areas such as transport and energy – could also contribute towards Labour’s growth and clean energy ambitions, plus a manifesto commitment to ‘strategically use public investment where it can unlock additional private sector investment, create jobs, and provide a return for taxpayers’.
But increasing capital spending relative to day-to-day spending would be challenging when the short-term pressures on services are so great. The whole reason behind the original separation of resource and capital budgets was that governments find it easier to cut back on investment when funding is squeezed, rather than things such as staffing numbers or pay. It is rather telling that even with this separation, under past governments there were frequent transfers from capital to resource budgets when public services faced financial pressures. In the Department of Health and Social Care, for example, these capital-to-resource transfers amounted to £0.6 billion in 2014−15, £1.2 billion in 2015−16 and 2016−17, £1 billion in 2017−18, £0.5 billion in 2018−19 and almost £1 billion in 2023–24 (Stoye, Warner and Zaranko, 2024).
One big test for a government that claims to want to prioritise investment will be the extent to which capital budgets are indeed prioritised within the total, and the extent to which those budgets are stuck to rather than transferred to meet day-to-day pressures. Any efforts to meaningfully prioritise investment will involve sacrifices elsewhere (Resolution Foundation & Centre for Economic Performance, 2023; Wilkes, 2024). But for a newly elected government with a large majority and a stated willingness ‘to accept short term pain for long term good’ (Prime Minister’s Office, 2024), the question is surely ‘If not now, then when?’.
Figure 3.16 illustrates the choices and trade-off that Ms Reeves faces between day-to-day and capital spending. For each panel, the horizontal axis shows the growth rate in day-to-day spending and the vertical axis shows the growth rate in capital spending. Each line represents a fixed overall spending envelope.
Figure 3.16 Trade-off between real growth rates in day-to-day spending and in capital spending given total spending envelope between 2024–25 and 2028–29

Note: Figures in parentheses denote the required top-up to the total DEL envelope. Uses our central RDEL and CDEL totals used throughout this chapter.
Source: Authors’ calculations based on assumptions outlined in the text.
Panel A illustrates the high-level choice. From a given starting point, the government can prioritise capital within the existing envelope (moving north-west along the black line) or can expand the envelope (shifting the line out to the right, to the purple line), which would allow for more spending on one or both of resource and capital.
Panel B then shows some specific options, based on the top-up scenarios presented in Table 3.3. The black square denotes Spring Budget 2024 plans. The green square denotes the ‘status quo’ scenario, with a higher baseline due to public sector pay pressures and Labour’s manifesto promises delivered, which would see resource DEL grow by 1.2% per year in real terms and capital DEL fall by 0.8% per year. The red square denotes the ‘avoid real cuts’ scenario (with average 2.0% growth in RDEL and CDEL flat in real terms); the blue square denotes the ‘avoid cuts as a % of GDP’ scenario (with average 2.8% growth in RDEL and 1.8% growth in CDEL); and the grey square denotes the ‘prioritise capital’ scenario (with average 1.2% growth in RDEL and 1.8% in CDEL).
The key point is that within the total envelopes implied by each of these scenarios (the line of the same colour as the square), Ms Reeves could choose to prioritise capital or day-to-day spending by moving along the line. For example, the ‘avoid cuts as a % of GDP’ line was calculated on the basis that Ms Reeves would grow unprotected RDEL and overall CDEL in line with national income. But with the same total top-up to spending, she could further prioritise capital. For example, if she chose to hold unprotected RDEL flat in real terms, this would mean capital spending could grow at 4.9% per year in real terms within the same overall envelope, rather than at 1.8% if unprotected RDEL grew in line with GDP.
Prioritise the usual departments?
Once Ms Reeves has decided on an overall envelope for day-to-day and capital spending, she must then decide how these are allocated to different departments. While it would be possible to allocate funding growth equally to all departments, this is unlikely in practice. Some departments will inevitably be prioritised over others – because they face greater pressures and/or because they are higher political priorities. Historically, the tendency has been for certain departments to be repeatedly prioritised and for others to do worse than the average. To illustrate this, Figure 3.17 shows the planned growth rate in day-to-day funding for selected departments relative to the all-department average for each Spending Review since 1998. Note this shows the planned growth rate, to capture which departments successive governments intended to prioritise for funding growth, rather than the actual out-turn growth rates.
Figure 3.17 Planned growth in resource (day-to-day) funding in selected areas, relative to the average, by Spending Review
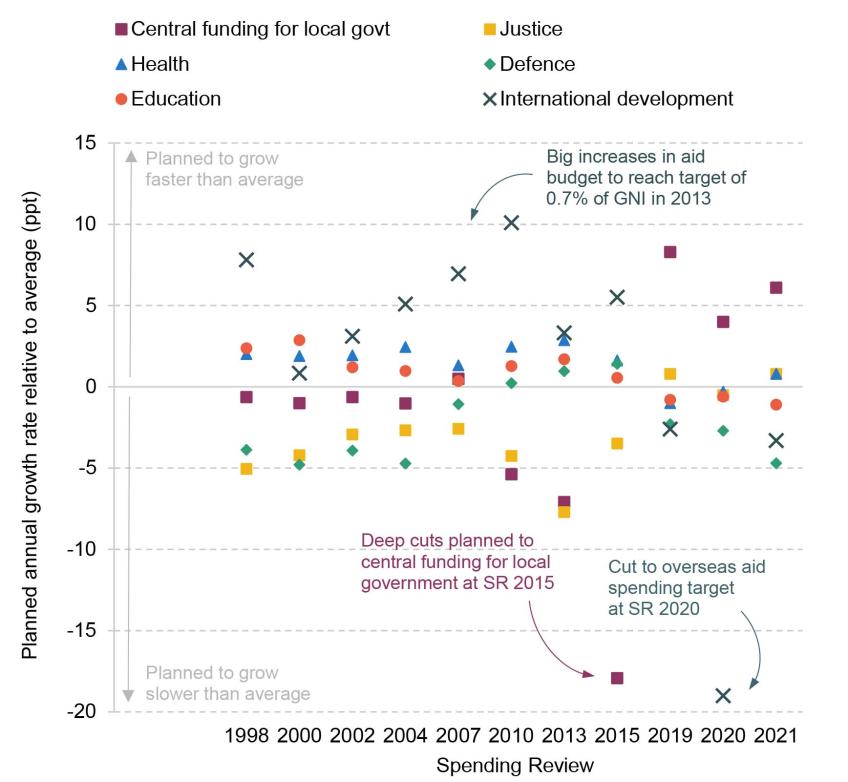
Note: Figures denote planned real-terms growth, not the out-turn. A figure of zero would indicate that spending in that area was planned to grow at the same rate as overall resource DEL. Real growth rates are taken from the Spending Review (SR) documents if published, and calculated using nominal spending plans and contemporaneous GDP deflator forecasts if not. ‘Justice’ refers to the Lord Chancellor’s Department from SR 1998 to SR 2002, the Department for Constitutional Affairs at SR 2004 and the Ministry of Justice from SR 2007 onwards. ‘Education’ refers to the Department for Education and Employment at SR 1998 and SR 2000, the Department for Education and Skills at SR 2002 and SR 2004, the Department for Children, Schools and Families at SR 2007 and the Department for Education from SR 2010 onwards. ‘Health’ refers to the Department of Health from SR 1998 to SR 2015 and the Department of Health and Social Care from SR 2019 onwards. ‘International development’ refers to the Department for International Development from SR 1998 to SR 2019 and the Foreign, Commonwealth and Development Office at SR 2020 and SR 2021. Central funding for local government is not the entirety of local government funding, as councils also raise revenue from local taxes.
Source: Authors’ calculations based on various Spending Reviews.
Between 1998 and 2015, Spending Reviews followed a similar pattern: health, education and international development would receive higher growth rates than average, while justice and (central funding for) local government would receive lower growth rates than average. Since the 2019 Spending Review, the pattern has been very different. Central funding for local government has done better than average at each of the last three Spending Reviews; justice has done close to or better than the average; and education and international development have done worse than average (in the latter case, considerably worse).
It may be that, in a tight funding environment, Ms Reeves decides to prioritise the ‘usual suspects’ – giving above-average increases to health, for example. This is ultimately a question of priorities, but we would sound two notes of caution.
First, many of the traditionally less protected areas of spending have faced large cuts since 2010 (see Figure 3.18). The above-average increases for these areas in recent years were likely the result of a recognition that the scale of these cuts was having a severe adverse effect on service provision. Imposing another round of cuts on services that are under considerable pressure (see Section 3.4), and in many cases still have lower real-terms budgets than was the case 15 years ago, would be challenging, to say the least.
Figure 3.18 Real-terms percentage change in day-to-day spending for selected departments, 2009–10 to 2023–24
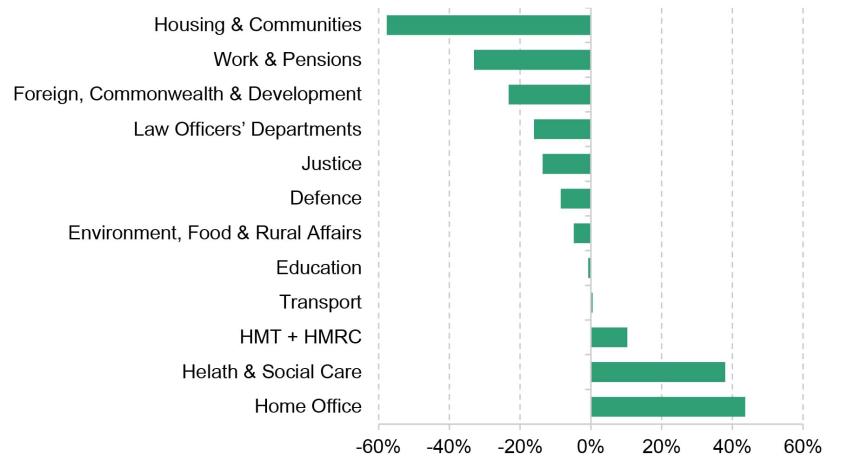
Note: ‘Environment, Food & Rural Affairs’ bar is adjusted for estimated direct payments to farmers, previously paid by the EU. ‘Housing & Communities’ excludes Shared Prosperity Fund funding. Only selected departments shown, with some excluded because of the difficulty in making like-for-like comparisons over time due to Machinery of Government changes. Changes are shown up to 2023–24 since final figures for 2024–25 spending are not yet available.
Source: Public Expenditure Statistical Analyses (various) and GDP deflator as of March 2024.
Second, what the Chancellor decides to do with the largest departments will dominate everything else. The three largest areas of spending within DEL – health and education in England, and the UK-wide defence budget – make up around two-thirds of planned day-to-day spending in 2024–25 between them. NHS England alone accounts for more than one-third of the total.
To illustrate the differences in department size, and what these mean for the Spending Review, Figure 3.19 shows the percentage increase in 2024–25 TDEL that could be achieved for different departments with a £1 billion increase in funding. For health and social care, £1 billion would increase funding by 0.5%. But for smaller departments, it would be a much larger increase. For example, £1 billion would increase funding by 8.6% for justice, 14.3% for environment, food and rural affairs or 48.1% for culture, media and sport. In other words, an additional £1 billion in funding would be little more than a rounding error within the NHS but could transform smaller public services. Equivalently, seeking to fund even very small percentage increases in the NHS budget through savings elsewhere would require deep cuts to smaller departments and potentially drastic changes in service provision.
Figure 3.19 Percentage increase in 2024–25 TDEL that can be achieved with a £1 billion increase

Note: Excludes departments with budgets less than £2 billion, budgets for the devolved nations, and small and independent bodies.
Source: HM Treasury’s Public Expenditure Statistical Analyses 2024.
Even with the potential top-ups discussed in a previous subsection, the rate of growth in the overall spending envelope is likely to be fairly modest by historical standards (and certainly relative to the last period when Labour was in office). Inevitably, this will require prioritisation and some tough choices about where any additional funding is to be targeted.
3.6 Conclusion
The new Chancellor faces an unenviable balancing act at the forthcoming Spending Review. On the one hand, the Labour manifesto committed to major improvements to public services. While funding is not the only thing that matters, and finding ways to boost public service productivity will be just as – if not more – important, many public services will need more money just to stand still, let alone improve. But Ms Reeves has also promised to stay within her ‘ironclad’ fiscal rules and not to raise the main rates of income tax or to increase National Insurance and VAT at all. She can, with some justification, point to the scale of the in-year spending pressures as an unhelpful bequest from her predecessor. But the medium-term challenge has long been apparent – even if it was all-but-ignored by both Labour and Conservatives during the recent general election campaign. It can be ignored no longer.
The most important choice for Ms Reeves is how much she wants to top up the overall spending envelopes for 2025–26 and beyond. It seems almost inevitable that there will be some top-up to the previous government’s spending plans, if only to fund costed manifesto commitments and higher public sector pay. But top-ups in the single billions would still imply real-terms cuts to some departments – cuts which might be difficult to reconcile with the promise that there will be no return to austerity. To avoid real-terms cuts to those unprotected departments and to overall capital budgets will require a top-up in the tens of billions – we estimate around £40 billion in 2028–29. Even that would leave spending growing more slowly than we have seen not just under the last Labour government but also relative to what Mr Sunak planned when he was Chancellor at the time of the last Spending Review.
These spending choices – how much to spend overall, how much to prioritise investment over meeting day-to-day pressures, and how much to allocate to particular services – are bound up with broader questions of economic and fiscal strategy. They promise to be highly revealing – and consequential.
References
Boileau, B., O’Brien, L. and Zaranko, B., 2022. Public spending, pay and pensions: IFS Green Budget 2022 – Chapter 4. https://ifs.org.uk/publications/public-spending-pay-and-pensions.
Crawford, R., Johnson, P. and Zaranko, B., 2018. The planning and control of UK public expenditure, 1993−2015. Institute for Fiscal Studies, Report 147, https://ifs.org.uk/publications/planning-and-control-uk-public-expenditure-1993-2015.
Darzi, A., 2024. Summary letter from Lord Darzi to the Secretary of State for Health and Social Care. Department of Health and Social Care, https://www.gov.uk/government/publications/independent-investigation-of-the-nhs-in-england/summary-letter-from-lord-darzi-to-the-secretary-of-state-for-health-and-social-care
HM Treasury, 1998. Economic and fiscal strategy report 1998. https://www.gov.uk/government/publications/economic-and-fiscal-strategy-report-1998.
HM Treasury, 2024a. Consolidated budgeting guidance 2024 to 2025. https://www.gov.uk/government/publications/consolidated-budgeting-guidance-2024-to-2025.
HM Treasury, 2024b. Fixing the foundations: public spending audit 2024–25. https://www.gov.uk/government/publications/fixing-the-foundations-public-spending-audit-2024-25.
Hoddinott, S., Rowland, C., Davies, N., Kim, D. and Nye, P., 2024. Fixing public services: priorities for the new Labour government. Institute for Government, https://www.instituteforgovernment.org.uk/publication/fixing-public-services-labour-government.
Hood, C., King, M., McLean, I. and Piotrowska, B. M., 2023. The Way the Money Goes. Oxford University Press.
Institute for Fiscal Studies, 2023. Autumn Statement 2023: IFS analysis. https://ifs.org.uk/events/autumn-statement-2023-ifs-analysis.
Institute for Government, 2023. Performance Tracker 2023. https://www.instituteforgovernment.org.uk/publication/performance-tracker-2023.
Labour Party, 2024. Rachel Reeves Mais Lecture 2024. https://labour.org.uk/updates/press-releases/rachel-reeves-mais-lecture/.
Mitchell, I., Tyskerud, Y. and Zaranko, B., 2024. Three ways to improve the design of the UK’s overseas aid spending target. Institute for Fiscal Studies, Comment, https://ifs.org.uk/articles/three-ways-improve-design-uks-overseas-aid-spending-target.
O’Brien, L. and Zaranko, B., 2023. A reduced discount rate for public sector pensions will add billions to employer costs. Institute for Fiscal Studies, Comment, https://ifs.org.uk/articles/reduced-discount-rate-public-sector-pensions-will-add-billions-employer-costs.
Office for Budget Responsibility, 2021. Fiscal risks report – July 2021. https://obr.uk/frs/fiscal-risks-report-july-2021/.
Office for Budget Responsibility, 2023. Forecast evaluation report – October 2023. https://obr.uk/publications/forecast-evaluation-report-october-2023/.
Office for Budget Responsibility, 2024. Economic and fiscal outlook – March 2024. https://obr.uk/efo/economic-and-fiscal-outlook-march-2024/.
Ogden, K. and Phillips, D., 2024. What is the outlook for English councils’ funding? Institute for Fiscal Studies, Report 324, https://ifs.org.uk/publications/what-outlook-english-councils-funding.
Prime Minister’s Office, 2024. Keir Starmer’s speech on fixing the foundations of our country: 27 August 2024. https://www.gov.uk/government/speeches/keir-starmers-speech-on-fixing-the-foundations-of-our-country-27-august-2024.
Resolution Foundation & Centre for Economic Performance, 2023. Ending stagnation: a new economic strategy for Britain. https://economy2030.resolutionfoundation.org/reports/ending-stagnation/.
Sibieta, L., 2024. School spending in England: a guide to the debate during the 2024 general election. Institute for Fiscal Studies, Report 316, https://ifs.org.uk/publications/school-spending-england-guide-debate-during-2024-general-election.
Stockton, I. and Zaranko, B., 2024. Definitions of debt and the new government’s fiscal rules. Institute for Fiscal Studies, Comment, https://ifs.org.uk/articles/definitions-debt-and-new-governments-fiscal-rules.
Stoye, G., Warner, M. and Zaranko, B., 2024. The past and future of UK health spending. Institute for Fiscal Studies, Report 312, https://ifs.org.uk/publications/past-and-future-uk-health-spending.
Tetlow, G., Bartrum, O. and Pope, T., 2024. Strengthening the UK’s fiscal framework: putting fiscal rules in their place. Institute for Government, https://www.instituteforgovernment.org.uk/publication/strengthening-uk-fiscal-framework.
Warner, M. and Zaranko, B., 2022. NHS funding, resources and treatment volumes. Institute for Fiscal Studies, Report 236, https://ifs.org.uk/publications/nhs-funding-resources-and-treatment-volumes.
Warner, M. and Zaranko, B., 2023a. Is there really an NHS productivity crisis? Institute for Fiscal Studies, Comment, https://ifs.org.uk/articles/there-really-nhs-productivity-crisis.
Warner, M. and Zaranko, B., 2023b. Implications of the NHS workforce plan: IFS Green Budget 2023 - Chapter 8. https://ifs.org.uk/publications/implications-nhs-workforce-plan.
Warner, M. and Zaranko, B., 2024. Home Office budgeting and asylum overspends. Institute for Fiscal Studies, Comment, https://ifs.org.uk/articles/home-office-budgeting-and-asylum-overspends.
Wilkes, G., 2024. Political choices in choosing growth. https://freethinkecon.wordpress.com/2024/09/18/political-choices-in-choosing-growth/.
Zaranko, B., 2024. Public investment: what you need to know. Institute for Fiscal Studies, Explainer, https://ifs.org.uk/articles/public-investment-what-you-need-know.
Endnotes
Authors

Bee Boileau
Bee joined the IFS in 2021 as a Research Economist and works in the Retirement, Saving and Ageing sector.

Max Warner
Max joined the IFS in 2020 as a research economist in the Healthcare Sector, with a focus on the NHS labour force and adult social care in England.

Ben Zaranko
Ben is a Senior Research Economist and an editor of the IFS Green Budget. His work focuses on the health and social care system and UK fiscal policy.
More from IFS
Understand this issue


Policy analysis


Academic research


