
Downloads

Public spending, pay and pensions
PDF | 1.43 MB
Key findings
1. The public sector pay settlements announced this July will pose severe budgetary challenges for many areas of government. Overall funding for public services was fixed in cash terms for the next three years in last October’s spending review, at which this year’s double-digit inflation was not predicted. Departmental budgets were predicated on pay awards in the region of 3%, far below the current rate of inflation, and below the pay awards of roughly 5% (on average) announced over the summer. These pay awards are estimated to increase departmental staffing costs by around £5 billion this year, compared with the (approximate) 3% baseline built into existing spending plans. Offering an inflation-matching pay award to all public sector employees would add more like £18 billion.
2. Departmental funding settlements have not been increased to account for these additional costs. Meeting them from within existing budgets will be especially challenging given the context of sharply rising energy prices and elevated general inflation, which reduces the scope for savings elsewhere. If costs were met entirely through cuts to employment (i.e. to keep the total wage bill to what was expected when the spending settlements were made), a reduction of approximately 110,000 public sector workers (or 1.9% of the projected 2022–23 public sector workforce) would be necessary this year. Full inflation protection for public sector employees would increase that number to 390,000 (or 6.8% of the workforce). If some areas of government (e.g. the NHS) were exempt from any headcount cuts, the required cuts elsewhere would be deeper.
3. The challenge is, if anything, more acute in future years. Compensating departments for the additional costs of the pay awards this summer would mean an additional £5 billion or so this year (2022−23); if pay awards matched inflation after this year, that figure would rise to more than £10 billion by 2024−25. If no such compensation were forthcoming, the government would have to cut headcount by more than 220,000 by 2024−25 (or 3.8% of the projected 2024–25 public sector workforce) to stay within existing plans for the staff pay bill. If, instead, the government offered inflation-matching pay awards this year and each of the next two years, the additional costs would rise to around £25 billion by 2024−25, or the headcount reduction required to stay within existing budgets to 500,000 (8.6% of the public sector workforce).
4. The new Chancellor Kwasi Kwarteng must either top up those spending plans to fund these higher-than-expected pay awards or accept that the quality of public services will (further) deteriorate. This is one of the central fiscal choices for this autumn. Indeed, this could be among the defining decisions of the remainder of this parliament.
5. There is a case for reforming the fiscal framework to lessen the disconnect between the planning horizons for public sector pay (set annually) and departmental budgets (set on a multi-year basis). That could be achieved by setting the same planning horizons for both; longer-term horizons, though, would exacerbate pre-existing problems of public sector pay inflexibility, and shorter-term horizons might impede departments’ ability to budget effectively. Our preference would be to instead reform the spending framework, so that settlements are automatically reopened and reassessed in exceptional circumstances, defined as occurring when pay and/or other cost increases deviate sufficiently from the assumptions made (and published) when plans were originally set.
6. Even the higher-than-budgeted pay awards this year may not be enough to head off concerns around recruitment and retention – or widespread industrial action. The vast majority of public sector workers will experience a real-terms pay cut this year, and are likely to experience a bigger real-terms cut than their counterparts in the private sector. Public sector pay awards of 4–5% this year imply real-terms cuts of more than 5%, and are broadly similar to expected private sector pay settlements of around 6% (though may compare less favourably when bonuses, more widespread in the private sector, are taken into account).
7. The gap between pay growth in the two sectors this year is unlikely to be especially large, but comes after a decade in which public sector pay has been falling relative to the private sector and, for many public sector jobs, falling in real terms. The government needs to ensure it has the right number and mix of staff to provide its desired range and quality of public services. It is therefore essential to consider trends in public and private sector pay (and overall remuneration) together: the private sector helps define outside options for public sector workers. The continuing fall in public sector pay relative to the private sector poses recruitment and retention challenges for public services, and could threaten the government’s ability to deliver on its public service objectives (such as clearing the NHS backlog, ‘levelling up’ primary education and reforming adult social care funding).
8. The raw difference between public and private sector hourly pay levels, which does not take account of the different characteristics of employees in the two sectors, has fallen from 13% in 2007−08 to 7% in 2021−22. The conditional public–private pay differential, which controls for the fact that public sector workers tend to be more educated, older and more experienced, has fallen steadily from around 3% in 2007−08 to slightly below zero in 2021−22. This public–private pay differential is now less favourable to the public sector than at any point in the past 30 years. This is true of both men and women, though the estimated public–private pay differential for women in 2021−22 remains positive (+2.2%) and considerably higher than for men (−4.6%).
9. Alongside pay, employer contributions to pension schemes are an important part of the overall difference between public and private sector remuneration. Public sector workers are much more likely to be enrolled in a workplace pension (91% had a workplace pension in April 2021, compared with 75% of private sector employees) and more likely to be in – typically much more generous – defined benefit schemes (82% were in a defined benefit scheme in 2021, compared with 7% of private sector workers). Whereas almost half (47%) of public sector employees received an employer pension contribution of at least 20% of their pay in 2021, the same was true of just 2% of private sector employees.
10. The relative generosity of employer pension contributions in the public sector has been growing over time. The average employer contribution rate in the public sector grew by around 5 percentage points between 2012 and 2021, rising to 18% of pay in 2021. The average employer contribution rate in the private sector is considerably lower and has been growing more slowly: the average across all private sector employees (including those who do not participate in a pension scheme) rose by around 2 percentage points over the same period, reaching almost 6% of pay in 2021.
11. When taking an estimate of employer pension contributions into account, there was a raw difference of 21% between average public and private sector remuneration in 2021. When controlling for employee characteristics, we estimate the average public–private remuneration differential to be around 6% (meaning that public sector workers are paid roughly 6% more than their private sector counterparts on average, once pensions are accounted for). This total remuneration differential has fallen in recent years, but to a lesser extent than when considering pay alone, as a result of the increasing relative generosity of public sector pension contributions.
12. There is a strong case for rebalancing public sector remuneration away from pensions and towards pay. A far greater share of overall public sector remuneration is deferred, in the form of both employer and employee pension contributions, compared with the private sector (20.1% versus 7.6% on average in 2021), and this difference has been increasing over time. That means for a given level of remuneration, take-home pay is lower in the public sector. One option, as a starting point, would be to reduce employee pension contributions in the public sector, alongside a commensurate decrease in pension generosity. That would increase take-home pay for public sector employees with no change to the costs for their employers.
13. The public sector pay differential varies considerably across the UK, implying that regions may face varying levels of difficulty with recruitment and retention, and potentially creating unintended and undesirable variation in the quality of public services. The conditional public–private pay (and total remuneration) differential is lowest in London and the South East, and highest in Wales, Scotland and the North East. The average nurse in the North East earns 17% more than the average employee in the region, versus just 5% more in the East of England and 9% less in London. The average secondary school teacher in the North East or Wales earns over 50% more than the average in their region; a secondary school teacher in the South East earns 22% more than the average. Pay is not, of course, the only factor affecting the public sector’s ability to recruit and retain skilled workers, and it is not obvious that the areas with the lowest public–private differential are those facing the greatest difficulties with recruitment.
4.1 Introduction
The public sector pay bill amounted to £233 billion in 2021−22, representing more than 20% of total government spending, 33% of what government spends on public services and almost 10% of national income. Decisions over what happens to the pay of the 5.7 million public sector employees are therefore of considerable fiscal significance – as well as being of obvious importance to those employees and their families. In the current climate, with the UK economy staring down the barrel of a recession and double-digit inflation, these decisions are fraught with even more difficulty than usual.
Ultimately, public sector pay policy should be set with regard to the public services that the government wishes to deliver. From this flows a staffing need, and pay can then be set in order to ensure that the government can recruit, retain and motivate the appropriate number and mix of employees. That suggests a focus on labour market conditions and, in particular, a focus on how public sector pay and remuneration compare with the private sector. Providing such a comparison is one of the key aims of this chapter.
Of course, the government should be considering the trade-off between higher public service spending and the taxes, or borrowing, required to pay for it, and so choices over the range and quality of desired service provision should be made in the round, at fiscal events. Public sector pay decisions are constrained by whether or not the government is willing to countenance the level of taxes and/or borrowing associated with them. Public sector pay policy ought not to be restricted by, or calibrated in order to achieve, broader distributional objectives (such as helping low-income households with soaring energy bills) nor macroeconomic objectives (such as limiting aggregate demand to curb inflation). Better tools for each of these tasks are available.
With this in mind, the situation for the new Chancellor heading into the autumn Budget is as follows:
1 In the face of elevated private sector pay awards, pushed up by much elevated inflation, public sector pay awards need to be higher than what was assumed a year ago.
Pay awards of 2–3% (as originally budgeted) would not be sufficient in the current context. This has been recognised by the pay review bodies in their recommendations (which cover around 42% of all public sector employees) and by departments, which have accepted those recommendations. Most public sector employees will now receive a pay rise of roughly 4–5% (with some receiving more than this and some receiving less).
2 The spending plans set out last year are not able to accommodate those higher pay awards without making painful cuts to headcount or other budgets.
The pay awards announced by government will increase departments’ staff costs by approximately £5 billion (or around 2%) a year, relative to what was budgeted for in October 2021. Meeting these additional costs will be made all the more difficult by soaring gas, fuel and food prices, all of which push up departments’ costs and reduce the scope for savings elsewhere.
3 The new Chancellor must either top up those spending plans or accept that the quality of public services will (further) deteriorate.
Those spending plans need to be topped up if – and it is a crucial if – the government still wishes to provide the same range and quality of public services. Delivering on all the government’s previous public service objectives (such as clearing the NHS backlog, ‘levelling up’ primary education or ‘fixing’ adult social care) already looked challenging under the spending envelope set out last autumn. Now, it looks nigh on impossible.
4 Choosing not to compensate departments, and instead allowing public service quality to (further) deteriorate, would be one possible response to the UK becoming poorer as an energy- and food-importing nation.
There are no easy options here. As ever, there are trade-offs. Leaving spending plans unchanged would mean public services having to make difficult cuts at a time when many are already showing signs of severe strain. Topping up spending plans would, all else being equal, push up borrowing and lessen the scope for tax cuts. Whatever choice is made, it should be made openly, honestly and transparently – ideally at a full fiscal event.
5 Whether or not departments are compensated for the additional costs of the pay awards announced so far, these awards will be below inflation and likely below the average pay awards seen in the private sector.
The government has effectively announced that the vast majority of public sector workers will experience a real-terms pay cut this year. Average pay in the private sector is not expected to keep pace with inflation either, but it is expected to grow by more than in the public sector. Public sector workers are therefore likely to see their pay fall behind not just prices, but also the pay of their private sector counterparts.
6 This comes after a decade in which public sector pay (and remuneration) has already fallen in real terms, and fallen relative to the private sector.
After more than 10 years of pay restraint, public sector workers are now paid less on average than similar workers in the private sector. This is especially true for higher earners and those living in London and the South East. After accounting for employer pension contributions, public sector workers do have higher remuneration, but this gap has narrowed considerably over time. Ongoing pay restraint in the public sector could threaten the government’s ability to recruit, retain and motivate the skilled people required to provide its desired range and quality of public services.
These challenges will extend beyond this autumn: the costs of pay increases compound over time, and departmental budgets for future years may also need to be revisited. There is also a broader set of longer-term policy questions raised by this analysis. These include – but are by no means limited to – the appropriate structure of public sector remuneration (with a strong case for rebalancing away from employer pension contributions and towards pay), and options for addressing the disconnect between the planning horizons for departmental budgets and public sector pay awards (which must be met from those budgets).
This chapter proceeds as follows. Section 4.2 outlines the pay announcements already made. Section 4.3 considers what this means for the Budget and the key options and trade-offs for the new Chancellor. To place these in context, Section 4.4 compares headline pay in the public and private sectors: how pay levels in each sector have evolved over time, how the two wage distributions compare, and how these findings differ after accounting for differences in the characteristics of workers. Section 4.5 then considers how this public–private pay differential varies across the wage distribution, between men and women, and across different regions. Section 4.6 turns to another important form of remuneration – employer pension contributions – and examines how these compare across the public and private sectors. Building on this, Section 4.7 provides estimates for how pay compares in each sector after accounting for employer pension contributions. Section 4.8 considers some of the longer-term policy implications of this analysis. Section 4.9 concludes.
4.2 Pay announcements so far
Pay review bodies’ announcements
Public sector pay is set by the government, but informed by eight independent pay review bodies, which cover around 42% of public sector workers (Office of Manpower Economics, 2021).1 These bodies collect evidence from various sources – including employers, government departments and unions – and make (non-binding) pay recommendations.
In July this year, the government published seven of the eight pay review bodies’ reports, alongside its response, which determined 2022−23 pay levels for the 2.3 million or so workers covered by the agreements. The NCARRB report (which covers the National Crime Agency) for 2022 has not yet been released. The recommendations ranged broadly across pay increases of 3.75–5%, with higher pay awards recommended for the lowest-paid staff. These increases were, in general, accepted by departments.
Specifically, this financial year NHS workers will receive a rise of £1,400, enhanced for staff in Agenda for Change bands 6 and 7 so that overall it is equivalent to a 4% rise.2 Doctors and dentists will receive a raise of 4.5%. Teachers will receive an increase of between 5% (for top-band workers) and 8.9% (newly qualified teachers outside London). Prison staff will receive at least a 4% raise, armed forces 3.75% and police an uplift of at least £1,900. Senior civil servants will receive a 2% raise.
These changes, for the vast majority of public sector workers, amount to a real-terms pay cut: using September Citi forecasts, CPI inflation is set to average 10.5% over the 2022–23 financial year (see Chapter 2). They are, though, above what was originally budgeted for and built into departmental spending allocations, an issue to which we return below.
Other pay announcements
The pay review bodies cover less than half of all public sector workers. There is no pay review body for local government staff, for instance, nor for junior civil servants.
The National Employers for Local Government Services (who represent the employers of more than 1.5 million local government employees in England, Wales and Northern Ireland) also published their pay offer in July 2022.3 Council employees were offered a flat-rate pay increase of £1,925, equating to a pay rise of more than 10% for those on the lowest pay points and around 4% for senior council and school staff.4
The guidance for pay-setting for junior civil servants was published in March 2022. In 2022−23, departments were able to make average pay awards of up to 2%, with some flexibility to make awards of up to 3% where additional conditions were met.5
Targeting the lower-paid
One effect of the pay review settlements has been to narrow the relative pay differences between the lowest and highest public sector earners. This continues the trend of the last decade, where higher-paid workers have seen their pay grow more slowly than their lower-paid counterparts.
In particular, teachers’ and NHS workers’ pay scales have been further flattened by the 2022−23 pay settlements. Newly qualified teachers (outside London) have been awarded a pay increase of 8.9%, compared with 5% for teachers at the top pay bands. NHS workers’ pay will be increased by £1,400, which amounts to a 9.3% increase for the lowest earners, compared with 4% for more experienced, higher-earning staff (such as senior nurses and midwives in bands 6 and 7).
This could lead to increasing difficulty with recruitment and retention of higher-paid public sector workers, particularly as private sector wages are rising particularly strongly at the higher end of the wage distribution, potentially providing more attractive outside options.6
Progression into management and supervisory roles may also become less attractive, as a result of the increasingly meagre financial returns for progressing up the pay scale. The dentists’ and doctors’ pay review body report, for example, discussed a growing difficulty in recruiting for higher-paid roles, with ‘interest in senior, leadership and contractor roles … waning’ (DDRB, 2022).
While lower-earning workers are likely to be worst affected by the cost of living crisis, and policymakers are therefore understandably keen to provide support, public sector pay policy is not the best method by which to do so (Zaranko, 2022a). More targeted distributional policies – such as changes to universal credit, or direct support with energy bills – would be preferable, and would apply across both the public and private sectors. Instead, public sector pay policy should focus on those areas where recruitment and retention concerns bite most deeply.
This is not to say that pay increases should not be focused at the bottom end of the pay scales, as lower pay bands may in fact be the areas for which recruitment and retention concerns are most acute. Some review body reports this year emphasised particular difficulties at lower pay grades: the Prison Service Pay Review Body report described a ‘crisis in the recruitment and retention of Band 2 and 3 staff’, saying that ‘pay, in particular take home pay, is a significant contributory factor to this’ (PSPRB, 2022). The report discussed the role played by supermarkets, coffee shops and online retailers in providing attractive outside options in the private sector. Similar concerns were raised in the NHS Pay Review Body report, which discussed an ‘active alternative employment market for lower banded staff’, referring again to the competition from supermarkets and warehouse work (NHSPRB, 2022). Non-pecuniary aspects of public sector roles – such as the potentially greater stress associated with working in the health service during a pandemic, relative to an alternative role in the private sector – could well be just as important as pay.
Teaching is another occupation for which further pay compression may be sensible, with recruitment concerns particularly stark at lower bands. Teachers’ decisions are more sensitive to pay earlier in their career, a point at which they also have a higher propensity to leave. Previous work at IFS has argued that higher initial salaries for teachers and lower pay rises would be likely to help with retention concerns (Sibieta, 2022b).
More generally, targeting pay awards at the lower-paid may well be the most appropriate use of resources, given the specific recruitment and retention challenges in each sector. But such an approach should be justified on those grounds on a case-by-case basis, rather than on the grounds of broader distributional or macroeconomic objectives.
How does this compare with the private sector?
On the basis of the pay offers discussed above, most public sector workers will not see their pay rise as fast as prices and so will experience a real-terms pay cut. But that is also true for most workers in the private sector. Private sector pay settlements are perhaps the most important point of comparison when considering public sector pay awards, since they help to define public sector workers’ outside options, and thus affect the ability of the public sector to recruit and retain workers.
We provide a detailed comparison of average earnings in the public and private sectors in Section 4.4. For now, it is sufficient to note that private sector earnings are currently growing considerably faster than public sector earnings, with annual growth in nominal private sector earnings at 6.2% in the three months to July 2022, compared with 1.8% in the public sector (excluding financial services). In the three months to April 2022, the gap was even greater: 8.0% average annual growth in the private sector and 1.5% in the public sector.
Looking at what is happening to average earnings, though, may not give the best indication of the ‘true’ change in pay for the same worker in the same job. Compositional change within the public and private sector workforces has an effect on average pay, and this compositional change is typically especially marked during recessions. As discussed in Box 4.1 later, compositional change and furlough in the private sector during the first nine months of 2021, in particular, will mean that private sector pay growth is overstated to some extent. Changes in average pay could also reflect changes in hours worked: if workers choose to pick up extra overtime shifts in the face of rising energy bills, that would increase their weekly earnings but should be considered distinct from an inflation-matching rise in their hourly wage.
Median pay settlements in the private sector, which are – the government argues – ‘most comparable to … pay review body decisions’, were equal to 4% in the three months to May 2022.7 According to the Bank of England’s August 2022 Monetary Policy Report, employers ‘expect pay settlements to average 6% over the next year’ – though many firms reported that they were waiting to see how much further CPI inflation rose before deciding or reporting their expected pay settlements (Bank of England, 2022). As discussed in Section 4.4, private sector employers are also more likely to award one-off bonuses. Around a quarter of firms surveyed by the Bank of England had given, or were considering giving, these sorts of payments to compensate staff for the higher cost of living in the next year.
This implies that this year’s public sector pay settlements of 4–5% will be slightly below private sector settlements, but to a lesser extent than might be implied by average earnings figures. Although (at the time of writing) the difference between pay growth in the two sectors seems likely to be reasonably modest – say, 1 or 2 percentage points – it is important to note that this would come after a decade in which public sector pay has already fallen both in real terms and relative to pay in the private sector (see Section 4.4).
Moreover, the labour market is tight, with vacancies across the public and private sectors. The NHS Pay Review Body report, in particular, warned about the number of vacancies – 100,000 – across the service, as did the Prison Service Pay Review Body report, which mentioned the ‘increasing number of vacancies across the current prison estate’ (NHSPRB, 2022; PSPRB, 2022). In these conditions, a competitive pay offer is especially important in order to recruit and retain staff.
4.3 Options and challenges for the new Chancellor
Additional costs for departments
There are around 5.7 million employees working in the public sector (around 4.8 million full-time equivalents, FTE), employed at an annual cost of £233 billion in 2021−22. Of these, around 5.5 million (4.6 million FTE) are employed by general (i.e. central and local) government, with the remainder employed by public corporations. What happens to their pay is of considerable import for the overall level of government spending. Even relatively small-sounding differences in the percentage pay increases awarded to these workers can mean a multi-billion-pound increase in the cost of employing them.
When the government set out three years of departmental spending plans last October, the outlook for inflation was benign, at least relative to what we are now experiencing. CPI inflation was forecast to peak at 3.7% in 2022−23 and average 2.7% over the three years covered by the spending review (2022−23, 2023−24 and 2024−25). Plans were underpinned by assumptions over the likely scale of pay awards over the period. These assumptions – which in any case will have varied across departments, services and staffing groups – were not made public. To get a sense of how much the government was expecting to spend on public sector pay when setting out its spending plans, we therefore need to make an assumption about the assumptions.
For the purposes of illustrating the broad scale of the additional pay costs facing departments, we assume that departmental budgets were predicated on annual pay awards of 3%. Under the inflation forecasts at the time, this would have amounted to modest real-terms pay growth over the three-year spending review period. This also would have been broadly in line with the Office for Budget Responsibility’s concurrent forecast for average earnings growth, and so consistent with the government’s stated policy of having public sector pay maintain ‘broad parity with the private sector’ (HM Treasury, 2021, paragraph 1.83).
The forecasts for inflation that underpinned the spending review have swiftly been overtaken by global events and changing economic conditions. So too have the pay assumptions built into spending plans. As described above, the precise pay awards vary across sectors and staffing groups, but most staff will receive a pay award in the region of 5% (with some receiving more and some receiving less). Relative to a world of 3% pay awards, this would be expected to increase the government’s pay bill by approximately £4.8 billion.
Table 4.1 provides a rough breakdown of this 5% award across broad sectors of government, based on the fraction of (FTE) general government employment accounted for by each. The size of the NHS and education sectors as employers (1.7 million and 1.1 million FTE employees, respectively) means that more than half of the additional costs would fall there.
These figures are approximate and are intended only to provide a broad illustration of the scale of the issue at hand. If instead government spending plans were based on 2.5% annual pay awards, the estimated additional cost of the recent round of pay awards would rise to around £6.0 billion in 2022−23. Alternatively, if the plans were based on average annual awards of 3.6% (the OBR’s October 2021 assumption for average annual growth in pay bill per head between 2022–23 and 2024–25), the additional cost would fall to £3.4 billion.
Table 4.1. Estimated additional costs for central and local governments arising in 2022–23 from a 5% or inflation-matching (10.5%) pay award, relative to a 3% baseline
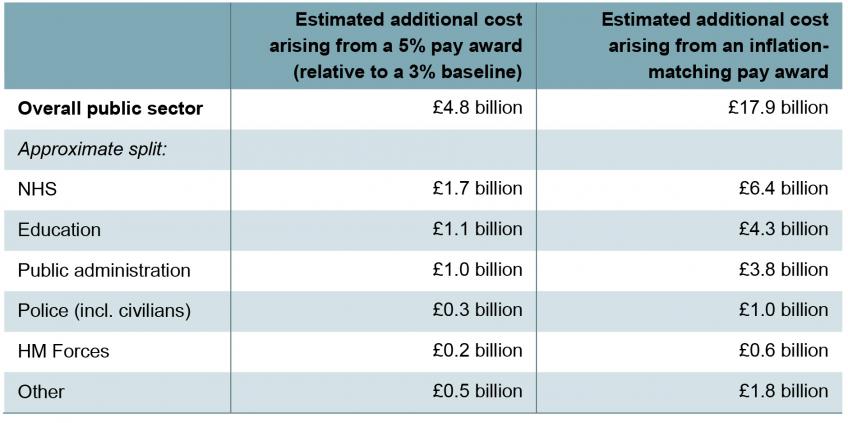
Note: The approximate split across sectors is based on the proportion of full-time-equivalent general government workers employed in each. The assumed rate of CPI inflation in 2022−23 (10.5%) is taken from September 2022 Citi CPI forecasts. Figures are UK-wide.
Source: Authors’ calculations using table 5.3 of HM Treasury PESA 2022, Citi September 2022 CPI inflation projections and ONS public sector employment statistics.
At the time of writing, it is possible that trade unions representing large swathes of public sector workers will choose to reject the government’s pay offer and ballot their members for strike action. Table 4.1 also shows an estimation of the additional costs that might arise from an inflation-matching pay award. A pay award of 10.5% – the average rate of CPI inflation forecast in September 2022 by Citi for the 2022−23 financial year – would, relative to a 3% baseline, increase departments’ costs by almost £18 billion.
Even that would fall short of what some unions are demanding (the Royal College of Nursing demanded a pay rise of 5% above inflation, for example) but would see public sector pay grow much more quickly than private sector pay over the coming year. The £13 billion difference between the two figures in the first row of Table 4.1 represents the aggregate cut to the public sector pay bill, relative to expected CPI inflation, under the government’s proposals.
To top up, or not to top up: that is the question
Regardless of the precise figure, it is clear that unexpectedly high pay awards will increase staffing costs for public services and, unless accompanied by additional funding, pose budgetary challenges for departments.
Departmental funding has not been adjusted from its level set in October last year. The fact that pay settlements were higher this year than was expected means that departments must make savings elsewhere in order to stay within their spending limits. This challenge is exacerbated by higher-than-expected general inflation, and rising bills for things such as energy, food and fuel. Recent work at IFS estimated that higher inflation would erode more than 40% of the real-terms increases in departments’ day-to-day budgets originally planned between 2022−23 and 2024−25 (Zaranko, 2022b).
Separate IFS calculations imply that cost increases for schools – accounting both for the increases to teachers’ pay and for energy and food prices rising – will be ‘just about affordable’ on average in 2022−23, but that existing spending plans imply real-terms cuts after that point (Sibieta, 2022a). Schools have already warned about their inability to cover the costs of payroll increases within existing budgets, with many schools having set budgets for the next academic year on the basis of a 3% pay rise.8 One way in which increased payroll costs could be met without increasing the overall level of spending (and thus staying within existing budgets) is through staffing cuts, which some schools are warning are likely.9
The NHS Confederation has warned about the consequences of the additional pay rise for NHS staff coming without any additional funding, saying that it could mean cuts to patient care and increased waiting times.10 An NHS spokeswoman said that, in order to fund the pay rise within existing Department of Health and Social Care budgets, the NHS would ‘need to release money from existing programmes, regrettably impacting on the planned rollout of tech and diagnostic capacity across the health service’.11
Trade-offs between spending, pay and employment
Trade-offs for 2022–23
To illustrate the scale of the budgetary challenge facing departments from 5% rather than 3% pay awards, we estimate the reduction in headcount that could be required for departments to stay within existing budgets.12 If savings were entirely made through reductions in headcount (rather than cuts to non-staff budgets), a reduction of approximately 110,000 public sector employees would be necessary. If half of the overall savings came from headcount reductions – which would imply making cuts to other budgets at a time when energy, food and fuel bills are soaring – this would still mean a reduction of around 55,000 employees. This would make it challenging to meet the kinds of public sector targets currently in place, and would likely lead to a deterioration in the quality of public services more generally.
Between 2010 and 2016, the public sector workforce headcount (excluding nationalised corporations) fell by around 600,000, before rising again by almost 400,000 between 2016 and 2022. A reduction in public sector employment running into the hundreds of thousands would not, therefore, be unprecedented, but would have to be made rapidly, and against the backdrop of already-challenging targets for public services (such as clearing the NHS backlog or ‘levelling up’ primary education).
Figure 4.1. Combinations of pay awards and changes to public sector employment consistent under different illustrative overall pay bills for 2022−23
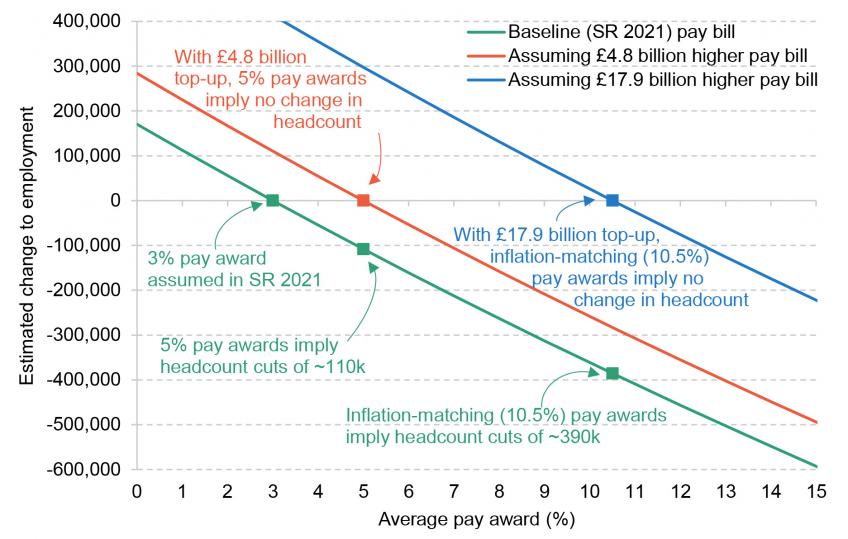
Note: The assumed rate of CPI inflation in 2022−23 (10.5%) is taken from Citi’s September 2022 CPI forecasts. All figures are illustrative and assume that budgetary savings are (can be) made only through changes in headcount. Baseline (SR 2021) refers to the approximate pay bill consistent with 3% pay awards, as per Spending Review 2021.
Source: Authors’ calculations using HM Treasury PESA 2022, Citi September 2022 CPI forecasts and ONS public sector employment statistics.
Figure 4.1 illustrates the broader trade-off between pay and employment for the financial year in progress (2022–23). This exercise makes the simplifying assumption that cuts to headcount are the only way in which departments can make budgetary savings, in order to make a simple point. For a given level of spending on staffing, a higher pay award implies a smaller workforce, and vice versa. The figure illustrates, for instance, that under the estimated pay bill consistent with Spending Review 2021 plans (the green line), a 5% pay award would require headcount cuts of around 110,000, or 1.9% of the projected public sector workforce in 2022–23. An inflation-matching 10.5% pay award, in contrast, would require headcount cuts of around 390,000, a 6.8% cut to the projected 2022–23 workforce.
If the government provided £4.8 billion of additional funding for staff costs (the red line), a 5% pay award could be met without changing headcount, but a 10.5% award would still require cuts to headcount of around 280,000, a 5.0% cut to the public sector workforce. As per Table 4.1, £17.9 billion of additional funding would have to be provided for 10.5% pay awards to be possible without requiring cuts elsewhere.
Figure 4.2. Spending increases and changes in public sector employment consistent with different pay awards in 2022−23
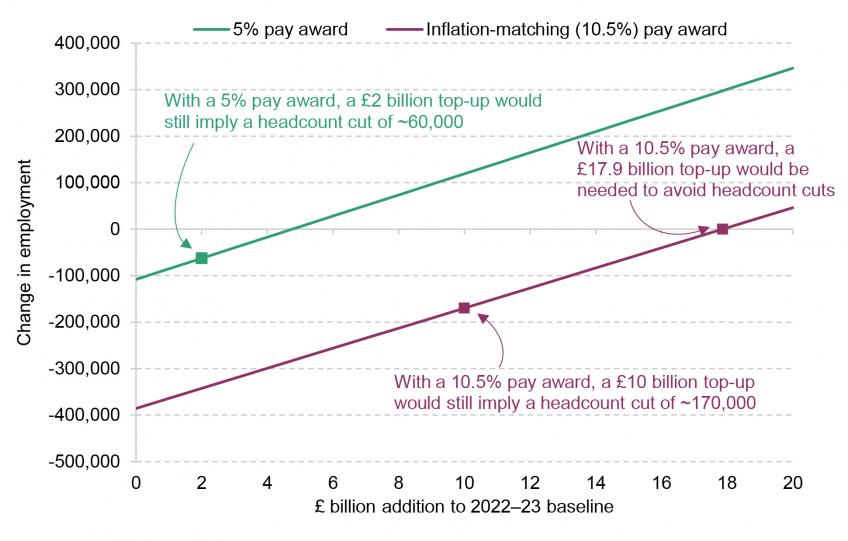
Note: The assumed rate of CPI inflation in 2022−23 (10.5%) is taken from Citi’s September 2022 CPI forecasts. All figures are illustrative and assume that budgetary savings are (can be) made only through changes in headcount.
Source: Authors’ calculations using HM Treasury PESA 2022, Citi September 2022 CPI forecasts and ONS public sector employment statistics.
Of course, other options on spending are possible: the government might wish to compensate departments for some but not all of the additional costs in 2022−23 of this year’s pay award, for instance. This is illustrated in Figure 4.2. With a 5% average pay award, shown by the green line in Figure 4.2, providing £2 billion of additional funding would partially compensate departments, but still require headcount cuts of around 60,000 (a 1.1% cut to the workforce).
With a 10.5% average pay award (the yellow line), even a £10 billion top-up would imply a cut to headcount of around 170,000, or 3.0% of the projected workforce (if savings were found entirely through this channel). Other combinations of spending increases and changes in headcount can be read from the graph.
Trade-offs beyond 2022–23
This is not a fiscal question for 2022–23 alone. Higher public sector pay awards affect not just spending this year but spending in future years as well, because future pay awards are made with respect to a higher baseline. In other words, the effects compound over time, meaning that, if anything, the challenge becomes more acute over time.
To illustrate this, and the trade-offs involved further into the future, we consider two scenarios. In the first, we assume that the government sticks with 5% pay awards this year (2022–23) and then holds pay constant in real terms (specifically, by increasing pay in line with Citi’s September 2022 forecast for CPI: 10.5% in 2022–23, 6.2% in 2023–24 and 2.0% in 2024–25). That would reflect the fact that imposing further real-terms pay cuts after this year would be fraught with risks and difficulty, but would bake in the real-terms pay cuts planned for this year.
In our second scenario, we assume that public sector workers are offered an inflation-matching pay award this year, and again in 2023–24 and 2024–25, so as to hold pay constant in real terms at 2021–22 levels. This is to illustrate how the trade-off would change if the government changed its policy and opted not to impose real-terms pay cuts on public sector workers. Figure 4.3 shows the trade-off between additional spending in 2024–25 (relative to current plans) on the one hand, and changes in headcount in 2024–25 (relative to the OBR’s latest forecasts) on the other, in both of these scenarios.
In the case where pay is increased by 5% this year and then held flat in real terms, a £10.6 billion top-up to spending plans in 2024−25 relative to current plans would be required. If pay were increased in line with inflation this year and then held flat in real terms, a £25 billion top-up would be required to avoid cuts to headcount; a £10.6 billion top-up would in that scenario still require cuts to headcount of almost 300,000 (a 5.0% cut to the projected 2024–25 workforce).
These numbers are sensitive to assumptions around inflation and, to repeat, they assume that all savings would have to come via headcount, and so provide something of an upper bound on the cuts to headcount that could be required (as some savings could presumably be found from elsewhere). But they serve to illustrate the point: in this year and over the rest of the parliament, offering higher pay awards without increases in funding would eventually mean the public sector employing fewer people.
Figure 4.3. Trade-off between spending and public sector employment in 2024–25 under illustrative paths for public sector pay
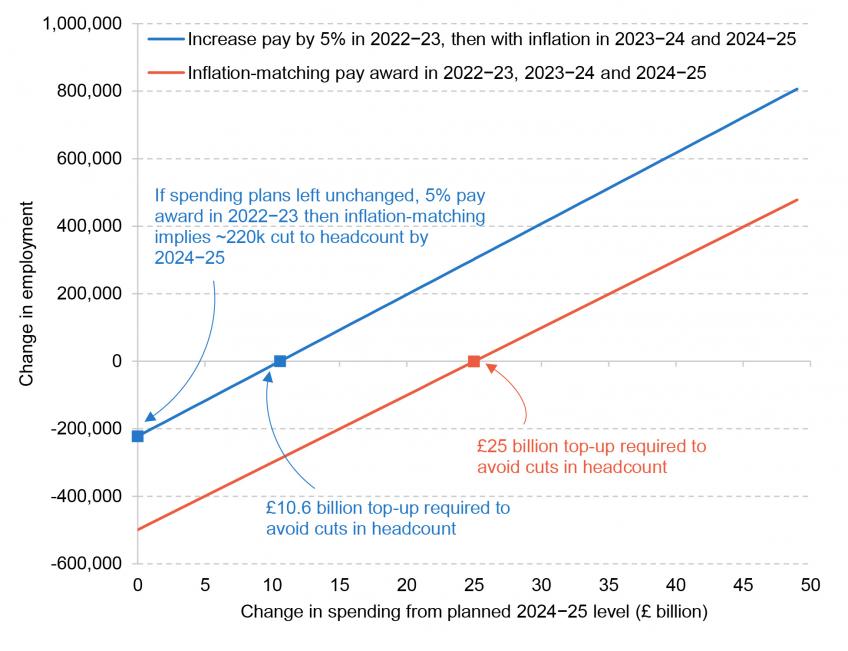
Note: The assumed path of CPI inflation between 2022–23 and 2024–25 (10.5%, 6.2%, 2.0%) is taken from Citi’s September 2022 CPI forecasts.
Source: Authors’ calculations using HM Treasury PESA 2022, Citi September 2022 CPI forecasts and ONS public sector employment statistics.
The choice for the autumn
Theoretically, departmental spending limits for the next three years are ‘firm and fixed’.13 But these plans could of course be increased to reflect updated inflation and pay assumptions, if the government so wished.
The new Chancellor must either top up existing spending plans or accept that the quality of public services will (further) deteriorate. Delivering on all of the government’s previous public service objectives (such as clearing the NHS backlog, ‘levelling up’ primary education or ‘fixing’ adult social care) already looked challenging under the spending envelope set out last autumn.14 Now, it looks virtually impossible.
Choosing to abandon those public service promises, and scaling back the government’s desired range and quality of public services, would be one possible response to the UK becoming poorer as an energy- and food-importing nation. The economic hit has to be distributed somehow. But although leaving public spending plans as they are (and thus imposing an unintended real-terms cut to public service budgets) is the default option, this would still represent a deliberate choice. That choice should be made openly and transparently, alongside choices over taxes and broader public finances, at a fiscal event.
Liz Truss has announced that she plans to hold a spending review at the end of 2022, which would seem the natural place to do this. Given the scale of the tax cuts that she has announced, which amount to almost £30 billion per year, it is far from clear that more money will be available to departments at this review (Emmerson and Stockton, 2022). It is perfectly possible that public service budgets will be reduced rather than increased.
4.4 How does pay compare in the public and private sectors?
The chapter has so far focused on the most recent round of public sector pay announcements and their fiscal implications. But to provide a more complete assessment of these announcements, and to place them in full context, it is important to compare trends in the level and structure of pay in both the public and private sectors. The outside option for public sector employees will be in part determined by what is on offer in the private sector, and so such comparisons are important for what the government ought to be ultimately concerned with: ensuring that the government can attract, motivate and retain the right number and mix of people. The following subsections aim to provide such a comparison.
Recent trends in headline earnings
Figure 4.4 shows mean annual earnings in the public and private sectors between 2007 and 2022, adjusted for inflation.15 In July 2022, average annual earnings (which reflect both hourly pay and the number of hours worked) stood at £32,102 in the private sector, 4.7% higher than in the public sector (£30,657). 16
Looking at the trend over time, the lack of growth in average real-terms earnings since the financial crisis is clear: mean public sector earnings in July 2022 were in fact 4.0% lower in real terms than in July 2007. Private sector earnings fared slightly better, but were still only 0.9% higher on average in July 2022 than in July 2007.
A significant gap opened up between average earnings in the two sectors after the financial crisis, with private sector earnings rapidly falling, while public sector earnings stayed relatively stable (as a result of three-year pay agreements made pre-recession being largely honoured). From around 2011, average real-terms earnings were falling in both sectors. After 2014, private sector earnings began to rise again, while public sector earnings remained stagnant, with pay awards capped at an average of 1% across departments between 2013 and 2017.
Figure 4.4. Real average (mean) annual earnings in the public and private sectors, 2007−22
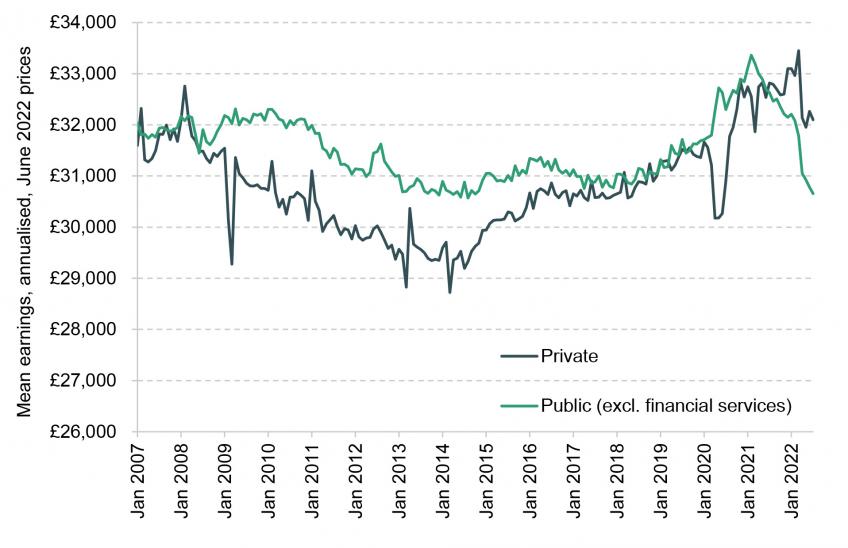
Note: Figures shown are the mean weekly earnings in each sector in each month, multiplied by 52.
Source: ONS average weekly earnings tables, deflated using CPIH (MM23).
Immediately before the COVID-19 pandemic, the raw gap between public and private sector earnings had almost closed (average earnings were 0.6% higher in the public sector in February 2020). In March 2020, following the onset of the pandemic and associated government restrictions, real-terms private sector earnings plummeted, falling 3.3% between March and April, while public sector earnings increased. As happened after the financial crisis, the effects of the economic downturn took longer to be reflected in public sector pay, and were reflected less intensely.
Average earnings in the public sector began to fall sharply in real terms from February 2021, reflecting the freezing of public sector pay in cash terms in 2021−22 for all except those earning under £24,000 and those working in the NHS. Average earnings in the private sector, meanwhile, rebounded strongly in the second half of 2020. From July 2021, average earnings in the private sector were consistently above those in the public sector.
The general lesson here is that the public sector tends to outperform the private sector during downturns (owing to its more stable pay and greater job security), whereas private sector pay typically grows more strongly in the ‘good’ (or inflationary) times. In particular, when the economy is booming or when inflation spikes – as it is currently doing – the greater degree of flexibility in the private sector manifests in stronger pay growth.
Figure 4.5. Three-month annual growth rates in nominal private and public sector pay since 2007
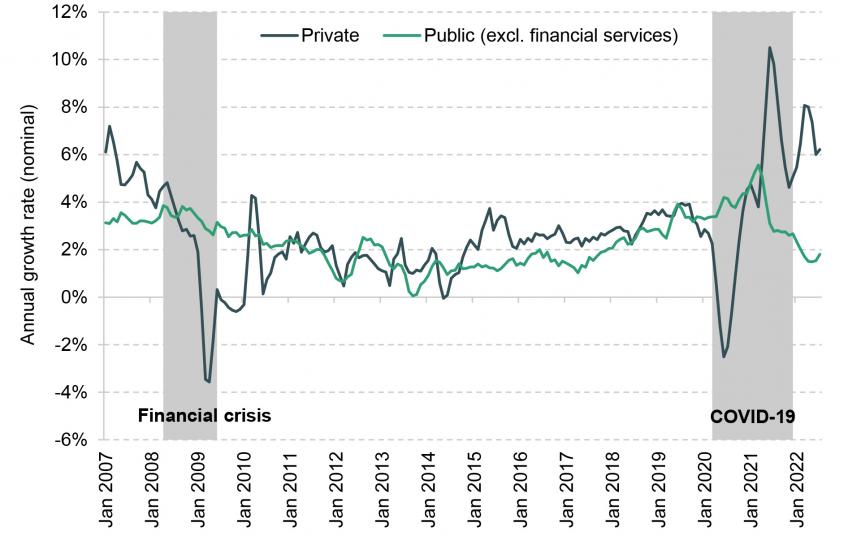
Source: Authors’ calculations using ONS average weekly earnings tables.
Box 4.1. Private sector earnings growth during the COVID-19 pandemic
The government furlough programme was taken up almost entirely by private, rather than public, sector employees. Most furloughed employees worked reduced hours, meaning that weekly earnings fell for many private sector employees. As workers came off furlough during 2021 and 2022, and returned to full-time employment, weekly wages mechanically rose, as a result of more hours being worked. This rise in weekly wages is real, but does not capture an underlying increase in hourly wages. When comparing wages in the second half of 2021, or in 2022, with wages a year earlier, they will appear to have risen substantially, since we are comparing a period during which furlough was not prevalent to one during which it was: this is referred to as a ‘base effect’, and leads to private sector earnings growth being overstated.
A ‘composition effect’ also means average private sector wage growth may be biased upwards during the pandemic. Fewer part-time – generally lower-paid – jobs were undertaken during COVID-19, and fewer jobs in elementary occupations. During that time, there were also fewer new entrants to the labour market, who tend to be lower-paid than average. This shift in the composition of the workforce means the private sector contained a larger proportion of higher-paying jobs, which also acted to increase measured average earnings.
Private sector earnings growth figures should therefore be interpreted with caution throughout the COVID-19 period.
This is evident in Figure 4.5, which shows annual growth rates in nominal earnings over time, by sector. The stronger performance of the public sector in ‘bad’ times is particularly clear. During both the financial crisis and COVID-19 recessions, private sector earnings growth immediately fell, while public sector earnings growth remained relatively stable. But there is also a general tendency for public sector earnings to grow less quickly in ‘good’ times (if any of the period since 2007 can be described as such). Private sector earnings bounced back after both crises, while growth in public sector earnings tended not to keep pace. The pronounced uptick in private sector earnings growth in recent months can also be seen.
Much of the growth in private sector earnings in 2021 and 2022 was underpinned by strong bonus payments. Bonuses were 8.4% of mean private sector total compensation between August 2021 and July 2022 (up from 7.5% in the same period the year before), while they were 0.4% of mean public sector compensation in this period.
Bonuses are an important way in which private sector employers adjust flexibly to macroeconomic conditions. Banks such as Lloyds Bank and Virgin Money are offering ‘cost of living payments’, with Virgin Money offering their staff earning less than £50,000 a £1,000 payment.17 Bonuses in other sectors, such as construction, manufacturing and retail, have also been growing strongly – often at an annual rate in excess of 20% – in recent months, indicating that strong growth in bonuses is not limited to sectors such as financial services and has instead become more widespread (Office for National Statistics, 2022). Around a quarter of businesses surveyed by the Bank of England in July 2022 reported that they had given, or were considering giving, one-off payments as a response to retention challenges or the cost of living crisis (Bank of England, 2022). While bonuses are also a tool available to the public sector, they are used much more rarely. This has contributed to the divergence in growth rates between the two sectors over the course of 2022.
The distribution of earnings
The comparisons so far have used data on average (mean) annual earnings in each sector, which do not capture all differences in public and private remuneration. For one, focusing on weekly or annual earnings captures differences in both hourly pay and the number of hours worked. This is important, given that part-time work is more prevalent in the public sector.18 In addition, looking only at the average provides no insight into the overall distribution or what is happening at the top and bottom ends of the earnings scale. Figure 4.6 illustrates the public–private differential in hourly wages at deciles of each sector’s wage distribution, allowing us to control for differences in the number of hours worked and to look in more detail at the overall distribution of wages in the public and private sectors.
The ratio between public and private sector earnings is not constant over the wage distribution. From the 10th to the 80th percentiles of the wage distribution in each sector, public sector pay is higher than that in the private sector. For example, someone at the 10th percentile of the wage distribution in the public sector earns around 14% more than someone at the 10th percentile of the private sector wage distribution; at the median wage (50th percentile) in each sector, the public sector employee earns around 29% more, with gross hourly pay in the public sector being £16.81 (equivalent to £35,061 annually for a full-time worker), versus £13.01 in the private sector (equivalent to £27,135 annually). In contrast, at the 90th percentile, the ratio falls below 1: those at the top of the private sector earnings distribution earn more than those at the top of the public sector earnings distribution. Gross hourly pay at the 90th percentile of the public sector pay distribution is £29.16 (equivalent to £60,819 annually), compared with £29.88 at the 90th percentile of the private sector pay distribution (equivalent to £62,321 annually). (Data are not available on the very top end – such as the 99th percentile – but this pattern would likely be even more pronounced there.)
Figure 4.6. Distribution of hourly wages, by sector
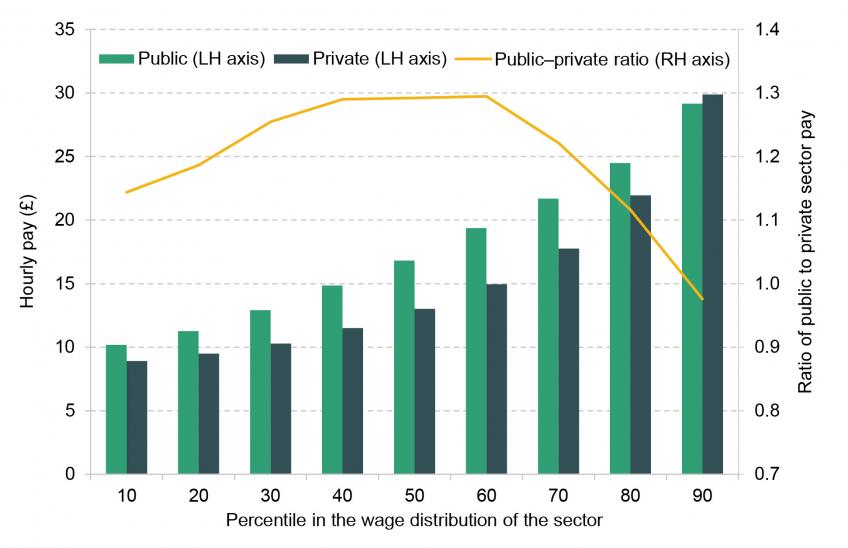
Source: Table 13.5a of Annual Survey of Hours and Earnings 2021.
Figure 4.6, in summary, shows that the public sector wage distribution is relatively compressed. There are relatively few very low-paying and very high-paying jobs in the public sector, compared with the private sector.
The distributions of hourly wages for men and women separately follow a similar pattern, with the sex-specific public sector wage distribution relatively compressed in both cases. The ratio between public and private sector wages for women is lower than that for men at the lower points of the wage distributions, as illustrated in Figure 4A.1 in the appendix: the extent to which lower-paid women do better in the public sector is less than the extent to which lower-paid men do better in the public sector. From the 40th percentile upwards, this situation reverses, and the ratio between public and private sector wages is higher for women than for men.
This exercise still does not provide a complete picture, however. There are important differences between the workforces of the public and private sectors: public sector workers are, on average, more highly educated and older, and are more likely to work part-time. Making direct comparisons between average pay in the private and public sectors thus does not give a full picture of the differences in pay in the two sectors for similar workers.
To address this, in what follows, we continue to focus on hourly pay, and control for a range of characteristics: sex, age, experience, education and region. We use the quarterly Labour Force Survey (LFS), which enables us to show differences in pay between the two sectors after accounting for a rich set of individual characteristics.
The public–private pay differential
Figure 4.7 illustrates the public sector hourly pay differential from 1993−94 to 2021−22, calculated using the LFS. It does not include an estimate of the value of employers’ contributions to workplace pensions in the two sectors, which will be discussed later in the chapter.
Public sector pay has been falling relative to private sector pay from around 2011. The raw average public–private pay differential, which does not control for the variation in observed workers’ characteristics in the two sectors, remains positive, but has fallen by 12 percentage points, from 19% in 2011−12 to 7% in 2021−22.
Figure 4.7. Average public–private hourly pay differentials, 1993−94 to 2021−22
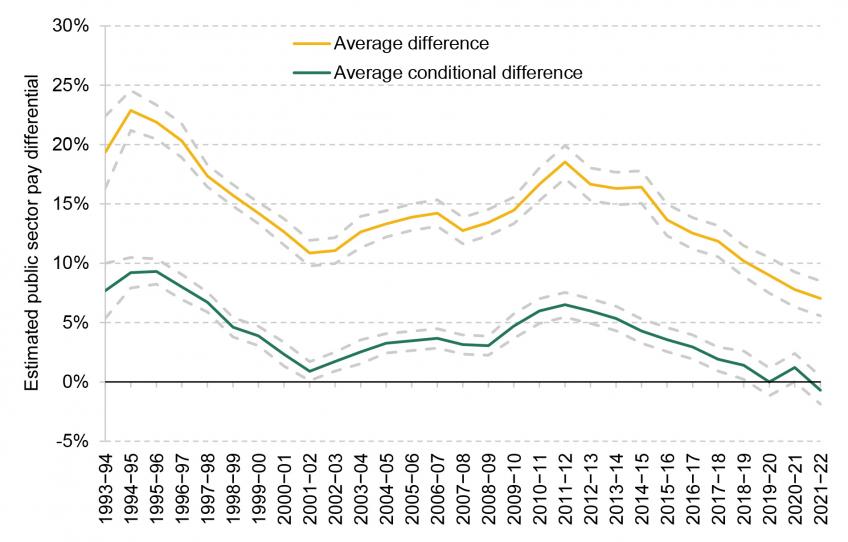
Note: The average conditional difference is calculated using age, education, experience and region controls, all interacted with sex, and interactions between education and experience. Figures shown are the coefficient on an indicator variable for whether the individual works in the public sector, transformed into a percentage differential based on Halvorsen and Palmquist (1980). Figures are for hourly pay and exclude pension contributions. The dashed lines represent 95% confidence intervals.
Source: Authors’ calculations using the quarterly Labour Force Survey.
When controlling for workers’ characteristics – age, experience, qualifications, region and sex – the difference is much smaller, reflecting the dissimilar composition of workers in the two sectors, with public sector workers tending to be more highly educated and more experienced. The conditional differential was negative in 2021−22, falling to –0.7% (its lowest level since at least the early 1990s). The key takeaway is that the public–private differential has fallen steadily over the past decade, and is now less favourable to the public sector than at any point in the past 30 years.
4.5 Variation in the public–private pay differential
How does the public–private pay differential vary across the wage distribution?
As Figure 4.6 (in which percentiles of the wage distribution in the two sectors were shown) illustrated, there are significant differences in the raw pay differential across the wage distributions in the public and private sectors. Looking at average (mean) differences alone will therefore fail to capture the full range of differences in public and private pay. In particular, the greater degree of compression in the public sector wage distribution will not be accounted for.
Figure 4.6 did not account for the different characteristics of the private and public workforces, meaning its estimate of the differences between public and private sector wages at each percentile of the wage distributions will fail to adjust for the fact that public sector workers at each point will tend to be older, more educated, and so on. For example, in 2021−22, 18% of private sector employees at the 20th percentile of the private sector wage distribution had a degree compared with 34% of public sector workers at the 20th percentile of the public sector wage distribution, according to the LFS.
Here, we use a technique called quantile regression to allow us to compare percentiles of the two wage distributions while accounting for workers’ characteristics such as age and education. In effect, this compares the pay of an individual in the xth percentile of the public sector pay distribution with that of someone in the xth percentile of the private sector pay distribution, after adjusting for the fact that those workers may look different in terms of their age, experience, education and so on. A positive number indicates that someone at that point of the pay distribution in the public sector earns more than someone at the same point of the private sector distribution, but not because of differences in their observed characteristics.
Figure 4.8. Estimated public–private hourly pay differential by percentile in the conditional wage distribution, 2021−22
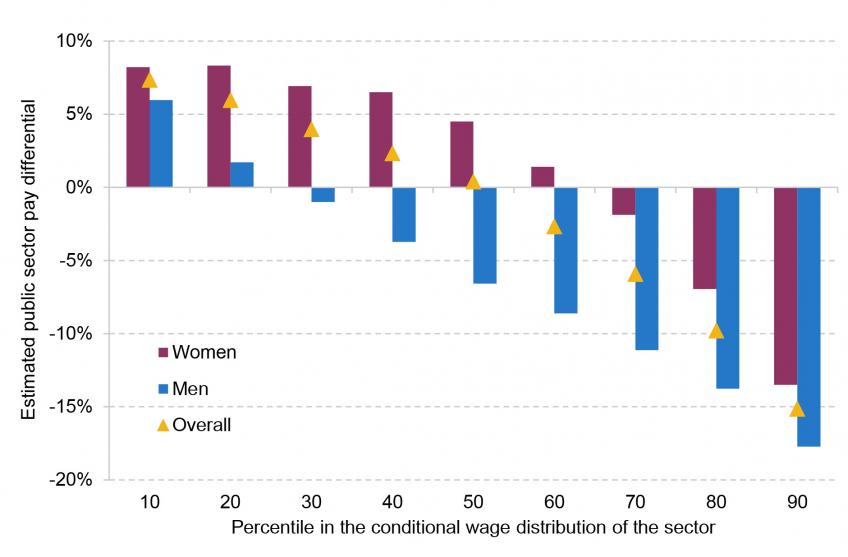
Note: Results are from quantile regressions, controlling for age, education, experience, and region, and interactions between education and experience. All controls are interacted with sex for the ‘Overall’ results. The height of a bar at the xth percentile represents the gap between the xth percentile of the (conditional) public sector wage distribution and the xth percentile of the (conditional) private sector wage distribution.
Source: Authors’ calculations using the quarterly Labour Force Survey, 2021Q2 to 2022Q1.
Figure 4.8 shows the results of this exercise. The pay compression previously observed, where those at the higher end of the wage distribution in the public sector earn less, and those at the lower end earn more, holds when background characteristics are accounted for.19
The overall differential is negative in the top half of the conditional wage distributions: given individuals’ observed characteristics, public sector workers above the public sector median are paid less than private sector workers above the private sector median. For men, this is the case for the top 70% of earners, while for women it is only the case for the top 30%, reflecting the fact that public sector women tend to be more highly paid per hour than women in the private sector. The differential is positive for men in the lowest 20% of the conditional wage distributions, with lower-earning public sector men paid more than lower-earning private sector men; for women, the differential remains positive until the 60th percentile.
How does the public–private pay differential vary between men and women?
Women make up a higher proportion of the public sector than the private sector: in 2021–22, 64% of public sector workers were female, compared with 44% of private sector employees, according to the LFS.
We estimate that the public–private pay differential in 2021–22 stood at +2.2% for women and at −4.6% for men. Looking further back, the differential has been consistently higher for women than for men. Figure 4.9 shows that the pay differential for male public sector employees has hovered at around zero for much of the last decade, whereas women working in the public sector have enjoyed a positive pay differential during that period (albeit a smaller one than in the past).
Figure 4.9. Estimated public–private conditional hourly pay differential over time, by sex
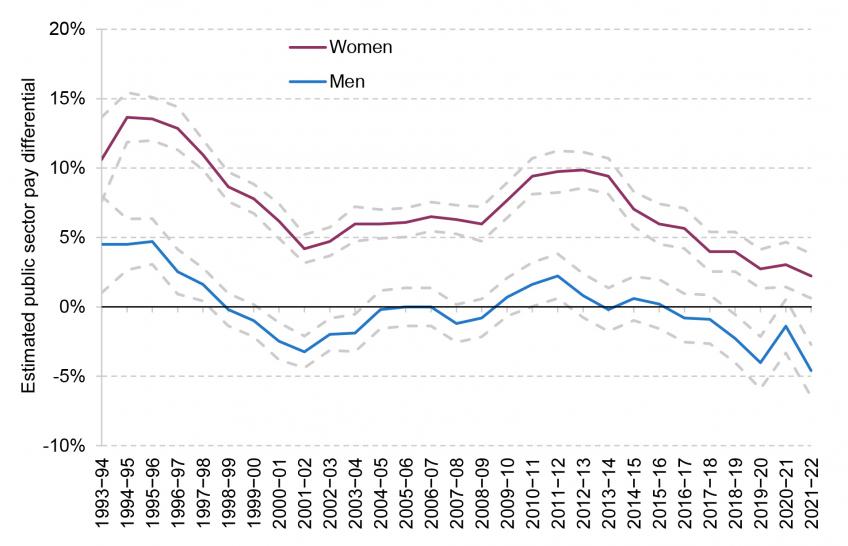
Note: The average conditional difference is calculated using age, education, experience and region controls, with interactions between education and experience. Figures shown are the coefficient on an indicator variable for whether the individual works in the public sector, transformed into a percentage differential based on Halvorsen and Palmquist (1980). Figures are for hourly pay and exclude pension contributions. The dashed lines represent 95% confidence intervals.
Source: Authors’ calculations using the quarterly Labour Force Survey.
This is largely driven by the gender composition of various occupations. More women work in lower-paying public sector occupations where the public pay differential is higher: women represent more than 90% of teaching assistants, and more than 80% of social workers and care workers. Men are more likely to work in more highly paid occupations such as NHS consultants or judges, where the pay differential is lower (Office for National Statistics, 2019).
How does the public–private pay differential vary by region?
Figure 4.10 illustrates the average public sector pay differential by region, comparing two periods (2005–07 and 2019–21)20. The differentials are conditional on workers’ characteristics, as previously described.
Figure 4.10. Public sector pay differential conditional on workers’ characteristics, by UK region and nation
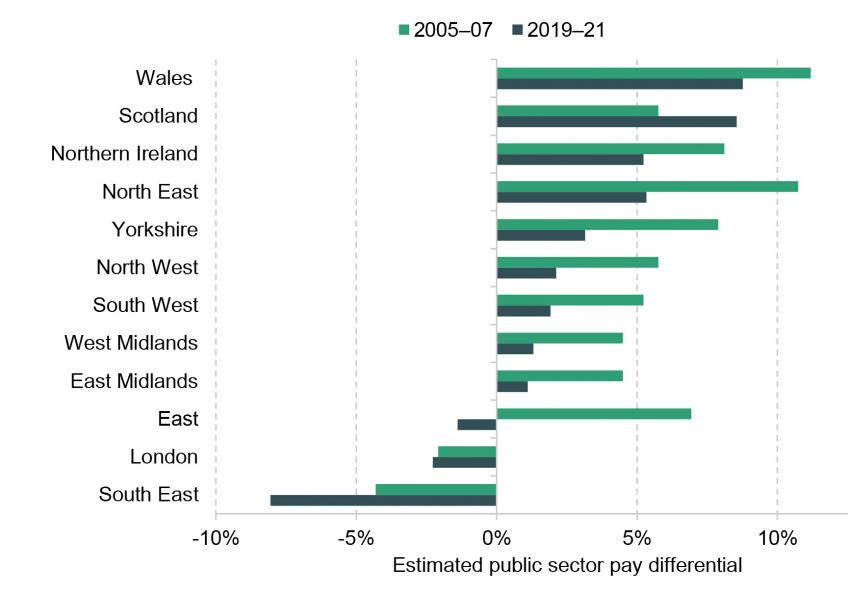
Note: The differential is calculated controlling for age, education, experience and region controls, all interacted with sex, and interactions between education and experience. Figures are for hourly pay and exclude pension contributions.
Source: Authors’ calculations using the Labour Force Survey.
As shown, there is considerable variance in the public pay differential across the UK. This is largely driven by private sector pay variation: public sector pay is set on a national level, for the most part, with limited flexibility on a local level. Public sector pay relative to private sector pay was lowest in the South-East, in London and in the East of England over the period 2019−21: in all three regions, the differential was negative (–8.1%, –2.3% and –1.4%, respectively). In contrast, in Wales, Scotland, Northern Ireland and the North East, public sector pay was considerably higher than private sector pay (with public sector premiums of 8.8%, 8.5%, 5.2% and 5.3%, respectively).
Figure 4.10 also shows the way in which the differential has changed between 2005−07 and 2019−21: in all regions apart from Scotland, the conditional public pay premium has fallen over this period. The fact that relative public sector pay has risen in this period in Scotland could be a result of more generous public sector pay settlements allowed by additional per-person funding the Scottish Government receives via the Barnett formula: the rise in Scotland has been driven by especially strong public sector pay growth.21 In the East of England, the differential has turned from positive to negative: the expansion of the tech and pharmaceutical sectors around Cambridge, and consequent booming of the private sector in this area, could be one factor behind this change. The fall in the differential, however, has predominantly been driven by relatively weak public sector pay growth in the East.
This regional variation in the public–private pay differential also varies by occupation: in Figure 4.11, we show how average hourly earnings in two large occupations – nursing and secondary school teaching – compare with average earnings by region. On average, nurses in the North East earn 17% more than the average employee in the region, versus just 5% more in the East of England and 9% less in London. On average, secondary school teachers in the North East or Wales earn over 50% more than the average employee in their region; a secondary school teacher in the South East earns 22% more than the average. Similar patterns can be seen when a broader set of occupations are considered. There is clearly substantial variation across the country in the level of public sector pay relative to what is on offer in the private sector.
Finally, there is considerable variation in the relative pay of different public sector professions across the country. In Wales, the average secondary school teacher earns 37% more than the average nurse, while secondary school teachers in the South East earn, on average, only 16% more than nurses in the South East. While teachers and nurses both earn least – relative to the local labour market – in London, and most in the North East, the ordering of relative regional earnings by occupation between these two extremes differs. This variation (whether it arises from differences in the characteristics of the public sector workforce by region, or differences in similar workers’ pay by region) may not be deliberate or optimal.
Figure 4.11. Average (mean) hourly earnings of workers in selected full-time public sector occupations relative to local average earnings, by region
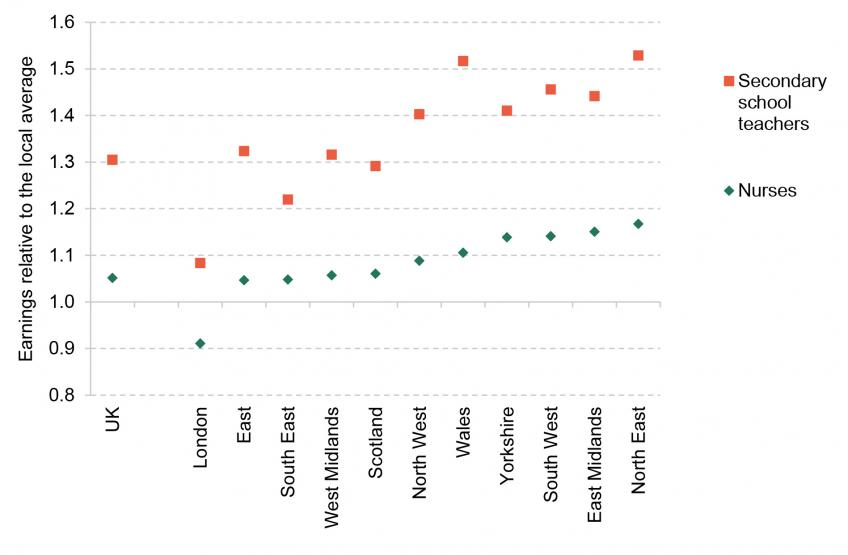
Note: Full-time workers only. The height of each data point represents the mean wage of each occupation divided by the average full-time wage in the same region.
Source: Table 15.5a of Annual Survey of Hours and Earnings 2021.
Regional public sector pay deals: a very brief discussion
During the Conservative leadership campaign, Liz Truss proposed the introduction of regional public sector pay boards, claiming that this would eventually save up to £8.8 billion per year (by paying less to public sector employees in areas with lower cost of living), before subsequently dropping the policy.22 A full appraisal and discussion of this proposal is beyond the scope of this chapter, but there are a number of points worth making.
In principle, a targeted approach to public sector pay is a sensible one – including targeting by geographic region. We already have, for instance, a system of ‘London weighting’ whereby public sector employees in the capital receive higher pay to reflect the higher cost of living. There are potential efficiency gains from more refined targeting. But this does not mean that the optimal policy would be to have all regional public–private differentials equal to zero, and there are several key caveats.
First, public sector pay policy should be set with regard to the public services that the government wishes to deliver, with a focus on recruitment and retention. In other words, if the government wishes to introduce a greater amount of regional targeting in pay-setting, it would be sensible to target the regions and places that struggle most to recruit and retain skilled workers. It is far from obvious that the places struggling most to recruit new teachers, for instance, are those with the lowest public–private pay differentials. Relatively deprived rural areas or coastal towns might struggle to attract the requisite number of dentists, despite dentists in those places enjoying high pay relative to the local private sector. Pay is not the only thing that matters.
Second, one of the key attractions for a government seeking to cut taxes without increasing borrowing and/or seeking to reduce the size of the state might be the possibility of budget savings. But introducing more regional pay variation (or, indeed, variation along any other dimension) is much easier to achieve when pay is rising across the board, because pay can just be increased faster in some places than others. Doing it by cutting pay in some places and increasing it in others is considerably more politically difficult.
Finally, a greater degree of regional pay variation or local pay determination might be theoretically attractive but would face considerable challenges in its practical implementation.
Summary so far
Average annual earnings are now higher in the private sector than in the public sector, but average hourly pay in the public sector – where part-time work is more prevalent – is higher. Public sector employees also tend to be more educated and to have more experience in the labour market. The conditional public–private pay differential, which controls for these differences, has fallen steadily from around 3% in 2007−08 and around 7% in 2011−12 to slightly below zero in 2021−22. This differential is now less favourable to the public sector than at any point in the past 30 years. This is true for both men and women, though the estimated differential remains substantially higher for women than for men. The pay differential is also higher for lower-paid public sector workers, and for those living outside of London, the South East and East of England.
4.6 How do pensions in the public and private sectors compare?
Why pensions matter
Up to this point, all of our analysis has focused on differences in pay between employees in the public and the private sector. However, pay is not the only form of remuneration that employees receive. In particular, another important (but deferred) form of remuneration is contributions made by employers to pension schemes.23 Past research has demonstrated that the average value of employer-provided pensions differs substantially between the public and the private sector (Cribb and Emmerson, 2016), and reforms have likely changed this difference over recent years. In this section, we use data from the Annual Survey of Hours and Earnings (ASHE) to examine how accounting for employer pension contributions changes our estimate of the public–private pay differential.
Figure 4.12 plots the share of employees in the public and private sectors who are saving into a workplace pension over time, and provides a first indication of why accounting for employer pension contributions might be important for estimating both the level and the trend of the public pay differential. In every year between 1997 and 2021, public sector employees were much more likely than private sector employees to be enrolled in a workplace pension. Since 2012, the gap in participation has narrowed due to the introduction of automatic enrolment. Whereas in April 2012 only 32% of private sector employees were enrolled in a workplace pension, compared with 83% of public sector employees, by April 2021 pension participation rates were 75% in the private sector and 91% in the public sector.
Figure 4.12. Workplace pension participation in the public and private sectors, 1997 to 2021
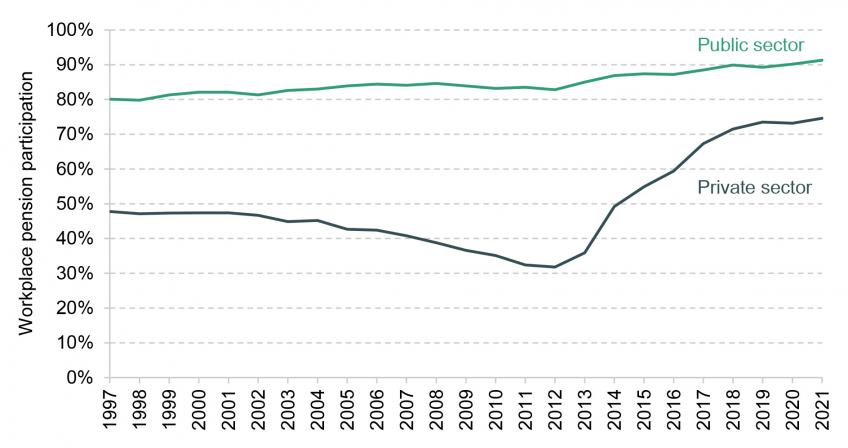
Note: Data measured in April of each year.
Source: ONS ASHE pension table P2.1.
Differences in pension participation rates are only part of the story: the type of workplace pensions that employees tend to be enrolled in also differs between the sectors. Public sector employees are much more likely to be in (typically much more generous) defined benefit schemes, but these schemes are far less common in the private sector. Table 4.2 shows that more than 80% of public sector employees were enrolled in defined benefit schemes in 2021, compared with just 7% of private sector employees.24 Notably, while the share of private sector employees with a defined benefit pension has fallen slightly since 2012 (from 8% to 7%, compared with 38% in 1997), the proportion in the public sector has actually increased (from 76% to 82%, and compared with 77% in 1997).25
Table 4.2. Pension participation by type and contribution band for private and public sector employees, 2012 and 2021
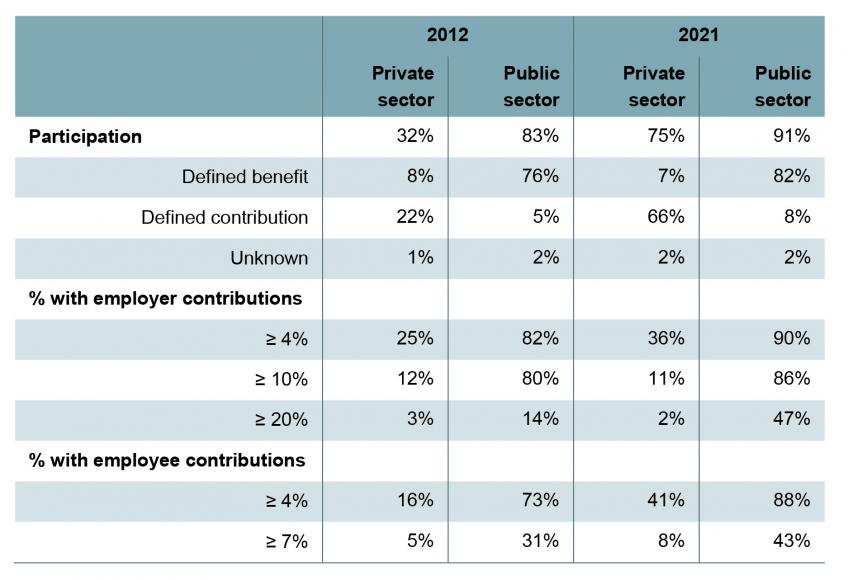
Note: Employer contribution rates as a percentage of pensionable pay, defined as the amount of pay upon which pension contributions are based. Data measured in April of each year. Employers typically use one of three different definitions of pensionable pay: basic pay (basic salary before bonuses, overtime or other additional pay), total pay (pay including bonuses, overtime and other additional pay) or qualifying earnings (total pay between the lower and upper earnings limits for National Insurance, which in 2022–23 are £6,396 and £50,270, respectively).
Source: Authors’ calculations using ONS ASHE pension tables P2.1 and P10.1.
The type of pension scheme employees are enrolled in is heavily linked with the generosity of the pension promises they receive, with defined benefit pensions typically being more generous than defined contribution schemes. Indeed, this is one of the reasons why the private sector has moved away from them. There are different ways to value the generosity of employers’ pension promises, as discussed below, one being the value of employer pension contributions reported in ASHE. Table 4.2 shows there are large differences in the share of employees who are receiving valuable employer pension contributions between the two sectors: in 2021, 86% of public sector employees received an employer pension contribution of at least 10% of pay (with the majority of the remainder being those public sector workers who have opted out of the pension scheme), compared with just 11% of private sector employees. In addition, nearly half of public sector employees received an employer pension contribution of at least 20% of pay, but this was the case for only 2% of employees in the private sector. There is also a gap in the share of employees making large employee contributions between the two sectors – while this does not directly enter total remuneration, we return to the implications of this in Section 4.8.
These differences in the proportion of workers in each sector who receive valuable employer pension contributions have actually grown since 2012 despite reforms that might have been expected to narrow the gap. First, automatic enrolment into workplace pensions was rolled out between 2012 and 2018, which hugely boosted workplace pension participation among private sector employees (Cribb and Emmerson, 2021). However, while some private sector employers do offer higher contribution rates than the legal minimum (currently set at 3% of qualifying earnings), very few employees in the private sector receive an employer contribution of anything close to 20% of pay. Second, there were reforms aimed at reducing the value of public sector pensions between 2011 and 2015. In particular, there was a reduction in the indexation of benefits (from RPI to CPI) and an increase in the age at which many public sector workers can receive an unreduced pension (known as the normal pension age) to be aligned with their state pension age for future accrual.
Figure 4.13 shows that in spite of these reforms, the gap between average employer pension contributions (as reported in ASHE) in the public and private sectors has been growing. The average employer contribution rate in the private sector did grow between 2012 and 2021, from just under 4% of pay in 2012 to almost 6% of pay in 2021. However, the average employer contribution rate in the public sector grew by more, from around 13% of pay in 2012 to 18% of pay in 2021 (principally due to reductions in the discount rate used by HM Treasury for estimating the future value of pension payments, as discussed below). Note that in Figure 4.13 and henceforth we impute pension contributions in 2021 for both sectors, because ASHE microdata with pension saving information for that year have not been released to researchers at the time of this publication.26
Figure 4.13. Average employer pension contribution rate (% of gross pay) across all employees, by sector and year
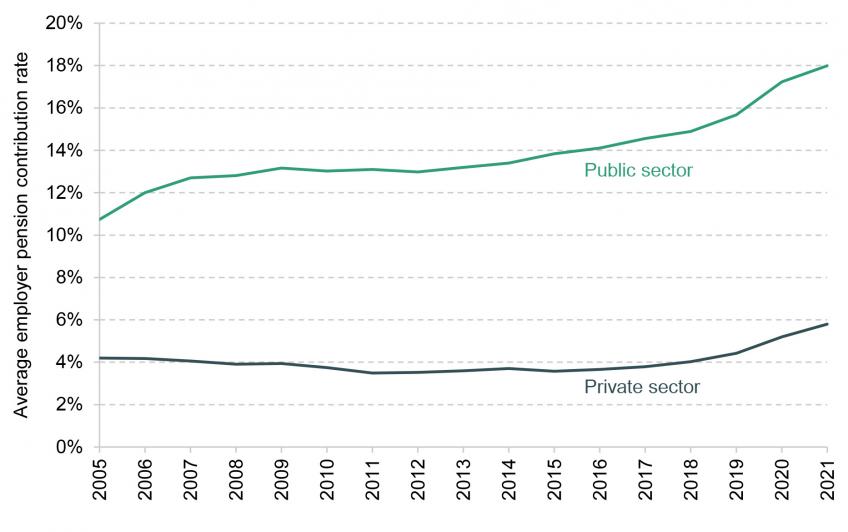
Note: Employer pension contribution rate is calculated as weekly employer pension contributions divided by weekly gross pay. Pension contributions for 2021 have been imputed based on the method outlined in footnote 26. Data measured in April of each year.
Source: Authors’ calculations using Annual Survey of Hours and Earnings.
Estimating the value of employer pension contributions
Throughout this section and the analysis that follows, we measure the generosity of employers’ pension promises using reported employer pension contributions in ASHE. Specifically, employers are asked how much they contribute to the employee’s pension, excluding any lump-sum contributions that cover more than one employee, and excluding any employee contributions made through salary sacrifice. We then divide this figure by the employee’s gross pay in the same period to calculate the employer pension contribution rate.
However, the value of employer contributions (as reported in ASHE) is not the only way to estimate the value of employers’ pension promises. Cribb and Emmerson (2016), for example, instead estimate the value of employer-provided pensions as the change in the (discounted) value of future pension income from one year to the next, estimated under simplifying assumptions about the rules of the scheme and the appropriate discount rate. This tends to lead to larger estimates of the value of public sector defined benefit pensions than suggested by looking at employers’ reported pension contributions.
This difference is principally a result of the discount rate – that is, the rate at which future income is discounted relative to income received today. All else being equal, using a higher discount rate will lead to a smaller estimated employer pension contribution, and vice versa. Total contributions in public sector schemes are intended to cover the cost of future payments to pensioners in retirement; however, the discount rate used by HM Treasury when calculating the employer contributions needed to cover these costs is higher than the discount rate used in many other places. Currently, the discount rate used by HM Treasury to estimate the future value of pension payments for unfunded schemes (the SCAPE rate), is CPI+2.4%: that is, a nominal discount rate of 4.4%, assuming that on average the 2% CPI inflation target is met.27 This discount rate was reduced in 2016 and in the 2018 Budget, which led to increases in reported employer contributions in recent years in unfunded public sector pensions (one contributing factor to the increase in average employer contributions in the public sector in Figure 4.13).
There are arguments for using a lower discount rate than the SCAPE rate, and indeed the public sector schemes themselves use lower discount rates for calculating their liabilities. For example, in the NHS Pension Scheme Accounts, the Actuary used a nominal discount rate of 1.25% in 2021 (the yield on high-quality corporate bonds at the time).28 Using this much lower discount rate of 1.25%, rather than the SCAPE rate of approximately 4.4%, leads to an average current service cost of 62.2% of pay for the NHS Pension Scheme, which is more than double the sum of the average employer contribution rate (20.6%) and the average employee contribution rate (9.8%). This lower discount rate therefore implies the total contribution from the employer and the Treasury is over 50% of pay, rather than the 20.6% contribution rate that the employer (the NHS) pays, and which would be reported in ASHE.
The key question when estimating the value of employer pension promises in defined benefit schemes is what the appropriate discount rate is – whether it should be the SCAPE rate (which approximates the long-run nominal GDP growth rate expected by the OBR), or a much lower rate, such as typical discount rates used by the public sector schemes themselves or by schemes in the private sector. Indeed, it also matters whether the appropriate discount rate should vary by sector – for example, due to differences in how the schemes are ultimately funded. Given that unfunded public sector schemes pay pensions out of future tax revenue, the expected long-run rate of nominal GDP growth may be a sensible discount rate, as this will approximate the growth in the tax base. On the other hand, for funded schemes, a risk-free bond rate, such as the long-run gilt rate, may be a more sensible discount rate. Such a rate may also be more sensible when estimating the ‘value’ to employees. Calculating the value of pension promises using a different discount rate, as in Cribb and Emmerson (2016), is beyond the scope of this chapter, but this is an important caveat to keep in mind when interpreting our results.
4.7 How does total remuneration compare in the public and private sectors?
Figure 4.14 shows our estimate of the public–private pay differential in 2021. When looking at pay without bonuses or employer pension contributions, public sector employees earn around 13% more per hour than private sector employees on average. Of course, as discussed above, the composition of workers can differ between the two sectors, which could be one reason for the difference in pay. To account for this, we then control for factors such as age, sex and region (see footnote b in Box 4.2 for a full list) in our analysis, which reduces the estimated public pay differential to 0% (the leftmost yellow bar in Figure 4.14).
Including bonuses in pay reduces the unadjusted differential and the differential after accounting for observed characteristics to 8% and −3%, respectively (as shown by the middle set of bars in Figure 4.14). These figures are broadly comparable to the corresponding differentials for 2021−22 estimated using the LFS in Figure 4.7 (7% and −1%).29
Finally, adding the measure of employer pension contributions reported in ASHE onto pay significantly increases the differentials to 21% (unadjusted) and 6% (after taking account of observed background characteristics), as shown by the rightmost set of bars in Figure 4.14. This highlights the greater generosity of pension schemes in the public sector. It means that, after accounting for bonuses and employer pension contributions, and after accounting for differences in employee characteristics (to the extent that is possible in ASHE), there is an average public sector remuneration differential of around 6%.
It is important to note that including bonuses in our measure of remuneration reduces the estimated public pay differential, while including employer pension contributions significantly increases it. This highlights a key difference in the structure of remuneration between the two sectors, with bonuses on average forming a significant part of remuneration in the private sector, but employer contributions being more important in the public sector. We return to this in Section 4.8.
Figure 4.14. Average public–private hourly pay and remuneration differentials in 2021
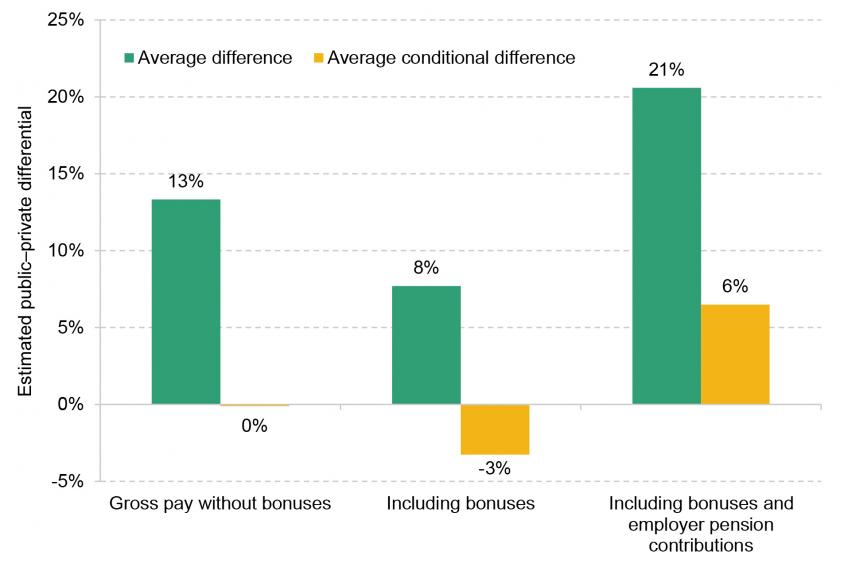
Note: The differentials are calculated using a regression of hourly pay or remuneration on a public sector dummy. The controls mentioned in footnote b of Box 4.2 are included when calculating the average conditional difference. We then transform the coefficient into a percentage differential based on Halvorsen and Palmquist (1980). Pension contributions have been imputed based on the method outlined in footnote 26.
Source: Authors’ calculations using the Annual Survey of Hours and Earnings.
Box 4.2. Data used for total remuneration calculations
Ultimately, we are interested in comparing total remuneration between the public and private sectors: accounting for pay, bonuses and pensions (a). To examine this, we cannot use the Labour Force Survey, as in Sections 4.4 and 4.5, because the LFS does not contain any information on employer pension contributions. Instead, we use the Annual Survey of Hours and Earnings, which is a survey completed by employers each April with data on around 1% of employees in Great Britain. While ASHE contains comprehensive data on workplace pension contributions, it does not contain information on all of the individual characteristics we used for our analysis using the LFS (such as education and experience). For this reason, we use a different set of controls in this section to adjust for differences in the composition of workers between the two sectors, following Office for National Statistics (2020) (b). In addition, while ASHE does include incentive pay in its measure of gross pay, bonuses paid in April may not be representative of bonuses throughout the year. Therefore, to make bonus data more comparable with data on average weekly earnings (AWE) and from the LFS used above, we instead impute bonuses using AWE at the broad industry level (c).
(a) This will not capture the entirety of remuneration (it would not capture provision of a company car, for example, or other forms of benefits-in-kind) but data limitations preclude us from a complete analysis.
(b) In particular, we control for sex, age, age-squared, a part-time dummy, job tenure, occupational classification, organisational size, a benefits-in-kind dummy, a temporary contract dummy and region, and we include interactions between sex and age, sex and age-squared, occupation and age, occupation and age-squared, occupation and organisational size, and occupation and region.
(c) Specifically, for the 24 industries in the publicly available AWE industry-level data (ONS table EARN03), we calculate the share of pay that is from bonuses during the period 2012–21. Then, for each observation in ASHE, we subtract ASHE incentive pay from gross pay, and then multiply this number by the industry-level bonus factor calculated using AWE to obtain an estimate of the average bonus over the full year.
How has this total remuneration gap changed over time?
Figure 4.15 shows how the estimated public pay differentials (after taking account of observed differences in the characteristics of the two workforces) have changed over time. All of the estimated public pay differentials have fallen since 2013, although there was a slight, temporary, jump up in 2019. When including bonuses but not employer pension contributions in pay, the estimated differential falls from 8% in 2013 to −3% in 2021 (compared with a fall from 5% to −1% in the LFS).
Box 4.3. Comparison with previous ONS estimates
Figure 4.15 also shows our estimates for the public–private differential in 2019, the final year covered by previous ONS analysis of the public–private remuneration differential (Office for National Statistics, 2020). The ONS’s modelled average public sector earnings differential (after controls) was significantly lower, at 7% in 2019 (versus 14% in our analysis – which is also substantially higher than our estimate for 2021). There are several potential reasons for this discrepancy. First, the ONS analysis takes a different approach to the estimation of bonuses (a). Second, there are some differences in methodology between the analyses. For example, as far as we are aware, the ONS reports the differential as the estimated coefficient on the public sector dummy variable in its regression (b). However, as Halvorsen and Palmquist (1980) point out, this will understate the percentage effect of working in the public sector on pay; applying the appropriate transformation to the ONS estimate would reduce the discrepancy between its figures and ours (c).
(a) To be precise, the ONS uses the AWE microdata to calculate the share of pay from bonuses for each year, sector and two-digit industry (of which there are 88), and then adjusts pay in ASHE using this factor. Our factor is calculated for each year and broad industry (of which there are 24), and does not vary by sector.
(b) The ONS report states: ‘the coefficient to [the public sector dummy] indicates the average earnings difference for working in the public sector’.
(c) The ONS kindly provided its code to us for replication purposes. Unfortunately, we were unable to replicate its analysis. This could be due to differences in the raw ASHE data sets used. We also found a possible coding error when (re)constructing the remuneration variables, but were unable to confirm this without access to the underlying data set used by the ONS team in 2019.
The differential in total remuneration including employer pension contributions has also fallen, but by slightly less, from 15% in 2013 to 6% in 2021. The widening gap in average employer pension contributions between the two sectors (with the public sector becoming increasingly more generous relative to the private sector) has therefore somewhat dampened the reduction in the pay differential since 2013 (with the public sector becoming steadily less generous relative to the private sector). But overall, the increase in the relative generosity of public sector pensions was enough only to partially offset the reduction in the relative generosity of public sector pay. The gap in overall public–private remuneration therefore narrowed. Importantly, regardless of the measure of remuneration used, Figure 4.15 shows that the estimated differential is at its lowest level over the period since 2005.
Figure 4.15. Average conditional public–private hourly pay and remuneration differentials, 2005–21
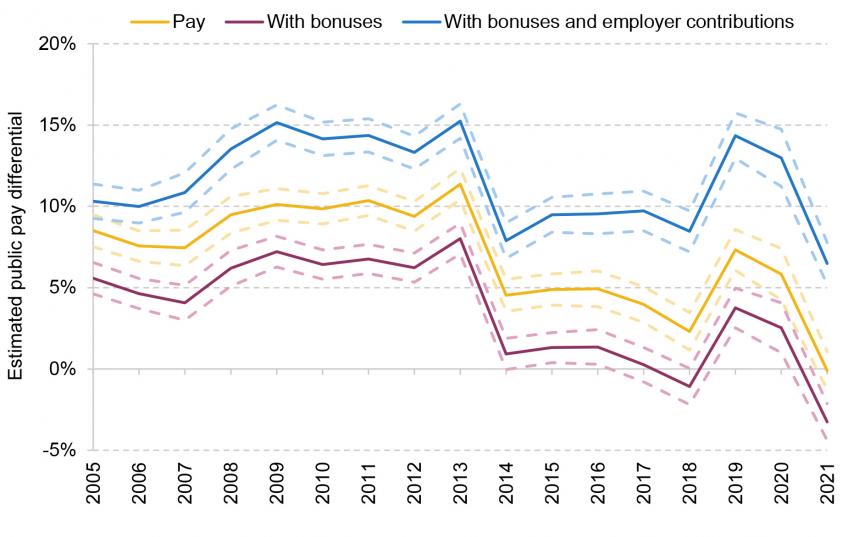
Note: The differentials are calculated using a regression of hourly pay or remuneration on a public sector dummy with the controls mentioned in footnote b of Box 4.2. We then transform the coefficient into a percentage differential based on Halvorsen and Palmquist (1980). Pension contributions in 2021 have been imputed based on the method outlined in footnote 26.
Source: Authors’ calculations using the Annual Survey of Hours and Earnings.
4.8 Longer-term policy issues
The analysis in this chapter of the fiscal policy trade-offs facing the new Chancellor, and of the nature and evolution of the public–private pay differential, raise a number of longer-term policy issues. Here, we discuss two of these.
The planning horizon for public spending and pay
The crux of the problem for departments is that three years of budgets were fixed in cash terms on the basis of pay assumptions that have turned out to be inaccurate. The fact that pay awards are around 2 percentage points higher than originally budgeted for, combined with pressures from higher energy bills, is causing severe budgetary challenges for public services. This reflects the fact that staff costs account for well over one-third of departments’ day-to-day budgets, and so relatively small-sounding changes in pay can have significant impacts. The short-term fiscal choice is whether to provide additional funding to compensate departments for these unexpected costs.
This raises bigger, longer-term questions, though, about the way in which public spending is planned. There is a disconnect between the planning horizons for public sector pay and for departmental budgets: decisions are made at different intervals, despite the fact that the two are inherently linked. Departmental spending limits are typically fixed in cash terms for three or four years at a time at an autumn Budget or Spending Review30. Public sector pay decisions are made annually and typically announced over the summer (often for the financial year already in progress)31. This means that three years of spending limits can be set out under a certain set of pay assumptions, only for the pay awards actually offered to turn out higher or lower. The November 2015 Spending Review, for instance, set out departmental budgets for the 2019−20 financial year, but pay awards for that year were not announced until July 201932.
In ‘normal times’, with low and stable inflation, this is not a major issue. Since the advent of multi-year budgeting in 1998, inflation has rarely deviated much from its 2% target and, even if pay awards have differed from what was originally assumed, the difference has not been large enough to pose significant problems. Challenges arise when, as in the current environment, inflation and pay awards are more volatile. This raises the question of whether the system could be altered to better deal with this challenge.
One possible solution: align the two planning horizons
One option would be to plan both pay and departmental budgets over the same horizon and at the same frequency. That could mean, for example, setting three years of departmental spending limits and agreeing three-year pay deals with (most) public sector workers concurrently. That would provide more certainty to departments over the staffing costs they are likely to face and prevent budgets and pay awards from falling out of step. Alternatively, the government could return to the previous (pre-1998) system of annual spending rounds and revisit both public sector pay and departmental budgets each year33. This, too, would prevent pay awards and budgets from falling out of kilter. But each of these options would come with considerable downsides.
Planning everything on a three- or four-year basis would come at the cost of reduced flexibility over pay and reduced ability to adapt to labour market conditions. Public sector pay is already less responsive to economic conditions than pay in the private sector – this can be seen in the fact that public sector pay did not fall during either the post-financial crisis or COVID-19 recessions, and the fact that public sector pay is only sluggishly responding to rapid nominal pay growth in the private sector in 2022. Moving to multi-year pay deals across the board would exacerbate this.
On the other hand, returning to an annual budgeting process would come at the cost of reduced medium-term certainty for departments, potentially impeding their ability to plan effectively. Multi-year budgeting is seen as a strength of the UK’s system for planning and control of public expenditure (and one that is unusual internationally). Abandoning that would not be costless, and could bring back (or exacerbate) some of the short-termism that multi-year budgeting was introduced to address. An annual spending round could also take up huge amounts of civil servants’ time.
Our preferred option: multi-year budgeting with flexibility
An alternative option would be to largely stick to the current arrangement – multi-year spending settlements and annual pay deals – and instead adapt to shocks through discretionary adjustments to the spending plans. This would, with caveats, be our preferred option.
Under this proposed system, the Treasury would set out several years of departmental (cash) spending limits in advance, at a spending review – as it does now. Alongside this, the Treasury ought to publish the (broad) pay assumptions upon which those plans are based. These spending plans would form the basis of the ‘affordability constraint’ within which pay review body recommendations have to be made34. But if circumstances change – as they have this year – the pay review bodies would have the ability to deviate from those pay assumptions and justify their reasons for doing so. If these deviations are outside of a pre-specified range, the Treasury would then automatically reopen spending review settlements and adjust spending plans – either up or down – or explicitly explain its reasons for not doing so. This would introduce a degree of automaticity into the reassessment of spending plans without placing any obligation on the Treasury35.
This proposed system would aim to achieve the best of both worlds. Departments would be provided with the certainty of multi-year budgets; the Treasury would still be able to plan the overall level of public spending alongside decisions over tax and spend, and determine how much the government can ‘afford’ to increase pay by. In normal times, those plans would be ‘firm and fixed’. But in exceptional circumstances, when pay awards are outside of a pre-specified range, budgets could and would be adjusted as required. This feature need only be used rarely, but its existence would help prevent changes in departmental budgets and pay awards from falling too far out of kilter, and would prevent departments from bearing all of the inflationary risk.
This model would crucially rely on HM Treasury being both able and willing to make use of such flexibility, and an understanding that it will do so in exceptional circumstances. COVID-19 was one such circumstance. An inflation shock on the scale of what we are currently experiencing is, in our view, another. Building a larger contingency ‘reserve’ into overall spending plans would help, but building in a reserve on the scale necessary to absorb a shock such as this would not be desirable.
On this occasion, the question of whether or not to open spending plans is entirely at the behest of the new Prime Minister and Chancellor. Looking ahead, in anticipation of future shocks, it would be an improvement to build such a process into the framework for planning and controlling public spending.
The structure of public sector remuneration
The analysis in Sections 4.6 and 4.7 shows that there are large differences in the structure of remuneration between the public and private sectors, with public sector employees receiving more compensation in the form of employer pension contributions, and private sector employees receiving more in the form of bonuses. Whether or not this difference in structure is optimal is an open policy question.
Figure 4.16 shows the fraction of hourly remuneration made up by take-home pay (including bonuses) and deferred pay, split into employer and employee contributions36. There are two key takeaways. First, a far greater share of overall remuneration is take-home pay in the private sector than in the public sector (92.4% versus 79.9% in 2021). Second, the take-home share has been falling over time in both sectors as pension contributions have risen, but it fell by 2.7 percentage points in the private sector between 2005 and 2021 (from 95.1% to 92.4%) and by 6.9 percentage points in the public sector (from 86.7% to 79.9%).
Figure 4.16. Share of hourly remuneration in the form of take-home and deferred pay, by year and sector
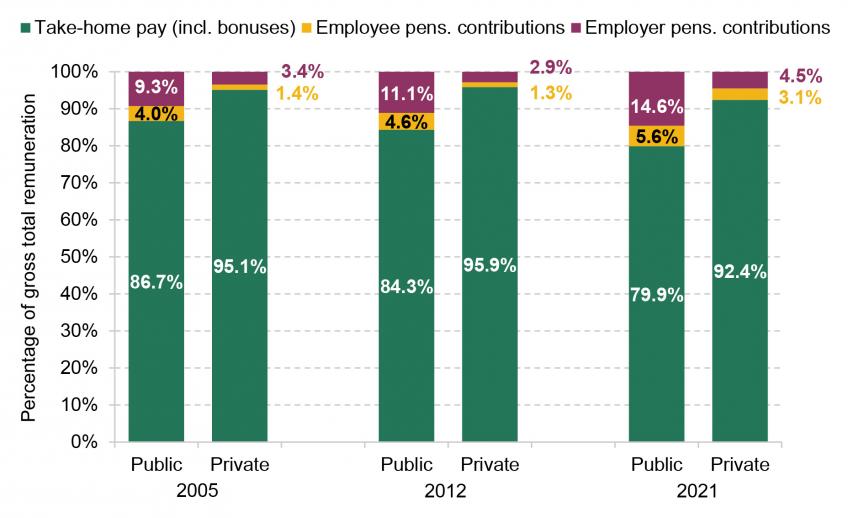
Note: ‘Take-home pay’ is used to mean pre-tax, non-deferred pay. Pension contributions for 2021 have been imputed based on the method outlined in footnote 26.
Source: Authors’ calculations using the Annual Survey of Hours and Earnings.
Figure 4.17. Mean, median, 10th percentile and 90th percentile of employee pension contribution rates among public sector employees participating in a pension, over time

Note: Pension contributions for 2021 have been imputed based on the method outlined in footnote 26.
Source: Authors’ calculations using the Annual Survey of Hours and Earnings.
In sum, remuneration in the public sector is considerably more skewed towards deferred pay, in the form of pension contributions, and this has been increasingly true over time. That is in part due to rising employer pension contributions, but employee pension contributions have also been rising, as shown in Figure 4.17. The mean employee pension contribution rate (among participants) has increased over time in the public sector, from 5.7% in 2006 to 7.0% in 2021, while it has remained fairly constant at around 4% of pay in the private sector (as shown in Figure 4A.3 in the appendix). Within the public sector, employee pension contribution rates have increased slightly more at the top and the bottom of the distribution than in the middle: the median contribution rate has only increased by 0.5 percentage points of pay between 2006 and 2021, compared with increases of over 3 percentage points at the 10th percentile of the distribution (from 1.5% to 4.6%) and at the 90th percentile (from 6.3% to 9.6%). Since employee pension contribution rates tend to increase with pay in the public sector, the distribution of take-home pay will be even more compressed in the public sector than the distribution of pay.
All else being equal, higher employee pension contributions mean lower take-home pay. During a cost of living crisis in particular, take-home pay may be a more salient measure of remuneration and more important to employees. Put simply, you cannot heat your home with a pension promise for 30 years hence. For public sector employees (or would-be public sector employees) weighing up their options between the two sectors, take-home pay could well be the key determinant.
Figure 4.18. Average conditional public–private hourly pay differentials, 2005–21, including take-home pay
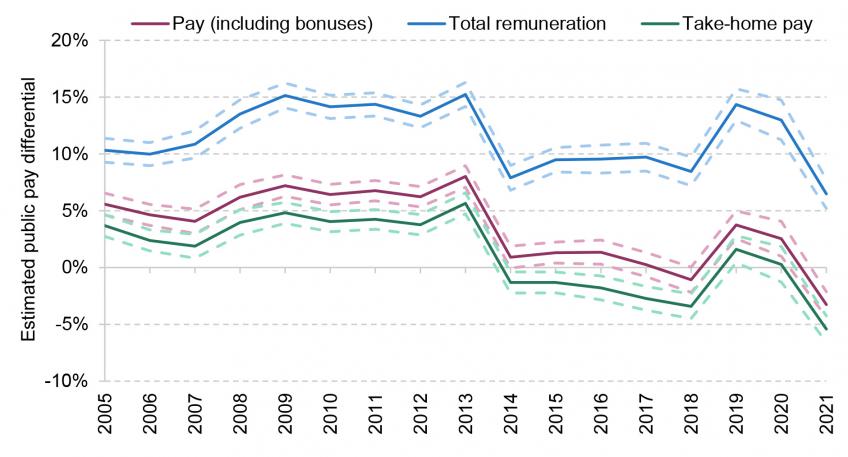
Note: ‘Take-home pay’ is used to mean pre-tax, non-deferred pay. The differentials are calculated using a regression of hourly pay on a public sector dummy with the controls mentioned in footnote b of Box 4.2. Pension contributions in 2021 have been imputed based on the method outlined in footnote 26.
Source: Authors’ calculations using the Annual Survey of Hours and Earnings.
In Figure 4.18, we therefore show how the public–private differential in terms of take-home pay has evolved over time, and how it compares with the pay and total remuneration differentials. While the trends are similar between the three series, the level of the differential for take-home pay is lower than that for pay, reaching –5% in 2021. Clearly, the public sector looks much less attractive if employees are evaluating the two sectors based on take-home pay, rather than on total remuneration.
An additional issue is that with high and rising employee pension contributions, some employees may choose to opt out of their workplace pension – particularly when household budgets are being squeezed. This is of particular concern in the public sector, where defined benefit (DB) schemes are more prevalent. That is because whereas in a defined contribution (DC) scheme employees have the flexibility to choose their own employee contribution rates, in DB schemes there is a set level of employee pension contributions the employee has to pay to enrol in the scheme. It is an in–out, binary decision. As the level of these required public sector employee pension contributions rises, employees have to sacrifice more and more take-home pay in order to receive the generous pension promises from their employer. An increasing number may decide that they are no longer willing – or able – to do so. For many in the public sector, that could mean losing 20% of their total remuneration, due to the loss of the generous employer pension contribution. Private sector employees with more flexible DC schemes, in contrast, could reduce their employee contributions without losing such a large amount of employer contributions.
Potential for a win–win reform?
There is potentially a strong case, therefore, for rebalancing public sector remuneration away from pensions and towards pay. This could be done without increasing the overall level of remuneration in a cost-neutral fashion that could potentially improve the welfare of public sector workers, who might prefer higher pay today in return for a moderately less generous pension tomorrow, without increasing costs for public sector employers. It might also help prevent a fall in pension scheme membership.
Public sector employees (and their trade unions) might be reluctant to trade away employer pension contributions in return for promises on pay which might be easier for a future government to erode. But one option – or at least a starting point – would be to reduce employee pension contributions, alongside a commensurate decrease in pension generosity. That would increase take-home pay for public sector employees with no change to the costs for their employers. There is perhaps a particularly strong case for this at the top end of the public sector pay distribution, where employee contributions are higher and where (as shown in Section 4.5) the public–private pay differential is most unfavourable. Clearly, there would be many details to iron out, and a full discussion lies beyond the scope of this chapter. But revisiting the appropriate balance between pension and take-home pay ought to be on the government’s medium-term policy agenda.
4.9 Conclusion
Public sector pay is a complex, contentious and fiscally significant policy area. The government employs more than 5½ million workers at an annual cost of more than £230 billion. What happens to public sector pay is clearly important for those workers and their families. It is also important for the government’s overall spending plans and fiscal policy, and its ability to recruit, retain and motivate the skilled individuals required to provide high-quality public services.
This year, the backdrop makes decisions around public sector pay even more difficult than usual. The cost of living is soaring. The economic outlook is increasingly gloomy, with both double-digit inflation and a possible recession looming. The UK is becoming poorer as a nation. Many public sector roles pay considerably less than in the past, and many public sector workers have themselves experienced a real-terms pay cut over the past 12 years or so. As a result, the public–private pay differential is now less favourable to the public sector than at any point in the past 30 years – with this especially true for higher-paid public sector workers and those living in London and the South East. When pensions are accounted for, a public sector pay premium remains – but a much smaller one than in the past.
In short, the prospect of another real-terms pay cut for public sector workers is understandably unappealing, and widespread industrial action remains possible.
The pay offers made to public sector workers so far would indeed mean, for the vast majority, a further real-terms pay cut. While private sector wages are also falling in real terms, it is likely that they will outperform wages in the public sector. That will only worsen existing challenges around recruitment and retention in the public sector.
Amidst a sharp rise in the cost of living, take-home pay is likely to be particularly salient for those in work, as family budgets are squeezed. High and inflexible employee pension contributions reduce take-home pay for public sector employees. The government might consider whether rebalancing public sector remuneration away from pensions and towards pay would represent an improvement – one that could be achieved with no increase in overall staffing costs.
Importantly, the pay awards announced over the summer are above what was budgeted for when departmental spending plans were set out last autumn. Without additional funding to compensate, public services will be forced to make cuts elsewhere to meet the additional costs of a higher-than-expected pay award. That is true this year but, if anything, the challenge is more acute over the next two, as the costs of higher-than-budgeted pay awards compound over time. Compensating departments would mean spending an additional £5 billion or so this year (2022−23); if pay were frozen in real terms after this year (i.e. pay awards matched inflation), that figure would rise to £10.6 billion by 2024−25. If no such compensation were forthcoming, staying within existing plans for the staff pay bill would require a cut to government headcount of around 110,000 this year, rising to 220,000 by 2024−25.
One major decision for the new Chancellor will be whether to top up existing spending plans, or allow public service quality to (further) deteriorate. This will certainly be the key choice at the spending review promised later this year, and could be one of the defining fiscal choices for the remainder of this parliament.
Appendix
Figure 4A.1. Ratio between public sector and private sector hourly wages, by sex
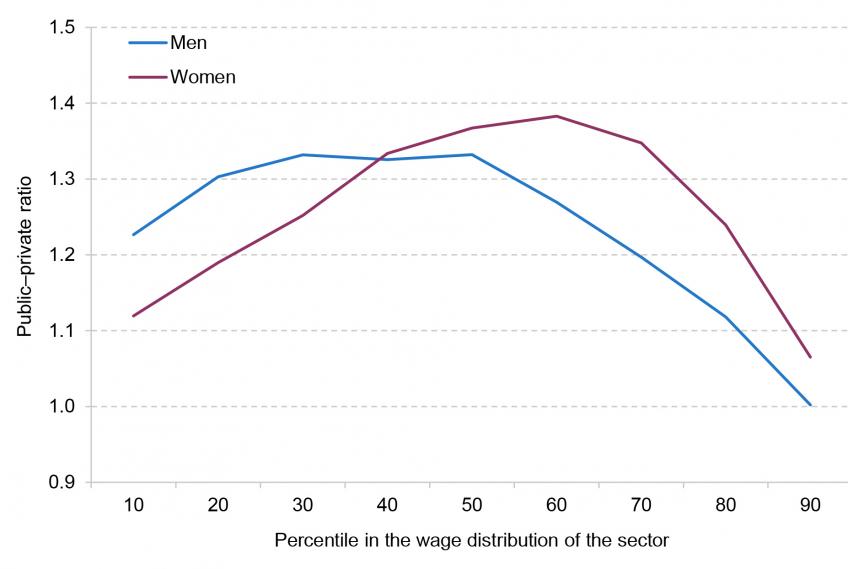
Source: Table 13.5a of Annual Survey of Hours and Earnings 2021.
Figure 4A.2. Estimated public–private wage differential by percentile in the conditional wage distribution, 2015–16
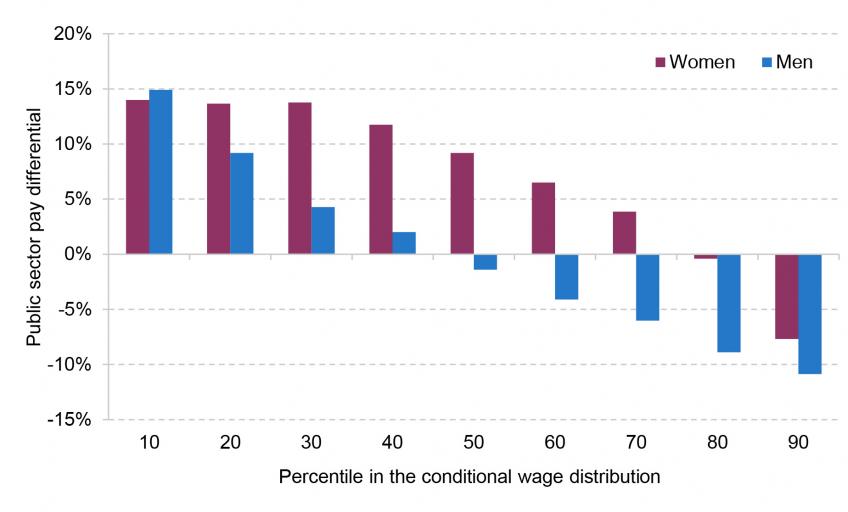
Source: Authors’ calculations using the quarterly Labour Force Survey, 2015Q2 to 2016Q1.
Figure 4A.3. Mean, median, 10th percentile and 90th percentile of employee pension contribution rates among private sector employees participating in a pension, over time
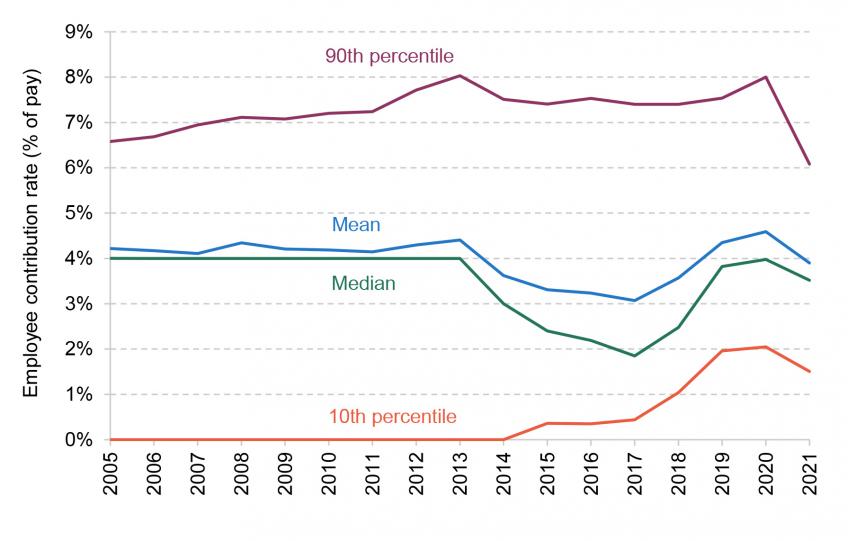
Note: Pension contributions for 2021 have been imputed based on the method outlined in footnote 26.
Source: Authors’ calculations using the Annual Survey of Hours and Earnings.
References
Bank of England, 2022. Monetary Policy Report – August 2022. https://www.bankofengland.co.uk/monetary-policy-report/2022/august-2022.
Crawford, R., Johnson, P. and Zaranko, B., 2018. The planning and control of UK public expenditure, 1993–2015. Institute for Fiscal Studies (IFS), Report R147, https://ifs.org.uk/publications/planning-and-control-uk-public-expenditure-1993-2015.
Cribb, J. and Emmerson, C., 2016. Workplace pensions and remuneration in the public and private sectors in the UK. National Institute Economic Review, 237, R30–7, https://doi.org/10.1177/002795011623700114.
Cribb, J. and Emmerson, C., 2021. What can we learn about automatic enrollment into pensions from small employers?. National Tax Journal, 74(2), 377–404, https://doi.org/10.1086/714113.
DDRB, 2022. Review Body on Doctors’ and Dentists’ Remuneration: Fiftieth Report 2022. https://assets.publishing.service.gov.uk/government/uploads/system/uploads/attachment_data/file/1092259/DDRB_2022_report.pdf.
Emmerson, C. and Stockton, I., 2022. Reversing NICs and corporation tax rises would leave debt on an unsustainable path. Institute for Fiscal Studies (IFS), Report R217, https://ifs.org.uk/publications/reversing-nics-and-corporation-tax-rises-would-leave-debt-unsustainable-path.
Halvorsen, R. and Palmquist, R, 1980. The interpretation of dummy variables in semilogarithmic equations. American Economic Review, 70(3), 474–5, http://www.jstor.org/stable/1805237.
HM Treasury, 2021. Autumn Budget and Spending Review 2021. https://www.gov.uk/government/publications/autumn-budget-and-spending-review-2021-documents.
NHS Business Services Authority, 2021. NHS Pension Scheme Annual Report and Accounts 2020-21. https://www.nhsbsa.nhs.uk/sites/default/files/2021-07/CCS001_CCS0521624740-001_NHS%20Pension%20Accounts%202020-21_Web%20Accessible.pdf.
NHSPRB, 2022. NHS Pay Review Body: Thirty-Fifth Report 2022. https://assets.publishing.service.gov.uk/government/uploads/system/uploads/attachment_data/file/1092270/NHSPRB_2022_Accessible.pdf.
Office for National Statistics, 2019. Who works in the public sector?. https://www.ons.gov.uk/economy/governmentpublicsectorandtaxes/publicspending/articles/whoworksinthepublicsector/2019-06-04.
Office for National Statistics, 2020. Public and private sector earnings: 2019. https://www.ons.gov.uk/employmentandlabourmarket/peopleinwork/earningsandworkinghours/articles/publicandprivatesectorearnings/2019.
Office for National Statistics, 2022. Average weekly earnings in Great Britain: August 2022. https://www.ons.gov.uk/employmentandlabourmarket/peopleinwork/employmentandemployeetypes/bulletins/averageweeklyearningsingreatbritain/august2022.
Office of Manpower Economics, 2021. OME Stewardship Report 2020 to 2021. https://www.gov.uk/government/publications/ome-stewardship-report-2020-to-2021.
Ogden, K., Phillips, D. and Siôn, C., 2021. What’s happened and what’s next for councils?. In C. Emmerson, P. Johnson and B. Zaranko (eds), The IFS Green Budget: October 2021, https://ifs.org.uk/books/whats-happened-and-whats-next-councils.
Phillips, D., 2021. How and why has the Scottish Government’s funding changed in recent years? Institute for Fiscal Studies (IFS), Report BN321, https://ifs.org.uk/publications/how-and-why-has-scottish-governments-funding-changed-recent-years.
PSPRB, 2022. Prison Service Pay Review Body: Twenty First Report on England and Wales 2022. https://assets.publishing.service.gov.uk/government/uploads/system/uploads/attachment_data/file/1092253/PSPRB_2022_E_W_report.pdf.
Sibieta, L., 2022a. School spending and costs: the coming crunch. Institute for Fiscal Studies (IFS), Report BN347, https://ifs.org.uk/publications/school-spending-and-costs-coming-crunch.
Sibieta, L., 2022b. The even longer squeeze on teacher pay. Institute for Fiscal Studies (IFS), Comment, https://ifs.org.uk/articles/even-longer-squeeze-teacher-pay.
Warner, M. and Zaranko, B., 2021. Pressures on the NHS. In C. Emmerson, P. Johnson and B. Zaranko (eds), The IFS Green Budget: October 2021, https://ifs.org.uk/books/pressures-nhs.
Zaranko, B., 2022a. What should public sector pay policy be trying to achieve? Institute for Fiscal Studies (IFS), Comment, https://ifs.org.uk/articles/what-should-public-sector-pay-policy-be-trying-achieve.
Zaranko, B., 2022b. The inflation squeeze on public services. Institute for Fiscal Studies (IFS), Comment, https://ifs.org.uk/articles/inflation-squeeze-public-services.
Data
Office for National Statistics. (2022). Annual Survey of Hours and Earnings, 1997-2021: Secure Access. [data collection]. 20th Edition. UK Data Service. SN: 6689, DOI: 10.5255/UKDA-SN-6689-19
Office for National Statistics. Social Survey Division, Northern Ireland Statistics and Research Agency. Central Survey Unit. (2022). Quarterly Labour Force Survey, 1993-2022. Retrieved from https://beta.ukdataservice.ac.uk/datacatalogue/series/series?id=2000026
Endnotes
Authors

Bee Boileau
Bee joined the IFS in 2021 as a Research Economist and works in the Retirement, Saving and Ageing sector.

Laurence O'Brien
Laurence is in the Retirement, Savings and Ageing sector. His work focuses on people’s savings decisions and on economic activity in later life.

More from IFS
Understand this issue


Policy analysis


Academic research


