The UK economy is under the cosh. Under the Bank of England’s latest forecasts, we are set to experience both a recession and an extended period of high inflation. That poses serious challenges to households, businesses and policymakers – not least the next prime minister.
It also poses challenges for public services, whose budgets are set in cash terms and therefore do not automatically increase in the face of higher-than-expected inflation. Higher inflation means that hospitals, schools, prisons and councils are able to purchase fewer goods and services: their budgets become smaller in real terms. In other words, unexpectedly high inflation imposes an unintended dose of austerity as the government’s spending plans become less generous. This is one reason why high inflation can be ‘good’ for the public finances, at least in the short term: tax revenues come in higher, because the incomes and spending on which they are levied are growing more quickly, but government spending plans adjust upwards much more slowly (if at all).
Measuring the squeeze on public services
How much less generous have the government’s plans become? And how much would it cost to compensate departments and return their budgets to the level of generosity the government originally intended to achieve when plans were set out last year?
The answers to these questions depend on how you measure inflation. The measure of inflation typically used for making such assessments is called the GDP deflator, a measure of general inflation in the domestic economy (unlike the Consumer Prices Index, CPI, which is a measure of the rate of inflation facing households and which will naturally include changes in the price of imported goods and services). The GDP deflator underpins HM Treasury’s calculations of the real-terms generosity of its spending plans. It is not a perfect measure of the cost pressures facing departments. In fact, for a number of obscure technical reasons, it probably understates the ‘true’ cost pressures facing departments at the present moment. But it is perhaps the best general-purpose measure we have and, whatever its shortcomings, it will be used by the Treasury in its decision-making.
Under the spending plans published in the government’s October 2021 Spending Review, day-to-day public service funding (resource departmental expenditure limits, excluding depreciation, in the fiscal jargon) was planned to grow by 3.3% per year, on average, between 2021−22 and 2024−25. That was based on Office for Budget Responsibility (OBR) forecasts at the time, under which GDP deflator inflation was set to average 2.3% over that three-year period. By March 2022, the OBR was forecasting an average of 2.8% inflation (as measured by the GDP deflator) over the three years (i.e. up by 0.5% a year). Average real-terms funding growth over the Spending Review period fell as a result from 3.3% to 2.8% (i.e. down by 0.5% a year).
A lot has changed since March. For one, the Lionesses are now champions of Europe. For another, inflation is now expected to be considerably higher. While the Bank of England and many other institutions produce regular forecasts for CPI, the same is not true of the GDP deflator. The OBR’s March forecast for the GDP deflator is still the most recent one we have. CPI is not a good measure of the cost pressures facing public services (a hospital does not have the same consumption basket as a typical household, for instance – households typically spend a much bigger fraction of their budgets on energy and food, and a much smaller fraction on prescription drugs and midwives). More generally, staffing costs represent a big fraction of expenditure for most public services, but public sector wages do not, for obvious reasons, enter the CPI basket. But there are good reasons to think that just as forecasts for CPI inflation have shifted upwards, so too will forecasts for the GDP deflator. Indeed, the out-turn data for growth in the GDP deflator are already running considerably ahead of the OBR’s March forecast (2.8% year-on-year growth in 2022 Q1, versus -0.1% in the forecast).
Here, we adjust the OBR’s March forecast for the GDP deflator based on: 1) the change in the forecast for CPI between the OBR’s March 2022 and the Bank’s August 2022 forecasts; and 2) the past relationship between CPI and the GDP deflator. Specifically, we assume that the degree of ‘pass-through’ from CPI to the GDP deflator between March and August 2022 is the same as was observed between October 2021 and March 2022. Under this assumption, GDP deflator inflation would be expected to average 3.7% over the three years from 2021−22 to 2024−25 (versus 2.8% under the OBR’s March forecast, and 7.1% for CPI under the Bank’s August forecast).
This is only an approximation and could well prove to be an underestimate. In any case, for the reasons discussed above, there is no reason to expect the GDP deflator to capture perfectly the cost pressures facing departments (though, reassuringly, it is broadly comparable to IFS’s school-specific cost index). Nonetheless, with these caveats in mind, this allows us to produce an illustrative estimate of what real-terms departmental spending plans might now look like.
How much less generous have plans become?
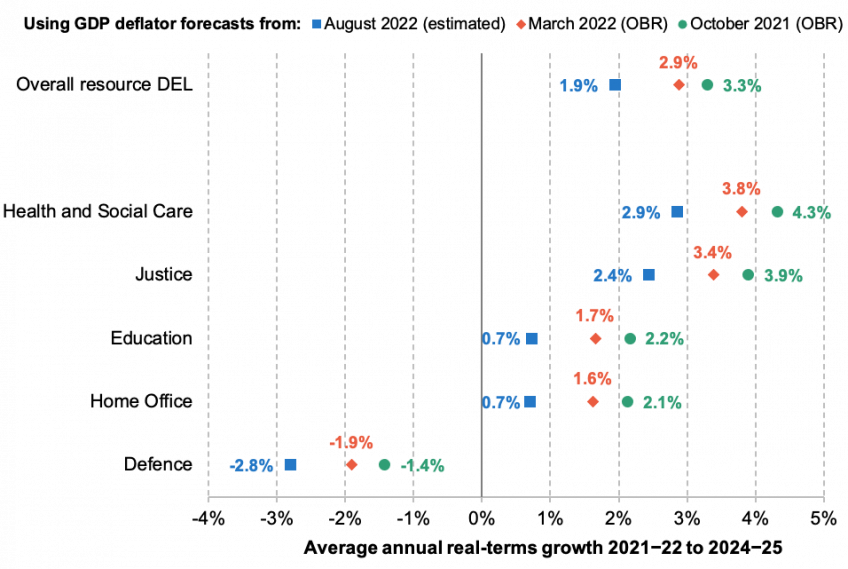
Using this rough estimate for the GDP deflator, we can examine how much less generous departmental spending plans have become in real terms. This is shown in Figure 1. The average real-terms growth rate for day-to-day public service funding drops from 3.3% under original plans to 1.9% per year. In other words, higher inflation is expected to wipe out more than 40% of the planned real-terms increases.
For the Department of Health and Social Care (DHSC), the planned growth rate drops from 4.3% to 2.9%; for the Department for Education (DfE), it falls from 2.2% to 0.7%. Because increases for these departments were front-loaded (with big increases in the current year followed by much smaller increases in subsequent years), both departments would face a real-terms budget cut between 2022−23 and 2023−24. The Ministry of Defence was already facing average real-terms cuts of 1.4% per year under original plans; that may now increase to 2.8% per year, under these estimates. This would sit oddly with Mr Sunak’s and Ms Truss’s stated plans for defence spending to increase to 2.5% and 3.0% of GDP, respectively, by the end of the decade.
These figures are by no means precise. If this ongoing period of economic turbulence tells us anything, it is that things can change very quickly. But the broad conclusion of the exercise is clear: plans for public service funding have become considerably less generous than originally intended.
Figure 1. Planned average real-terms growth in selected day-to-day budgets over Spending Review period under different inflation forecasts

Note: October 2021 plans refer to the real-terms growth rate associated with the latest cash resource spending settlements, under GDP deflator forecasts as of October 2021. August 2022 estimated GDP deflator forecast is calculated based on the change in CPI forecasts between March and August 2022, and previous rates of ‘pass-through’ from CPI to the GDP deflator.
Source: Author’s calculations using HM Treasury PESA 2022, Spring Statement 2022, and Spending Review 2021; OBR Economic and Fiscal Outlook, March 2022; and Bank of England Monetary Policy Report August 2022.
To compensate, or not to compensate?
The new prime minister and chancellor face the choice of whether to compensate departments for higher-than-expected inflation and, in particular, for public sector pay awards above what was originally budgeted for.
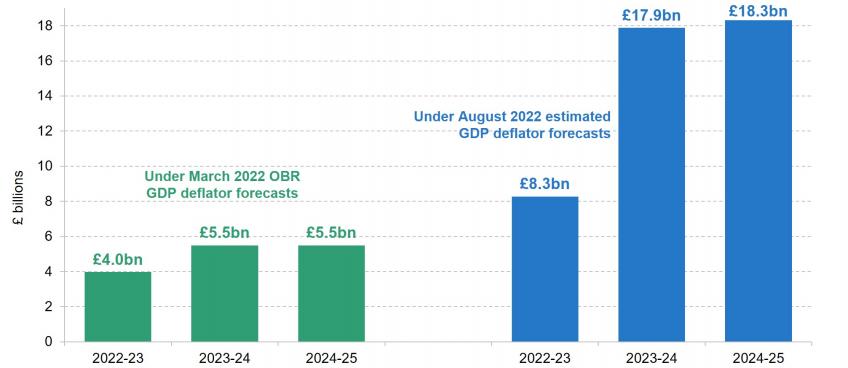
Figure 2 provides an estimate of the scale of spending top-up that might be required to make departments no worse off, in real terms, than they were planned to be at the October Spending Review. Under our estimated path for the GDP deflator, that would require more than £8 billion this year (2022−23) and around £18 billion in each of the next two years (2023−24 and 2024−25). Even under the OBR’s out-of-date March forecasts, departments would require an extra £4 billion this year (followed by £5.5 billion in each of the following two years) to be fully compensated.
Figure 2. Estimated amount of additional spending required to return departmental spending plans to the original (October 2021) planned real-terms growth rate

Note: Figures refer to the amount of additional (nominal) spending required to achieve the real-terms growth rate in resource DEL excluding depreciation originally planned for the October 2021 Spending Review. August 2022 estimated GDP deflator forecast is calculated based on the change in CPI forecasts between March and August 2022, and previous rates of ‘pass-through’ from CPI to the GDP deflator.
Source: Author’s calculations using HM Treasury PESA 2022, Spring Statement 2022, and Spending Review 2021; OBR Economic and Fiscal Outlook, March 2022; and Bank of England Monetary Policy Report August 2022.
Choosing not to compensate departments for unexpectedly high cost pressures would be a deliberate decision to cut spending in real terms, at a time when many public services are showing signs of strain. The NHS, for example, is already having an unprecedentedly busy summer, with its busiest ever June for 999 calls and A&E attendances, and a worrying increase in average ambulance response times.
An unfortunate series of global shocks have made us poorer as an energy- and food-importing nation. Dividing that economic pain between households, businesses and public services is the unavoidable and unpalatable task facing the next government. Choosing to accept a reduced range and quality of public services is one possible response to becoming a poorer nation. But if the next prime minister does choose to cut rates of corporation tax, National Insurance or income tax, and chooses to leave public services worse off heading into a difficult winter, they should be honest and transparent about the choice they have made.


