
Downloads
Download chapter PDF
PDF | 922.7 KB
Key findings
1. The new government has accepted the pay recommendations of the independent Pay Review Bodies (PRBs), meaning that public sector employees will see their pay increase by between 4¾% and 6% in 2024–25, depending on occupation. Chancellor Rachel Reeves has put the cost at an additional £9.4 billion on top of the 2% pay rises budgeted in the 2021 Spending Review.
2. While public sector pay increases for 2024–25 are in line with forecast pay growth in the private sector, pay trends in the two sectors have not followed the same path since 2010. Public sector pay held up much better than private sector pay between 2009 and 2014, but since then the situation has reversed. Whilst real private sector pay is now above its level at the start of 2019, public sector pay is, in real terms, only 1% higher and it is still below where it was in 2010.
3. Median pay relative to the overall hourly pay distribution has evolved differently over time for different public sector occupations. Broadly, it is better-paid public sector workers who have seen bigger falls in pay, with doctors’ pay slipping from the 95th percentile of the hourly pay distribution to close to the 90th percentile since 2007. Teachers have seen falls from the 87th percentile to the 81st percentile. In contrast, while nurses and those in public administration have seen their pay fluctuate, by 2022 they are at roughly the same point in the distribution as they were in 2007.
4. Each area of the public sector faces specific challenges, though recruitment and retention are common concerns across much of the sector. In the NHS, there is an increasing reliance on international recruitment and agency staff to fill posts. The NHS ‘Long Term Workforce Plan’ also aims to increase the number of staff from 1.75 million in 2023 to between 2.3 and 2.4 million by 2036–37, which implies that NHS pay may have to rise faster than that in the wider economy to ensure NHS careers are sufficiently attractive.
5. The teacher vacancy rate of 0.6% is twice the rate it was pre-pandemic. Training targets (as set by the Department for Education’s Teacher Workforce Model) are being missed by big margins in most subjects, with less than a fifth of the target in business studies and physics being met. Although retention rates are not much lower than between 2013 and 2020, they are lower in subjects that are training the fewest teachers. More-experienced teachers have seen some of the largest real-terms falls in pay since 2010.
6. Police officers, in contrast to other areas of the public sector, have seen their pay deteriorate more for those lower down the pay scale. This is particularly true for constables on the bottom pay grade, whose pay has gone from being around the 34th percentile of the earnings distribution in 2014 to around the 26th percentile in 2023. Many police forces are still experiencing shortages of officers, despite the large efforts made by the Police Uplift Programme.
7. The prison service is on the front line of one of the most salient challenges currently facing the public sector – the severe shortage of prison places. In terms of staff, retention is the main challenge. The leaving rate of prison staff was 13% in 2023, with officers who had been in post for less than a year the most likely to leave. Although pay has remained stable in relative terms over time, and is in general higher than in ‘comparable professions’, it is still low compared with the rest of the public sector and the wider economy.
8. People on ‘senior salaries’ make up much less than 1% of the headcount of the public sector. In general, the occupations included in this group are not experiencing challenges to the same extent as other parts of the public sector, though this is not universally true. The largest of the groups – the senior civil service (SCS) – has seen pay fall in real terms by between 12% and 16% (depending on seniority) since 2013 and is characterised by a large degree of churn, with 25% of the SCS changing roles or departments, or leaving the SCS entirely, in 2022–23. Of those who leave, almost three-quarters are regarded as ‘regrettable’ losses. The judiciary (which is also covered in the ‘senior salaries’ remit) faces severe recruitment challenges, though retention is largely not an issue.
9. The Armed Forces have seen a planned big reduction in headcount over time. But the number of individuals choosing to leave before the end of their contracted period has grown above its pre-pandemic level. Although real-terms falls in pay are smaller than for other public sector occupations, members of the Armed Forces are generally unsatisfied with their pay. The Armed Forces are in receipt of one of the largest pay rises from the 2024–25 PRB recommendations, alongside doctors and the judiciary.
10. A substantial part of public sector workers’ remuneration comes in the form of generous defined benefit pension accrual. Members of these public sector arrangements receive, on average, an employer’s pension contribution that the government values at at least 23% of salary. Membership of these arrangements generally requires a significant employee contribution in order to participate. Lower-paid workers in particular are more likely to opt out given the size of these contributions: more than twice as many of those earning £10,000 to £16,000 a year opt out as of those earning over £31,000 per year (13% versus 6%). A recurring theme across PRB reports is concerns about the financial implications of high employee pension contributions needed to participate in the schemes and support for greater flexibility in the approach to pensions.
11. The challenges in recruiting, retaining and motivating public sector employees and the need for expansion of the NHS workforce in line with the ‘Long Term Workforce Plan’ mean that there will be pressure for public sector pay to rise faster than average earnings over the coming parliament. Based on March 2024 forecasts from the Office for Budget Responsibility, increases in public sector pay in line with average earnings over the next four years would, if the numbers employed remained constant, cost around £6 billion per year by 2028–29. If average public sector pay were to rise by 1 percentage point per year faster than average earnings for four years, the cost would rise to £17 billion per year by 2028–29. This would rise further if the public sector workforce increased in size.
4.1 Introduction
The public sector employs 5.9 million people in the UK, at an annual cost of £270 billion in 2023–24 (including salaries, employer pension contributions and employer National Insurance contributions) – 10% of national income and 22% of total UK government spending. The employment, pay and productivity of these employees are therefore an important determinant of the material standard of living of millions of families, as well as a crucial input into the provision of public services. Public sector pay growth is an important pressure on public spending.
All else equal, higher growth in public sector pay (even if it delivers higher-quality public services) necessitates lower public sector employment, lower spending elsewhere, higher taxation or higher borrowing. It is not surprising that public sector pay can be – as is currently the case – somewhat of a political football, especially following the spike in public sector industrial action in 2023 which continued (albeit at a much lower level) into 2024 (Office for National Statistics, 2024).
One of the new government’s first announcements, coming at the end of July 2024, was that it would accept in full the independent Pay Review Bodies’ recommendations for increases in public sector pay.1 These pay awards, averaging 5.5% annual growth in cash terms, formally related to the 45% of the public sector covered by the eight Pay Review Bodies (Institute for Government, 2022). Even for public sector occupations where pay is not formally set by these Pay Review Bodies, pay often follows these trends closely – for example, civil servants’ pay will rise by 5% in 2024–25.2
In one of her first acts as Chancellor, Rachel Reeves presented the additional public spending necessitated by the acceptance of these pay awards in full as part of the ‘unfunded pressures’ inherited from the previous government (HM Treasury, 2024). The awards are estimated to add £9.4 billion to public spending this year in excess of the 2% pay awards budgeted for at the time of the 2021 Spending Review. As our colleagues noted in July (Boileau et al., 2024), with forecasts for private sector wage growth at similar rates, recommendations of this magnitude should not have come as a complete surprise. But looking to the future, a key question remains: to what extent will public sector pay growth continue to be an important pressure for a government trying to both deliver high-quality public services and exercise spending control? Providing an answer to this question is the key aim of this chapter.
This is particularly important because improved public services were a key plank of the Labour Party manifesto in 2024, with improvement of the NHS one the new government’s five ‘missions’. The manifesto criticised the ‘recruitment and retention crises’ across public services and pledged to recruit thousands of new teachers and police officers and to improve public service workers’ living standards.3 Recruiting and retaining more public sector workers, and improving their living standards, will in part require additional expenditure on public sector pay over the course of this parliament.
It is worth reflecting on the aims of the government in setting the level of public sector pay. Pay plays a key part in attracting new employees, and retaining and motivating existing ones. The public sector workforce is one of the main inputs into public service provision, and pay structures and levels affect whether the right number and mix of staff are available and appropriately motivated to deliver the desired range and quality of public services. In addition, public sector pay is sometimes used as a vehicle for social policy – as a way to increase living standards for particular groups or conduct some redistribution towards lower earners – though the appropriateness of using public sector pay in this way is a matter of debate. The government is generally also looking to achieve its desired aims at the minimum cost. These goals may therefore conflict; the government often has significant market power in the labour market for certain kinds of workers, allowing it to suppress pay to some extent (perhaps most obviously in national defence, policing, healthcare and education). But the ability to do this might still come at the expense of public service performance and, potentially, social policy goals.
Figures 4.1 and 4.2 provide important background information on how public sector pay has performed in recent years. Figure 4.1 shows that average (mean) public sector pay was around £34,500 per year in mid 2024, compared with just over £36,000 for private sector employees. These figures include data on all employees, not just full-time employees.4 It is notable from the chart that private sector pay has grown more strongly than public sector pay since 2019, with private sector pay well above its pre-pandemic level in real terms, while public sector pay in Spring 2024 was approximately at the same real-terms level as pre-pandemic. With public sector pay also having grown more slowly than private sector pay in the 2010s, public sector pay was at a similar level in 2024 to its level eight years earlier in 2016, and most remarkably still lower than its 2010 level.
Figure 4.1. Real average (mean) annual earnings, by sector
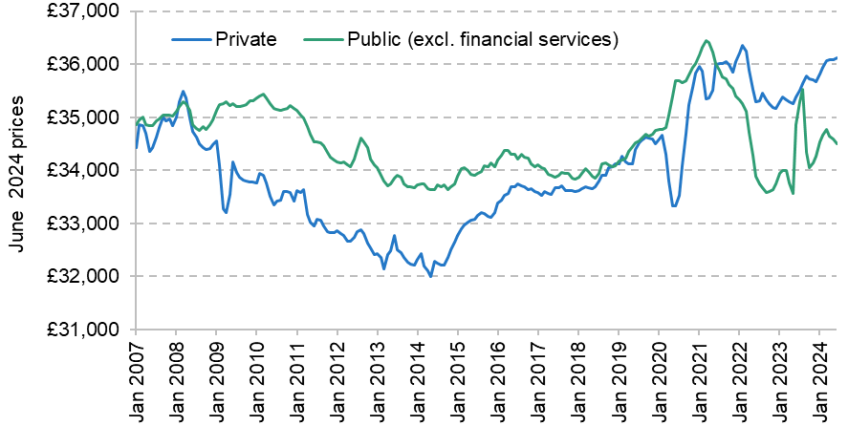
Note: Figures shown are average mean total weekly earnings (including bonuses and arrears) over the previous three months, multiplied by 52, deflated using monthly CPIH. We exclude financial services from the public sector so that it is not affected by nationalisation of banks and subsequent trends in pay in those banks.
Source: Authors’ calculations using ONS average seasonally adjusted weekly earnings by sector (table EARN01).
Pay awards are generally expressed in nominal (cash terms). We therefore show nominal growth in public and private sector pay in Figure 4.2. The last government agreed and implemented a set of one-off payments to public sector workers in Summer 2023, generating a spike in total public sector pay (and a corresponding drop in growth a year later). Looking instead at regular pay – a measure that strips out bonuses and arrears – public and private sector pay have been rising at similar rates since Autumn 2023, at a fairly high nominal annual growth rate of around 6% in the most recent year of data. No wonder, therefore, that our colleagues argued that Pay Review Body recommendations averaging 5.5% were ‘not … a complete surprise’ (Boileau et al., 2024). Since January 2019 (when average public and private sector salaries were at similar levels), private sector (total) pay has grown by 31% in cash terms and 6% in real terms, while public sector (total) pay is up 25% in cash terms and 1% in real terms.
Figure 4.2. Nominal growth in average earnings (total and regular), by sector
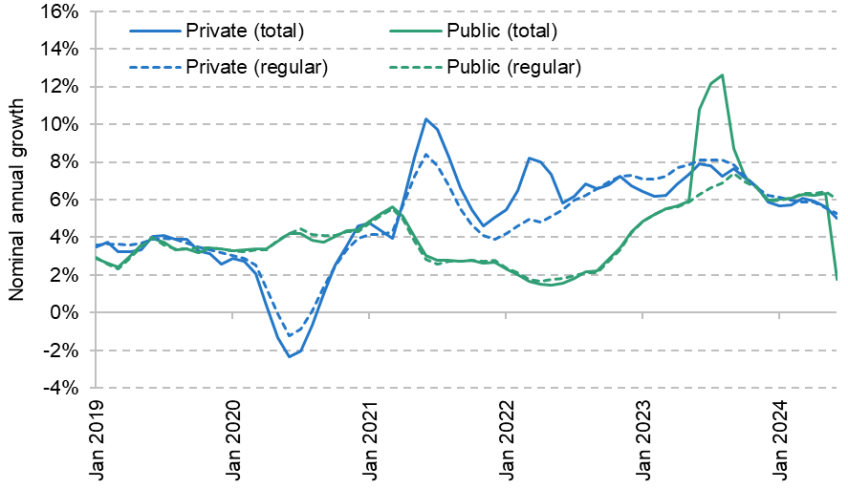
Note: Total pay includes bonuses and arrears; regular pay excludes them. Public sector excludes financial services. Nominal growth shown as annual growth between the three months ending the labelled month compared with the same three months a year earlier.
Source: ONS average seasonally adjusted weekly earnings by sector (table EARN01).
Perhaps not surprisingly, given the falls in real-terms pay in the public sector (and the contrast to the private sector) that have occurred since 2022, there has been significant and high-profile industrial action in the public sector, peaking in 2023, as shown in Figure 4.3. Though 2024 has seen large falls in the number of days lost to strike action in the public sector, there were still 130,000 working days lost to strikes in the second quarter of this year, in contrast to the six-year period from 2015 to 2021 which never saw more than 80,000 working days lost in a single quarter.
Figure 4.3. Working days lost to strike action in the public sector, by quarter
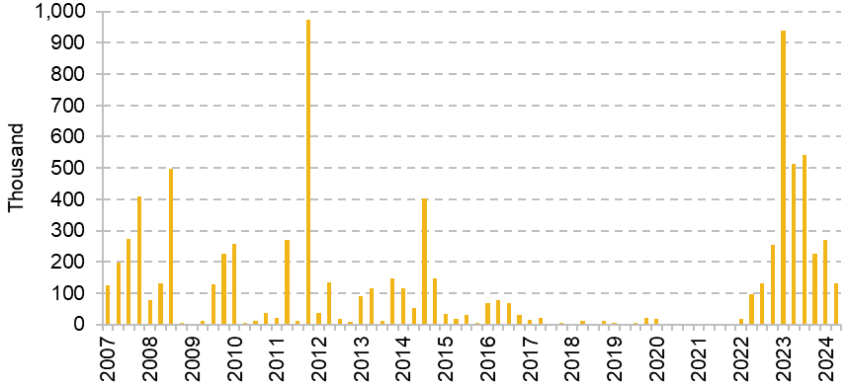
Note: Data not available for February 2020 to January 2022.
Source: Authors’ calculations using Office for National Statistics (2024a).
The rest of this chapter proceeds as follows. In the next section, we present new evidence on public sector pay in relation to the private sector, and how trends have differed across public sector occupations. This builds in particular on pre-election analysis of these issues from IFS (Cribb and O’Brien, 2024). In Section 4.3, we consider a range of public sector occupations in turn, drawing on the wealth of information on the labour markets and recruitment and retention challenges facing different public sector employers contained in the latest Pay Review Body reports from this summer. Section 4.4 considers some issues in public sector remuneration that cut across the different public sector occupations, and Section 4.5 concludes.
4.2 Trends in pay and employment across the public sector
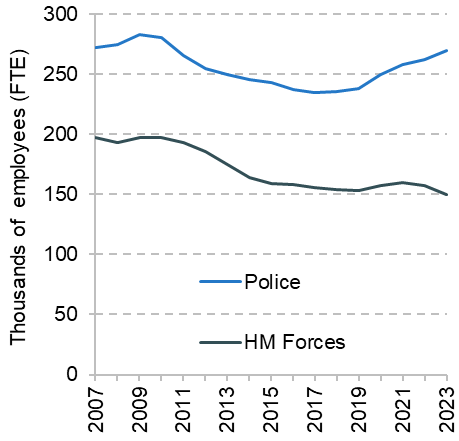
This section considers key trends in public sector pay in different occupations, using new analysis of microdata to understand where different public sector occupations fit in the pay distribution and how that has changed over time. Figure 4.4 first provides key context for the analysis in this section and the rest of the chapter. It shows trends in public sector employment (full-time equivalent, FTE) across major parts of the public sector. We focus here on five areas that make up 86% of public sector employment: NHS, education, public administration (i.e. civil servants in central and local government, but not including administrative roles in other public services), police (including civilians) and HM Forces.5
Figure 4.4. Total full-time-equivalent (FTE) employment in the UK: selected areas of the public sector
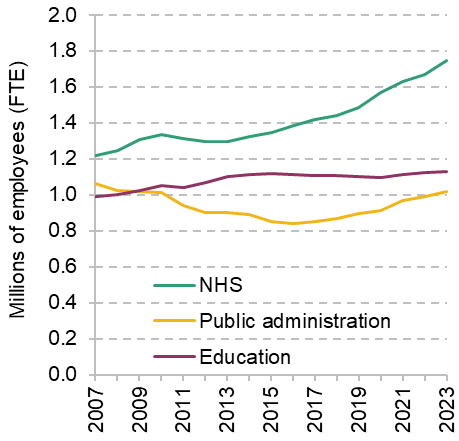
Note: Figures are adjusted for the reclassification of English sixth form and further education colleges into the private sector in 2012Q2.
Source: ONS public sector employment statistics, table 4 (‘by industry; full-time equivalent’).
The NHS workforce has expanded in every year since 2012, and at 1.75 million in 2023 was 31% larger than in 2010. In contrast, following small rises in the late 2000s and early 2010s, the public sector education workforce has been essentially unchanged at just over 1.1 million since 2015, while the public administration workforce has returned to its 2010 level following significant reductions in headcount between 2010 and 2016. The number of people employed by police forces has seen a similar U-shaped trend, with a 16% fall in employment between 2010 and 2018, followed by an increase after 2019, although the workforce remained slightly smaller in 2023 than in 2010. In contrast, HM Forces has seen no recent increase in its workforce which, at 150,000 (FTE), is down almost a quarter on its 2010 level. In comparison with these trends, private sector employment grew by 15% from 2010 to 2023, and overall employment in the UK grew by 13%.
Cribb and O’Brien (2024) showed that different groups of public sector workers have seen differing trends in wages, with higher-paid public sector workers seeing particularly poor pay growth. They showed that the 25th percentile of public sector earnings rose by 16% in real terms between 2007 and 2023. Meanwhile, the 75th and 90th percentiles of public sector pay fell by 8% and 10% in real terms respectively. But it is important not only to compare trends amongst public sector workers, but to consider how pay has changed in other similarly paid jobs. For example, faster wage growth for lower-paid jobs may be necessary if there are falls in pay inequality more generally. As Blundell et al. (2023) show, wage inequality has fallen in recent years, especially towards the bottom of the pay distribution since the mid 2010s.
To account for this, we present new evidence on where the average (median) hourly pay of major public sector occupations fits into the overall hourly wage distribution, from 2007 to 2023. This is supplemented by information from Cribb, Emmerson and Sibieta (2014), who used slightly different data to look at the position of (most of) these occupations in 1980, 1990, 2000 and 2010. As shown in Figure 4.5, higher-earning public sector occupations have fallen considerably down the overall employee pay distribution during the 2010s and early 2020s. In 2007, median pay for doctors was at the 95th percentile of the hourly pay distribution (and strikingly had been there in each of the years 1980, 1990 and 2000), but since 2010 it has gradually fallen such that average doctor pay is now close to the 90th percentile. Doctors are therefore still considerably better paid than the majority of workers in the UK, but to a lesser extent than they have been historically since at least the 1980s.
Figure 4.5. Position (percentile) of median pay of major public sector occupations in the overall hourly pay distribution
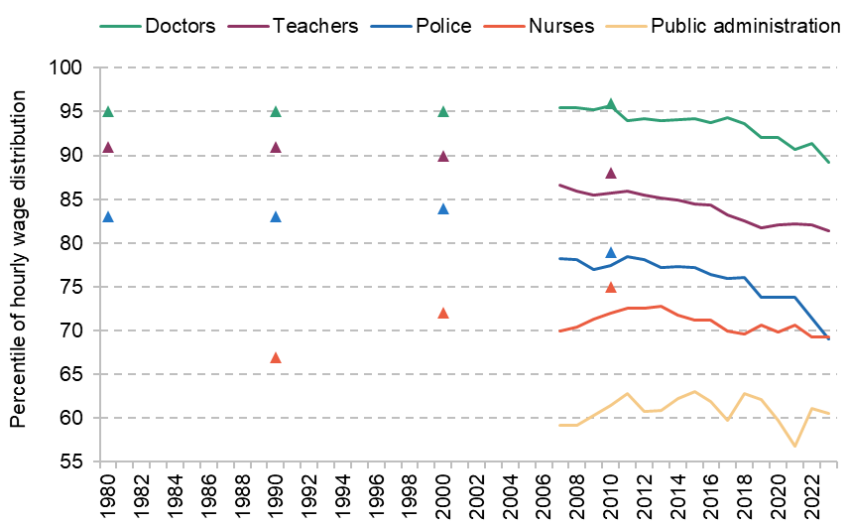
Note: From 2007 to 2023, the following definitions are used. Doctors: SOC2000 & SOC2010 – 2211; SOC2020 – 221. Teachers: SOC2000 & SOC2010 – 2314 & 2315; SOC2020 – 2313, 2314 & 2315. Police officers (this only includes police officers at sergeant and below): SOC2000, SOC2010 & SOC2020 – 3312. Nurses: SOC2000 – 3211 & 3212; SOC2010 & SOC2020 – 223. Public administration: SIC2003 & SIC2007 – 751.
Source: Figures from 2007 to 2023 are based on authors’ calculations from the Annual Survey of Hours and Earnings (ASHE). Figures for 1980,1990, 2000 and 2010 are reproduced from Cribb, Emmerson and Sibieta (2014), which used the New Earnings Survey (which does not have the same weights as ASHE).
Average teacher pay has also fallen, from the 87th percentile in 2007 to the 81st percentile by 2023, continuing the trend of falling relative teacher pay during the 2000s. Police pay (for officers, sergeant and below) also continued the downward trend seen in the 2000s, from the 78th percentile in 2007 to the 74th percentile in 2019. Further sharp falls in police pay have been seen since 2019, though these are likely a result of compositional change; as police forces have expanded their workforces, they have become less experienced (and less well paid) on average. In contrast, less well-paid public sector occupations (though still paid above the national average) have not fallen behind similarly paid workers: nurses and public administration workers have seen pay grow at a similar rate to other similarly paid workers, maintaining their relative positions (at around the 70th percentile and 60th percentile respectively). For nurses, there were better pay trends compared with private sector employees from 1990 to 2010, followed by some retrenchment after 2010.
This analysis suggests that it is not only the case that higher-paid public sector workers have seen larger falls in their real-terms pay than less well-paid public sector workers. In addition, they have fallen further down the overall pay distribution, with nurses and public administration (civil servants) seeing their pay hold up better compared with the rest of the workforce than (the higher-paid) teachers, police officers and doctors. This means that, if problems of public sector retention and recruitment were a function of pay alone, we might expect these issues to be especially severe in the higher-paid public sector occupations.
It is also worth noting that these changes, whereby doctors, teachers and police officers (in particular) have slipped down the pay distribution, still hold when accounting for the fact that employer pension contributions are typically much more generous in the public sector than in the private sector. This is shown in Table 4A.1 in the appendix. While, on average, pay in the public sector has compressed (with pay having done better at lower percentiles, as shown in Cribb and O’Brien (2024), and with higher-paid occupations falling down the pay distribution, as shown above), there is also evidence of within-occupation compression in pay too, though not in all the public sector occupations. The fall in inequality for doctors is most clear, as has been highlighted by Zaranko (2022). As shown in Table 4.1, in 2007–09, a high-paid doctor (at the 90th percentile) was paid double (103% more than) the average doctor. By 2021–23, they were paid 82% more, with falls in inequality also in the lower half of the doctor pay distribution (i.e. the pay of low-paid doctors moved closer to that of the average-paid doctor).
Table 4.1. Percentage difference in hourly pay, within public sector occupations: 90th percentile compared with 50th percentile, and 50th percentile compared with 10th percentile
| Premium of: | |
| High-paid relative to | Average-paid relative to |
Doctors |
|
|
2007–09 | 103% | 98% |
2021–23 | 82% | 77% |
Teachers |
|
|
2007–09 | 47% | 57% |
2021–23 | 41% | 57% |
Police officers |
|
|
2007–09 | 27% | 37% |
2021–23 | 21% | 56% |
Nurses |
|
|
2007–09 | 34% | 41% |
2021–23 | 39% | 47% |
Public administration |
|
|
2007–09 | 87% | 57% |
2021–23 | 73% | 52% |
Note: See note to Figure 4.5.
Source: Authors’ calculations from the Annual Survey of Hours and Earnings (ASHE).
For teachers, the fall in inequality only came at the top of the distribution (fall in the premium of a high-paid teacher over the average). Public administration also saw falls in pay inequality, in both the upper half and lower half of the distribution. In contrast, for nurses there were small increases in pay inequality. And for police officers, as is discussed more in Section 4.3, the most striking finding is that pay inequality in the lower half of the pay distribution widened. In 2007–09, the median police officer was paid 37% more than a lower-paid police officer (at the 10th percentile). By 2021–23, that gap had risen substantially to 56%.6
Another key trend in the public sector is that its workers have long been much more likely to be women than men. In June 2024, the ONS workforce jobs data showed that over 70% of workers in health and education, industries that are mostly made up of public sector employees, were women, in comparison with the 49% they represent in the total UK workforce.7 Some parts of the public sector are markedly more male – for example, the police (at 70%) and HM Forces (at 88% in the UK Regular Forces).8 On top of this, Figure 4.6 shows how public sector pay has evolved by sex over time. Women have fared better: whilst mean real pay fell by around 4% for men between 2007 and 2019, it rose by the same amount for women. Since then, real pay fell 8% for men, compared with much smaller reductions for women. This may be related to the fact that lower pay grades have received more generous pay awards over time and women are less likely to hold senior roles than men in the public sector (as well as in the private sector).
Figure 4.6. Change in mean real public sector pay for men and women compared with April 2007
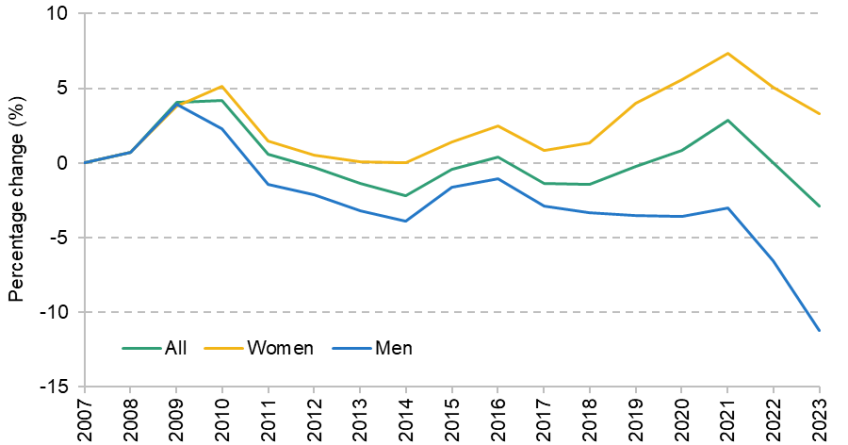
Note: All series are deflated using monthly CPIH and then compared with April 2007.
Source: Reproduced from Cribb and O’Brien (2024).
4.3 Pay pressures in different public sector occupations
While the data presented in the previous section summarise recent trends in public sector employment and pay, they are backward-looking and do not directly take into account the difficulties public sector employers face at the present time in recruiting, retaining and motivating the right set of staff and in providing high-quality public services more generally.
The independent Pay Review Bodies review a huge amount of evidence in preparing their reports for the government and in forming their recommendations on changes in pay. There is a risk that the wealth of information contained in these reports is underutilised in the debate, in part because they are often between 100 and 200 pages long. In this section, we therefore examine different public sector occupations, based on the information available in the Pay Review Body reports, supplemented with our own analysis.9
In addition to considering average pay (as in the previous section), this allows us to examine variation in pay trends, changes in working conditions, the quality of public service delivery, and recruitment and retention problems to help make an informed judgement on the potential future upward pressure on public spending due to public sector pay.
Table 4.2 summarises the main pay recommendations from the Pay Review Bodies (PRBs) for the most recent round (covering 2024–25) and the previous round (covering 2023–24). Across all of them, two clear patterns arise. The first is that recommendations for 2024–25 are generally smaller percentage increases in cash-terms pay than those for 2023–24. This likely reflects the fact that inflation is now back to more normal levels, as well as some moderation of nominal pay growth in the private sector, two of the key external factors the PRBs consider for their recommendations. The second pattern is that for 2024–25 there was less emphasis on particularly increasing the lower bands/salaries for each group. While the 2023–24 PRBs’ recommendations in general implied pay compression by boosting the lower end, in the 2024–25 recommendations this was not as consistently evident.10
Table 4.2. Pay Review Bodies’ (2024–25 and 2023–24) recommendations, by group
Group | 2024–25 pay recommendations | 2023–24 pay recommendations | Number covered by PRB |
NHS (including doctors) | 6.00% for doctors | 6.00% for doctors | 1,344,866 FTE |
Teachers | 5.50% | 6.50% | 468,693 FTE |
Police | 4.75% | 7.00% | 236,588 FTE |
HM Forces | 6.00% | 5.00% + £1K | 183,230 |
Prison service | 5.00% | Varying rates by band between 5.00% and 7.00%, with higher rates for lower bands | 64,779 FTE |
‘Senior salaries’ |
|
|
|
Senior civil service | 5.00% | 5.50% | 6,300 FTE |
Senior health leaders | 5.00% | 5.00% | Around 3,000 |
Judiciary | 6.00% | 7.00% | Around 2,200 |
Chief police officers | 4.75% | N/Ab | 231 |
Senior officers in Armed Forces | 5.00% | 5.50% | 132 |
a The NHS Pay Review Body did not make recommendations in 2023–24 as the UK government had already agreed a 5% consolidated award for 2023–24.
b Chief police officers were not included in the Senior Salaries Review Body in the 2023–24 pay review.
Sources for workforce sizes: those covered by SSRB – https://assets.publishing.service.gov.uk/media/66a7a3c849b9c0597fdb066e/SSRB_Annual_Report_2024_Accessible.pdf; teachers – https://explore-education-statistics.service.gov.uk/find-statistics/school-workforce-in-england; NHS – https://digital.nhs.uk/data-and-information/publications/statistical/nhs-workforce-statistics/may-2024; police – https://www.gov.uk/government/statistics/police-workforce-england-and-wales-31-march-2024/police-workforce-england-and-wales-31-march-2024; Armed Forces – https://www.gov.uk/government/statistics/quarterly-service-personnel-statistics-2024/quarterly-service-personnel-statistics-1-april-2024; prison service – https://www.gov.uk/government/statistics/hm-prison-and-probation-service-workforce-quarterly-june-2024/hm-prison-and-probation-service-workforce-quarterly-june-2024.
National Health Service
NHS workers are covered by two PRBs: the NHS Pay Review Body and the Review Body on Doctors’ and Dentists’ Remuneration. The NHS is the largest part of the public sector; 35% of public sector workers (FTE) worked in the NHS (across the UK) in 2023, or 7% of all employees in the UK. Therefore, pay decisions in the NHS are the most consequential for public spending. Figure 4.7 shows the changes in real-terms pay for two of the most high-profile NHS occupations (using data from England): doctors and nurses. These data go up to March 2024 and so do not reflect the new government’s pay offer to junior doctors (now known as ‘resident doctors’) made this summer, which has recently been accepted by their trade union. The graph shows average (mean) pay for nurses was still down 6% compared with April 2010 in real terms, with average pay for doctors 13% lower than in April 2010. Growth in nurses’ and doctors’ pay has been much lower than private sector pay growth, particularly since 2015.
Figure 4.7. Changes in real mean earnings per worker since April 2010 for nurses and doctors in the English NHS, compared with the UK private sector
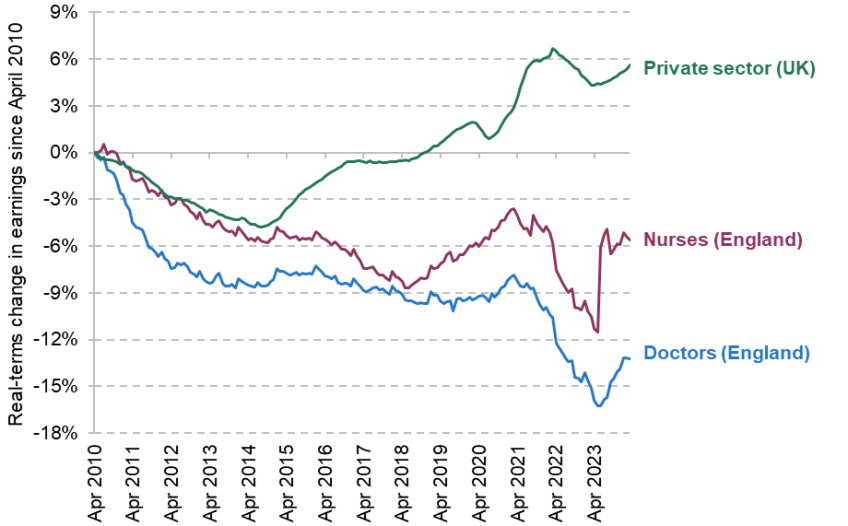
Note: The data are mean annual earnings per person (not per FTE) in NHS trusts and other core organisations in England over the past 12 months, obtained from NHS England data. All series are deflated using monthly CPIH and then compared with April 2010.
Source: Authors’ calculations using NHS England ‘NHS staff earnings estimates’ (table 2b) and ONS average seasonally adjusted weekly earnings by sector (table EARN01).
The NHS PRB report documents a set of recruitment and retention issues in the NHS (excluding doctors), though these issues are not as widespread as in some other areas of the public sector, documented later in this chapter. The vacancy rates for nurses and midwives, and for other NHS staff, were lower in 2023 than the year before, and indeed at similar levels to or slightly lower than before the COVID-19 pandemic, as shown in Figure 4.8. However, the report highlights the increasing dependence on international recruitment to fill NHS roles, a pattern which, at least in the judgement of the Pay Review Body, opens additional retention risks compared with filling roles locally. The report also criticises high agency staff use – which is one response to failing to fill roles – as being expensive and inefficient. While use of agency staff has fallen in England since 2015, it continues to rise dramatically in Wales and Northern Ireland.
Figure 4.8. NHS vacancy rates: nursing and midwifery and other NHS (‘Agenda for Change’) staff groups, England
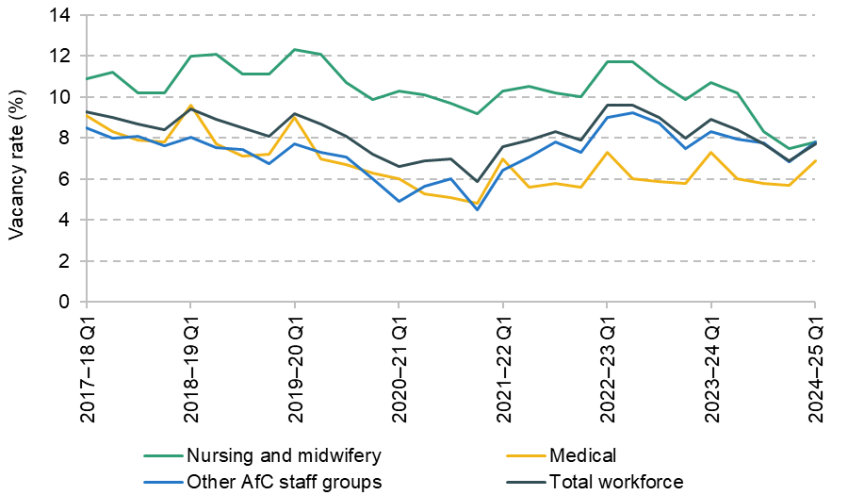
Source: Partially reproduces figure 3.6 of the 2024 NHS Pay Review Body document. Data for nursing and midwifery stem from NHS England, while the Office of Manpower Economics (OME) derives figures for ‘other AfC’ from what is left over after deducting nursing & midwifery and medical vacancies from the overall total.
The Review Body on Doctors’ and Dentists’ Remuneration (DDRB) generally finds that recruitment remains strong, though also with significant reliance on immigration: remarkably, half of those joining the medical register in 2022 had been trained abroad. Although medical schools remain oversubscribed, applications to them fell by 9.3% in 2023. Motivation and morale are found to be low, with staff surveys showing them to be lower than pre-pandemic. The report identifies both pay-related and non-pay-related factors that contributed to this, including poor quality of working life for doctors in training.
The PRBs recommended significant cash-terms increases in pay – of 6% for NHS doctors (plus an additional £1,000 for doctors in training) and 5.5% for other NHS staff. For NHS staff, the report does not specifically say that overall pay would need to rise faster than outside earnings in the future to prevent recruitment and retention issues. However, it does highlight structural pay issues reducing incentives to progress. Unless these are addressed by reducing pay growth for lower earners, addressing them would likely push up pay growth at higher bands in the future.
A key point for the future raised by DDRB related to the 'Long Term Workforce Plan’ (LTWP) which will require continued efforts to make medical and NHS careers attractive. The ageing population will place particular strain on the NHS compared with most other public services. In response, the LTWP aims to increase the number of staff in the NHS by between 800,000 and 900,000 from 2021–22 to 2036–37. Warner and Zaranko (2023) argued in last year’s Green Budget that, given the large increases in desired staffing, growth in NHS remuneration will likely at least need to keep pace with economy-wide average earnings growth and potentially exceed it. The need to expand recruitment to meet demand for healthcare services is therefore a key medium-term pressure facing the NHS and the government, in a way that is more acute than for most other public services, where demand growth is likely to be more moderate.11 We discuss the potential for this to push up the public sector pay bill as a whole in Section 3.5.
School teachers in England
The school workforce in England stands at just short of 1 million workers (FTE); of these, around half (470,000) are teachers. Figure 4.9 shows the real-terms change in teacher pay at different points of the pay scale, with M1 being the least experienced teachers while the most experienced teachers are on the upper scale (points U1 to U3). Many teachers will move up the pay range annually, with teachers at the middle of the pay scale typically having at least five years’ teaching experience.12
Figure 4.9. Real-terms changes in teacher core salary points since 2010
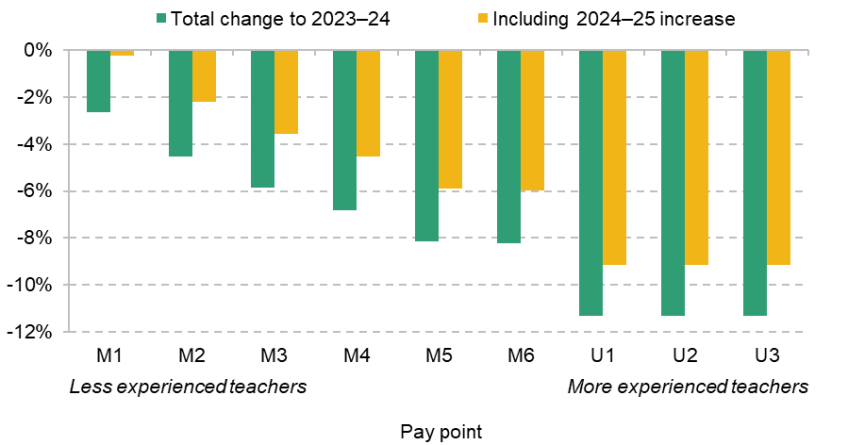
Source: CPIH from https://www.ons.gov.uk/datasets/cpih01/editions/time-series/versions/48 and OBR economic forecast for inflation (https://obr.uk/efo/economic-and-fiscal-outlook-march-2024/); teacher pay in 2010 from the school teachers’ pay and conditions document 2010 (https://dera.ioe.ac.uk/id/eprint/716/1/School%20Teachers%27%20Pay%20and%20Conditions%202010.pdf); teacher pay in 2023–24 from the school teachers’ pay and conditions document 2023 (https://assets.publishing.service.gov.uk/media/65eae75b5b652445f6f21aa4/School_teachers__pay_and_conditions_document_2023.pdf); teacher pay recommendation in 2024–25 from the STRB report 2024 (https://assets.publishing.service.gov.uk/media/66ab42d5ce1fd0da7b59313b/STRB_34th_Report_2024_Accessible.pdf). Updated from Farquharson et al. (2023).
Between 2010–11 and 2023–24, real-terms teacher pay fell by 11% for experienced teachers on the upper scale, though falls were much smaller for less experienced teachers (the M1 scale point saw a 3% real-terms fall). This reflects a choice to prioritise higher starting salaries over pay for teachers later in their careers and is consistent with the compression of the teacher pay distribution documented in Table 4.1 earlier. Given most teachers at any one time are on the upper scale, it is these falls at the top that have driven down the relative position of school teachers in the pay distribution.
The School Teachers’ Review Body (STRB) documents a series of difficulties in the teacher labour market which have plausibly been worsened by the fall in real, and relative, teacher pay. While some measures of recruitment and retention in the NHS are now better than pre-pandemic, that is not the case for teachers. The teacher vacancy rate was 0.6% in November 2023 – much lower than the reported vacancy rate for nursing staff, but twice the teacher vacancy rate pre-pandemic (0.3%).13
The number of individuals starting teacher training was 62% of the initial teacher training (ITT) recruitment target in 2023–24, considerably lower than the 90% average pre-pandemic (2015–19).14 The ITT is a Department for Education metric for judging how many people need to enter formal teacher training courses to maintain a sufficient supply of teachers. It takes account of the fact that there are other routes into teaching than graduate teacher training, such as teachers returning to the profession. The STRB describes the ITT as a ‘key indicator of the adequacy of the future supply to the teaching profession as well as a lead indicator of the attractiveness of the profession’. According to this metric, recruitment into teacher training has held up much worse in secondary schools than in primary schools. The government is also expected to miss its recruitment targets in a majority of secondary-level subjects for the 2024–25 school year, some by yawning margins (McLean, Worth and Smith, 2024).
The headline rates mask subject-specific teacher shortages. Figure 4.10 shows the percentage of the ITT met in 2019–20, the final year before the pandemic, and in 2023–24, the most recent full school year, for secondary education. Subjects are arranged by the percentage change between the two time points, with the subjects at the top seeing the smallest falls in recruitment relative to target. The worst subjects in terms of the percentage of the target met in 2023–24 are business studies and physics at only 16% and 17% of their ITT targets, respectively. Along with music, these same subjects have also seen the biggest changes (for the worse) since 2019. Training of teachers in many subjects is below 50% of target, including for modern foreign languages (MFL) and computing, and training rates in most subjects are currently at or near record low levels as a percentage of their targets. Some subjects, such as maths, chemistry, history and PE, have seen little change or indeed improvements in the number of people training in those subjects relative to the target.
Figure 4.10. Percentage of initial teacher training (ITT) target met in 2019–20 and 2023–24, by subject in secondary education
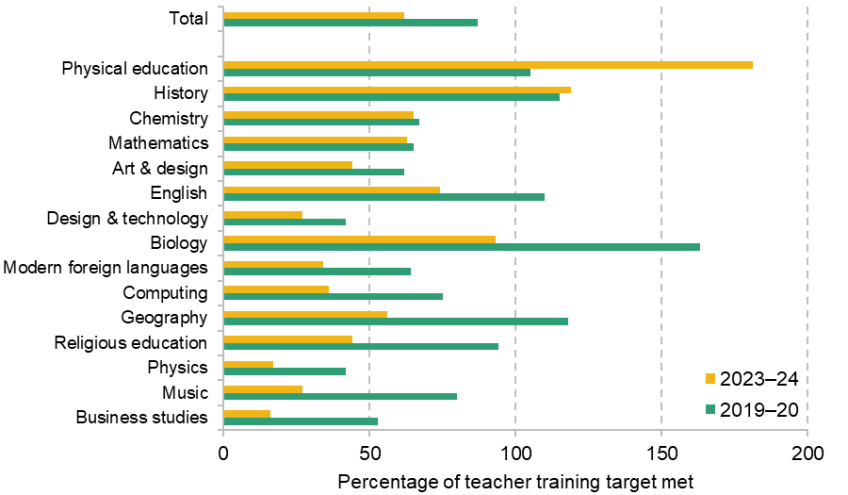
Source: Initial Teacher Training Census (https://explore-education-statistics.service.gov.uk/find-statistics/initial-teacher-training-census/2023-24). The chart is similar to analysis in figure 1 in chapter 3 of the STRB report.
The current retention rate among secondary school teachers, though worse than during the COVID-19 pandemic, is roughly the same as was seen between 2013–14 and 2019–20, with just above 8% of teachers aged under 55 leaving their roles in a given school year (although many of these will move to roles in other state-funded schools). This is comparable to the proportion of private sector employees who are recorded as changing their employer in Understanding Society data from 2021–22. In physics, MFL and computing, teachers have also left the profession at persistently higher rates than for secondary school teachers as a whole. As detailed in the STRB report, shortages in these subjects are leading to a higher proportion of teaching hours being delivered by non-specialists, particularly in disadvantaged schools, which is likely to impact negatively on the quality of education pupils are receiving.
An important question that the STRB leaves largely untouched is that of teacher quality. It is nevertheless important and, crucially, is linked to teacher remuneration. Research shows that effective teachers are the most important input into pupil attainment but that observed characteristics are often poor predictors of good teachers.15 It is hard to know who exactly it is that leaves teaching – the would-be top-performing teachers or lower performers – but it seems likely that it is those with the most attractive alternative options. In many cases, these will be the teachers that schools least want to lose.
Faced with these problems, the STRB recommended that teacher pay at each level of the pay scale should rise by 5.5%. The government has accepted the recommendation and pledged to fund fully the increased costs for schools, which it puts at £1.2 billion when including pay rises for support staff.16 The effect on pay scales is shown in the yellow bars in Figure 4.9 above. Adopting the recommendations in full is still likely to leave the real pay of experienced teachers 9% below 2010 levels and the real pay of new teachers about the same as in 2010. This pay award roughly matches the recent growth rate of private sector wages (as shown earlier in the chapter and recognised in the STRB report). It is therefore unlikely to ameliorate the decline of teachers’ position in the pay distribution, and classroom teacher pay remains relatively low compared with jobs that require similar skills and experience against which the STRB benchmarks these employees.17
The STRB report suggests two key challenges for the future. The first, explicitly set out in the report, is the extent to which the government, and/or schools, need to make teaching particular secondary school subjects a more attractive prospect. It may take some targeted additional spending – on pay or through other means – to address this.18
The second challenge is not set out explicitly by the STRB but is a natural conclusion from the evidence presented and the recommendations made. The report sets out a pattern of deteriorating relative pay and worsening recruitment. But the recommendation of a 5.5% award will at best keep teacher pay from falling further behind the private sector. This is not a criticism of the Review Body, which also has to take into account the budgetary position of schools. But it suggests that the current uplift to pay scales is unlikely to improve materially the current recruitment difficulties, and the government may need to find above-economy-wide pay deals for teachers in the future.19 Labour also pledged in its 2024 general election manifesto to hire an additional 6,500 teachers in ‘shortage subjects’ with the money raised from levying VAT on private school fees. Although this would only be a 1% increase in the number of teachers in England, it represents an additional pressure in subjects that are already struggling to hire. However, pupil numbers are expected to fall by around 180,000 – or 2.3% – by 2028,20 which could ease the pressure on recruitment slightly.
Police
As shown in Figure 4.4 earlier, the police workforce has been growing in the last five years, and Table 4.3 shows there are currently almost 150,000 officers in England and Wales (out of a total paid police workforce of 236,588 FTE at the end of March 202421). In 2019, the Home Office launched the ‘Police Uplift Programme’, aimed at recruiting more police officers. As a result, the number of recruits rose significantly. In 2022–23 alone, there were more than 16,000 new police officers in England and Wales, the highest yearly increase in the last 20 years. This represented an increase of 28% compared with 2021–22. Recruitment in 2024 fell (reflecting the end of the Uplift Programme), with around 9,500 police officers joining the force, a significant decrease on the previous year, although the number of police officers has still continued to rise slightly. Financial year 2023–24 also saw a significant increase in the number of officers leaving the police force, with one of the highest annual outflows since comparable records began in 2003.
Table 4.3. Number of police officers in England and Wales, stock and yearly flows
| Total, year-end | Inflow | Outflow |
2021–22 | 140,228 | 12,789 (9.1%) | 8,117 (6.0%) |
2022–23 | 147,434 | 16,328 (11.1%) | 9,192 (6.6%) |
2023–24 | 147,746 | 9,479 (6.4%) | 9,080 (6.2%) |
Source: Home Office, 2024.
In terms of pay, Figure 4.5 showed the large declines in relative pay of police officers compared with other occupations, and similar statistics are quoted by the Police Remuneration Review Body (PRRB) in its latest report. Moreover, they show that it is not just the average police officer who has seen falls in relative pay. For example, as shown in Figure 4.11, pay point 0 of the constable pay scale has fallen from the 34th percentile of overall earnings in 2014 to the 26th percentile in 2023. A similar pattern (but with a smaller decrease and at a different level) is observed for the top of the constable pay scale. The relative positions of those at higher ranks (inspectors and superintendents) have been more stable. This differential drop across the pay scale, alongside changes in the composition of the force, largely explain the sharp fall in police pay reflected in Figure 4.5.
Figure 4.11. Police pay scale positions in the distribution of earnings, England and Wales
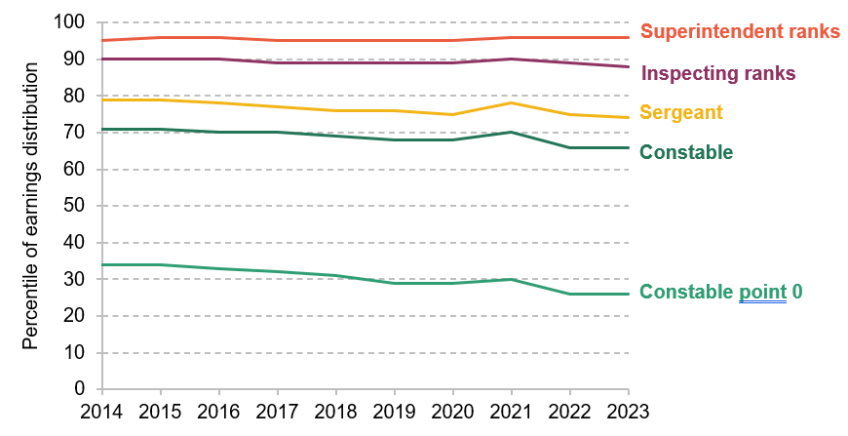
Note: Constable point 0 is the bottom of the constable pay ladder.
Source: Reproduced from chart E.5 of Police Remuneration Review Body (2024), based on OME analysis of police pay scales and the Annual Survey of Hours and Earnings.
These divergent trends over the past decade have resulted in a less concentrated pay distribution within the police service. As shown in Table 4.1 earlier, in 2007–09, an average-paid police officer (at the 50th percentile) was paid 37% more than a low-paid police officer (at the 10th percentile). By 2021–23, they were paid 56% more. The comparison between high-paid and average-paid officers shows relative stability (changing from a 27% gap to a 21% gap). This is very different from other public sector occupations, such as doctors or teachers (discussed earlier), which have seen larger pay compression, with in particular lower earners gaining on average earners. As a consequence, the PRRB reports that some newer officers were struggling financially with the heightened cost of living. It seems that deteriorating conditions for police officers are affecting the very bottom of the pay scale.
How do these trends in pay relate to recruitment, retention and public service quality? At first glance, police officer numbers have been successfully increased despite the restrictions on pay. Having said that, the PRRB points out that to maintain a larger police force, increased recruitment will need to be maintained, and there have been particular issues in recruiting for the Metropolitan Police Service (which makes up a quarter of all police officers in England and Wales). The Met expected to be around 1,400 officers short of its target for total number of officers in March 2024. Surveys point to lower levels of morale than in previous years, and although pay is not the only determinant of this, the PRRB states that it is concerned that falling pay (relative to comparator groups) will ‘unless addressed … impede policing’s ability to retain a workforce with the skills and capabilities it requires’.
In this context, the PRRB 2024 report recommended annual pay increases of 4.75% for all officers up to and including the rank of chief superintendent. It also suggested that police forces should have the discretion to appoint new constables at higher pay points than usual, particularly in London; and that a set of allowances be increased, notably increasing paid annual leave entitlements, especially for new recruits (from 22 to 25 days, a 1% drop in the working year). While providing an overall uplift to pay scales that is fairly similar both to private sector wage growth and to pay awards in other public sector occupations, these recommendations also target areas where the PRRB has particular concerns: attracting new recruits, especially in London.
What about the future? It is notable that the PRRB sees the need for wholesale reform to police pay. The 2011 Winsor Review22 was the last large review of police pay and conditions. The final report outlined recommendations on faster progression to higher pay and stronger links between pay and skills and between pay and performance. The PRRB indicates that too little has changed since (especially considering the current challenges in retention), and recommends that a new Comprehensive Review of police remuneration should be undertaken before next year’s (multi-year) Spending Review. It calls for this to examine ‘pay and the mechanics of the coherence of pay scales, allowances, rewarding performance, and the mechanism for progression’. While such a review might result in a rebalancing of pay scales in a way that is almost cost-neutral, it could lead to pressure to reverse, at least in part, some of the relative decline in average police pay seen over recent years.
Prison service
The prison estate in England and Wales has come under significant pressure in the last year, particularly as the prison population has grown faster than operational capacity and there is essentially no room for this to continue.23 At the end of July 2024, the prison population was 87,479, while useable operational capacity was 88,862. In the face of deteriorating operating conditions (e.g. overcrowding and increasing rates of violence24), several measures have been taken to alleviate pressure on prisons. Among these, the government recently implemented ‘Operation Early Dawn’, a scheme which means that offenders will be summoned to a magistrates’ court only when it is confirmed that a cell in the prison estate is ready for them, should they be remanded into custody.25
At only 64,779 employees (FTE, out of which 30,265 FTE are operational prison service staff), the fiscal consequences of pressure on public sector pay in the prison service are minimal, especially in comparison with the NHS. But the current strain on the prison service means it is worth briefly considering its pay, and challenges, as they are quite different from those in other parts of the public sector. While prison officer salaries are fairly low in the pay distribution compared with other public sector occupations, the gap between the starting band for prison officers and overall median pay has narrowed26, therefore improving their relative position (see Figure 4.12).27
Figure 4.12. Prison service pay scale positions (minimum) in the distribution of earnings, England and Wales
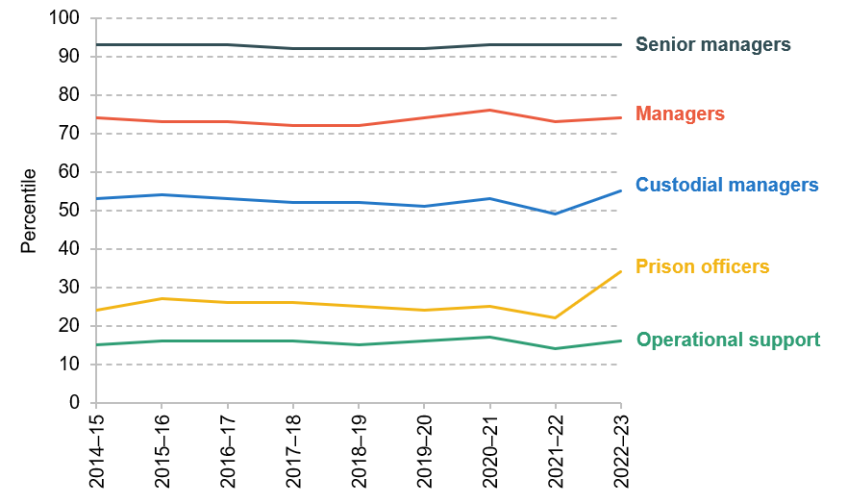
Source: Reproduced from figure 3.9 of Prison Service Pay Review Body (2024), based on OME analysis of pay scales and the Annual Survey of Hours and Earnings.
The prison service still faces challenges with recruitment and particularly retention. Similar to the analysis for police officers, there are high turnover rates among prison staff. The overall departure rate in December 2023 was 13%, with the main reason for leaving across all grades in Prison Service establishments being resignation. The inability to work flexibly is one of the top five reasons why staff leave the service, and leavers with less than one year’s service accounted for the largest number of leavers in 2023. These descriptive statistics suggest that turnover is high and that the prison service is struggling to retain new recruits. Working conditions are also important, with the prevalence of violence and other unpleasant working conditions playing a crucial role. As well as improving welfare, reducing levels of violence could lead to direct savings in terms of compensation costs for staff and prisoners and related sickness absence costs, and improve recruitment. This could allow the Prison and Probation Service to redirect spending to other important areas, such as rehabilitation programmes.
The PRB recommended that from 1 April 2024, most pay bands be increased by 5%, which was accepted in full by the government. The PRB also recommended increases in allowances for specific operations and tasks, as well as a reduction in the length of time taken to progress between the higher bands. It estimates that implementing such recommendations would add approximately £72 million to the total pay bill, an amount that pales into insignificance compared with other parts of the public sector. There is therefore scope for the government to be flexible in order to attract and retain experienced staff in prisons without being too concerned about the impact of these pay decisions on overall public spending.
‘Senior salaries’
The pay of a relatively small number of senior public servants is reviewed by the Senior Salaries Review Body (SSRB). Its remit covers the senior civil service (SCS), senior officers in the Armed Forces, the judiciary, senior NHS managers and chief police officers. Table 4.2 earlier outlined the pay awards recommended by the SSRB, all of which have been accepted in full by the government. The SSRB covers a broad set of groups. The thing they have in common is that they are senior members of the public sector – but in many ways they look radically different. This is true in the case of the challenges they face. Though not problem-free, recruitment and retention in the senior Armed Forces and for senior police officers are comparatively easy. In contrast, while the judiciary faces almost no issue retaining staff, it is experiencing severe recruitment shortfalls. Among senior NHS leaders, staff turnover is high.
One group facing both recruitment and retention issues is the biggest of the SSRB’s groups – the SCS, i.e. civil servants who are at Deputy Director (band 1) level or above. Figure 4.13 shows how median SCS pay at the three SCS pay bands has changed over time. Between 2013 and 2023, the nominal value at band 1 rose by around £11,500 (16%), but after adjusting for inflation the value fell by 12%. The percentage losses in real-terms pay are greater for the more senior roles – Directors are 14% worse off than in 2013, whilst those at Director General level are 16% worse off in real terms.
Figure 4.13. Real-terms pay compared with 2013 for median senior civil service salaries
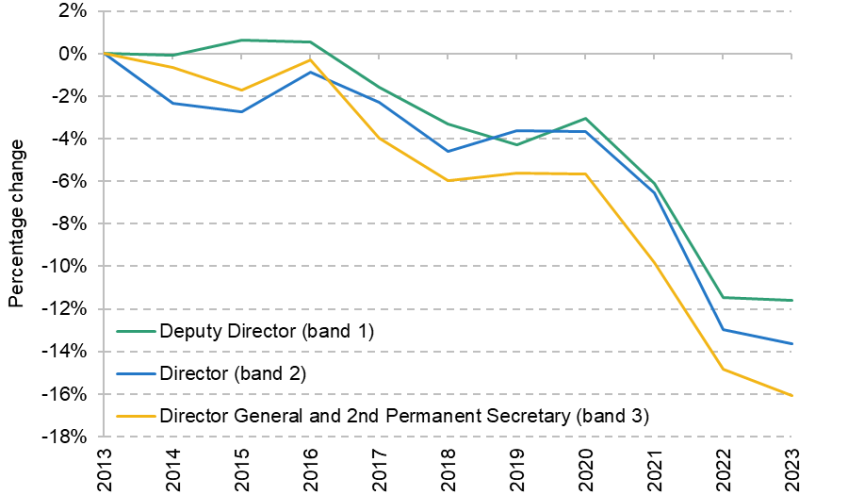
Source: Cabinet Office. The data were provided by the SSRB on request. Pay at constant prices was calculated using CPIH for each year.
As is the case with teachers, the SSRB judges that members of the SCS are paid less than for comparable roles in the private sector. The SCS is characterised by a huge degree of churn – in 2022–23, around 25% of senior civil servants changed jobs or left the senior civil service. In the case of the former, changes between departments (which account for over a quarter of the 25%) are often driven by a lack of pay progression in role. Among those leavers who took part in exit interviews, just over two-thirds (68%) cited pay as a significant factor in their resignation.28
The SSRB also highlights the quality of job applicants to the SCS as a concern. Over time, the proportion of posts unfilled after a hiring process and the share of processes that have only one appointable candidate have been rising while the share of candidates considered good or outstanding has been falling – at 54% in 2022–23 (the most recent year of data) compared with 68% in 2018–19. Similarly, as Figure 4.14 shows, the quality of those who leave is often high – at 72%, the share of losses in 2022–23 that were graded as ‘regrettable’ (being graded as a high performer or having particularly high potential) is at its highest since the SSRB has reported it.
Figure 4.14. Share of exits from the senior civil service that are graded as ‘regrettable’
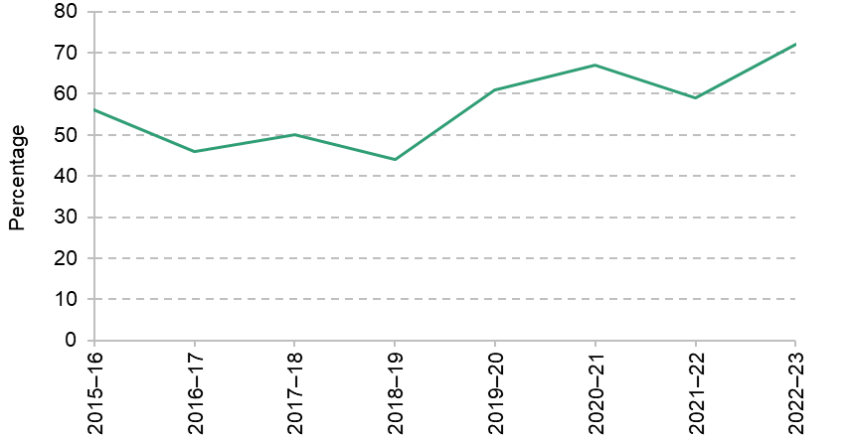
Note: Exits are classed as ‘regrettable’ if the staff member is assessed as being a high performer or having particularly high potential.
Source: Cabinet Office data based on exit interviews, reported in SSRB reports.
The judiciary is the other group where there is clear cause for concern. As already mentioned, the judiciary does not have a problem with retention, but this is for a reason peculiar to the profession – a convention that judges cannot return to private practice – though this is linked to the recruitment issues that the judiciary faces. It may be more of a risk to join the judiciary, especially if pay is relatively low, given that this means (effectively permanently) giving up a lucrative option outside the judiciary.
England and Wales do not have a career judiciary; individuals practise privately or work as academics before joining the salaried judiciary. This means that the pool of recruits is more diffuse and there is a less distinct pipeline into the profession than for the other SSRB groups. In recent hiring rounds for District Judges (who deal with most cases in county courts), fewer than half of vacancies were filled – a severe shortfall. The recruitment of Circuit and High Court Judges has also faced challenges, with posts remaining vacant in recent years, though in the most recent hiring round all vacancies were filled. These challenges appear to be related to applicant quality as there are enough applicants to fill the roles. Increasing the number of judges is part of the plan to reduce court backlogs (National Audit Office, 2024), which recruitment challenges make more difficult.
Pay stands at around £126,500 for a District Judge, £157,700 for a Circuit Judge and £212,400 for a High Court Judge. Although high compared with the workforce as a whole, it is possible that pay needs to rise further to attract applicants of the right quality, both in applications to become judges in the short term and in the broader pipeline in the longer term. This is reflected in the SSRB’s recommendation for judiciary pay being among the highest of all public sector groups in both the 2023–24 and the 2024–25 pay review cycles (see Table 4.2 earlier).
It remains to be seen whether pay increases can combat the problems evident across different groups of senior public servants. The SSRB recommends additional measures, such as a rationalisation of the SCS pay structure.29 Given the small number of people employed in ‘senior salaries’ positions, the direct exchequer cost of increasing pay, or other parts of remuneration, to ameliorate recruitment or retention problems would be small. But if increasing pay for the SCS, for example, is seen to necessitate (politically) increases in pay that are as large as, or larger than, those for less well-paid civil servants, then the cost to the exchequer would rise substantially.
HM Forces
Set against a background of increasing international tensions, the picture presented in the Armed Forces Pay Review Body (AFPRB) report is concerning. There are recruitment and retention challenges across the three services (Army, Air Force and Royal Navy / Royal Marines), accompanied by broad-based dissatisfaction with pay.
Across the three services, outflows exceeded the number of new entrants, which has fallen to its lowest level since 2019, meaning that the Forces saw a net reduction of around 5,500 personnel over 2023. Some of this was planned30. But the number of people choosing to leave the services before the end of their agreed contract period has grown above its pre-pandemic level. All three services experienced similar voluntary exits of between 6% and 7% through 2023.
Remuneration is a key part of the picture. Figure 4.15 shows the percentage change in real-terms pay since 2016 (when the current pay scales were introduced) for the pay band minima for a selection of Armed Forces pay levels. These correspond to the bottom and roughly halfway up the ‘Other Ranks’ pay scale (equivalent to privates and sergeants in the Army) and to the bottom and roughly halfway up the ‘Officer’ pay scale (equivalent to second lieutenants and majors in the Army).31
Figure 4.15. Real-terms pay compared with 2016 for a selection of Armed Forces ranks
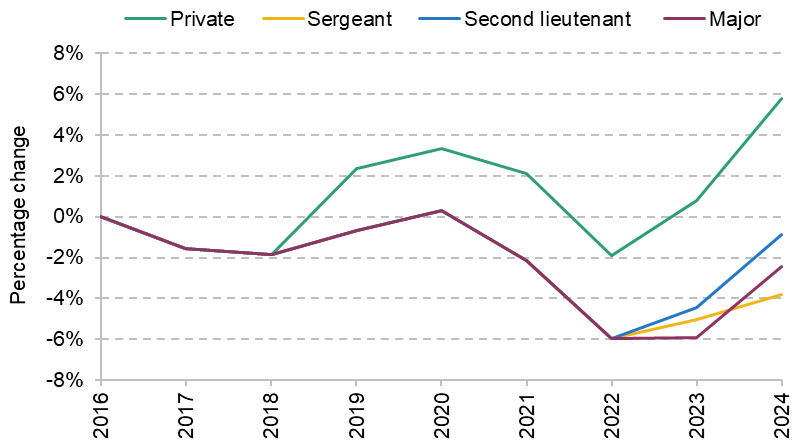
Source: AFPRB reports 2016–24. For Other Ranks, the tables relating to ‘Supplement 1’.
What is clear is that the pay of less-experienced Other Ranks has fared better than that of more senior roles. By 2024, privates have seen their pay increase by around 6% in real terms. For the others, pay evolved similarly until 2022, when it diverged. Ultimately, those in the middle of the Other Ranks pay scale (sergeants on the graph) have fared worse, with earnings 3.8% lower in real terms than in 2016. Second lieutenants and majors have lost 0.9% and 2.4% respectively. These falls are less than those for experienced teachers and senior civil servants.
The AFPRB also compares salaries with the earnings distribution in the population and with other public sector roles. Officer pay has slipped relative to the overall earnings distribution, but starting salaries, at £31,305 in 2023, still compare favourably with other public sector professions – higher than Fast Stream civil servants but lower than doctors. Other Ranks, who make up the majority of the Armed Forces, have also seen their pay diminish over time and they do have starting salaries that are lower than in other public sector occupations. This may be related to the age, education and experience profile of entrants, however, and the AFPRB notes that, according to the Institute of Student Employers recruitment survey, their starting salaries are higher than starting pay for the average school/college leaver.
Ahead of the 2024 pay increases, members of the Armed Forces were generally unhappy with their pay, though appeared happy with their job in general. In answer to questions relating to satisfaction with their pay and whether they think the pay is fair for the work they do, only around 40% of officers and 30% of Other Ranks answered positively. These proportions have been falling and are at their lowest since 2019. Other measures of morale are less negative and more stable – a little over half of Other Ranks, and two-thirds of officers, said that they are satisfied with their job.
Given these results, and the fact that last year’s pay increase, though historically high in nominal terms, still represented a real-terms cut, there is a case for meaningful increases in Armed Forces pay. The AFPRB has recommended a 6% increase at all pay scales for 2024–25, and for new entrants to start at the first point on the pay scale rather than facing a reduced rate of pay for the first six months that they are in training (as is the case currently). The government has accepted these recommendations, which the AFPRB estimates will cost £788 million. They are in contrast to previous years, when pay increased more quickly lower down the pay scale. The 6% increase is above the average for public sector pay recommendations this year, though it remains to be seen whether it is enough to disrupt the broader trends evidenced in the AFPRB’s report.
4.4 Issues across the public sector workforce
In addition to the occupation-specific issues that we have highlighted in the previous section, the evidence gathered by the Pay Review Bodies points to a number of cross-cutting issues in public sector remuneration which affect many or all of the different public sector workforces. We briefly examine two of these issues here, focusing first on geographical differences in pay (or the lack of them) across the public sector and then on some of the issues regarding public service pensions.
Geographical differences in pay
Overall, public sector employment accounted for 17.9% of total employment in the United Kingdom in June 2024. However, public sector employment as a share of total employment varied markedly across the country (Office for National Statistics, 2024b). Public sector employment is above average in Northern England, Wales, Scotland and Northern Ireland and below average in Southern England. Moreover, these are not small differences. While for Northern Ireland, 26.4% of those employed are working for the public sector, in the South East, this value drops to 15.1%.
Public sector pay scales are set nationally, and generally have higher levels of pay in London than in the rest of the country due to ‘London weighting’. Average teacher pay, for example, varies little across regions outside the capital despite headteachers having large degrees of autonomy over the pay and progression rate of their staff (Fullard, 2021).
The lack of variation in public sector pay across regions means that public sector employment is more or less attractive depending on how well paid private sector roles are in any given area. Figure 4.16 shows the hourly public sector pay differential, controlling for workers’ characteristics, such as their age and education. In 2021–23, hourly public sector pay is lower than private sector pay in London, the South East and East of England and the two are very similar in most of the other English regions. Meanwhile, there is a pay premium to working in the public sector in the North East of England and the other UK nations. This contrasts to the period before the 2008 financial crisis, when there was a substantial pay premium to working in the public sector in most of the English regions. Scotland is the only part of the UK where the pay differential is essentially unchanged compared with 2005–07, whilst in London and the South East the public sector pay penalty has grown over time.
Figure 4.16. Public sector pay differential conditional on workers’ characteristics, by UK region and nation
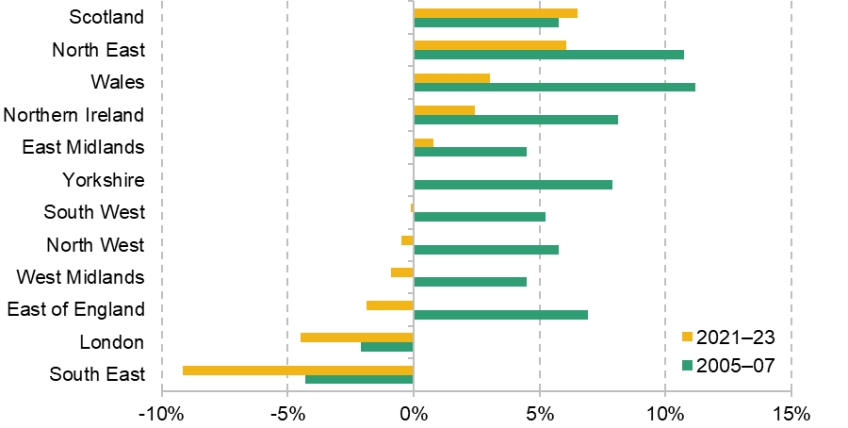
Note: The differential is calculated controlling for age, education, experience and region, all interacted with sex, and interactions between education and experience. Figures are for hourly pay and exclude pension contributions.
Source: Authors’ calculations using the Labour Force Survey.
These features have consequences for staffing, which are highlighted in a number of the PRB reports. In the case of the NHS, there are various concerns about staff relocation due to pay incentives: that staff largely move to places where pay is higher (such as Scotland) and/or that they do not move to areas that are not covered by London weighting. However, with the police and prison services, the biggest recruitment shortfalls are in London, where salaries do not appear to be sufficient to attract or keep staff. Similar features are present for the judiciary, where the PRBs indicate big shortfalls in London and the South East.
These factors are important, as they might have important impacts on the adequacy of regional public service provision. The uncompetitive nature of public sector pay in some areas of the country, and apparent premium relative to private sector employees in other parts of the country, are not new and neither are the issues they create, but to date there has been apparently little appetite to reform public sector pay to more closely reflect the different labour market conditions in different parts of the country. There will be a case for tilting future public sector pay awards towards those areas where pay is lower relative to the private sector, at least in cases where relatively lower-paying areas have greater recruitment and retention challenges than relatively higher-paying areas.
Public service pensions
A substantial part of public sector workers’ remuneration comes in the form of accrual to a defined benefit pension plan as these schemes have substantial employer pension contributions. Often, to be a member of these arrangements (with the notable exception of the Armed Forces), individuals have to make a significant employee contribution themselves. Table 4.4 shows the official employer and employee contribution rates, the latter often increasing as earnings rise. There are differences across schemes, with employer contribution rates especially high for the police and HM Forces, which also have lower normal pension ages – i.e. members are able to take a full, unreduced, pension from a younger age than their state pension age.
Table 4.4. Employer and employee contributions to public service pension schemes, as a percentage of pensionable pay
Employer | Employee | |
NHS | 23.7% | £0–£13,259: 5.2% |
Teachers | 28.68% | £0–£34,289: 7.4% |
Civil service (includes prison service) | 28.97% | £0–£34,199: 4.6% |
Police | 35.3% | £0–£27,000: 12.44% |
HM Forces | 43.8% | 0% |
Minimum automatic enrolment contributions | 3% of qualifying earnings | 5% of qualifying earnings |
Note: Contribution rates are for post-2015 pension schemes. The exact bands (and to a lesser extent contribution rates) for employee contributions have changed over time.
Source: NHS – https://www.nhsemployers.org/publications/nhs-pension-scheme-member-contributions-202425; teachers – https://www.teacherspensions.co.uk/employers/managing-members/contributions/calculating-contributions.aspx; civil service – https://www.civilservicepensionscheme.org.uk/your-pension/managing-your-pension/contribution-rates/; police – https://www.legislation.gov.uk/uksi/2024/920/pdfs/uksiem_20240920_en_001.pdf and https://policepensioninfo.co.uk/wp-content/uploads/2024/01/NPCC-Member-Remedy-Factsheet-Contributions-adjustments.pdf; HM Forces – https://assets.publishing.service.gov.uk/media/659d2bd0d1a5e60012f1eec8/AFPS_2020_Valuation_Valuation_Results.pdf.
These contributions are far higher than the minimum default pension contributions that apply under the automatic enrolment (AE) regulations, as shown in Figure 4.17. Under AE, employees have minimum default pension contributions of 8% of qualifying earnings (i.e. earnings between £6,240 and £50,270), of which at least 3% must come from their employer. So an average earner on £35,000 could, by default, receive an employer pension contribution that was worth just 2½% of their total salary. The pension contributions from public sector employers are also higher than those often seen for even high-earning private sector employees (who on average make and receive the highest contributions). On average, the highest-earning fifth of private sector employees saving in a workplace pension scheme have an employee contribution of 5% of their salary and receive an employer contribution worth 8% of their salary (Cribb et al., 2023).
Figure 4.17. Employer and employee contributions, as a percentage of earnings for average earner (£35,000)
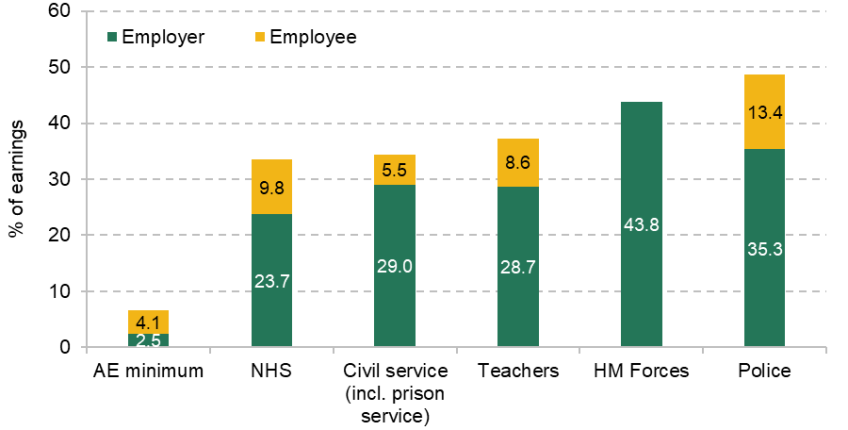
Note: Contribution rates are for post-2015 pension schemes. The exact pensionable pay bands (and to a lesser extent contribution rates) for employee contributions have changed over time.
Source: See source to Table 4.4.
Despite the very high value of employer pension contributions, some of the Pay Review Bodies report difficulties caused by these pension schemes on account of the significant employee contributions that are required. For example, 15% of band 5 staff – the starting band for nurses – and 20% of doctors in core training choose to opt out of the NHS pension, and therefore miss out on the significant employer pension contribution that they would have received. The Police Remuneration Review Body highlights the financial difficulties that many, particularly in the Metropolitan Police, would face in making the large employee contributions needed to participate in the scheme, with 10% now opting out. Opting out of the pension scheme is particularly common for staff from overseas and for lower-paid employees in general: ONS data show that among public sector employees earning £10,000 to £16,000 per year, 13% were not a member of their employer’s pension arrangement in a given year, compared with only 6% for those earning over £31,000.32
In response to these challenges, some have suggested that there be more flexibility in public pension contributions. Indeed, in a previous Green Budget, Boileau, O’Brien and Zaranko (2022) suggested a reduction in required employee contributions in the public sector alongside a reduction in the overall generosity of the pension (thereby reducing the required employer contribution). This would boost the take-home pay of those who are members, and would be expected to lead to greater numbers choosing to remain in the arrangement. While it would mean the resulting pensions would be lower, they could still be left considerably more generous than what the vast majority of the private sector workforce receives. A theme across the Pay Review Body reports is of enthusiasm for people to have greater flexibility in their participation in pension schemes (in the NHS, doctors’, teachers’ and police), and NHS Employers reportedly support introducing greater flexibility in the way individuals contribute too. Moreover, there remain questions about whether the very high pension accrual (as reflected by the employer contribution rates) is the appropriate way to structure remuneration in order to encourage recruitment, retention and motivation of staff, particularly given the difficulties identified in recruiting in some parts of the public sector.
4.5 Conclusion
The new government has decided to accept in full the pay recommendations of the independent Pay Review Bodies. Public sector pay awards averaging around 5.5% in 2024–25, similar to the current rates of private sector pay growth and above the forecast growth in whole-economy earnings for 2024–2533, mean that most public sector workers are unlikely to see their pay fall compared with their private sector counterparts this year.
And yet challenges for the public sector workforce remain, with the potential for upward pressure on public sector pay in future years in some services and consequences for public spending in those areas. This is in part due to long-running changes in public sector pay which have cut the real value of some public sector workers’ pay and eroded their relative position in the pay distribution. This has especially affected higher-paid occupations: doctors, teachers and police officers (and ‘senior salaried’ employees) compared with nurses and junior civil servants.
This chapter has undertaken new analysis and drawn on a wide array of evidence provided in the Pay Review Body reports to examine the potential future pressure on public sector pay coming from different parts of the public sector.
The NHS workforce is the most consequential part (35%) of the public sector workforce. Despite falls in doctors’ pay, other NHS workers have seen more favourable trends, and recruitment and retention have held up, albeit with increasing dependence on staff from abroad filling roles. With the pay disputes with doctors resolved, the key challenge facing NHS pay and workforce is training, recruiting and retaining more staff to increase the size of the NHS as the population ages and demands more healthcare, in line with the Long Term Workforce Plan. As Warner and Zaranko (2023) warned in last year’s Green Budget, this could necessitate NHS pay growth in excess of economy-wide pay growth.
School teachers make up another important part of the public sector workforce. There the immediate trends are much more concerning than in the NHS, with recruitment rates relative to target running very low, and well below pre-pandemic levels. Recruitment into traditionally shortage subjects has fallen even further, but the latest data show this is now a much more widespread problem than pre-pandemic. With pay for experienced teachers having fallen by 9% in real terms from 2010 to 2024 (and pay for new teachers having regained its 2010 real level), this surely raises the question as to whether pay rises in future should now be targeted towards more experienced teachers. The opposite problem is faced by the police: pay at the lowest levels has been suppressed relative to higher-paid officers, and action is already being taken to target higher pay at starting salaries, perhaps helped by this targeting of pay awards to lower earners being politically easier to deliver.
One area where targeting larger rises towards higher earners is almost certainly justifiable is in the senior civil service, as well as in the judiciary, both of which are experiencing significant problems due to pay. Given the very small number of people involved, even substantial pay rises for these groups would be rounding errors compared with the public sector pay bill as a whole. Pay rises for these groups may therefore not need a financial solution, but perhaps a political one. They would necessitate a government being willing to pay some people more who are well paid when compared with the wider population, but not when compared with what many of them could earn elsewhere.
Where does this leave us? The appropriate path for public sector pay in coming years is likely to be driven in large part by nominal private sector earnings growth, and how it differs across the distribution. If private sector pay growth remains elevated for a number of years, public sector wages will need to grow faster than if private sector pay growth is slower. However, the key challenge for the public finances is not so much how much growth there is in private sector earnings. If private sector earnings growth is high, that is likely to mean strong growth in tax revenues, which allows the government to increase public service spending and increase public sector pay.
Our reading of the evidence is that there is good reason to believe that there will be pressure in coming years to deliver public sector pay increases that, on average, outstrip private sector wage growth. That is for two reasons. First, as with experienced teachers and less experienced police officers, public sector wage growth has been consistently held down to the extent that it is causing real difficulties recruiting the right number, and type, of public sector workers. And second, the largest public service, the NHS, will need to continue to expand to provide healthcare to a larger, older population, and that expansion is likely to necessitate pay growth in excess of the economy-wide average in coming years.
Table 4.5 provides a quantification on the potential scale of this pressure over the period from this year (2024–25) to 2028–29. It shows how spending on the pay bill might evolve under different assumptions about public sector pay growth. For simplicity of the illustration, we first assume no increases in public sector employment. The first row of the table shows how the government pay bill would rise if public sector pay grows in line with forecast average earnings – this would push spending on the pay bill up by 2% in total, or £6 billion per year by 2028–29. If instead public sector pay grew on average 0.5 percentage points faster than average earnings per year, that would imply a 4% rise in the pay bill (£11 billion per year). And if public sector pay grew 1 percentage point faster than average earnings, that would imply additional spending of £17 billion per year.
Table 4.5. Increases in public spending on the pay bill, 2024–25 to 2028–29, given different assumptions on public sector pay
| % terms | Per year by 2028–29 (2024–25 prices) |
Public pay grows in line with average earnings | 2.0% | £6 billion |
Public pay grows 0.5ppt per year faster than average earnings | 4.0% | £11 billion |
Public pay grows 1ppt per year faster than average earnings | 6.1% | £17 billion |
|
|
|
Public sector employment increases by 1% by 2028–29 | 1.0% | £3 billion |
Note: Costings of additional pay assume no growth in the public sector workforce. Nominal values are deflated in line with forecast growth in the GDP deflator and average earnings growth is assumed to follow OBR forecasts from March 2024. Costing of increase in public sector employment assumes no growth in real earnings.
Source: Authors’ calculations using the OBR Economic and Fiscal Outlook March 2024.
Of course, the cost to the government of the public sector pay bill could increase in other ways, most obviously through increasing the size of the workforce. For illustrative purposes, Table 4.5 shows the case of increasing the public sector workforce by 1%, which costs around £3 billion per year assuming no real growth in pay. Any real pay growth, of course, would mean the cost of employing more public sector workers would rise too.
While this is not a recommendation for the path of public sector pay, we note that average private sector pay is now 4.7% higher than public sector pay (as shown in Figure 4.1), having been the same as average public sector pay in early 2019. Therefore public sector pay growing by 1 percentage point per year faster than private sector pay over the next four years would approximately close that gap by 2028–29. The £17 billion per year (in 2028–29) estimate therefore illustrates the potential cost of doing so.
It is worth noting that the potential for additional public sector pay increases could eat into the extra resources provided for public services that would be provided by higher real-terms spending. For example, if day-to-day public service spending were to grow at 1% per year in real terms over the next four years, in line with plans from the previous government, that would lead to additional spending of £22 billion per year by 2028–29. Half of this (£11 billion) would be taken up on the additional pay of current public sector workers if public sector pay rose 0.5 percentage points faster than average earnings, leaving only half for additional employment of workers or other day-to-day spending.
This all examines the potential pressure placed on spending by public sector pay. Of course, politicians do have choice on how to set public sector pay and they may resist that pressure. Particularly in the short term, they may be able to suppress pay with only limited effects. Squeezing pay is one way of cutting public expenditure, if that is desired, though it is generally a way that makes it harder to choose which of your staff you keep and which you lose to more attractive opportunities elsewhere. But given the emphasis in the Labour Party’s 2024 general election manifesto on public service improvement, in many parts of the public sector it may well be difficult to deliver that without some increase in public sector employment and some significant rises in public sector pay, at the very least targeted at those occupations struggling most with recruitment and retention issues.
Appendix 4A
Table 4A.1. Position (percentile) of median pay of major public sector occupations in the overall hourly pay distribution, including employer pension contributions
|
| Position (percentile) of median pay for each occupation in the overall hourly pay distribution | |
|
| Pay | Pay plus employer pension contribution |
Doctors | 2010 | 96 | 96 |
2019 | 92 | 92 | |
2021 | 91 | 90 | |
Nurses | 2010 | 72 | 73 |
2019 | 71 | 71 | |
2021 | 71 | 70 | |
Teachers | 2010 | 86 | 87 |
2019 | 82 | 84 | |
2021 | 82 | 85 | |
Police | 2010 | 77 | 82 |
2019 | 74 | 81 | |
2021 | 74 | 80 | |
Public administration | 2010 | 61 | 65 |
2019 | 62 | 67 | |
2021 | 57 | 63 | |
Note: Employer pension contribution is added on to pay for all those who participate in a workplace pension scheme.
Source: Authors’ calculations from the Annual Survey of Hours and Earnings (ASHE).
References
Armed Forces’ Pay Review Body, 2024. Fifty-third report 2024. https://www.gov.uk/government/publications/armed-forces-pay-review-body-fifty-third-report-2024.
Blundell, R., Cribb, J., Wernham, T. and Xu, X., 2023. Inequality in the United Kingdom: 1968–2021. IFS Deaton Review, Country Studies Report, https://ifs.org.uk/inequality/country-studies-uk/.
Bileau, B., Johnson, P., Sturrock, D., Tahir, I., Warner, M. and Zaranko, B., 2024. IFS response to Rachel Reeves’ spending audit. Institute for Fiscal Studies, Comment, https://ifs.org.uk/articles/ifs-response-rachel-reeves-spending-audit.
Boileau, B., O’Brien, L. and Zaranko, B., 2022. Public spending, pay and pensions: Green Budget 2022 – Chapter 4. Institute for Fiscal Studies, https://ifs.org.uk/publications/public-spending-pay-and-pensions.
Cribb, J., Emmerson, C., Johnson, P., Karjalainen, H. and O’Brien, L., 2023. Challenges for the UK pension system: the case for a pensions review. Pensions Review report, Institute for Fiscal Studies, https://ifs.org.uk/publications/challenges-uk-pension-system-case-pensions-review
Cribb, J., Emmerson, C. and Sibieta, L., 2014. Public sector pay in the UK. Institute for Fiscal Studies, Report 97, https://ifs.org.uk/publications/public-sector-pay-uk.
Cribb, J. and O’Brien, L., 2024. Recent trends in public sector pay. Institute for Fiscal Studies, Report 305, https://ifs.org.uk/publications/recent-trends-public-sector-pay.
Farquharson, C., Phelan, D., Sibieta, L. and Tahir, I., 2023. Teacher recruitment, training and retention: submission to the Education Select Committee. Institute for Fiscal Studies, https://ifs.org.uk/publications/teacher-recruitment-training-and-retention-submission-education-select-committee.
Fullard, J., 2021. Teacher pay policy: one size fits all? Education Policy Institute, https://epi.org.uk/publications-and-research/teacher-pay-policy-blog/.
HM Treasury, 2024. Fixing the foundations: public spending audit 2024–25. https://www.gov.uk/government/publications/fixing-the-foundations-public-spending-audit-2024-25.
Home Office, 2024. Police workforce statistics, England and Wales: 31 March 2024. https://www.gov.uk/government/statistics/police-workforce-england-and-wales-31-march-2024.
House of Commons Library, 2014. Prisons: the role of the private sector. https://commonslibrary.parliament.uk/research-briefings/sn06811/.
Incomes Data Research (2019). Prison pay comparability study. https://www.gov.uk/government/publications/prison-pay-comparability-study.
Institute for Government, 2022. Public sector pay and employment. https://www.instituteforgovernment.org.uk/explainer/public-sector-pay-and-employment.
Labour Party, 2024. Change: Labour Party manifesto 2024. https://labour.org.uk/wp-content/uploads/2024/06/Labour-Party-manifesto-2024.pdf.
McLean, D., Worth, J. and Smith, A., 2024. Teacher labour market in England: Annual Report 2024. National Foundation for Educational Research, https://www.nfer.ac.uk/media/hqdglvra/teacher_labour_market_in_england_annual_report_2024.pdf#page=11.
Ministry of Defence, 2024. UK Armed Forces biannual diversity statistics: April 2024. https://www.gov.uk/government/statistics/uk-armed-forces-biannual-diversity-statistics-april-2024/uk-armed-forces-biannual-diversity-statistics-april-2024.
National Audit Office, 2024. Reducing the backlog in the Crown Court. https://www.nao.org.uk/reports/reducing-the-backlog-in-the-crown-court/#downloads.
NHS Pay Review Body, 2024. Thirty-seventh report: 2024. https://www.gov.uk/government/publications/nhs-pay-review-body-thirty-seventh-report-2024.
Office for National Statistics, 2019. Who works in the public sector? https://www.ons.gov.uk/economy/governmentpublicsectorandtaxes/publicspending/articles/whoworksinthepublicsector/2019-06-04.
Office for National Statistics, 2024a. Labour disputes; working days lost due to strike action; public sector. https://www.ons.gov.uk/employmentandlabourmarket/peopleinwork/employmentandemployeetypes/timeseries/f8xz/lms.
Office for National Statistics, 2024b. Public sector employment. https://www.ons.gov.uk/employmentandlabourmarket/peopleinwork/publicsectorpersonnel/datasets/publicsectoremploymentreferencetable.
Police Remuneration Review Body, 2024. Tenth report: England and Wales 2024. https://www.gov.uk/government/publications/police-remuneration-review-body-report-2024-england-and-wales.
Prison Service Pay Review Body, 2024. Twenty-third report on England and Wales 2024. https://www.gov.uk/government/publications/psprb-twenty-third-report-on-england-and-wales-2024.
Review Body on Doctors’ and Dentists’ Remuneration, 2024. Fifty-second report: 2024. https://www.gov.uk/government/publications/review-body-on-doctors-and-dentists-remuneration-52nd-report-2024.
School Teachers’ Review Body, 2024. Thirty-fourth report: 2024. https://www.gov.uk/government/publications/school-teachers-review-body-34th-report-2024.
Senior Salaries Review Body, 2024. Forty-sixth annual report on senior salaries. https://www.gov.uk/government/publications/senior-salaries-review-body-report-2024.
Warner, M. and Zaranko, B., 2023. Implications of the NHS workforce plan: Green Budget 2023 – Chapter 8. Institute for Fiscal Studies, https://ifs.org.uk/publications/implications-nhs-workforce-plan.
Zaranko, B., 2022. Pay compression in the NHS (and beyond). Institute for Fiscal Studies, Comment. https://ifs.org.uk/articles/pay-compression-nhs-and-beyond.
Data
Office for National Statistics. (2024). Annual Survey of Hours and Earnings, 1997-2023: Secure Access. [data collection]. 25th Edition. UK Data Service. SN: 6689, DOI: http://doi.org/10.5255/UKDA-SN-6689-24.
Office for National Statistics. (2024). Labour Force Survey. [data series]. 11th Release. UK Data Service. SN: 2000026, DOI: http://doi.org/10.5255/UKDA-Series-2000026
Endnotes
Authors

Jonathan Cribb
Jonathan joined IFS in 2011. His research areas includes: pensions, ageing and demographic change, public sector pay, housing, and inequalities.

Magdalena Domínguez
Magdalena is a Senior Research Economist at the IFS. Her research focuses on issues related to the economics of crime, networks & place-based policies

More from IFS
Understand this issue


Policy analysis


Academic research


