
Downloads
Download report PDF
PDF | 491.87 KB
Key findings
1. Average pay in the public and private sectors has performed very differently since the election in 2019. Real public sector earnings initially grew substantially during the pandemic (whereas private sector earnings fell as many were furloughed). But the ensuing rise in inflation hit public sector pay much harder due to government pay restraint. Overall, between December 2019 and November 2023, inflation-adjusted average private sector pay grew by 2.3%, whereas public sector pay fell by 0.3%.
2. These recent trends come on top of poor earnings performance in both sectors since 2007. Real public sector pay at the end of 2023 was still 1% lower than its level at the beginning of 2007. Real private sector pay increased by 4% from 2007 to 2023.
3. Within the public sector, some high-profile professions (nurses, and particularly teachers and hospital doctors) have seen considerably worse pay growth than the average public sector worker. Indeed,teachers saw large reductions in average real pay from 2010 to 2019 (falling 13%) but have seen stronger pay growth since then (with pay 5% higher in September 2023 than in April 2019 after accounting for the pay deals agreed last summer). Overall, this still leaves average teachers’ pay in September 2023 9% lower than in 2010.
4. Looking at trends in the English NHS, nurses saw a significant reduction in real pay over the 2010s (falling 7% between 2010 and 2019) and only a modest recovery since, with average nurse pay growing by a little less than 1% over the same 2019–23 period. Doctors also saw pay cuts between 2010 and 2019 (of around 10%) but, unlike teachers and nurses, have also seen their pay fall further in the period since 2019, making them the hardest-hit group of the three.
5. Doctors and teachers, as higher-paid public sector workers, have felt the consequences of compression of public sector pay, with pay deals consistently benefiting lower-paid workers more than higher-paid workers both within and across professions. Compared with 2007, the real earnings of a public sector worker at the 75th percentile (i.e. earning more than 75% of public sector workers) had fallen by 8% by 2023, whereas for a lower-paid worker at the 25th percentile, real earnings had risen by 16%.
1. Introduction
With the large spike in inflation that has occurred since late 2021 and the associated cost-of-living crisis, there has understandably been intense interest in how workers’ earnings have kept up (or not) with rising prices. This short report examines one aspect of earnings growth: how public sector earnings have performed in recent years, particularly focusing on the period since the 2019 election. We also examine earnings growth for major public sector occupations, how these trends differ from those seen in the private sector and how recent trends compare with the earlier period of public sector pay restraint that started in 2010.
Public sector pay is important not only for the living standards of the 5.7 million people who work for central or local government, but also for the delivery of public services and for the public finances. Total government spending on remuneration of public sector workers amounted to over £240 billion, or almost 10% of GDP, in 2022, with £178 billion paid in wages and salaries and a further £63 billion from employer National Insurance and pension contributions.1 As Figure 1 shows, following significant falls in the size of the public sector workforce between the end of 2009 and 2017, the number of people employed by government has increased significantly in recent years – rising by 460,000 (8.7%) since the time of the last election. This increase occurred both during the pandemic and more recently, with the headcount rising by 140,000 (2.4%) during 2023 alone. Figures from the Office for National Statistics (2024a) show that by far the biggest increase in headcount since the 2019 election was in the NHS, where it rose by 280,000, but there were also rises of 130,000 in public administration and almost 30,000 in the police.
In recent years, the government has generally sought to hold down real-terms pay in the public sector, offering pay awards below the rate of inflation, in large part due to broader pressures on the public finances. Industrial action in protest against this meant that large numbers of working days were lost to strike action in 2023, particularly in the health and education sectors (Cominetti, Hamdan and Slaughter, 2023). However, with public sector pay deals for many (but not all) occupations now agreed, strike action has declined dramatically compared with early and mid 2023, as is shown in Figure 2.
In this report, we use a range of data sources to examine trends in public and private sector earnings; indeed, we use what we judge to be the highest-quality comparable measure of pay available for the groups we are looking at. Specifically, we use the government’s statistics on average weekly earnings to look at the public and private sectors as a whole in Great Britain, which provides us with data up to November 2023. We supplement this with data from NHS England (based on NHS payroll records) to examine pay trends of doctors and nurses in England.2 And we use data from the Annual Survey of Hours and Earnings both to document trends in public sector pay for men and women in the UK and to examine UK teachers’ and educational assistants’ earnings, with an additional projection since April 2023 to allow for the nominal pay rises agreed in Summer 2023 of 6.5% for teachers and 8% for educational assistants. For reasons of comparability across groups, we generally focus on mean earnings of employees;3 however, we do show how the overall distribution of public sector pay has become more compressed over time by examining changes in public sector pay at different points in the distribution.
It should be noted that changes in all these measures of earnings will be affected by changes in how many hours people in different sectors work on average, meaning that they reflect changes in total (pre-tax) pay (rather than how pay has changed only for people working full-time). In addition, averages of pay within sectors and even within occupations will reflect compositional change in the type of people working in the sector. If a sector starts to employ more lower-paid (e.g. less-experienced) staff, that would push down average earnings. We note in this report where there is evidence of that occurring. We do not consider employer pension contributions, which are an important part of remuneration, particularly in the public sector; nor do we consider employee pension contributions, which will affect workers’ take-home pay. See Boileau, O’Brien and Zaranko (2022) for detailed analysis accounting for many of these issues.
2. What has happened to average public and private sector pay?
Figure 3 shows how mean earnings per employee (in real terms, expressed in 2023 prices) in the public and private sectors have evolved over the last 23 years and Table 1 shows growth in each over selected subperiods. Together they show the recent history of public and private sector pay. After relatively strong pay growth in both sectors during the first half of the 2000s, in 2007 there was a small gap in pay between the sectors, with mean annual earnings about 2% higher in the public sector.4 As the financial crisis hit, public sector pay performed better than private sector pay (growing by 1.4% from 2007 to 2010, compared with a fall of 0.7% in the private sector). From 2010 to 2015, real mean pay in both sectors fell by similar amounts (close to 3%) but it was post 2015 that the real differences emerged, with a recovery in private sector pay (which increased by 5.1% from 2015 to 2019) that was not matched in the public sector. Therefore, by the end of 2019, at the point of the last election, average private and public sector pay were nearly identical at just over £33,000 per year (in 2023 prices).
The trends in public and private sector pay since the 2019 election have been dominated by the pandemic and the subsequent cost-of-living crisis. During the pandemic, public sector pay briefly rose rapidly and then fell back, while private sector pay fell then rose, as many were furloughed and then brought back to work. But the sharp subsequent increase in inflation affected the public sector much more than the private sector, largely due to the freezing of public sector pay in cash terms in 2021–22 for all except those working in the NHS and those earning under £24,000. Average real pay in the public sector fell by almost £2,000 between early 2022 and Spring 2023 (6%), double the size of the fall (£900; 3%) in the private sector.
In 2023, inflation fell and higher-than-usual public sector pay deals were implemented. As a result, average public sector pay has bounced back, but by November 2023 only to £33,000, almost exactly the same (0.3% lower) as at the end of 2019. On the other hand, private sector pay was 2.3% higher in late 2023 than it was in 2019, growth which of course is still dismal by pre-2008 historical standards, when it would have not been that unusual to see 2.3% growth in a single year rather than over a four-year period.
And taking the long view, real public sector pay at the end of 2023 was still 1% lower than its level at the beginning of 2007, almost 17 years earlier. Real private sector pay was only 4% higher over the same period. If both had grown at the same rate over this period as between January 2001 and January 2007 (2.6% per year for the public sector and 2.2% for the private sector), then public sector pay would have been around 56% higher at the end of 2023, while private sector pay would have been around 40% higher. If public sector pay had instead grown at 2.2% per year (private pay growth between 2001 and 2007), it would have still been 47% higher by late 2023.
3. Pay compression in the public sector
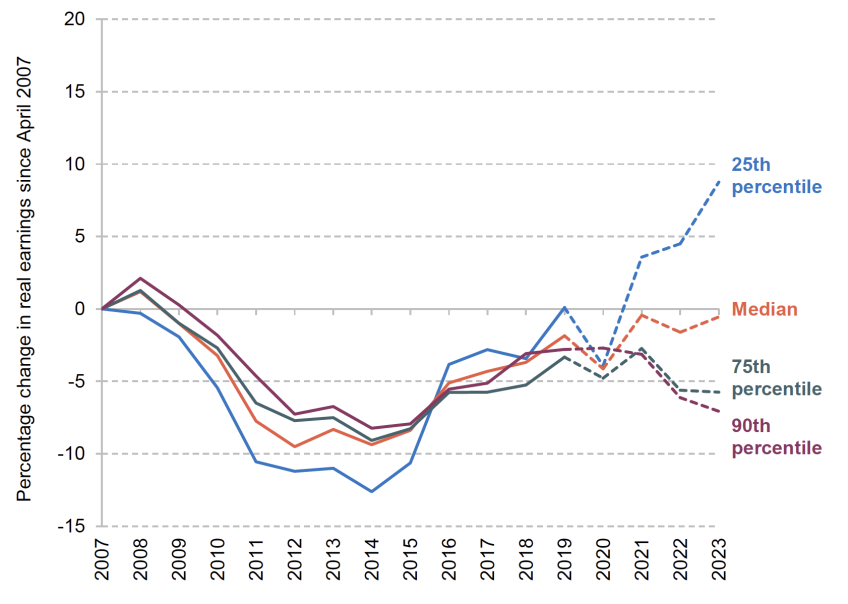
Figure 4 goes beyond looking at how average public sector pay has changed over time by plotting the change in public sector pay at different points of the distribution since 2007. In real terms, public sector pay has increased significantly at the bottom of the distribution, while pay at the top of the distribution has fallen. The 25th percentile of public sector earnings increased by 16% in real terms between April 2007 and April 2023. In contrast, the 75th and 90th percentiles of public sector pay fell by 8% and 10% in real terms, respectively.
These trends have been particularly stark since 2019. Between April 2019 and April 2023, public sector pay increased by 6% in real terms at the 25th percentile, whereas it fell by 5–6% at the 75th and 90th percentiles. These figures imply that the distribution of public sector earnings has become more compressed over time. Indeed, a measure of this compression – the ratio of pay at the 75th percentile to that at the 25th percentile (‘the 75:25 ratio’) – has fallen over time from 2.4 in 2007, to 2.2 in 2019 and further to 1.9 in 2023. While changes in the composition of the public sector workforce may be partly contributing to this, another important factor is that public sector pay deals have generally favoured lower-paid workers over higher-paid colleagues since at least 2010 (Cribb, Emmerson and Sibieta, 2014; Zaranko, 2022; Sibieta, 2023).
Due to the compression of the distribution and the fact that men tend to earn more than women on average, average pay for men in the public sector has performed much worse than average pay for women in the public sector. Figure 5 shows that mean real public sector pay fell by 4% for men, compared with a 4% increase for women, between 2007 and 2019. The fall in pay for men was even larger in the 2019–23 period, with an 8% fall; in comparison, pay for women fell by under 1% from 2019 to 2023.
In Figure A1 in the appendix, we replicate Figure 4 but for the private sector. A caveat to this figure is that different data sources have shown different trends in pay for the private sector over this period. Private sector pay fell much more sharply in the first half of the 2010s in the Annual Survey of Hours and Earnings (ASHE) than in the Average Weekly Earnings (AWE) dataset, whereas trends in the public sector have been consistent across sources. In addition, there have been concerns about low response rates (which tend to affect the private sector) in ASHE since the pandemic, which is why we have represented the post-pandemic period with dotted lines. Accepting these caveats, there does not seem to be evidence in the private sector of the broad pay compression there has been in the public sector. Pay growth did appear to be particularly strong at the 25th percentile between 2014 and 2017, consistent with the impact of the minimum wage pushing up pay for lower earners especially during this period. However, between 2007 and 2019, the overall change in pay looks broadly similar at the 25th, 50th (median) and 75th percentiles of the distribution for private sector pay, in contrast to the results for public sector pay.
4. Looking in more detail at public sector occupations
Figure 6 shows how pay has changed for some major (and high-profile) public sector occupations: nurses, doctors, teachers and educational assistants compared with the public and private sectors as a whole.5 For comparability (particularly due to discontinuities in NHS England data), we focus on the period since 2010. Table 2 subsequently shows the total earnings growth for these groups over the 2010–19 and 2019–23 periods. Table A1 in the appendix shows the real level of pay for each of these occupations in 2010, 2019 and 2023.
Figure 6 shows that pay for most of these high-profile public sector occupations has fallen by more since 2010 than the average for public sector wages. The one exception is educational assistants, a relatively lower-paid occupation, whose average pay grew significantly faster than even average pay in the private sector. That pay growth for teachers, doctors and nurses lagged behind the public sector average is not necessarily surprising due to the pay compression in the public sector documented in the previous section, as these are among the better-paid public sector occupations. The reductions in pay for teachers in the 2010s were particularly large and slightly larger than implied by pay scales, reflecting the fact that the teacher workforce has become slightly less experienced (and therefore less well paid) over time.6 This has happened in other occupations too; for example, there have been significant expansions in the number of doctors over time, leading to increases in the share of doctors who are younger and therefore less well paid (General Medical Council, 2023).
Table 2 more clearly splits out the change in pay since the last election and over the 2010–19 period. This highlights how recent falls in doctors’ pay have been particularly large, with pay falling by 6% in real terms between 2019 and 2023, compared with no change for the public sector as a whole. In part, this reflects weaker pay growth than experienced by nurses, teachers or the public sector as a whole for the 2019–21 period (when doctors’ pay was broadly flat while pay was growing elsewhere in the public sector). But it also reflects that doctors’ pay fell considerably between 2021 and 2023, and increases to pay in line with Pay Review Body recommendations only occurred in September 2023, at the very end of our data period.7
In comparison, pay for other high-profile public sector occupations fared rather better over the 2019–23 period. Recent pay rises now mean that nurses’ average pay broadly looks to have kept pace with inflation since 2019 (despite large falls in 2022), while teachers’ pay increased by more than 5% between 2019 and 2023 after large falls between 2010 and 2019. Pay for educational assistants performed particularly well, increasing by more than 16% over this whole period following the pay deal reached in Summer 2023.
5. Concluding remarks
Although recent pay settlements in the public sector have put an end to much of the strike action that characterised the first half of 2023, the issue of public sector pay has not disappeared. Industrial action over pay continues for doctors, for example, although at the time of writing a new pay offer to consultants has been made. Indeed, even after the pay settlements agreed last summer, average pay in the public sector is still around 2% lower than in January 2010 and similar to its level in 2007. And this figure for the public sector as a whole masks quite large differences across the distribution and between public sector occupations, with higher-paid workers such as teachers and (especially) doctors having done less well than the average. In comparison, average pay in the private sector has increased by about 5% since 2010.
The government needs to pay enough to recruit, retain and motivate the right number and mix of staff to provide the public services it desires. In the longer run, suppressing public sector wage growth compared with private sector wages will make it harder to do this. And indeed, the government’s NHS workforce plan implies major increases in training places (recruitment) and is predicated on improvements in retention (Warner and Zaranko, 2023). However, given the precarious position of the public finances, and the cuts to unprotected departmental spending budgets implied by current plans (Emmerson, Mikloš and Stockon, 2024), continuing to hold down public sector pay may be one way that the next government tries to hold down departmental spending. Secretaries of State are unsurprisingly asking Pay Review Bodies to take public services’ budgets into account when setting pay.8
If higher public sector pay awards are agreed and come with additional funding from the Treasury, that would naturally mean higher taxes, higher borrowing or lower spending elsewhere. However, if higher-than-budgeted-for public sector pay deals do not come with additional funding, then public services would have to reduce how many people they employ or find money for the higher pay from elsewhere. One recent example of the latter is NHS budgets being diverted from spending on capital or technology towards day-to-day expenditure, to help meet the costs of higher-than-expected pay awards.9 While it could be that this is the best available option in the short term, it could undermine longer-term efforts to promote efficiency and productivity. As Boileau, O’Brien and Zaranko (2022) argue, it would be better if departmental budget settlements could be reopened if pay (or other costs) were considerably higher than the assumptions made when setting budgets.
Figure A1. Changes in real earnings per worker since April 2007 for private sector employees, by percentile of the private sector earnings distribution
Note: Data measured in April of each year. All series are deflated using monthly CPIH and then compared with April 2007. The Office for National Statistics (ONS) produces figures for the 10th percentile which show larger growth in pay than at the 25th percentile, particularly recently; due to more uncertainty about the reliability of figures at the bottom of the distribution, we have not shown these. The dotted lines represent the post-pandemic period, when there have been concerns about low response rates.
Source: ONS dataset ‘Earnings and hours worked, public and private sector: ASHE Table 13’.
Table A1. Level of real mean earnings in April 2010, April 2019 and April 2023, by group
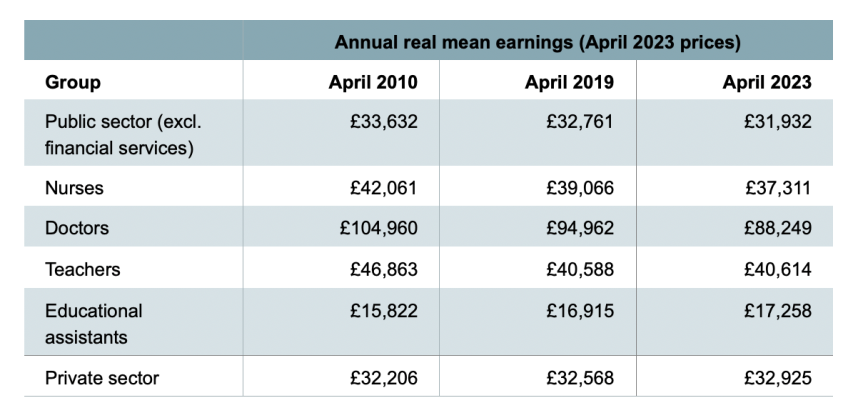
Note: Real earnings for teachers are the average of mean total weekly earnings for primary school and secondary school teachers in ASHE, weighted by the number of jobs of each occupation, in April of each year. Real earnings for educational assistants are mean total weekly earnings for the SOC00 occupation ‘educational assistants’ (code 6124) in April 2010, then the average of mean total weekly earnings for the SOC10 occupations ‘teaching assistants’ (6125) and ‘educational support assistants’ (6126) in April 2019 (weighted by the number of jobs in each occupation), and finally the similarly-weighted average of mean total weekly earnings for the SOC20 occupations ‘higher level teaching assistants’ (3231), ‘teaching assistants’ (6112) and ‘educational support assistants’ (6113) for April 2023. Real earnings for doctors and nurses are mean annual earnings per person in NHS trusts and other core organisations in England over the past 12 months, obtained from NHS England data. All series are deflated using monthly CPIH.
Source: ONS average non-seasonally-adjusted weekly earnings by sector (table EARN02); ONS average non-seasonally-adjusted weekly earnings by industry (table EARN03); NHS England, ‘NHS staff earnings estimates’ (table 2b); ASHE ONS earnings and hours worked, occupation by four-digit SOC (ASHE table 14).
Endnotes
Authors

Jonathan Cribb
Jonathan joined IFS in 2011. His research areas includes: pensions, ageing and demographic change, public sector pay, housing, and inequalities.

Laurence O'Brien
Laurence is in the Retirement, Savings and Ageing sector. His work focuses on people’s savings decisions and on economic activity in later life.
More from IFS
Understand this issue


Policy analysis


Academic research


