
Downloads
Download report PDF
PDF | 648.76 KB
Executive summary
Chancellor Jeremy Hunt will announce his second Budget, and fourth fiscal event, on Wednesday 6 March. This will possibly be the final fiscal event of the current parliament. With the big rise in tax revenues as a share of national income since 2019 only being partially offset by the cuts to National Insurance contributions that came into effect this January, Mr Hunt may be looking for opportunities to announce and implement further tax cuts. This report sets out how the fiscal outlook has changed since November. A key change is that the outlook for spending on debt interest has improved slightly. Despite this, the fact remains that public sector net debt will barely be on course to fall in five years’ time, and only on the basis of plans for fuel duties, business rates and, in particular, day-to-day spending on public services that are unlikely to be realised. There is therefore only a weak economic case for another sizeable net tax cut in the forthcoming Budget.
Key findings
1. Borrowing in 2023–24 is now on course to be £113 billion, which would be £11 billion below the £124 billion forecast by the Office for Budget Responsibility (OBR) in the November 2023 Autumn Statement. Lower-than-expected inflation since November has fed through into lower spending on the portion of government debt linked to the RPI, while tax revenues have so far come in lower than initially forecast. But if data for the remaining two months of the financial year follow the same pattern seen so far, at 4.1% of national income borrowing this year would still be more than twice the 2.0% of national income borrowed before the COVID-19 pandemic. A reduction in forecast borrowing would doubtless be welcomed by the Chancellor, but we should remember that as recently as March 2022 the OBR was forecasting borrowing in 2023–24 would, at £50 billion, be less than half what we now project.
2. To finance our elevated borrowing in the next few years, we are now asking the private sector to absorb historically high volumes of debt. High gilt issuance, exacerbated by the Bank of England’s quantitative tightening, is forecast to result in the biggest increase in private sector holdings on record of 7.9% of national income in 2024–25. Looking more broadly at the next five years, this is forecast to average 6.2% a year which is more than twice the 2.8% a year seen over the last 25 years.
3. We expect the OBR to reduce its medium-term debt interest spending forecast (for 2028–29) by £10 billion from £122 billion to £112 billion. The OBR takes market expectations for interest rates. These have fallen since it produced its November forecast, to below where they were a year ago, but they remain volatile. Even with this sizeable downward revision, spending on debt interest is forecast to persist around 2% of national income (or £55 billion in today’s terms) a year higher than what was forecast prior to the pandemic.
4. The medium-term outlook for revenues will hinge on the forecast for nominal growth in the economy. We do not expect a big revision to the outlook for real growth in the economy, but the forecast for economy-wide inflation could be revised. All else equal, it would only take a downwards revision in the cash size of the economy of less than 1% to eliminate all of the £10 billion improvement in borrowing coming from lower forecast spending on debt interest.
5. New long-term population projections driven mostly by higher expected net migration help increase the size of the economy but will make existing spending plans even more challenging in per-capita terms. Under the OBR’s November forecast, real-terms day-to-day spending on public services was set to grow by 0.9% a year on average from 2025–26 onwards. At the time, this translated into growth in per-capita spending of 0.5% a year. However, if we take the latest ONS population projections, the average annual growth in real-terms spending per capita falls to just 0.2% a year.
6. Whatever happens to the OBR’s estimates of the government’s ‘fiscal headroom’, the economic case for tax cuts before the next Spending Review is completed is weak. The public finances remain in a poor position: at the Autumn Statement, the Chancellor was only just on course to meet his commitment for debt to be falling as a share of national income in five years’ time. Despite this, debt was forecast to be persistently stuck above 90% of national income over the medium term. This is in sharp contrast to the not-so-distant March 2022 Budget, when official forecasts were for public sector debt in 2026–27 to be more than 13% of national income lower, and on a decisively downward path. Even if the outlook for borrowing did improve significantly, net tax cuts should not be implemented before the cuts implied by the current spending totals are allocated to individual departments.
7. Any new tax cuts announced in the Budget would only offset part of the record-breaking increase in tax revenues as a share of national income over this parliament. Even after the cuts to National Insurance in the Autumn Statement, official forecasts suggest that taxes in 2023–24 will be £66 billion higher than they would have been had their share of national income been held at its 2018–19 level. Tax revenue as a share of national income is forecast to continue rising so that in 2028–29 it will be equivalent to £104 billion bigger, in today’s terms, than it was in 2018–19. This increase is fuelled by freezes to thresholds in the personal direct tax system and the big increase in the main rate of corporation tax that was implemented in April 2023.
8. Continued freezes to rates of fuel duties would depress revenues. The Autumn Statement forecast assumed that the 5p cut to rates of fuel duties would be allowed to expire and that they would then increase each year in line with the RPI. Past behaviour suggests it is much more likely they will remain frozen at their current level in cash terms, which would reduce revenues in 2028–29 by £6 billion. Similarly, if business rate relief for retail, hospitality and leisure sectors – first introduced at 50% as a temporary measure during the pandemic and then increased to 75% and twice extended – continues then the cost of this tax cut, which was put at £2.4 billion in 2024–25, will persist.
9. The Autumn Statement forecasts were predicated on a fresh round of spending cuts. Public sector investment is planned to be frozen in cash terms, whereas maintaining investment (net of depreciation) at its current share of national income in 2028–29 would require an additional £20 billion of spending. While day-to-day spending on public services would rise in real terms by £17 billion overall, after accounting for plausible settlements for spending on the NHS, childcare, defence, schools and overseas aid, other areas of government would face real-terms cuts of £18 billion by 2028–29. This is equal to an average cut of 3.4% a year for four years or an average cut to per-person spending of 4.0% a year. It is possible that these spending plans will be delivered. But there is clear risk that whoever is in office after the next election is unwilling or unable to deliver them. Maintaining real-terms spending on unprotected services would require a cash top-up of £20 billion; maintaining it in per-capita terms would require a cash top-up of £25 billion.
10. Another risk to the credibility of the public finance forecasts is that a second fiscal event in 2024 occurs in the run-up to the general election if it looks as if the OBR’s fiscal forecasts will strengthen, but not if they appear likely to deteriorate. So far, Jeremy Hunt has tended to follow the pattern of Chancellors since 2010 in offsetting improvements but not deteriorations in the borrowing forecast, leading to a ratcheting effect over time. This pattern of fiscal choices means that the OBR’s ‘central’ forecast cannot really be thought of as central. It is exacerbated by frequent fiscal events that implement permanent policy changes in response to changes in ‘headroom’ that are small relative to the uncertainty inherent to any medium-term forecast.
11. Further tightening spending plans may appear to generate further ‘headroom’, but this would not be a transparent or credible strategy and the Chancellor should avoid this temptation. Specific and immediate tax cuts should not be ‘paid for’ by unspecified future spending cuts. Moving from 0.9% annual real increases in day-to-day spending to 0.75% (as the Chancellor is reportedly considering) would reduce planned spending in 2028–29 by £3 billion, but only by increasing the implied cuts to unprotected budgets by the same amount. Similar to this, the next fiscal event after the March Budget will see the forecasts extended to 2029–30. While this might – driven by tight spending plans being extended by a further year – be expected to reduce borrowing at the end of the forecast horizon by around £10 billion, the economic case for using this to finance tax cuts in advance of a detailed Spending Review would remain weak.
12. Tax cuts without tax reform would represent another missed opportunity. If the Chancellor is determined to cut taxes and wants to boost growth then better options exist than just cutting the rates of income tax, National Insurance contributions or inheritance tax. Stamp duties on purchases of properties and shares are particularly damaging taxes and should be towards the front of the queue for growth-friendly tax cuts. And tax reform that made our existing taxes less economically damaging could be easier to do in the context of a sizeable tax cut as it would help limit the extent to which some would lose out.
1. Introduction
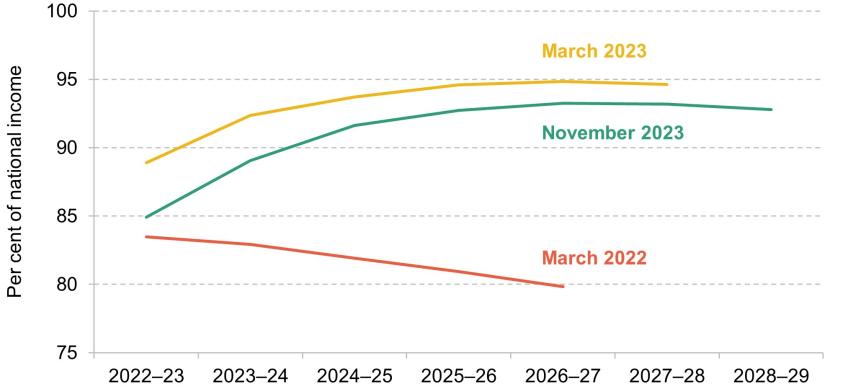
On Wednesday 6 March, the Chancellor will present his second Budget and fourth fiscal event. This will possibly be the final fiscal event of the current parliament, in which case how the forecasts change – and what policy decisions Mr Hunt announces in response – will form a key part of the backdrop to the coming general election campaign. Regardless of whether the forecasts improve or deteriorate, the public finances will remain in a weaker state than they were in two years ago, let alone relative to what was expected prior to the pandemic. Figure 1 shows that while the November 2023 Autumn Statement forecast for borrowing was for it to be lower in 2022–23 and 2023–24 than was forecast in March 2023, it was still running well above what was forecast in Rishi Sunak’s final Budget as Chancellor in March 2022, which took place before the subsequent cost-of-living crisis. Borrowing for 2026–27 is now forecast to be £68 billion, which is £37 billion more than the forecast for that year in the March 2022 Budget.
Figure 1. Public sector net borrowing forecasts
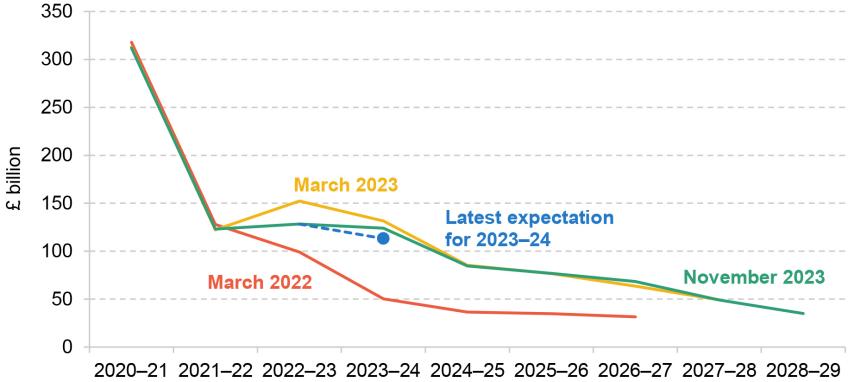
Source: Authors’ calculations and OBR’s Economic and Fiscal Outlook (March 2022, March 2023 and November 2023).
Based on new data releases since the November forecast, we can expect borrowing in 2023–24 to come in slightly lower than the £124 billion forecast by the Office for Budget Responsibility (OBR). Even though tax revenues have come in lower than expected in the past couple of months, this has been more than outweighed by lower spending on debt interest, owing to the sharp fall in inflation in December feeding through into lower spending on index-linked debt. If data for the remaining two months of the financial year follow the same pattern as now seen over the first ten months, borrowing in 2023–24 will reach around £113 billion. This would be £11 billion below the £124 billion forecast by the OBR in the November 2023 Autumn Statement and £18 billion below the forecast last March. Even though this is a welcome development, at 4.1% of national income it would still leave borrowing at more than twice the amount borrowed before the COVID-19 pandemic. We should also remember that as recently as March 2022, during Rishi Sunak’s final Budget as Chancellor, the OBR was forecasting borrowing in 2023–24 would, at £50 billion, be less than half what we now project. The current rate of borrowing thus remains unprecedentedly high by historical standards. As Figure 2 shows, since the end of the Second World War, we have borrowed more only during major recessions in the 1970s and 1990s, during the Global Financial Crisis and during the pandemic.
Figure 2. Public sector net borrowing: out-turn and official November 2023 forecast
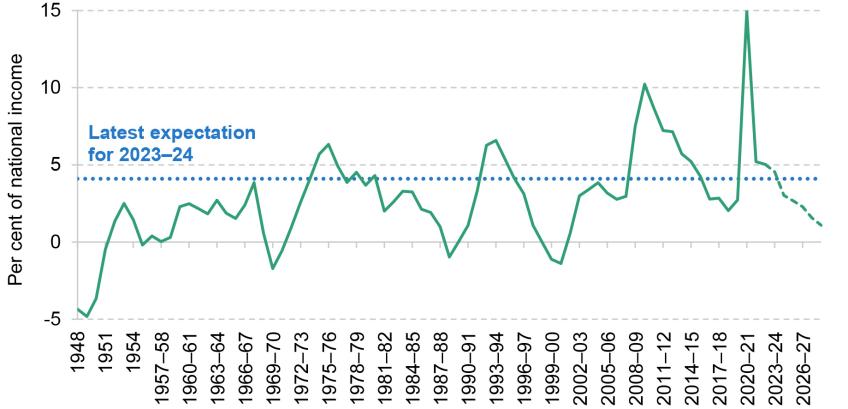
Source: OBR’s Economic and Fiscal Outlook (November 2023).
This report is structured as follows. We start in Section 2 by briefly setting out how fiscal aggregates have evolved in recent years. We then turn to the outlook for the medium term which, as ever, is very uncertain. As shown in Section 3, economic growth seems likely to remain weak in the following years and debt interest spending will remain permanently higher than we were used to. Section 4 discusses additional policy risks in the current budget which are likely to add to borrowing over the next few years. Further freezes to the rates of fuel duties or continually extending the supposedly temporary COVID-related reliefs in business rates would reduce revenues, while at the same time tight spending plans might require further top-ups in the near future. On top of that, growing pressures on healthcare spending and pensions, and the transition to net zero, will only amplify the public finance challenges over coming decades. Taken together, the case for further tax cuts is weak. But – as we conclude in Section 5 – if the Chancellor is still determined to go ahead with a substantial net tax cut in the Budget, then, rather than simply cutting some tax rate, he should take the opportunity to reform the structure of some of the UK’s flawed taxes.
2. Where things stand
After the spike in public spending during the COVID-19 pandemic, the size of the state is set to settle at a permanently higher level. Total government spending is forecast to decline gradually as a share of national income over the medium term from 44.8% today to 42.7% in 2028–29, as shown in Figure 3. This means that we still expect to spend over 3% of national income above the levels seen just before the pandemic, or on the eve of the global financial crisis (in 2007–08).
Figure 3. Government spending and revenues: out-turn and official November 2023 forecast
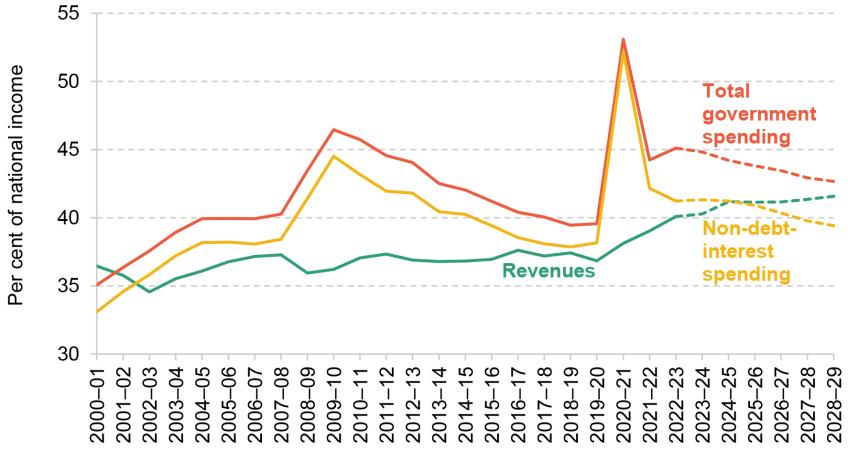
Source: OBR’s Economic and Fiscal Outlook (November 2023).
One of the factors contributing to the increased government spending is higher spending on debt interest. In the first two decades of the 21st century, debt interest spending remained reasonably stable and at less than 2% of national income on average – a remarkable fact, given that debt rose from 28.4% of national income in 2000–01 to 86.5% in the first year of the pandemic. Since then, however, debt interest spending has risen sharply. Under the OBR’s November forecast, debt interest spending this year is forecast to be 3.5% of national income. This spike partly reflects the temporary impact of inflation on the measured cost of servicing index-linked debt, but debt interest spending is also expected to settle at a higher level after this initial spike has passed – under the November forecast, it would still exceed 3% of national income in 2028–29.
In order to meet the financing requirements of a bigger state, revenues are set to rise sharply over the next couple of years. Having already risen from 36.8% of national income just before the pandemic to 40.3% this year, total government revenues are forecast to reach 41.6% of national income in 2028–29 – a total increase of almost 5 percentage points in less than a decade. This increase in government revenues has been fuelled by a sharp increase in tax revenues as a share of national income, as shown in Figure 4. In 2028–29, this is forecast to be at 37.7%, which would be the highest share on record since the end of the Second World War. As a result of these tax increases, total tax revenue is expected to be £66 billion higher this year than it would have been if its share of national income had remained unchanged at its 2018–19 level. By 2028–29, the increase in tax revenues as a share of national income since 2018–19 is forecast to be equivalent to £104 billion in today’s terms. Any new tax cuts could therefore only partially offset this record-breaking increase.
Figure 4. Total tax revenues as a share of national income: out-turn and official November 2023 forecast
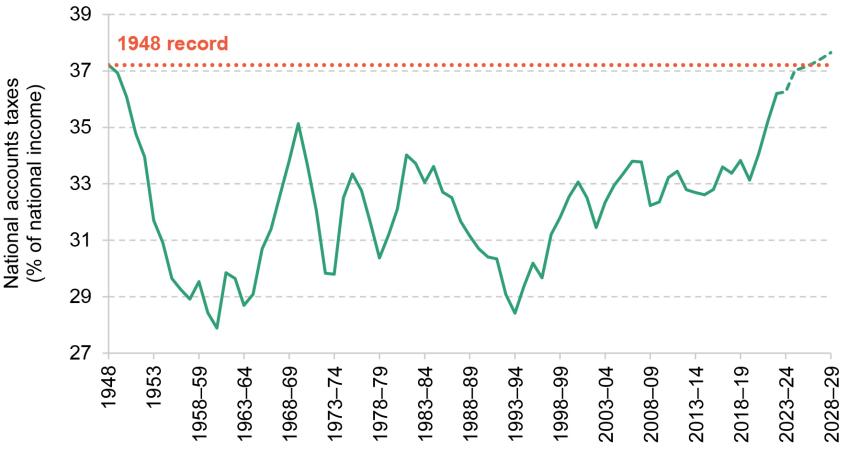
Source: OBR’s Economic and Fiscal Outlook (November 2023).
This increase arises from a mix of discretionary policy measures – such as the Spring 2021 Budget decision to increase the main rate of corporation tax from 19% to 25% from April 2023, which at the time was scored as raising £16 billion in 2024–25, and the multi-year freeze to most thresholds in the personal tax system. Alongside this, there have been changes in the underlying economy, such as increases in oil prices, which have boosted revenues. The increase in tax revenues as a share of national income comes despite last autumn’s decision to reduce the main rate of National Insurance contributions (NICs) paid by employees and the self-employed by 2 percentage points in January 2024. In the medium term, this tax cut offsets only about a quarter of the increase in the tax on labour income caused by the consecutive freezes of thresholds in income tax and NICs announced since March 2021, as shown in Figure 5. As a result, the current parliament remains the biggest tax-raising parliament in modern history.
Figure 5. The fiscal effects of changes in labour taxation since March 2021
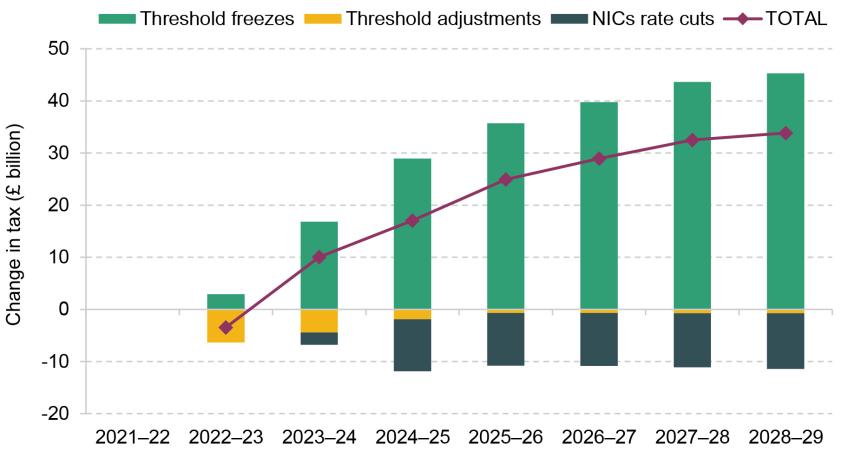
Source: OBR’s Economic and Fiscal Outlook (November 2023).
The effect of the changes to thresholds announced since Spring 2021 on personal tax bills and the extent to which these are offset by the January 2024 cut to NICs is shown in Figure 6. The red block shows the impact of threshold changes that have already happened. There are losses for most taxpayers, with bigger cash losses for higher-rate income taxpayers than for basic-rate taxpayers. The black line shows how the picture changes after accounting for the January 2024 cut to the main rates of NICs: those earning between around £25,000 a year and £60,000 a year are actually better off as the rate cuts save them more than they lose from the threshold changes since Spring 2021. The maroon block shows the losses from the planned freeze to thresholds in April 2024. Again, higher-rate income taxpayers lose more in cash terms than basic-rate taxpayers, but the difference is not as big as with the threshold changes already in place. This is because the latter include the big increase in the point at which employees pay NICs that came into effect in July 2021, and that threshold is now frozen. Finally, the blue line shows the overall impact from April 2024 after taking into account the NICs cut – at this point, the big tax rise from the April 2024 threshold freezes means only those earning between around £40,000 and £52,000 will be better off from this package of measures.
Figure 6. Changes in income tax and National Insurance contributions arising from changes in thresholds since 2021 and the January 2024 cut to the main rates of NICs, by earnings
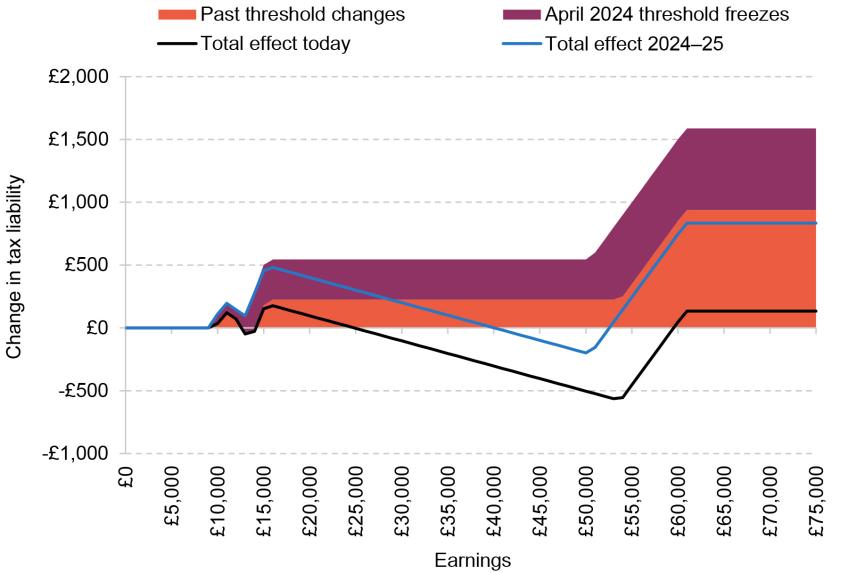
Source: Authors’ calculations.
3. Medium-term outlook
Growth and inflation
A key determinant of how revenues and spending will evolve will be real growth in the economy and the evolution of inflation over the medium term. Even though recent growth figures have been disappointing – pointing to economic stagnation at best – what matters is how the prospects change going forward. Figure 7 compares the OBR’s November forecasts for growth in the economy, the Bank of England’s forecast produced that same month and the most recent Bank of England forecast that was published earlier in February. This shows two key things. First, the OBR is much more optimistic about the outlook for growth in the UK economy over the next few years than the Bank of England is. Indeed, this has been the case with forecasts made since 2022. Second, the Bank forecast has changed only marginally between November and February, with the forecast for growth being revised up slightly (leaving the economy 0.7% bigger in real terms by the end of 2026). Under the Bank of England’s latest forecast for growth going forwards, the economy would be 2.2% smaller in the first quarter of 2027 than forecast by the OBR. This equates to a reduction in the size of the economy of around £60 billion a year in today’s terms – which a back-of-the-envelope calculation would suggest is a medium-term reduction in receipts of around £25 billion a year.
Figure 7. Real growth forecasts
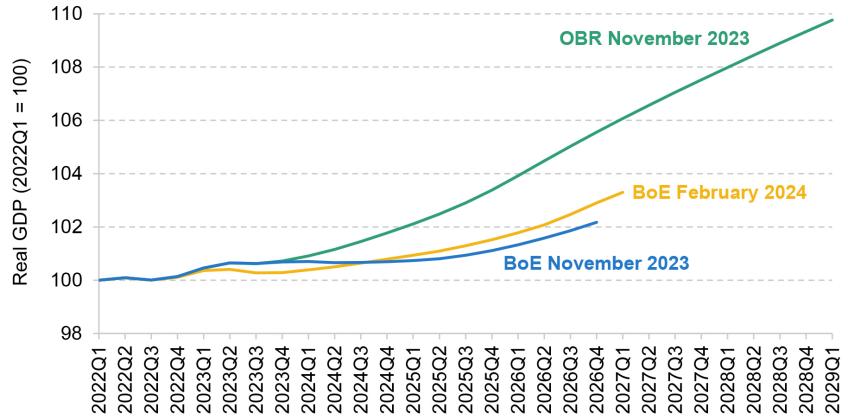
Source: Bank of England’s Monetary Policy Report (November 2023 and February 2024) and OBR’s Economic and Fiscal Outlook (November 2023).
On average, other independent forecasters surveyed by the Treasury have also hardly changed their growth forecast for 2024 in recent months, as shown in Figure 8. However, some of the forecasters who were on the more optimistic end of the spectrum have revised down their forecasts so that they are now closer to the average. Uncertainty about the path of the economy over the medium term remains high. The difference between the most optimistic and most pessimistic forecasts for growth in 2024 is 1.4 percentage points and this range remains similar in subsequent years.
Figure 8. Real growth forecasts by independent forecasters
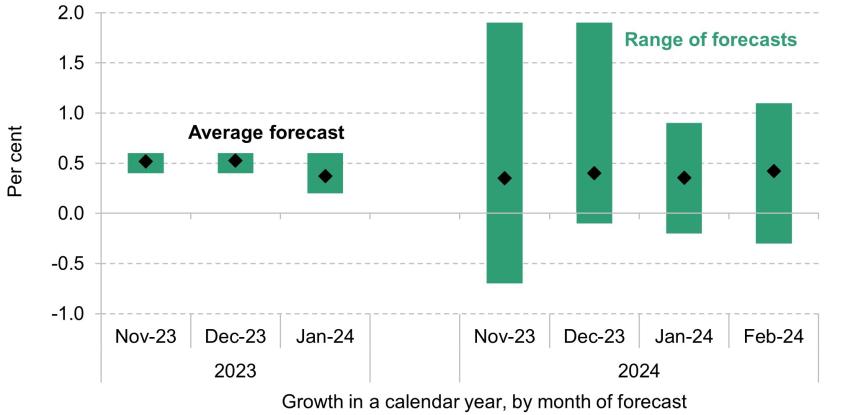
Note: Only new forecasts submitted in the given month are included.
Source: HM Treasury’s ‘Forecasts for the UK economy’ (November 2023, December 2023, January 2024 and February 2024).
With slightly lower-than-expected inflation in data published at the end of last year, the Bank of England now expects CPI inflation to fall quickly towards its 2% target in 2024 before increasing slightly again in 2025. This is shown in Figure 9. These views are also shared by independent forecasters, whose forecasts for annual inflation in 2024 have fallen to 2.2% on average. However, this different trajectory for inflation would leave the final price level essentially unchanged over the medium term. The Bank now expects the level of the Consumer Prices Index to be only 0.4% lower at the end of 2026 compared with the forecast in November.
Figure 9. CPI inflation forecasts

Source: Bank of England’s Monetary Policy Report (November 2023 and February 2024) and OBR’s Economic and Fiscal Outlook (November 2023).
In summary, it is not obvious that the outlook for real growth has changed dramatically since November. The outlook for CPI inflation suggests that it might now be a little lower in September 2024. This would reduce benefit spending in 2025–26: a 1 percentage point reduction (which is slightly less than the difference between the November OBR forecast and the latest Bank of England forecast) would reduce spending by around £2.3 billion in that year. But this reduction in spending would fade slightly in subsequent years if, as the Bank of England forecasts, CPI inflation runs slightly higher from 2025 onwards. Also important for the public finance forecasts will be how the outlook for wage growth and consumer spending has changed – but given little change in the outlook for real growth or household inflation, it is not clear that we should expect any changes here to be substantial.
Net migration, growth and the OBR forecast
A key factor underlying the OBR’s forecast for economic growth (and hence the public finances) is population growth. In January, the Office for National Statistics (ONS) published new long-term population projections1. Compared with the projection from a year earlier, which underpins the OBR’s November forecast for the public finances, this anticipates faster population growth, largely driven by higher international migration persisting into the medium term. In 2023, the ONS projected population growth would reach around 0.3% per year by mid 2029. Under the revised 2024 projection, the population would grow at a faster rate of 1% in the short term – causing a one-off increase in size – but more importantly for the outlook for the public finances, the rate of growth is also expected to settle at a higher level of around 0.5% over the medium term.
If there are more people in the country, some of whom join the labour force, they will generate additional economic activity. This generates a benefit for the public finances, but this is largely driven by the extent that spending plans for public services are fixed in aggregate (rather than per-capita) terms, whereas tax revenues will increase automatically in response to more income and more spending in the economy. In many cases, however, a bigger population will create at least some more demand for public services, making a given set of aggregate spending plans effectively less generous. Under the OBR’s November forecast, real-terms day-to-day spending on public services was set to grow by 0.9% a year on average from 2025–26 onwards. However, accounting for population growth, total spending was forecast to grow only 0.5% in per-capita terms under the 2023 population projection. Under the latest population projection, the average annual growth in real-terms spending per capita falls as low as 0.2%. As we go on to discuss in Section 4, once commitments on areas such as the NHS, childcare, defence and overseas aid are taken into account, keeping to this overall spending envelope would already require cuts to other, ‘unprotected’ departments, which are not subject to specific commitments.
The impacts on the budgets of different public services are likely to vary: more people will need more healthcare, but a bigger population will not necessarily require an increase in the amount spent administering farm subsidies. Services such as defence and overseas aid are not directly linked to an individual need (at least, of a person in the UK), but international and domestic commitments imply that spending in these areas will rise in line with national income.
If the OBR were to upgrade its projections for economic growth in tandem with the ONS’s upwards revision to growth in the adult population projection, the impact on the size of the economy could also be substantial: if no other countervailing changes were made, the new projections might add 0.4% to growth this year and next, declining to 0.1% in 2029. It is important to note that the OBR is not obliged to adopt the new ONS projection, or it might downgrade its forecast for other determinants of growth – for example, the employment rate, average working hours or wage growth – which might at least partially outweigh these changes. And as we have shown above, it is not clear that the Bank of England or other independent forecasters have revised up their growth forecasts significantly in response. In any case, whether there would be a real improvement in the fiscal outlook depends on public services’ capacity to meet demand from a larger population with a tight funding outlook.
Debt interest spending
The OBR’s forecasts for debt interest spending are based on market expectations for interest rates. One key example of these is expectations for Bank Rate, a measure of the expected risk-free rate in the economy. These expectations have fallen since November, as shown in Figure 10. Currently, markets expect Bank Rate to be 3.4% in four years’ time, or around 0.4 percentage points below what they expected at the time of the Autumn Statement and very close to the level forecast almost a year ago, at the 2023 March Budget. Together with falling inflation, we might expect the OBR to revise down its forecast for debt interest spending by around £10 billion in 2028–29 as a consequence2. However, spending on debt interest is forecast to persist around 2% of national income a year higher (equivalent to £55 billion in today’s terms) than what was forecast prior to the pandemic, as shown in Figure 11.
Figure 10. Market expectations for Bank Rate
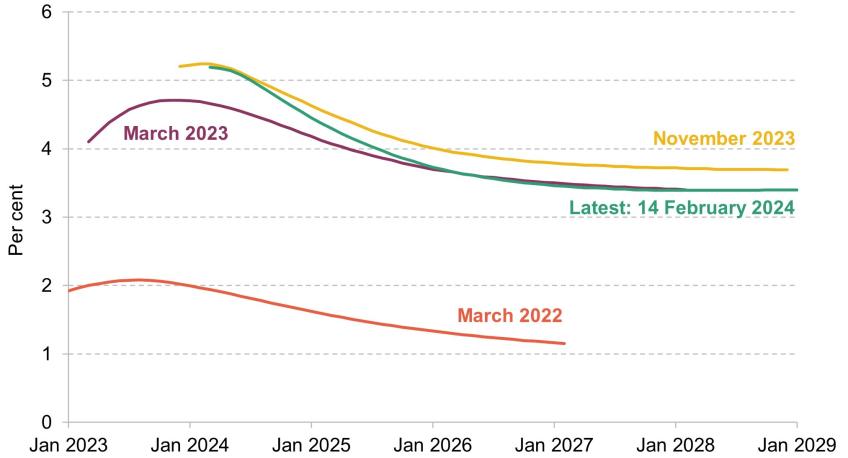
Source: Bank of England, yield curves (https://www.bankofengland.co.uk/statistics/yield-curves).
Figure 11. Debt interest spending out-turn and forecasts
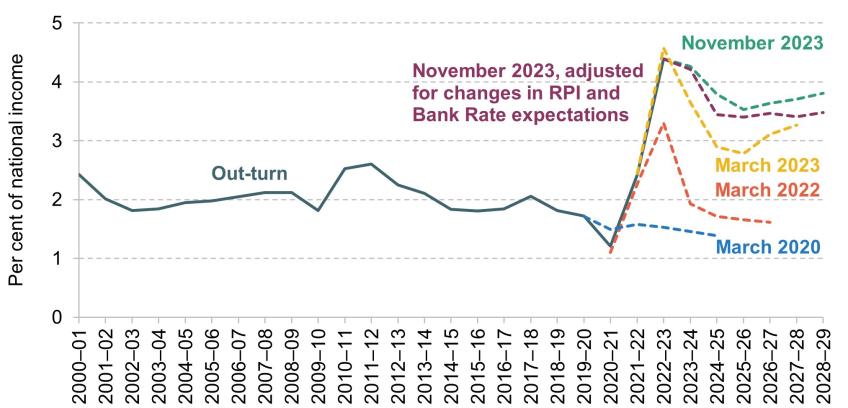
Note: Shows central government debt interest net of income from the Asset Purchase Facility.
Source: OBR’s Economic and Fiscal Outlook (March 2020, March 2022, March 2023 and November 2023) and authors’ calculations.
The future path of interest rates is uncertain and expectations have been volatile. Interest rates might come down even more quickly than current expectations imply: under Citi’s forecast analysed in IFS’s October 2023 Green Budget, Bank Rate would be another percentage point below the current market expectation. On the other hand, they might rise again – having risen about half a percentage point just since Christmas, for example. The point is that these expectations are volatile and the government ought not to be responding to them with frequent changes to tax and spending policy.
Moreover, we are now asking the private sector to absorb historically high volumes of debt in the next few years. The issuance of new debt to finance our ongoing borrowing, amplified by the effects of quantitative tightening by the Bank of England, will result in the biggest increase in private sector holdings on record of 7.9% of national income in 2024–25. Looking more broadly at the next five years, this is forecast to average 6.2% a year which is more than twice the 2.8% a year seen over the last 25 years, as shown in Figure 12. With a potentially narrowing pool of domestic buyers of public debt (not least due to the decline of defined benefit pension funds), this increases the risks on debt interest spending as relatively more footloose international investors could demand a higher interest rate for continued lending to the UK government.
Figure 12. Gilt issuance and change in private holdings
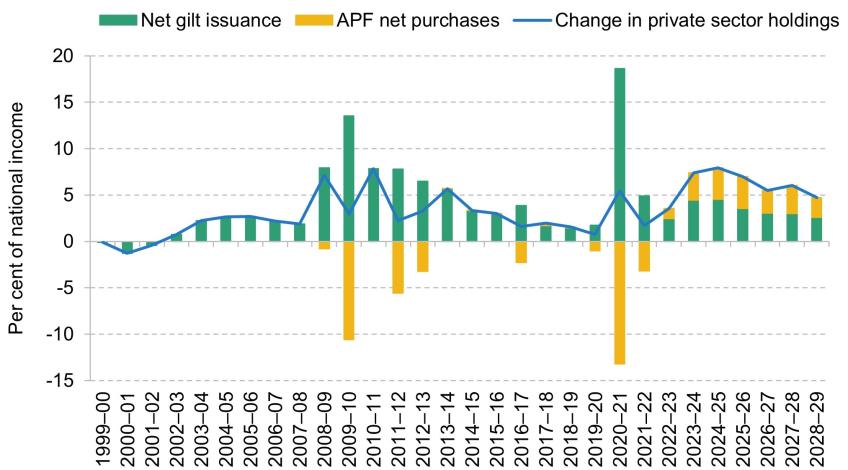
Note: APF = Asset Purchase Facility.
Source: OBR’s Economic and Fiscal Outlook (November 2023).
The path of public sector net debt
Under the latest OBR forecast from November 2023, public sector debt is expected to increase from 84.9% of national income in 2022–23 to a peak of 93.2% of national income in 2026–27 (Figure 13). This is an increase of 8.3% of national income, with just under half occurring in 2023–24 and the remainder occurring over the next three years. It is then forecast to fall very slightly over the subsequent two years – with the OBR forecasting that it will be at 93.2% in 2027–28 and then fall by 0.4% of national income to 92.8% in 2028–29. This is in sharp contrast to the not-so-distant forecast in March 2022. Back then, the OBR was forecasting public sector debt would be more than 13% of national income lower in 2026–27, thanks to a continuous decrease in debt by a total of almost 4 percentage points over the forecast horizon.
Figure 13. Public sector debt forecasts
Note: Shows public sector net debt excluding Bank of England.
Source: OBR’s Economic and Fiscal Outlook (March 2022, March 2023 and November 2023).
The government’s fiscal mandate now requires forecast debt to be falling as a share of national income by the fifth and final year of the forecast. In principle, the idea of having debt on a falling path in the medium term has much to commend it – it allows the Chancellor to ‘look through’ temporary economic disturbances and introduce necessary changes gradually, while reducing risks associated with high levels of debt and ensuring debt can be raised sharply again when the next crisis calls for a large fiscal response. However, the fiscal mandate operationalises this principle in a way that can easily produce misleading conclusions about the sustainability of fiscal policy and appears to be distorting fiscal decision-making. Because it focuses on the change in debt between years 4 and 5, a given policy or economic circumstance that raises debt in the earlier years of the forecast can actually make the target easier to meet. This creates an incentive to state that costly policies will be temporary as forecast debt is more likely to fall in year 5 as the policy is withdrawn, even if the political intention is to keep the policy in place permanently. This is damaging for transparency and creates unnecessary uncertainty.
In addition, the level of nominal national income in four or five years’ time is highly uncertain. Small changes in forecast growth or inflation in the last year of the forecast can cause large swings in ‘headroom’ against the target. We show some illustrative examples of this sensitivity in Table 1. Overall, the forecast fall in public sector net debt in the final year – of 0.4% of national income – is equivalent to £11 billion in today’s terms (or £13 billion in 2028–29 terms). Were economy-wide inflation to be revised up by 1% in 2028–29 then this margin would increase to £27 billion, though were inflation to be reduced by 1% then that would lead to the target being missed by £3 billion. The impact of other changes will also depend on whether they are temporary or permanent, and in rather odd ways. For example, whereas a one-off fiscal loosening announced for 2028–29 of £20 billion would cause the target to be missed by £4 billion, implementing a fiscal loosening of this scale for the next four years but not in 2028–29 would not change the ‘headroom’ at all. Similarly, a 1% rise in gilt rates, which would push up debt interest spending, would not affect the target if gilt rates were higher throughout the forecast horizon, but it would lead to the target being missed by £15 billion if the rise occurred solely in 2028–29. Also note the fact that in the two scenarios where the ‘headroom’ does not change, we actually end up with a higher level of debt than initially forecast, which only further highlights the poor design of the fiscal mandate.
Table 1. Illustrative changes in assumptions and their impact on ‘headroom’
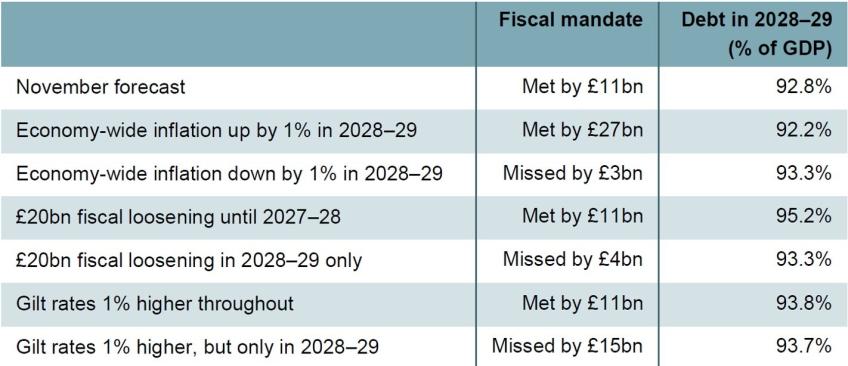
Note: Amounts in 2023–24 terms. Fiscal loosening assumed to be announced in 2024–25 with a gradually fading stimulus effect.
Designing any forward-looking, rolling fiscal target involves a trade-off between choosing an early target year, which produces a stronger commitment, versus a later target year, which allows for more flexibility in the face of potential crises. The Chancellor’s fiscal rule targets a year that will typically be outside the current Spending Review period. One issue with that is he can pencil in very tight overall spending plans for public services without specifying which departments would need to find savings.
Each year, the fiscal mandate rolls forward a year and, in the absence of a new Spending Review, allows the Chancellor to add another year of spending plans whose delivery is questionable at best, unrealistically flattering the forecast. Between the March and November 2023 forecasts, the target year rolling over added just under £5 billion to ‘headroom’ against the fiscal mandate, and over £10 billion against the supplementary target, which caps borrowing at 3% of national income. The first fiscal event in the 2024–25 fiscal year – after the upcoming Budget – would similarly add ‘headroom’ in a mechanical fashion through this rollover effect. This could increase the temptation to add a second fiscal event before a general election – and particularly so if it looks like the outlook for the UK economy and the public finances will have improved.
Overall, changes in ‘headroom’ against the fiscal mandate do not provide a clear picture of changes in the overall sustainability of the public finances and are a poor guide for policymaking.
4. Policy risks
So far, we have focused on some of the risks to the outlook to the public finances from changes in the underlying economic environment: changes to real growth, inflation and interest rates. But the evolution of the public finances will also depend on how policy evolves, and in particular whether it is in line with what is currently assumed. In this section, we highlight some of the policy risks to the forecast.
Spending risks I: spending on public services
Perhaps the most substantial policy risk comes from the growth in day-to-day spending on public services over the four years from April 2025. In recent oral evidence to the House of Lords Economic Affairs Committee3 Richard Hughes, Chair of the Office for Budget Responsibility, said:
‘The Government did a spending review setting out detailed departmental plans for the year until 31 March 2025. Beyond that, we know virtually nothing. It is just two numbers – one for total current spending and one for total capital spending by departments. Some people have referred to that as a work of fiction. That is probably generous, given that someone has bothered to write a work of fiction, whereas the Government have not even bothered to write down their departmental spending plans underpinning their plans for public services.’
We now give a sense of what turning the spending numbers set by the Chancellor into reality might imply for different departmental budgets.
Day-to-day spending on public services
The numbers that have been pencilled in have overall day-to-day public service spending (the ‘total current spending … by departments’ referenced by Richard Hughes) growing by 0.9% a year over and above economy-wide inflation. This would represent an overall real-terms increase of around £17 billion in 2028–29, relative to 2024–25. In principle, the planned overall rise could allow for all departments to see their budgets increase in real terms. However, as the scenario presented in Figure 14 illustrates, in practice this is unlikely to be the case. If we assume that: NHS spending grows in line with what is needed to fund the NHS workforce plan; schools spending is frozen; spending on defence and overseas aid grows in line with the economy – as required by commitments the government has made; and the Treasury’s costing of the big expansion of childcare announced in the March 2023 Budget is correct; then there would need to be cuts to other areas of government. These other areas include local government services, further education, courts and prisons – areas which bore the brunt of the cuts to public service spending in the 2010s. We estimate that to avoid making real-terms cuts to those budgets (on average), spending plans for 2028–29 would need to be topped up by around £20 billion, in cash terms.
Figure 14. Illustrative change in day-to-day funding implied by latest spending plans, 2024–25 to 2028–29
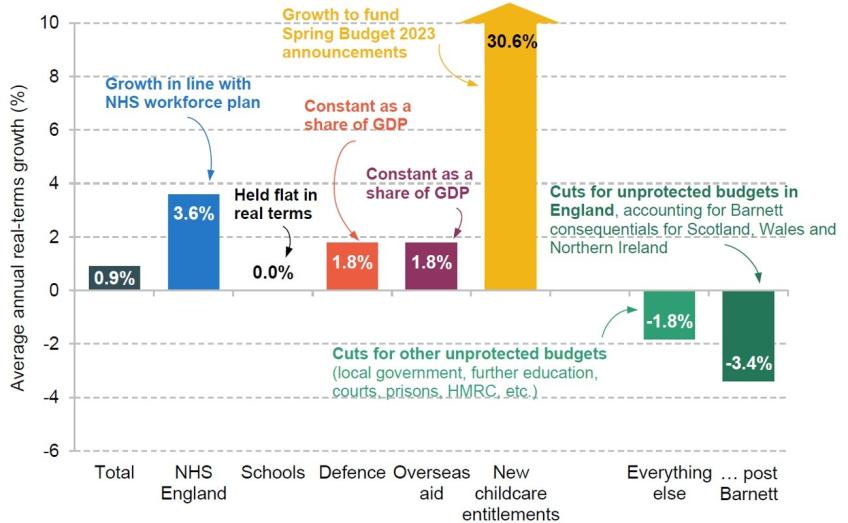
Source: Authors’ calculations using HM Treasury’s Autumn Statement 2023, OBR’s Economic and Fiscal Outlook (November 2023) and Warner and Zaranko (2023).
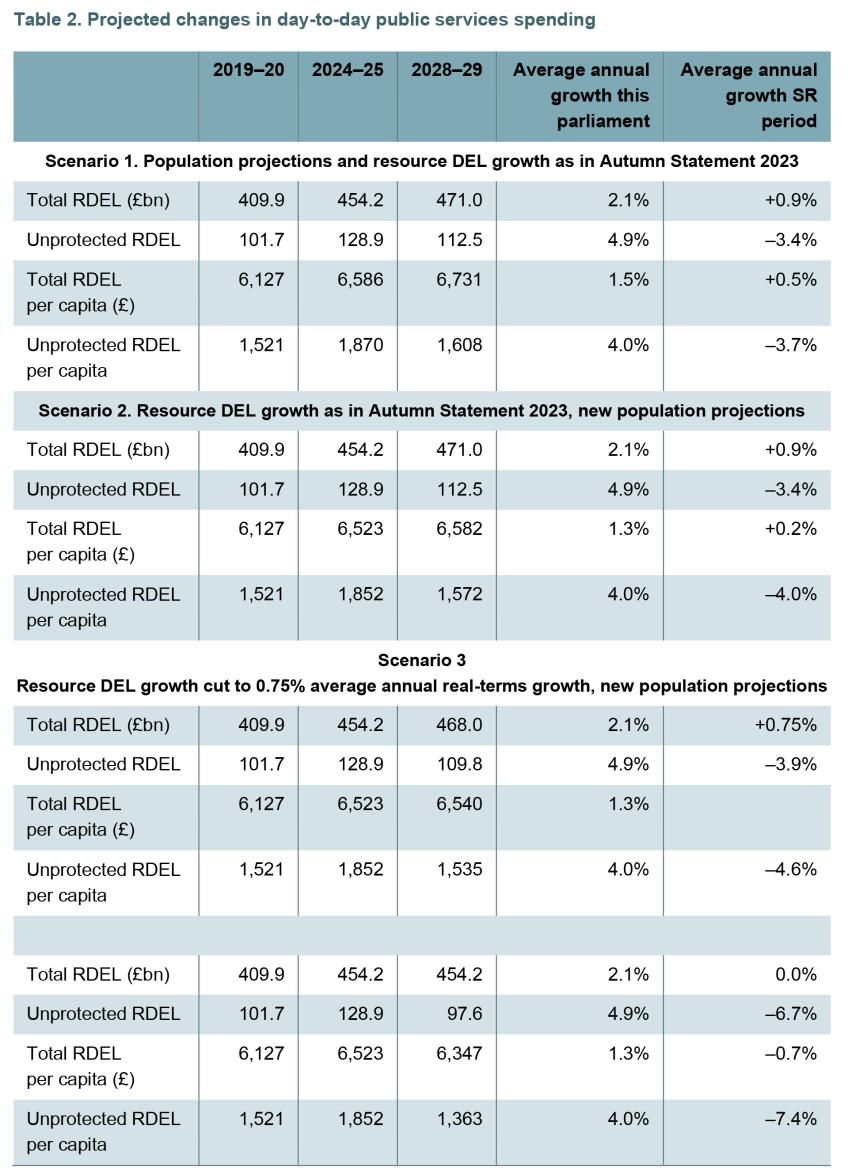
The UK population is forecast to grow, which means that these spending plans are even tighter in per-capita terms4. This is shown in Table 2. At the time of the November Autumn Statement (‘Scenario 1’), overall growth in day-to-day spending of 0.9% per year translated into growth of 0.5% a year in per-capita spending. This compares with growth in spending averaging 2.1% a year under the current parliament so far, with that corresponding to growth in per-capita spending of 1.5% per year. Under the latest ONS population projections (‘Scenario 2’), planned growth in day-to-day spending per capita would fall to 0.2% a year. With unprotected spending being cut by 3.4% a year, this would lead to unprotected spending per capita falling by 4.0% a year. While a £20 billion top-up to cash spending plans in 2028–29 (£18 billion in 2023–24 terms) would be needed to prevent unprotected spending from being cut, under the latest population projections an injection of £25 billion would be needed to stop per-capita spending from being cut.
Table 2. Projected changes in day-to-day public services spending
Memo item: Unallocated reserve within unprotected RDEL is £12.7 billion in 2024–25.
Note: Protected spending is on NHS England, schools, defence, overseas aid, and new childcare announcements made in March 2023. We assume that NHS England spending grows by 3.6% annually in real terms, that schools spending is held flat in real terms, that spending on new childcare announcements grows by 30.6% annually in real terms, and that defence and overseas aid spending grows with GDP. Reserve is currently included in the overall total for unprotected departments’ budgets in 2024–25.
Source: Authors’ calculations using HM Treasury’s Autumn Statement 2023, HM Treasury’s Public Expenditure Statistical Analyses 2023, OBR’s Economic and Fiscal Outlook (November 2023), ONS’s 2021-based interim national population projections, GDP deflators November 2023, and Warner and Zaranko (2023).
The growing population means that the spending plans appear even tighter in per-capita terms, and more so under the most recent ONS population projections which have faster projected population growth. Despite this there is the possibility that the spending plans will be cut back further in the Budget in order to ‘pay for’ new tax cuts. Scenarios 3 and 4 provide two illustrative scenarios.
The Financial Times recently reported that the Chancellor was considering lowering planned growth in spending to 0.75% a year5. Scenario 3 shows what this would mean were it applied to day-to-day public service spending, and the potential implications for unprotected services. Real-terms spending in 2028–29 would be £3 billion lower. Spending per capita would still rise, but only by 0.1% a year. Were all of the £3 billion reduction in planned spending to come from unprotected services, it would mean their spending falling by 3.9% a year in real terms, and 4.6% a year in real per-capita terms.
Finally, Scenario 4 shows the implications of a freeze to overall spending. This would – assuming that the protections set out above would remain in place – see unprotected day-to-day spending falling by 6.7% a year, and per-capita spending on unprotected public services falling by 7.4% a year.
Investment spending
The plans also imply that public sector gross investment will be broadly flat in cash terms. With rising depreciation, keeping to these plans would mean public sector net investment falling in cash terms, from £69.9 billion in 2024–25 to £56.8 billion in 2028–29. This would be a real-terms cut of £16.9 billion. As a share of national income, it implies public sector net investment falling by 0.7% of national income – or £20 billion in today’s terms – from 2.5% in 2024–25 to 1.8% in 2028–29. This would return spending to around the share of national income seen in the 2010s (investment spending averaged 1.9% of national income over that decade) and it would be slightly above the long-run average seen over the last 45 years. But it would reverse the big increase in investment spending that has been delivered since 2019. The appropriate level of public sector investment spending in the UK economy is unlikely to fluctuate so sharply over time, not least because a more stable path for investment should help ensure that the money is spent efficiently. It is also the case that cutting investment spending is likely not to be good for long-term growth.
Investment spending can be lumpy and is more easily cut than day-to-day spending. And it is also possible that the implied cuts to day-to-day spending will be delivered. But there is a clear risk that whoever is in office after the next election is unwilling or unable to deliver them.
The next Spending Review
At the very least, these spending plans will remain questionable until a Spending Review is conducted and allocations made to individual spending departments. Even since the November Autumn Statement, there have been examples of where the government has decided that additional public spending is needed: on 24 January an additional £600 million of support was provided for local government in 2024–25 (with £500 million of this earmarked for social care), while on 13 February an additional £3.3 billion was provided to the Northern Ireland Executive (equivalent to £1,750 per person in Northern Ireland, an amount that would equate to £115 billion if done UK wide) although this funding is spread over more than one year6.
The fiscal risk associated with these provisional spending plans could also increase were a fiscal event to occur in 2024–25 in advance of the Spending Review. This is because the forecast horizon will roll forwards another year, giving the Chancellor the option to pencil in another year of tight spending growth for 2029–30. Indeed, between the March and November 2023 forecasts, the addition of 2028–29 to the forecast horizon led to borrowing in the final year of the forecast being over £10 billion lower, with this figure being driven by the tight spending growth pencilled in for that year.
Spending risk II: spending on incapacity and disability benefits
Spending on benefits to support people with disabilities or health conditions represents a different kind of risk to the public finances. This spending has been rising in real terms since the second half of the 2000s. But, as shown in Figure 15, it has risen particularly sharply in recent years, with spending in 2023–24 reaching £78 billion, which is £13 billion (20%) higher than what was spent in 2020–21. This sharp rise has been fuelled by increasing numbers of individuals making successful claims for incapacity and disability benefits. In response to these rising caseloads, the OBR has dramatically revised up its forecasts for spending, with spending overall in 2028–29 forecast to reach £100 billion. Most of this increase is from the working-age population, although particularly strong percentage growth is forecast for benefits that go to children with disabilities or health conditions.
Figure 15. Benefit expenditure to support disabled people and those with health conditions
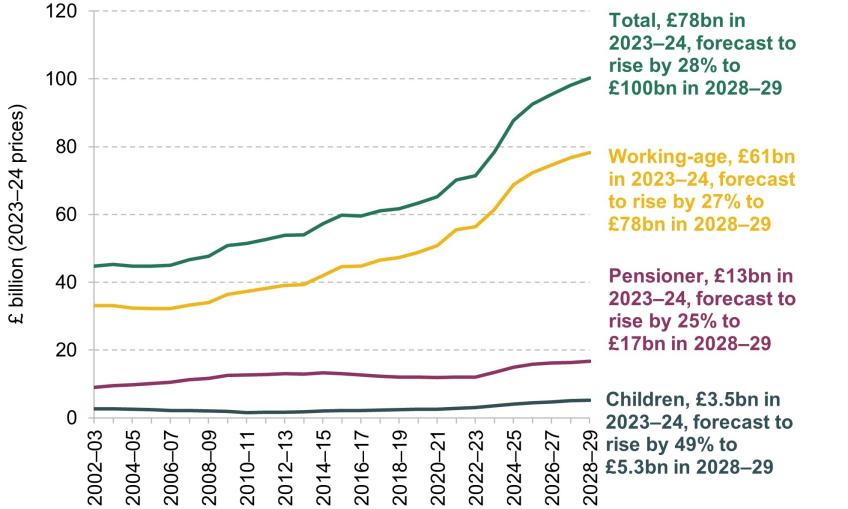
Source: Figure 11 of Emmerson et al. (2024).
This is a huge public policy challenge – in terms of how best to support those households, but also in simple terms of cost. Given the considerable uncertainty, this is one area where it is possible subsequent forecasts will be revised substantially – and potentially in the helpful direction of lower spending; although it should be noted this would be a break from the past in that, since 2012, spending on working-age disability benefits has tended to be higher than forecast by the OBR (Emmerson, Mikloš and Stockton, 2023, figure 4.13).
Revenue risks: fuel duties, business rates and frozen thresholds
There are also policy risks on the tax side. This is most clear with fuel duties. Stated policy is for the rates of fuel duties to increase each year in line with the Retail Prices Index (RPI). However, fuel duties indexation has become something of a joke, with a succession of one-year freezes announced every single year since 2011, while Chancellors insist on simultaneously maintaining the pretence that in a year’s time the rate would indeed be indexed. In addition, the ‘temporary’ one-year 5p rate cut introduced in March 2022 in response to a sharp rise in oil prices was extended, supposedly for just one more year, in March 2023. Together with the successive cash freezes, this has led to revenues from fuel duties in 2023–24 being forecast to be the same in nominal terms as they were in 2008–09, and around £14 billion lower than they would have been had rates of fuel duties been increased in line with the RPI since 2010–11. If, as seems more likely, rates of fuel duties are kept at their current cash level, rather than the 5p cut being allowed to expire and the rates being increased in line with the RPI, this would reduce forecast revenues in 2028–29 by £6 billion.
Another example of a temporary policy that looks like becoming permanent relates to a business rate relief. Specifically, relief for retail, hospitality and leisure sectors was first introduced at a rate of 50% during the pandemic. The Autumn 2021 Budget then extended it to 2022–23, while the 2022 Autumn Statement increased the relief to 75% and extended it to 2023–24. Then, in the 2023 Autumn Statement, it was extended again to 2024–25 at an estimated cost of £2.4 billion in that year. This policy may be allowed to expire. But given the decisions made in the Autumn Statements of 2022 and 2023, it would not be surprising if it was extended beyond 2024–25. This would lead to the rather ridiculous situation that something specifically introduced to provide support in the pandemic continues to be in place several years later, but potentially still on what is claimed to be a temporary basis – and at a more generous rate than was available in the actual pandemic.
The fact that pretty much all thresholds in the personal direct tax system are being frozen in cash terms through to 2027–28 is also a policy risk for the public finances. As was shown in Figure 5, these are forecast to raise around £44 billion in 2027–28, of which £29 billion will be in place in 2024–25. The risk to the public finances relates to whether the subsequent freezes will in fact go ahead. For example, freezing the income tax personal allowance will reverse around two-thirds of the real-terms increase in the personal allowance seen in the 2010s and will increase the share of adults paying income tax to above 66%, a level that has only been seen once before (in 2007–08 at the end of Gordon Brown’s Chancellorship) (Emmerson, Mikloš and Stockton, 2023). This large increase in taxpayer numbers could lead to pressure on the Chancellor, or his successor, to end the planned six-year freeze – much longer than any previously attempted or delivered – early.
Asymmetric responses to economic news
A further risk comes from the Chancellor’s likely policy response to new information about the state of the economy and the public finances. If things improve, Chancellors historically tend to offset this with tax cuts or spending increases. On the other hand, if the economic situation gets worse, history suggests that they will just accept the higher borrowing. Mr Hunt’s asymmetric responses in the last two Autumn Statements are a testament to that (see Box 1). However, this type of behaviour is pervasive: since 2010, Chancellors have on average planned to recoup just 27% of the increases in borrowing forecasts but have on average spent 60% of the ‘windfall’ from reductions (Emmerson et al., 2023). This damages the transparency and credibility of the forecast as the risks are very one-sided. This leads to a ‘ratcheting’ of debt over time. Speculation about an additional fiscal event before the general election in 2024–25 potentially exacerbates this problem if, as seems likely, a fiscal event only happens in the case where an improvement in the forecast is expected.
Box 1. The Chancellor’s asymmetric responses to changes in the official forecast
The new set of forecasts produced by the OBR ahead of the Autumn Statement last November had borrowing running lower than previously expected. In response, Mr Hunt decided to spend that ‘windfall’ on tax cuts – or to be more precise, on not raising taxes by as much as he had previously intended. These policy decisions brought forecasts for borrowing back to where they had been previously (Figure 16).
Figure 16. Example of a medium-term economic improvement: the 2023 Autumn Statement
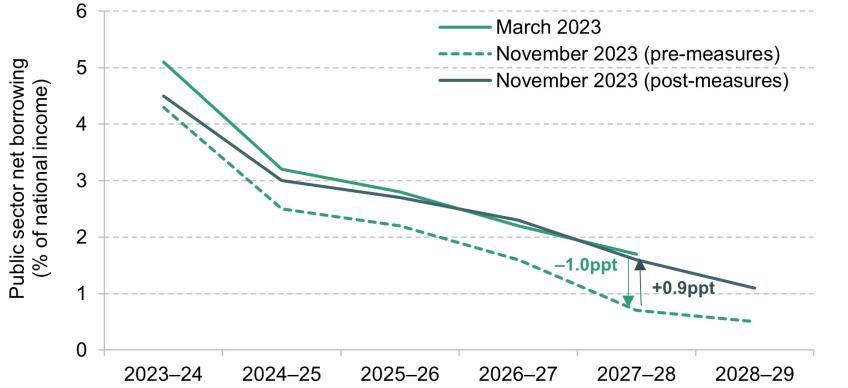
Note: Green (grey) arrows represent changes in the forecast due to underlying (policy) changes. The grey upward arrow reflects an announced policy loosening, while the green downward arrow reflects an underlying economic improvement.
But a year earlier, in November 2022, Mr Hunt was presented with a deterioration in the forecast – the economic picture had worsened and borrowing was now expected to be higher than previously thought. When faced with this situation, his response was quite different: he chose to offset only about a third of this deterioration through tax rises and spending cuts, and largely accepted higher borrowing – he let the public finances take the hit (Figure 17).
Figure 17. Example of a medium-term economic deterioration: the 2022 Autumn Statement
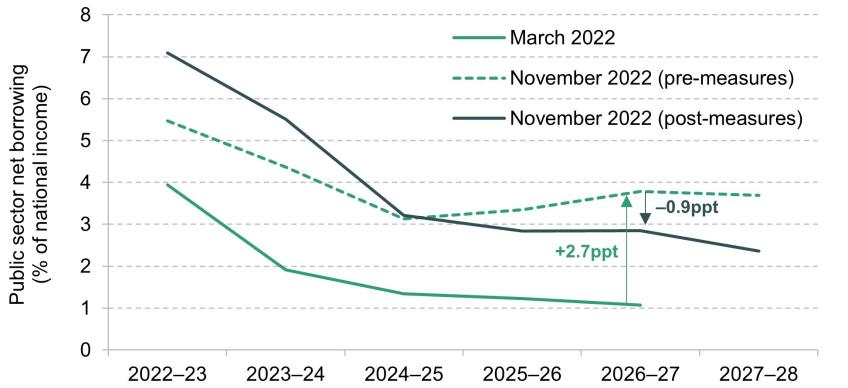
Note: Green (grey) arrows represent changes in the forecast due to underlying (policy) changes. The grey downward arrow reflects an announced policy tightening, while the green upward arrow reflects an underlying economic deterioration.
5. Conclusion: the Budget judgement
At the time of the 2023 Autumn Statement, the forecasts implied that despite a sharp rise in taxes since 2019, and plans that implied some further cuts to public service spending over the four years from April 2025, public sector net debt was on course only to be broadly stabilised at the end of the forecast horizon. The Chancellor could point to debt being forecast to fall as a share of national income in 2028–29 and therefore correctly claim that the letter of his fiscal mandate was being met. But only just. This was due to an unwelcome mix of factors, including a continued weak outlook for growth combined with interest rates running well above what was expected just two years ago, and a sharp rise in the numbers successfully claiming incapacity and disability benefits since the pandemic pushing up forecast benefit spending on those with disabilities and health problems.
The fiscal outlook does not appear to have changed much since November. Market expectations of interest rates have come down a bit – though only to around the level expected a year ago – and these remain volatile. Nonetheless, this should mean that forecast spending on debt interest is revised down by around £10 billion a year in the medium term. Even though tax revenues have come in lower than expected in the past couple of months, this has been more than outweighed by lower spending on debt interest. A big driver of the outlook for receipts will be whether the OBR changes its view on the outlook for nominal growth in the economy. Even though recent growth figures have been disappointing – pointing to economic stagnation at best – what matters for the public finances is how the prospects change going forward. While there is, as ever, a wide range of views about the prospects for growth in the coming year, on average these have changed little since November.
In the Autumn Statement, the Chancellor announced two big tax cuts: 2p off the main rates of National Insurance paid by employees and the self-employed – at a cost of about £10 billion a year – and making his ‘full expensing’ policy in corporation tax permanent, also at a cost of around £10 billion a year in the medium term (though much less in the longer term). These were essentially paid for by higher inflation boosting receipts, but the Chancellor choosing not to top up public service spending plans despite departments’ budgets now being less generous in real terms. At the March Budget, it is conceivable that the Chancellor will get an opportunity to repeat a similar trick, if he uses the increase in forecast receipts that results from a bigger expected population to cut taxes, while ignoring the additional pressures that a bigger population places on public services. He should resist this temptation.
There have been reports that the Chancellor is considering paring back his (already tight) spending plans in order to create supposed ‘headroom’ for fresh tax cuts. This, too, is a temptation that should be avoided. Our estimates already suggest that, under seemingly realistic assumptions for spending on the NHS, schools, defence, overseas aid and support for childcare, day-to-day spending on other public services will need to be cut by around £20 billion in cash terms in 2028–29. The outlook for investment spending is even tighter. If the Chancellor wishes to announce tax cuts, he ought to spell out where the resulting spending cuts will fall.
For this reason, whatever happens to the OBR’s estimates of the government’s ‘fiscal headroom’, the economic case for tax cuts before the next Spending Review is completed is weak. It is possible that the spending plans pencilled in by the government will be delivered: public services have, after all, faced budget cuts before. But the lack of detail beyond 2025, coupled with a seeming desire to add state responsibilities (e.g. around childcare), casts considerable doubt on the credibility of these plans. There is a clear risk that whoever is in office after the next election will prove unwilling or unable to deliver them. Until the government has provided more detail on its spending plans in a Spending Review, it should refrain from providing detail on tax cuts.
Were the Chancellor determined to deliver a net tax cut in the Budget regardless of these arguments, then one option would be to cut the rates of income tax, National Insurance contributions or VAT. Reducing the basic rate of income tax by a penny would cost about £7.3 billion. Cutting the main rates of National Insurance contributions paid by employees and the self-employed would be cheaper – as it only applies to the earned income of those below the state pension age – at £5 billion a year for a 1p cut. Reducing the main rate of VAT, which history suggests is unlikely (as this is a tax rate that has been increased but never reduced), from 20% to 19% would cost £9 billion. Such tax cuts would doubtless be nice to have. But simply cutting the main rates of these taxes would represent a missed opportunity. For example, stamp duties on purchases of properties and shares are particularly damaging taxes and should be towards the front of the queue for growth-friendly tax cuts. More generally, the UK’s tax system is in dire need of reform. Given that improvements to the structure of taxes will generally create losers as well as winners, these reforms might well be easier to implement at a time when net tax cuts are being announced. So even if there were fiscal space for a substantial net tax cut, there would be a strong economic case for this being used to finance a package of genuine tax reform rather than cuts to the rates of unreformed taxes.
Endnotes
Authors


Martin Mikloš
Martin is a research economist at TaxDev and works on taxation in developing countries.

Isabel Stockton
Isabel works in the Healthcare sector, and on the public finances. Their research focuses on retaining and developing the NHS workforce.
More from IFS
Understand this issue


Policy analysis


Academic research


