
Downloads
Download as a PDF here
PDF | 777.31 KB
Key findings
1 Under the March 2023 Budget forecast, debt was forecast to stabilise at the end of the forecast horizon, leaving no scope for additional borrowing under the government’s current set of fiscal rules. But pressures on both revenue and spending are skewed to add to borrowing over the next few years, unless difficult decisions are made on spending cuts or tax rises.
2 Perhaps the most obvious risk to the current forecast is that the government has a stated indexation policy for fuel duties that stretches credulity to breaking point. Successive freezes that can be predicted in advance are in fact worse than a stated policy of non-indexation: we not only incur substantial costs to the public finances but the official forecast, for which the Office for Budget Responsibility (OBR) takes stated policy as given, is made less credible. Freezing fuel duties at their current rates – as the government surely intends – would reduce forecast revenues in 2027–28 by £6 billion. This and other known pressures that the OBR is nevertheless unable to include in its forecast mean the official forecast is not as ‘central’ as it should be. This is harmful for transparency and makes scrutiny of fiscal plans more difficult.
3 A further fiscal risk comes from the Chancellor’s new corporation tax full-expensing policy. This has been put in place for three years (2023–24, 2024–25 and 2025–26), adding around £10 billion a year to measured borrowing in those years. Jeremy Hunt has signalled his desire for it to be made permanent. The OBR has said that it could cost approaching £10 billion a year to do this. Making full expensing permanent would add to borrowing from March 2026, but, as stated in Chapter 10, a better estimate of the eventual direct fiscal cost would be around £1–3 billion a year.
4 In an environment of high and volatile inflation, cash-terms freezes to income tax and National Insurance thresholds are now set to raise much more than expected just months ago. An up-to-date inflation forecast suggests they could raise £52 billion in 2027–28 (or £43 billion if we include the cost of the big July 2022 uplift in the point at which employees and the self-employed pay National Insurance contributions, from which the level is now frozen). This is 40% more than the OBR’s March 2023 forecast and 6½ times as much as the original package of threshold freezes was expected to raise when announced in March 2021 (£8 billion). As perhaps could have been predicted, it means much of the large increase in the personal allowance implemented during the 2010s has not proven to be sustainable: the freeze could reverse two-thirds of that increase. It could also lead to a record two-thirds of adults paying income tax (and a record one-sixth of adults paying higher-rate tax). This large increase in taxpayer numbers could lead to pressure on the Chancellor, or his successor, to end the planned six-year freeze – much longer than any previously attempted or delivered – early.
5 Provisional spending totals beyond 2025 pencil in a 1% real-terms increase in day-to-day spending on public services each year. These spending plans are far tighter than those bequeathed by then Chancellor Rishi Sunak, implying around £15 billion less spending in 2027–28 than set out in his 2022 Spring Statement, and seem incompatible with the government’s – or for that matter the Labour opposition’s – appetite to spend. After taking account of commitments on the NHS workforce, the huge expansion of state-funded early-years childcare announced in the Budget, increased spending on defence and overseas aid (to meet stated commitments) and a likely protection of school budgets, ‘unprotected’ departments would need to shoulder cuts of 1.5% per year, or £9.4 billion in today’s terms, by 2027–28. Mr Hunt has also lowered planned spending on investment, with the size of this cut relative to the spending implied by the previous plans bequeathed by Mr Sunak rising to £13 billion in 2027–28.
6 Longer-term structural factors – for example, the ageing of the population and cost pressures on the health and social care budgets – also challenge the sustainability of the public finances. The OBR projects that spending on state pensions and health and social care will increase by 5% of national income – equivalent to £137 billion a year in today’s terms – up to 2050 and then continue rising. Accommodating these spending pressures would require deep cuts to spending elsewhere or a big further increase in tax.
7 There is inherent uncertainty around these long-run projections. On the one hand, there has been a significant increase in net immigration and slowing increases in life expectancy at older ages, both of which will ease some of the pressure on the public finances in the long term. On the other hand, steadily declining fertility rates will make it harder to finance growing ageing-related spending, over and above the latest OBR projections, as they will reduce the population of working-age adults in coming decades.
8 Long-term public finances challenges around ageing, health and social care, and the transition to net zero have been known about for years, but there is a temptation to always push addressing these issues to ‘tomorrow’ – or just beyond the reach of the current forecast horizon and specific fiscal targets. However, many of the effects of an ageing population are already showing today and will only become more pressing over coming decades. A detailed and coherent government strategy for tackling these pressures is urgently needed.
4.1 Introduction
Under the Office for Budget Responsibility’s March 2023 Budget forecast, the Chancellor was only meeting his commitment to have debt as a share of national income falling at the end of the forecast period by a hair’s breadth. This forecast is intended to reflect a ‘central’ expectation of how the public finances might evolve under current plans. In this chapter, we set out a number of policy issues that put pressure on this forecast and act as a threat to its ‘centrality’. Some areas, notably spending on incapacity and disability benefits, introduce genuine two-sided uncertainty – in other words, costs to the public finances, while very uncertain, might plausibly turn out either substantially higher or substantially lower than currently forecast. But most of them are pressures that appear likely to increase spending and reduce revenues, rather than the other way around. Furthermore, few of these pressures are temporary in nature. Additional borrowing to address them would therefore likely be permanent and would not be likely to be consistent with the government’s stated fiscal objectives.
The rest of this chapter proceeds as follows. First, we discuss risks to tax revenues, starting with the ongoing freeze to direct personal tax thresholds (Section 4.2) and moving on to full-expensing capital allowances (Section 4.3) and successive ‘temporary’ fuel duty freezes and cuts (Section 4.4). We then move on to spending, discussing spending plans for public services (Section 4.5), spending on benefits to support disabled people and those with health conditions (Section 4.6) and spending on support for housing costs (Section 4.7). We then consider the longer-term pressures on health and social care and pensions, including a comparison of how the UK’s long-term fiscal challenge compares with that faced in other countries (Section 4.8). In the final section, we offer some general recommendations on what all these challenges mean for the forthcoming Autumn Statement and beyond.
4.2 Freezes to direct personal tax thresholds
Rather than increasing each year in line with inflation (as measured by the CPI), which is the usual default, most direct tax thresholds in the personal tax system have been frozen in cash terms since at least April 2021. By far the most significant of these (in terms of the number of people affected and the resulting revenue raised) are the freezes to the income tax personal allowance. Rishi Sunak, as Chancellor, announced in his March 2021 Budget that this would be frozen at its 2021–22 level for four years (2022–23, 2023–24, 2024–25 and 2025–26). The same would hold for the income tax higher-rate threshold (and the upper earnings limit (UEL) in National Insurance contributions (NICs)). In his Autumn Statement of 2022, Jeremy Hunt – Mr Sunak’s successor but two as Chancellor – extended this for an additional two years, so it is now set to cover both 2026–27 and 2027–28 and run for a six-year period in total.
Alongside these freezes in income tax thresholds, the point at which employee and self-employed NICs start to be paid was increased by Mr Sunak in the 2022 Spring Statement to align them with the income tax personal allowance. Over the nine months from July 2022 to March 2023, this was costed by HM Treasury as a £6.3 billion tax cut (implying £8.4 billion over a 12-month period). But these thresholds – as they are aligned with the personal allowance – are now frozen. And in the Autumn Statement of 2022, Mr Hunt also extended the freeze to the point at which employer NICs start to be paid, which is another tax-raising measure. Under current policy, therefore, all of these thresholds are to remain at their current cash levels through to 2027–28.
Freezing these thresholds means they are less generous than if they were indexed in line with inflation, and the measure therefore brings in more revenue. The amounts raised by the decision to freeze will depend considerably on the rate of inflation: lower inflation would mean that a policy of freezing an allowance delivered a smaller tax rise. So the current period of high inflation means that more is raised – and the fact that inflation is much higher than was forecast when the freezes were announced means that more will be raised than was expected at the time of the original announcement.
How much revenue might the freeze raise?
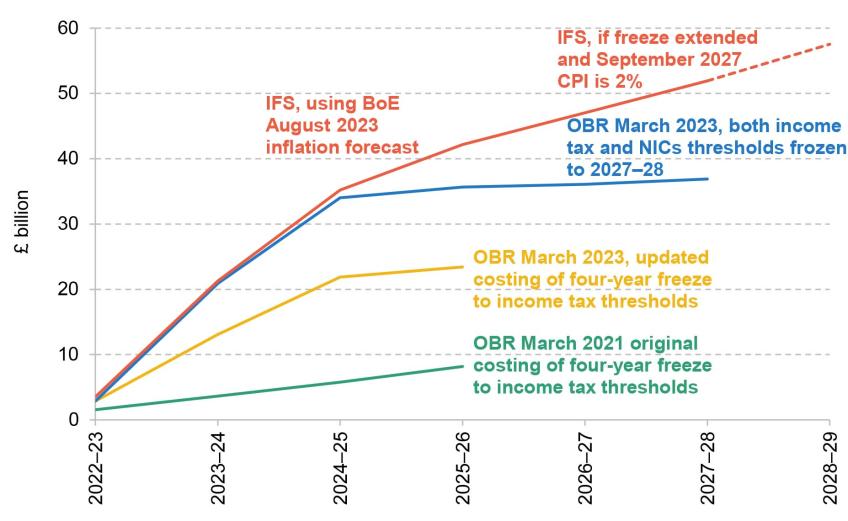
Different forecast vintages for the revenue raised from this package of measures are shown in Figure 4.1. The March 2021 Budget announcement to freeze both the income tax personal allowance and the higher-rate threshold (and UEL) was forecast to raise £8.2 billion in 2025–26 (the final year of the then planned four-year freeze). But that estimate was predicated on a forecast for a much lower rate of inflation. The March 2023 Budget contained an updated number, suggesting that the four-year freeze to the income tax personal allowance and higher-rate threshold was now forecast to raise £23.4 billion in 2025–26, almost three times the original estimate.
Figure 4.1. Forecast revenue raised from freezes to income tax and National Insurance thresholds
Note: Excludes the estimated cost of the 2022 Spring Statement decision to increase the NICs primary threshold.
Source: Authors’ calculations using table A of OBR’s March 2023 Economic and Fiscal Outlook, page 191 of OBR’s March 2021 Economic and Fiscal Outlook, Bank of England’s August 2023 Monetary Policy Report and https://www.gov.uk/government/statistics/direct-effects-of-illustrative-tax-changes.
With other NICs thresholds also frozen, and the planned duration of the freeze extended to 2027–28, our calculations suggest that under the March 2023 Budget forecast, the package of freezes would raise around £37 billion in that year (or £28 billion if one takes off the revenue cost of the uplift in the point at which employees and the self-employed pay NICs that came into effect in 2022–23). But this assumes very low rates of inflation in 2024, 2025 and 2026. If we instead calculate revenue based on the latest inflation forecasts from the Bank of England (August 2023) and assuming that beyond 2026Q3 inflation remains at 2%, it looks like the freeze to both income tax and NICs thresholds is now on course to raise £52 billion in 2027–28 (or £43 billion if subtracting the cost of the increase in the point at which employees and the self-employed pay NICs). This would be 40% more than implied by the OBR’s latest forecast. It is driven by the fact that the OBR’s forecasts imply that, absent the freeze, the income tax thresholds would have risen by 21.2% between 2021–22 and 2027–28 whereas under the Bank of England’s forecasts (and assuming 2% inflation after the end of its forecast horizon) they would have risen by 29.7%.
This is a huge tax rise. To give a comparison, the biggest single tax-raising measure in recent history was the June 2010 Budget decision to increase the main rate of VAT from 17½% to 20%, which is estimated to raise £21 billion in 2027–28. Or, to put it another way, other ways to raise roughly £52 billion of revenue include increasing both the basic and higher rate of income tax by 6p, or increasing the main rate of VAT from 20% to 26%.
While the stated plan at the moment is to freeze income tax and NICs thresholds through to the end of 2027–28, something different could happen in the end. For example, in the forthcoming Autumn Statement, when presented with a fiscal forecast horizon that continues to 2028–29, Mr Hunt could decide to extend the freeze for an additional year. Assuming that inflation was at its 2% target in September 2027, we estimate this would raise an additional £6 billion in 2028–29, bringing the total tax yield from the package of freezes up to £58 billion in that year. Of the £6 billion, about £4.6 billion would come from an additional year’s freeze in the income tax personal allowance (and the point at which employees and the self-employed pay NICs, which is aligned to this point), £0.4 billion would come from freezing the higher-rate threshold (and the NICs UEL), and £0.5 billion would come from freezing the point at which employer NICs begin to be paid.
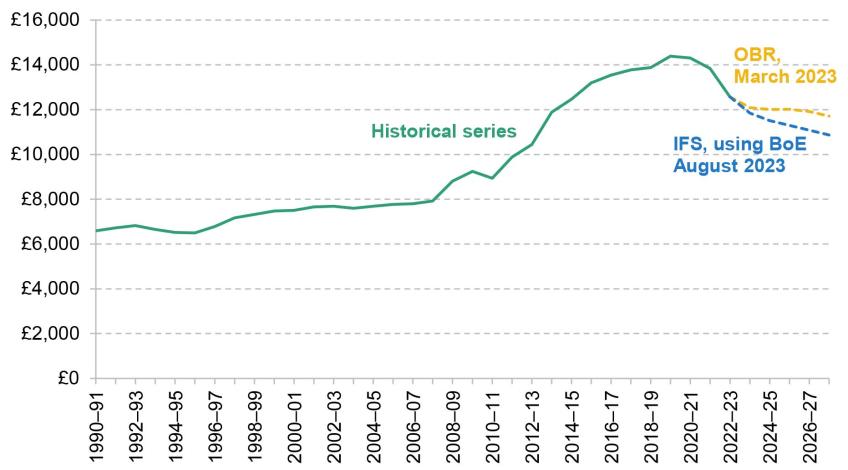
Conversely, it is also possible that the freeze is ended sooner. In recent history, the UK has frozen the income tax personal allowance on a number of occasions (1981–82, 1993–94 and 1994–95, 2003–04, 2010–11 and 2020–21)1 but never more than two years in a row. That is not to say that a previous Chancellor has tried and failed – it could simply be that it has not been done before because it has not been attempted. But freezing these thresholds through to 2027–28 would certainly be unprecedented by recent historical standards. Figure 4.2 shows the value of the personal allowance in real terms over time, both under the March 2023 OBR forecast and under the latest Bank of England (August 2023) forecast. The 2010s saw large increases in the personal allowance as Conservative Chancellors George Osborne and Phillip Hammond decided to increase it by much more than inflation. But perhaps unsurprisingly, it seems that much of this substantial tax cut has not proved to be sustainable. Under the OBR’s forecast, the six-year freeze would, by 2027–28, reverse half (49%) of that enormous increase. Under the Bank of England’s inflation forecast, we calculate that two-thirds (65%) of the earlier increase would be reversed. In both cases, the personal allowance in 2027–28 would fall in real terms to below its level in 2013–14. But it would also be true to say that, in either case, the personal allowance would in real terms remain above the level seen in any year prior to 2013–14, and over a fifth above its real-terms level in 2010–11.
Figure 4.2. Real value of the income tax personal allowance (2022–23 prices)
Source: Authors’ calculations using OBR’s March 2023 Economic and Fiscal Outlook and Bank of England’s August 2023 Monetary Policy Report.
This is only part of the story. Those aged 65 and over used to be able to receive an enhanced income tax allowance, but this was phased out between 2010–11 and 2015–16 at the same time as there were sharp increases in the personal allowance. As a result, the tax-free allowance for this group has already been reduced to below its 2008–09 level, and under the ongoing freeze in 2027–28 it is set to be reduced to its lowest real-terms value since 2002–03.
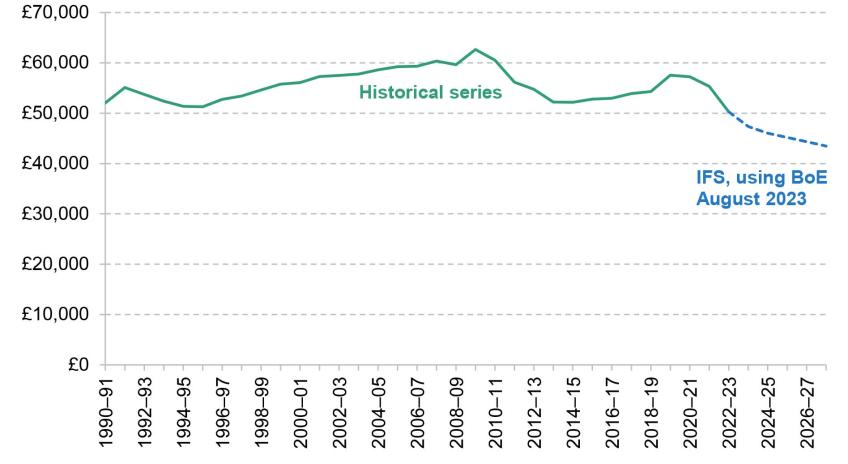
For the higher-rate threshold the story is also different (see Figure 4.3). Between 2010–11 and 2015–16, its value was actually cut in cash terms, let alone real terms, as the government wanted the gains from the large increases in the personal allowance to be more targeted at basic-rate taxpayers than they would otherwise have been. As a result, the current value of the higher-rate threshold, £50,270, is already 22% lower in real terms than it would be had it increased in line with inflation since 2010–11. Freezing this threshold through to 2027–28 would, under the Bank of England’s August 2023 forecast, lead to it falling to 28% lower than its 2010–11 level.
Figure 4.3. Real value of the income tax higher-rate threshold (2022–23 prices)
Source: Authors’ calculations using OBR’s March 2023 Economic and Fiscal Outlook and Bank of England’s August 2023 Monetary Policy Report.
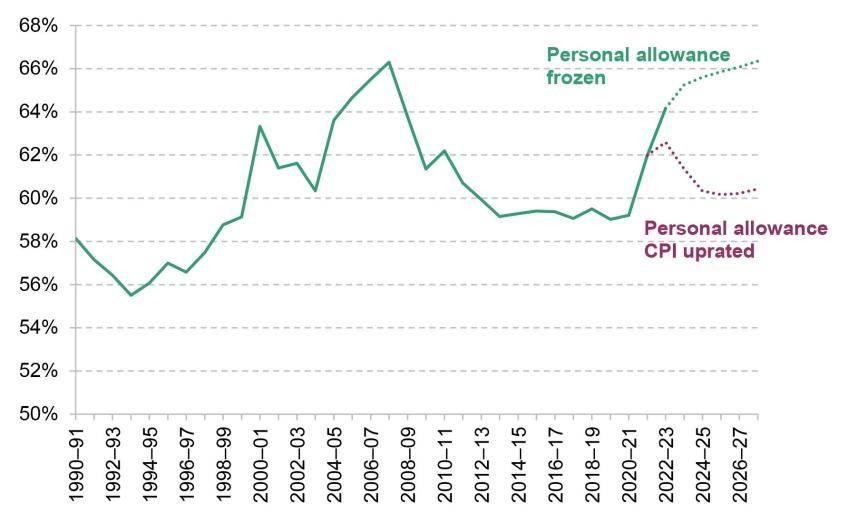
How many more people will be brought into income tax?
These large real cuts to the personal allowance are bringing more people into the scope of income tax, with real income growth over time meaning that this share is forecast to increase. Figure 4.4 shows how the share of adults paying income tax over time has changed, alongside forecasts for how the share would be expected to evolve were the personal allowance to be frozen or were it to be increased in line with inflation. This shows that freezing the personal allowance is now forecast to increase the share of adults paying income tax to above 66%, a level that has only been seen once before (in 2007–08 at the end of Gordon Brown’s Chancellorship). This compares with the 60% it would have been had the personal allowance not been frozen. The growing share of adults paying tax, and demographic change, mean that the overall number of taxpayers is forecast to increase from 31.7 million in 2020–21 to 38.2 million in 2027–28.
Figure 4.4. Income tax payers as a share of adults
Source: Updated from Waters and Wernham (2022), based on HMRC’s Income Tax Statistics and Distributions, OBR’s March 2023 Economic and Fiscal Outlook and Bank of England’s August 2023 Monetary Policy Report.
Over this period, growth in the number of income tax payers has been entirely down to growing numbers of those aged 65 and over paying income tax. This is due to three factors: demographic change; income growth among those aged 65 and over outstripping that of younger individuals; and the phasing-out of pensioner tax allowances described above. Between 2007–08 and 2023–24, while the overall number of income tax payers increased by 3.4 million (from 32.5 million to 35.9 million), the number of individuals aged 65 and over paying income tax increased by 3.7 million (from 4.8 million to 8.5 million) and the number of individuals aged under 65 paying income tax fell by 0.3 million (from 27.7 million to 27.4 million). Looking at the share of those aged 65 and over who are paying income tax, this has risen dramatically over time: from 36% in 1990–91 to 44% in 2000–01, 49% in 2010–11 and 62% in 2022–23.
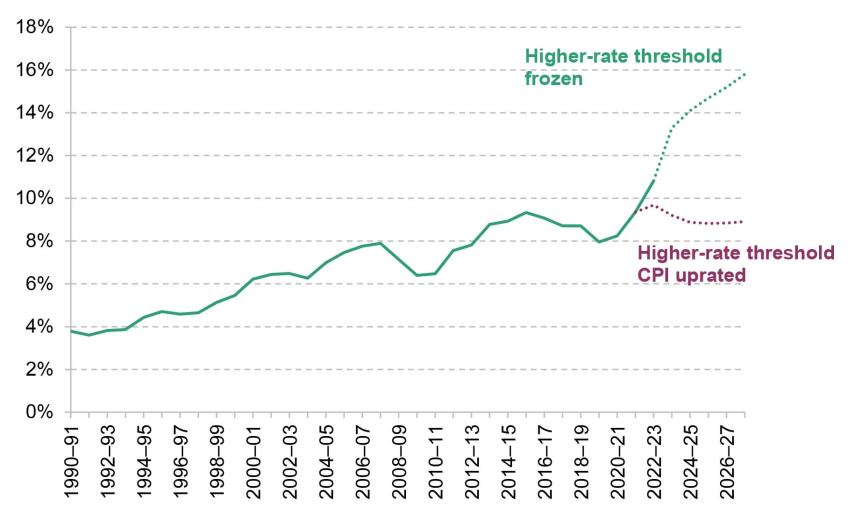
The share of adults paying higher (or additional) rates of income tax is shown in Figure 4.5. We project that if the higher-rate threshold continues to be frozen, almost one-in-six adults would pay higher-rate tax in 2027–28, a record high. In other words, in that year, there would be almost 80% more individuals paying higher-rate tax than there would have been had the threshold been inflation indexed. The growing share of adults paying higher (or additional) rates of tax, and demographic change, mean that the overall number of taxpayers paying those rates is forecast to more than double from 4.4 million in 2020–21 to 8.9 million in 2027–28. The increasing size of the real-terms cut to the personal allowance and higher-rate threshold, and the increasing shares of adults brought into tax and brought into higher-rate tax as a result, might add to political pressure to curtail the freeze before it reaches its sixth year.
Figure 4.5. Higher- and additional-rate tax payers as a share of adults
Source: As for Figure 4.4.
This is not to say that a government should never cut the personal allowance (or other thresholds in the income tax or NICs systems). The issue is that relying on a cash freeze to deliver the real cut means that the resulting generosity of the system, and the tax rise implemented, will depend on how inflation turns out, which is impossible to know in advance. A more coherent way to reduce the generosity of the system would be to (for example) increase allowances by inflation minus (say) 1 or 2 percentage points for a set number of years. This would deliver a certain reduction in the real-terms generosity of the chosen parameters and a more certain revenue raise. The political benefit of a freeze is, of course, that it might not look like a tax rise – if incomes are constant, an individual’s tax bill will not rise in cash terms from one month to the next. It is, nonetheless, not the ideal way to make policy. Were the freeze to end a year earlier, we estimate this would reduce revenues in 2027–28 (relative to the freeze remaining in place in that year) by about £5 billion.
4.3 Full-expensing capital allowances
In the March 2023 Budget, the Chancellor announced that from 1 April 2023 to 31 March 2026 100% of the cost of all spending on certain plant and machinery – rather than (for firms that have exhausted their annual investment allowance) the standard rate of 18% – could immediately be deducted from profits before tax. This ‘full expensing’ is a substantial policy development: it was costed by the Treasury as adding an average of just under £10 billion a year to public sector net borrowing over the three-year period it is in place2 . In the March 2023 Budget speech, Mr Hunt stated his ‘intention to make it permanent as soon as we can responsibly do so’. The merits of this policy – as a temporary three-year policy or a permanent policy – are discussed in Chapter 10. Here we focus on the impacts on the public finances.
Were the policy to be made permanent, it would have the direct impact of reducing corporation tax revenues, and therefore pushing up public sector net borrowing and public sector net debt, beyond March 2026. Costing this policy accurately is challenging. The Office for Budget Responsibility (2023a) has noted the Chancellor’s intention to put the policy in place permanently and stated that this ‘could cost amounts approaching £10 billion a year’. The near-term increase in borrowing from making this policy permanent could be around this figure. But – as set out in Chapter 10 – when estimating the fiscal impact of this policy, it is important to take account of the fact that subsequent corporate profits will be boosted by the measure. This effect is substantial: the eventual annual impact of the policy will be to increase borrowing by around £1–3 billion a year (with the actual reduction being sensitive to the assumed discount rate).3
That said, the intention to make the policy permanent does represent a risk to the public finances, as delivering it would add perhaps as much as £10 billion a year to measured borrowing in four or five years’ time – and add a similar amount to public sector net debt – but with the annual impact on borrowing falling to considerably less than that over the longer term. This much smaller impact on the public finances over the longer term perhaps begs the question why it was not introduced as a permanent measure. The suspicion has to be that the Chancellor was overly focused on the near-term impact on the public finances, and in particular how it would interact with his specific pledge to have debt falling in five years’ time, rather than on the long-run cost and merits of the policy – if so, that is not a good way to make policy.
4.4 Fuel duties
Stated policy is for the rates of fuel duty to increase each year in line with the Retail Prices Index (RPI). The shortcomings of the RPI as a measure of inflation aside, this is a sensible policy: it is difficult to think of an economic reason to cut the real value of fuel duties continually year-on-year by whatever the rate of inflation happened to be. However, fuel duties indexation has become something of a joke, with a succession of one-year freezes announced every single year since 2011, while Chancellors insist on simultaneously maintaining the pretence that in a year’s time the rate would indeed be indexed. This is an expensive policy: the OBR estimated in March that the freezes have cumulatively cost around £80 billion up to this point, even after accounting for the fact that fuel consumption would have been lower had the rates of fuel duties not been cut in real terms. In addition, the ‘temporary’ one-year 5p rate cut introduced in March 2022 was extended, supposedly for just one more year, this past March. Together with the successive cash freezes, this has led to revenues from fuel duties in 2023–24 being forecast to be the same in nominal terms as they were in 2008–09, and around £14 billion lower in 2023–24 than had they been increased in line with the RPI since 2010–11.
The decision to extend the 5p rate cut, instead of allowing it to expire and increasing rates in line with the RPI, cost £4.8 billion in the coming year alone. Figure 4.6 shows how fuel duty revenues were forecast to increase in line with RPI indexation at each fiscal event, only for another freeze to be announced and the increase postponed for another year. If rates continue to be frozen, the figure shows that revenues in 2027–28 are forecast to be around one-third of the share of national income that they were in the late 1990s; in today’s terms, revenues in 2027–28 would be £33 billion lower than had they remained at the 2.0% of national income seen in 2000–01.
Figure 4.6. Successive forecasts for fuel duty revenues

Source: Chart 4.4 of OBR’s March 2023 Economic and Fiscal Outlook.
Successive freezes that can be predicted in advance are in fact worse than a stated policy of non-indexation: not only do we incur substantial costs to the public finances but also the official forecast, for which the OBR is obliged to take stated policy as given, is made less credible. This damages the transparency of fiscal policymaking and makes scrutiny of the government’s actual plans – as opposed to stated plans that lack any credibility – more difficult. Fuel duties are a prominent example of this issue, but it extends to other policies, most importantly spending plans that are so tight as to be undeliverable in the context of stated ambitions for various public services, as discussed below.
The requirement to take stated policy as given has protected the OBR from pressures to analyse many different policy scenarios (potentially more than its resources allow) and produce some scenarios that could be politically contentious (such as costing the commitments of political parties that are seeking office or the fiscal consequences of outcomes of referendums – such as those on Scottish Independence and Brexit – going against the government’s stated preference). Nevertheless, in cases such as the indexation of fuel duty rates, where likely government policy appears so clearly to deviate from stated government policy, it would seem better for transparency and the credibility of the OBR’s forecasts for it to base them on likely government policy. As the Treasury Select Committee (2023) put it, doing so would ‘make for a more credible forecast’. At the time of the March 2023 Budget, the OBR estimated that were fuel duty rates to remain at their current cash level, rather than the 5p cut being allowed to expire and the rates being increased in line with the RPI, this would reduce revenues in 2027–28 by £4 billon. The outlook for inflation has increased since then, which will push up the expected cost of a continued freeze – continuing the freeze to 2027–28 might now reduce revenues in that year by around £6 billion.
Revenues from fuel duties in the longer term
In the longer term, a more fundamental issue with fuel duties is that the tax base will disappear as we transition to net zero by 2050. As part of this, the government has committed to ending sales of new petrol and diesel cars, though the Prime Minister recently pushed this back from 2030 to 2035. While the use of electric vehicles does not generate externalities in the form of emissions, it does generate congestion. There is therefore a case for taxing it (in addition to the wish to replace lost revenue from fuel duties). The phasing-out of combustion-based vehicles in favour of electric ones is not a new or surprising trend – both the issue and the principles of a solution (Adam and Stroud, 2019) have been known for years. Earlier forecasts consistently undershot the actual adoption of electric vehicles (Figure 4.7), meaning that the costs of inaction are higher than initially thought.
Figure 4.7. Successive assumptions for electric vehicles as a share of new car registrations
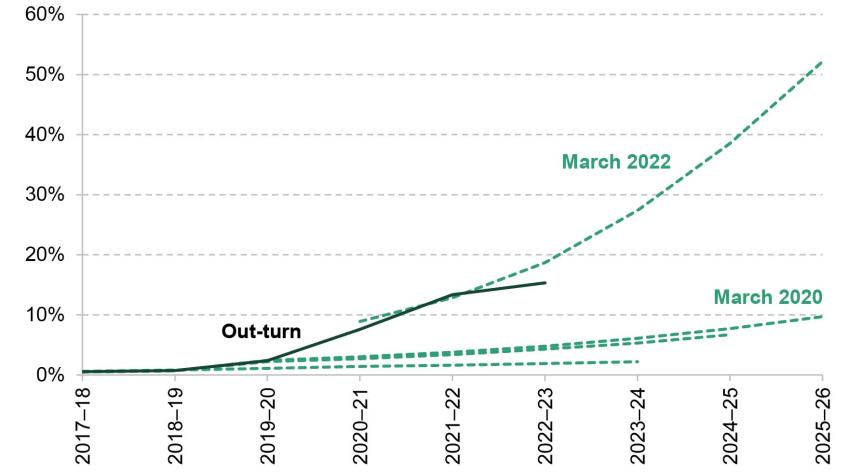
Source: OBR’s July 2021 Fiscal Risks Report and March 2022 Economic and Fiscal Outlook; Department for Transport and Driver & Vehicle Licensing Agency’s vehicle licensing statistics data tables.
4.5 Spending on public services
Day-to-day spending
Detailed departmental spending allocations currently run until 2024–25, with planned cumulative real-terms growth in total day-to-day spending in this year and the next (i.e. over the two years between 2022–23 and 2024–25) of 3.3%.
Under current plans, real-terms day-to-day spending on public services is set to have risen by 20% over the course of this parliament, between 2018–19 and 2024–25. This is an increase of 3.0% per year on average between 2018–19 and 2024–25, which compares with 4.1% a year on average over the New Labour governments (from 1998–99 to 2009–10) and minus 0.9% per year on average over coalition and Conservative governments between 2009–10 and 2018–19. This increase has not been spread evenly across departments, as Figure 4.8 puts in context. Some areas have seen much larger rises: day-to-day spending on transport, for example, has almost doubled, with a big increase in spending on subsidies for railways and local public transport since the pandemic. The Health and Social Care budget has grown by a little more than the average (21%). Other budgets have fared less well. Justice and Education have risen by less than the average (by 12% and 14%, respectively). Day-to-day spending has in fact fallen in real terms in some departments since 2018–19 – the Foreign, Commonwealth and Development Office is set to have faced cuts of almost 30% by 2024–25, Housing and Communities faces cuts of 24%, and the Defence resource budget will be around 1% lower at the end of this parliament than it was at the beginning.
Figure 4.8. Real-terms change in day-to-day spending by department, between 2018–19 and 2024–25
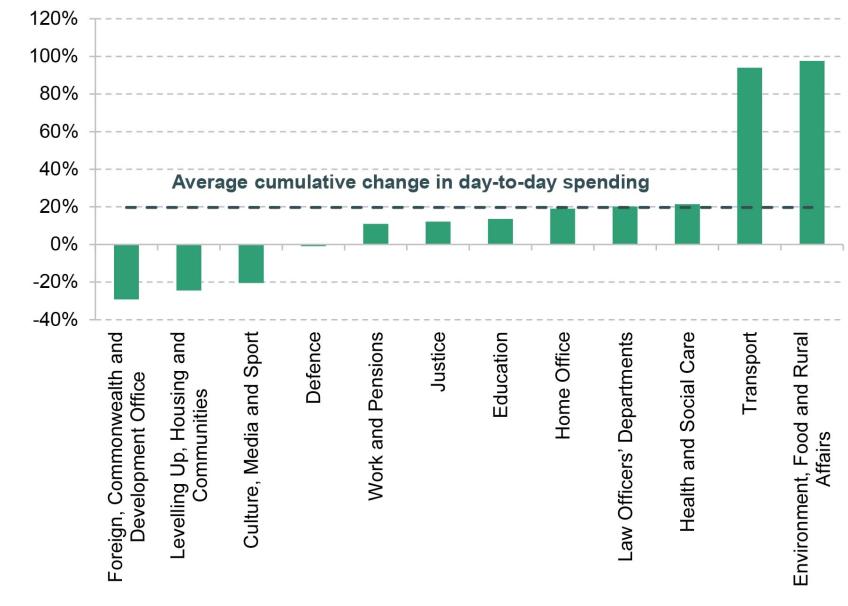
Source: Authors’ calculations using HM Treasury’s Public Expenditure Statistical Analyses 2023.
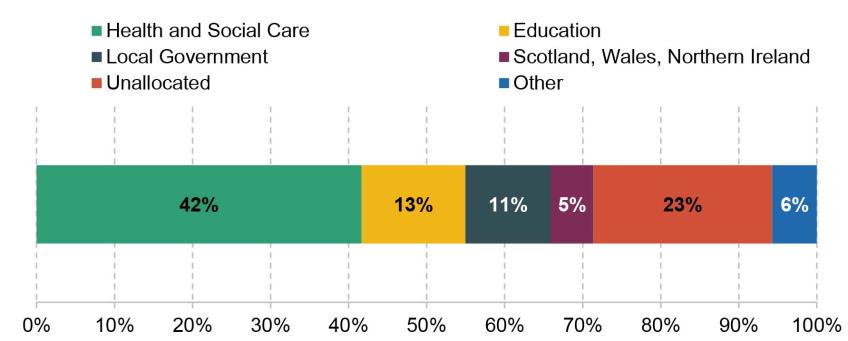
More than half of the overall increase in day-to-day public service spending over the course of this parliament – which amounts to £135.9 billion in cash terms, or £73.7 billion in 2023–24 prices – can be attributed to just two areas: health and education. Figure 4.9 shows that 42% of the overall increase (£30.7 billion in 2023–24 prices) went to the Department of Health and Social Care, with a further 13% (£9.8 billion) going to the Department for Education. 16% of the increase went to English local government and the devolved governments (11% and 5%, respectively). A sizeable chunk of spending in 2024–25 (around £17 billion), equivalent to around a quarter of the increase since 2018–19, is yet to be allocated to departments.4 Given the likely need for ongoing support towards the Ukrainian war effort, the spending pressures associated with higher public sector pay awards, and the high-profile budgetary challenges faced by councils and NHS trusts, we might expect the majority of this to be allocated and spent. Other spending combined – including on justice, housing, and policing – only contributed 6% of total day-to-day spending growth.
Figure 4.9. Contribution to day-to-day growth in public spending between 2018–19 and 2024–25
Source: Authors’ calculations using HM Treasury’s Public Expenditure Statistical Analyses 2023.
Spending plans for the years beyond 2024–25 (and so beyond the next election) consist of provisional spending totals. Decisions on how these will be shared between departments have not been made yet (a full Spending Review is due by the end of 2024). In March 2022, spending was planned to grow by 1.9% in 2025–26 and 1.7% in 2026–27, in line with projected real GDP growth. In November 2022, these provisional spending totals were cut back, with spending instead planned to grow at a rate of 1% in real terms each year up to 2027–28. This reduced planned spending by £6.8 billion in 2025–26, and implied a cut (again relative to previous plans) rising to £21.5 billion in 2027–28. In March 2023, the government announced additional spending on childcare and defence, and the spending totals for future years were revised upwards accordingly (an extra £4.9 billion in 2024–25, rising to £6.6 billion in 2027–28). The annual growth rates beyond 2024–25 were left effectively unchanged (because the additional spending also applies to 2024–25, the baseline year from which those growth rates are calculated).
At first glance, this may not look particularly challenging – after all, there would be no overall cuts, with public service spending growing in each year even after accounting for inflation. And it would come after a five-year period of substantial real increases. But given the government’s ambitions in a number of areas, keeping growth in total spending within this limit is likely to prove extremely challenging.
To illustrate this, Figure 4.10 shows what the implications of this tight spending envelope might be, under a set of plausible assumptions. In this scenario, NHS funding is assumed to grow at a rate of 3.6% in real terms, just below its long-run average growth rate. Analysis in Chapter 8 of this Green Budget suggests that this is the increase that would be required, under a central set of assumptions, to deliver the ambitious long-term NHS workforce plan published in June. Defence spending and spending on overseas aid are assumed to be maintained as a proportion of national income.5
Figure 4.10. Illustrative change in real-terms day-to-day funding implied by latest plans, 2024–25 to 2027–28
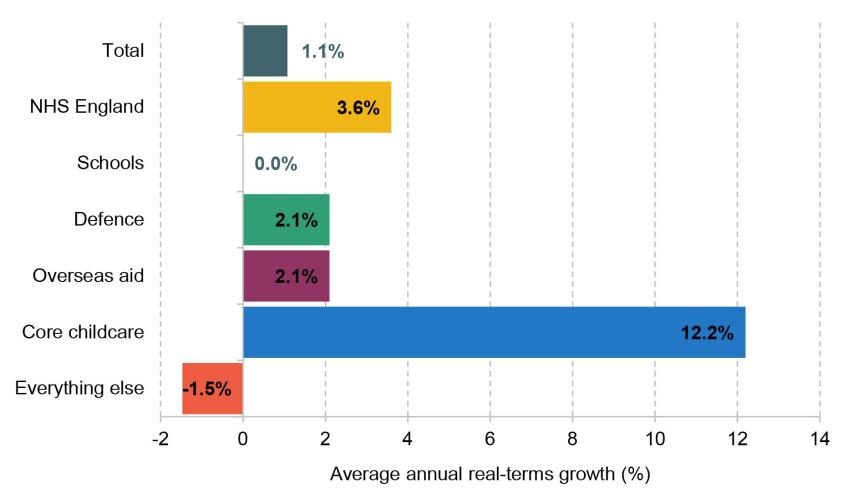
Source: HM Treasury’s Autumn Statement 2022 and Spring Budget 2023.
We assume that schools funding is frozen in real terms, implying slight increases in per-pupil spending as pupil numbers fall. Per-pupil freezes (and, temporarily, cuts) have been delivered in the past. However, with schools facing increasing demands around mental health, compensating for learning loss during the pandemic and tackling persistent absenteeism, freezes may be harder to deliver now than they were in the past. And small reductions in pupil numbers do not immediately lead to a matching reduction in costs for schools. Finally, the core childcare budget needs a large increase to fund the big expansion of free childcare to younger children announced in Mr Hunt’s March 2023 Budget.
Delivering these increases in spending, while keeping to the overall spending envelope, would require average real-terms cuts to everything else (the ‘unprotected’ areas) of 1.5% a year – totalling £9.4 billion by 2027–28.6 Many of these areas, including local government (responsible for adult and children’s social care), criminal courts and prisons,7 are facing growing demand and significant cost pressures, and are already showing signs of strain.
Another issue is that the figure of a 1.1% overall real-terms increase may not reflect the price pressures faced by departments. For one thing, it is based on the OBR’s March forecast for inflation, which sees inflation falling to a very low level in the later forecast years – the forecast is for economy-wide inflation to be between 1.0% and 1.7% in the next three years. In Chapter 3, we discuss Citi’s current economic forecast, which anticipates economy-wide inflation closer to ‘normal’ levels (those thought to be the long-run equilibrium) – between 1.8% and 2.2%. If this later forecast is correct, the squeeze on departmental budgets would be more intense than the above numbers suggest – unless spending totals were topped up to compensate.
In addition, economy-wide inflation – as captured by the GDP deflator, the measure typically used to calculate real-terms changes in public service spending – may understate cost pressures departments face. For example, it does not include price changes for imported goods, such as energy, and has been running behind wage growth in the whole economy, one of the factors putting pressure on public sector pay settlements. The costs that departments actually have to pay may therefore, at least in some cases, rise faster than this measure suggests. In turn, this means that spending settlements may not stretch as far as the real-terms numbers suggest.
Past experience also suggests that spending totals are likely to end up higher than is currently pencilled in when it comes to specifying a detailed allocation across departments. At Spending Reviews since 2010, departmental spending totals have been topped up by an average £14.3 billion per year; at the 2021 Spending Review, they were topped by an average £30.6 billion (Atkins and Lanskey, 2023). Under our (conservative) assumptions about protected departments’ spending, this would be more than enough to avoid cuts for unprotected departments in this case.
Investment spending
Public sector net investment – the broadest measure of government investment – has oscillated over the parliament, but is set to average 2.5% of national income between 2019–20 and 2024–25, well above the 1.5% average over the previous 40 years. After 2024–25, current plans imply a sharp reduction in government investment as a fraction of national income (Zaranko, 2023), though investment will still be relatively high by historical standards.
Notably, the government is now planning to spend considerably less on investment in the medium term than under the plans bequeathed to Mr Hunt by Mr Sunak. This is most obvious if we look at plans for departmental capital spending (which abstracts away from other elements of public sector net investment, such as the ‘investment’ associated with student loans).
These are shown in Figure 4.11. Under current plans, capital budgets are set to increase in real terms by 34% over the course of this parliament. This increase, of £26.6 billion in 2022–23 prices or £39.0 billion in cash terms, was concentrated at the beginning of the parliament.8 Between 2019–20 and 2020–21, capital budgets rose by £23.6 billion in cash terms, from around £70 billion to £94 billion. This sharp increase accounts for 60% of the total cash-terms increase over the course of the parliament: although capital budgets continued to rise after 2020–21, this was at a slower pace.
Figure 4.11. Capital spending limits between 2018–19 and 2027–28 (cash terms)
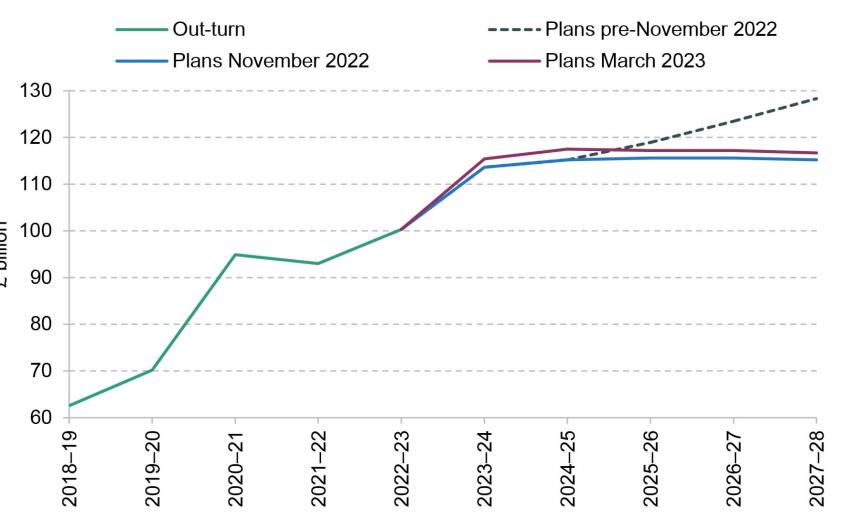
Note: ‘Pre-November 2022’ line takes November 2022 plans for capital spending as given until 2024–25, then assumes capital spending grows with nominal GDP growth as projected in November 2022 for 2025–26, 2026–27 and 2027–28 (3.2%, 3.8% and 3.9%). November 2022 and March 2023 lines are taken from the Autumn Statement 2022 and Spring Budget 2023 tables, respectively. Values for 2023–24 and 2024–25 exclude the OBR’s estimate of the likely departmental underspend.
Source: HM Treasury’s Autumn Statement 2022, Spring Budget 2023 and Public Expenditure Statistical Analyses 2023.
Under the plans inherited by Mr Hunt (labelled as the pre-November 2022 plans in the figure), capital budgets were set to then increase in line with the cash size of the economy – by 3.7% per year – after 2024–25. In the 2022 Autumn Statement, Mr Hunt chose instead to freeze those budgets in cash terms after 2024–25. We estimate that this represented a cut of £3.3 billion to planned investment spending in 2025–26, compared with the counterfactual where spending instead grew in line with GDP, rising to a cut of £13.1 billion in 2027–28.
Those plans were then topped up slightly in March 2023, with additional funding primarily going to the Ministry of Defence, but capital spending is still projected to be flat in cash terms after 2024–25. So, although departmental capital budgets will be considerably higher than before the pandemic, they face real-terms cuts over the next Spending Review period. Sticking to these plans could prove challenging. Pressures to invest more in public services are numerous, with a defence strategy that involves an increased emphasis on equipment and technology, a schools and hospitals estate in high-profile difficulties, a major new hospital building programme, and additional public investment required to support the transition to net zero. Achieving all of that while keeping overall investment spending constant in cash terms implies big cuts elsewhere.
4.6 Incapacity and disability benefit spending
Over the 2010s, spending on benefits for disabled people and those with health conditions grew relatively strongly among both children and working-age individuals. Moreover, this growth was despite the replacement of disability living allowance (DLA) with personal independence payment (PIP), which was intended to reduce both working-age claimant numbers and the associated spending by 20% (HM Treasury, 2010).9
Table 4.1 shows that since the pandemic, benefit expenditure on these groups has increased more quickly than over the 2010s. That is perhaps not surprising. But what is surprising is that it is now forecast by the OBR to grow even more quickly over the next five years through to 2027–28. The majority of spending to support those with health conditions is on working-age individuals and spending on this component is forecast to increase (in real terms) by £19.3 billion, from £54.3 billion in 2022–23 to £73.5 billion in 2027–28, which would be an increase of 36%. Spending on children is forecast to increase by £2.1 billion, which would represent an astonishing 71% growth over just five years. In both cases, this would represent a sharp acceleration compared with the growth seen previously. For example, spending on working-age individuals is forecast to grow more than twice as quickly as it did during the 2010s: spending in 2027–28 is forecast to be about £10 billion higher in today’s terms than if spending grew at the 3.0% a year seen over the decade up to the pandemic. For children, the acceleration in the growth rate is even stronger: spending is forecast to grow by 11.3% a year over the next five years compared with 2.5% a year over the 2010s.
Table 4.1. Benefit expenditure to support disabled people and those with health conditions
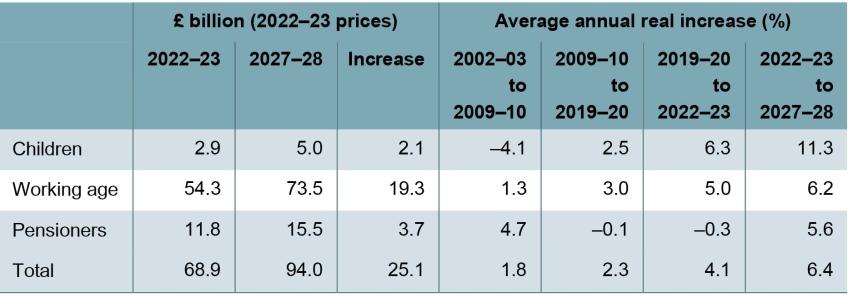
Note: DWP spending only. Includes incapacity benefits (including the standard allowance and health element of universal credit), disability benefits, carer benefits, industrial injuries benefits, and both housing benefit and universal credit housing element for those in the disabled, incapacity or carer groups. For those benefits that are devolved during the period, the coverage is England and Wales throughout for consistency.
Source: Authors’ calculations using table 4(ii) of Department for Work and Pensions, ‘Benefit expenditure and caseload tables’, April 2023 (https://www.gov.uk/government/publications/benefit-expenditure-and-caseload-tables-2023).
Part of this increase in spending over the next few years can be explained by the fact that these benefits are, by default, uprated by a lagged measure of household inflation (the Consumer Prices Index), whereas for the purposes of deflating public spending we instead use a contemporaneous measure of economy-wide inflation (the GDP deflator). Inflation is falling and economy-wide inflation is currently much lower than household price inflation. This lag, and difference in inflation measure, explains cumulative real-terms growth (relative to the GDP deflator) of 9% over the five years to 2027–28.
By far a bigger part of the increase in forecast spending is due to the forecast for rising claimant numbers, which are the result of the much-elevated rates of flow onto benefits seen since the pandemic. For example, the number of disability benefit recipients is forecast to increase by 35%, from 5.5 million in 2022–23 to 7.4 million in 2027–28. Were this growth to materialise, the increase of 1.9 million over just five years would be slightly bigger than the increase in claimant numbers seen over the previous 23 years (from 1999–2000 to 2022–23). Again, particularly striking is that the number of children receiving DLA is forecast to grow by 48% over the five years, from 582,000 in 2022–23 to 862,000 in 2027–28. That so many more individuals are expected to qualify for this support is obviously extremely concerning. What data there are suggest the increase can be seen at all ages, with increases in claims associated with both physical and mental health conditions.
Spending on working-age households
A breakdown of this spending by benefit type for working-age households is shown in Figure 4.12. Of the £19.3 billion forecast increase in real-terms spending between 2022–23 and 2027–28 (shown in Table 4.1), close to half (£9.2 billion) is from a rise in forecast spending on disability benefits – that is, benefits intended to support those who face additional costs due to disability regardless of their household income or whether they are working. This is primarily spending on PIP. Another £6.6 billion is from a rise in forecast spending on the personal allowance and health-related payment for those on universal credit (UC) with a health condition, which is intended to support those in low-income households whose health condition limits their ability to do, or seek, paid work. These would represent cumulative increases in spending of 57% and 29% respectively. Spending on carers’ benefits, and spending on support for housing costs among the latter group (either through housing benefit or within UC) are also forecast to rise. With more individuals qualifying for financial support for disability or health-related conditions, we might also expect increased demands on some public services, most obviously (but not limited to) the National Health Service.
Figure 4.12. Benefit spending to support working-age disabled people and those with health conditions, 2022–23 prices
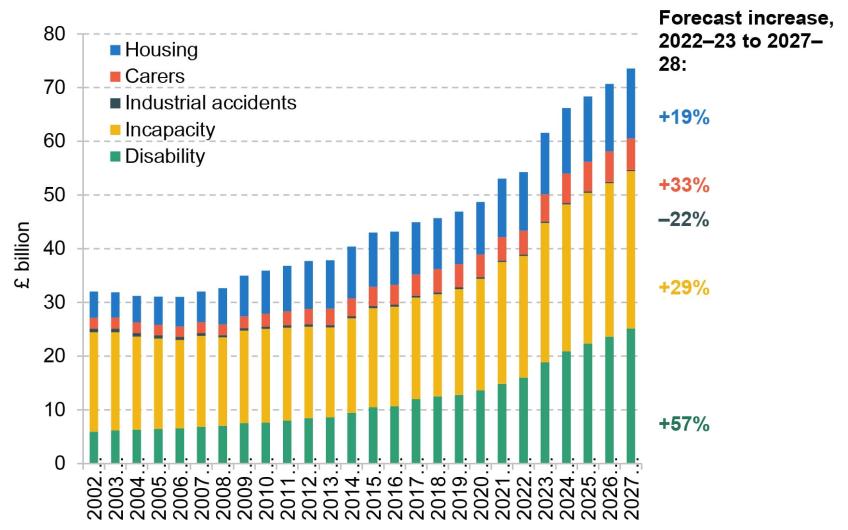
Note and source: As for Table 4.1.
The increase in spending on UC is despite the decision made by Mr Hunt in his 2022 Autumn Statement to delay moving existing claimants of employment and support allowance onto UC until April 2028. This was estimated to reduce spending in 2027–28 by £0.3 billion and, perhaps rather conveniently, pushed the fiscal cost of this final part of the roll-out of UC to beyond the end of the five-year fiscal forecast horizon. If a desire to suppress spending in 2027–28 in order to make it easier to have debt falling in that year was the motivation, then this is not a good way to make policy.
There are clear risks to the public finances from this area of spending. Most obviously, the rapid recent increase in spending on these benefits creates considerable uncertainty over whether this is likely to accelerate further or to stabilise or even to reverse. So it could be that spending turns out to grow even faster than forecast. Were spending to grow by 1 percentage point faster each year for the next five years – a big change in normal circumstances but perhaps not in the current climate – this would add almost £5 billion to spending in 2027–28. There is also the upside risk for the public finances that such growth might not materialise and spending actually undershoots the forecast. Indeed, the most recent data suggest that the claim rate for PIP has started to fall back – though it still remains well above that seen in the couple of years leading up to the pandemic.10 More generally – as shown in Figure 4.13 – since its inception, the OBR has consistently tended to underestimate what spending on working-age disability benefits will be. And sometimes considerably so: in the Spring 2014 Budget, it forecast that spending in 2018–19 would be £7.4 billion whereas it turned out to be over 60% higher at £12.0 billion. The only notable exception so far to this pattern of underestimating future spending has been during the pandemic when, for understandable reasons, there were considerable delays in individuals moving onto PIP.
Figure 4.13. Successive OBR Spring forecasts for spending on working-age disability benefits
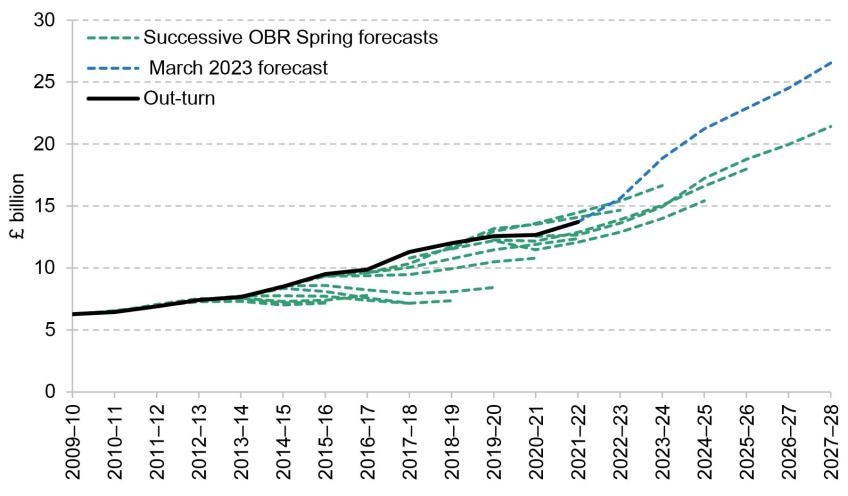
Source: Chart 3 of Office for Budget Responsibility (2019), and table ‘Disability benefits’ from Department for Work and Pensions, ‘Benefit expenditure and caseload tables’, 2020, 2021, 2022 and 2023 editions (https://www.gov.uk/government/collections/benefit-expenditure-tables).
Further policy change is also on the horizon. A week before the March Budget, the government published Transforming Support: The Health and Disability White Paper (Department for Work and Pensions, 2023). The stated rationale for the reform is not to reduce spending but rather to rationalise the system and to improve the experience of the benefits system for disabled people and those with health problems. In particular, a central plank to the proposals is to abolish the work capability assessment (WCA), which determines health-related support within UC, and instead passport eligibility from the PIP assessment.11 If legislated and enacted, it would represent a major change to the system and therefore make forecasts for the related spending more uncertain. However, it would only apply to new claims over the three years from 2026–27 (with the OBR estimating a budgetary saving in 2027–28 of just £35 million), with existing claims being reassessed no earlier than 2029. So any budgetary impact in the next few years can be expected to be modest.
Perhaps with the length of this timescale in mind, on 5 September 2023 the Secretary of State for Work and Pensions, Mel Stride, launched a consultation on a proposed set of changes to the soon-to-be-abolished WCA.12 If implemented, these will reduce the threshold required in order for someone to be judged as able to prepare for work. Those affected would lose out financially (typically by almost £400 per month) and would also be required either to prepare for work or to search for a job in order to keep receiving their remaining UC. However, these changes would only apply to new claims and reassessments from 2025 and would become irrelevant once the WCA has been abolished (which is planned to happen in any case in 2029). But if successfully implemented, they could reduce spending in this intervening period.
However, it is worth noting that when reforms have been designed to deliver savings, they have often not delivered the reduction in spending that was hoped for. As the OBR concluded in 2019:
‘The cost of the “extra costs” disability benefits system has risen significantly over time, and both major reforms to the system – the introduction of DLA in 1992 and of PIP in 2013 – have ended up costing much more than expected. With DLA, that involved a deliberate expansion in coverage yielding a greater increase in the caseload and cost than had been predicted. With PIP, a reform intended to reduce spending has actually increased it.’
Office for Budget Responsibility, 2019
The assessment that the introduction of PIP increased spending is particularly stunning given that it was initially assumed in 2010 to deliver a 20% cut in both caseloads and spending – with the latter figure increased in 2012 to nearer 30%. Of course, any forecast uncertainty arising from the tightening of the WCA that the government is now consulting on can only be temporary as it is subsequently being abolished. And the permanent White Paper reform is not being motivated by a desire to deliver a substantial reduction in spending, which might reduce the risk of recent history repeating itself. But it is worth noting that this reform would lead to more benefit spending being loaded onto the health test for PIP which has, in recent years, been delivering the bigger percentage increase in successful claims and resulting spending.
4.7 Support for housing costs
Another area of social security spending where there is a clear risk that current policy will prove not to be sustainable and that public spending will end up higher than forecast is support for the housing costs of lower-income households. This is available through UC for most working-age households. Some working-age households – most obviously those who have not yet been moved over to UC, but also some other groups such as those in temporary or supported accommodation – are supported by housing benefit, as are those aged over the state pension age. For those getting support who reside in the private rented sector, the amount they can receive depends on the type of property they are deemed eligible for – for example, a couple with one child can be eligible for a two-bedroom property – and where they live, with those in more expensive areas generally being entitled to more.
In the current financial year, £30.9 billion is forecast to be spent on this support. This is forecast to grow in real terms by £1.6 billion to £32.5 billion in 2027–28, which equates to growth of 1.2% per year. Of this support, £19.6 billion goes to 3.6 million households in the social rented sector – implying an average award of £105 per week; while £10.7 billion goes to 1.9 million households in the private rented sector – implying an average award of £111 per week.
The policy that will be unsustainable, at least in the longer term, is how LHA rates are set. Up until April 2011, they were based on the contemporaneous 50th percentile of local rents (measured across properties not in receipt of housing support). In April 2012, this was reduced to the 30th percentile. For the seven subsequent years, LHA rates were annually uprated by a combination of CPI inflation, 1% and zero. This led to a growing gap between actual rents and the amount of housing support families could receive. Then, as part of the initial COVID-19 support package, LHA rates were reset at the contemporaneous 30th percentile. But since then they have been frozen again.13
This indexation policy leads to the odd outcome where support for housing costs varies across the country, but rather than varying according to differences in current rents it varies according to differences in rents in 2020. As rents have grown differentially since 2020, it means that it is possible to get greater support in some areas relative to others despite rents being lower. While there is a valid argument that we might not want to subsidise people more to live in more expensive areas, there is no good argument for why we would want to subsidise them more to live in cheaper areas – not least because cheaper areas might have fewer good jobs. To give a concrete example, the monthly LHA rate for a two-bedroom house is £837.50 in Newbury and £825 in Bristol despite the 30th percentile of rents being £850 in Newbury and £950 in Bristol (Ray-Chaudhuri and Waters, 2023).
The other consequence is that as rents rise over time, fewer rents can be covered in full by the support for housing formally provided in the system. This is illustrated in Figure 4.14, which shows the share of new rentals (as proxied by properties advertised on Zoopla) where the rent is at or below the LHA rate. Prior to the pandemic – and the policy uplift – this had fallen to 11%. It then peaked at 23% as LHA rates were returned to the contemporaneous 30th percentile. (That the share covered did not rise to 30% is not surprising as new rents are often more expensive than existing ones, perhaps as landlords are keen to retain existing good tenants and not risk having an empty property for a few months.) But as rents have recently increased sharply, the share of available rental properties that are advertised for the LHA rate or below has fallen to below 5%. It is clear that LHA rates cannot continue to be frozen forever; the only question is when they will need to be increased. Estimates from 2020 suggest that a 10% increase in LHA rates would add £1.1 billion to spending (Bourquin and Waters, 2020).
Figure 4.14. Share of private rental properties on Zoopla where full rents covered by housing benefit local housing allowance
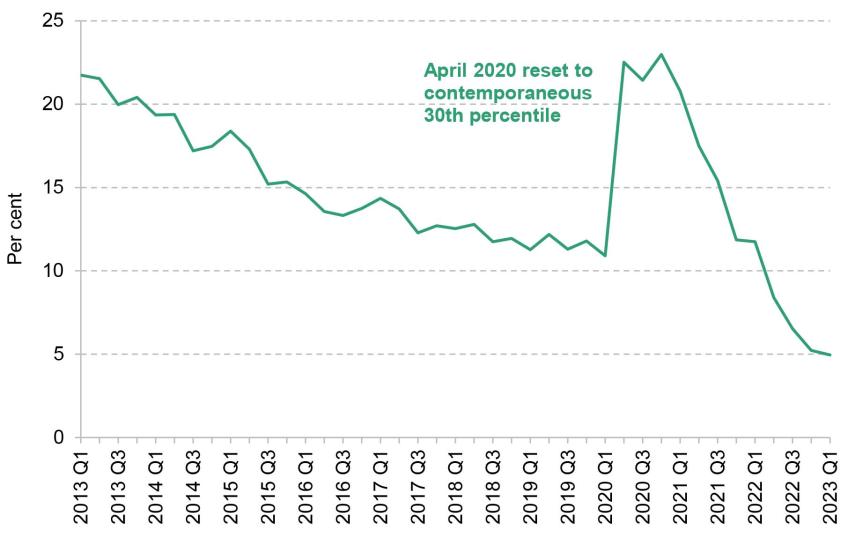
Source: Figure 4.11 of Waters and Wernham (2023).
4.8 Long-run pressures on pensions, health and social care
The chapter has focused so far on short-term risks to the public finances – risks that could crystallise over the next few years, or within the five-year forecast period. But a responsible government needs to think beyond the short term and beyond its medium-term fiscal target and ensure long-term fiscal sustainability as well. And, as we will show, some of these ‘long-term pressures’ are actually already materialising. For example, Figure 4.15 shows that increases in the state pension age have, until recently, stopped the share of the adult population aged over the state pension age from rising – despite the share of the population aged 65 and over increasing since around 2008. But from 2020 onwards, the share of the adult population aged over the state pension age is projected to rise.
Figure 4.15. Percentage of the adult (aged 20+) population that is aged 65 or over, or is aged above state pension age, 1971 to 2020 (out-turn) and to 2070 (projected)
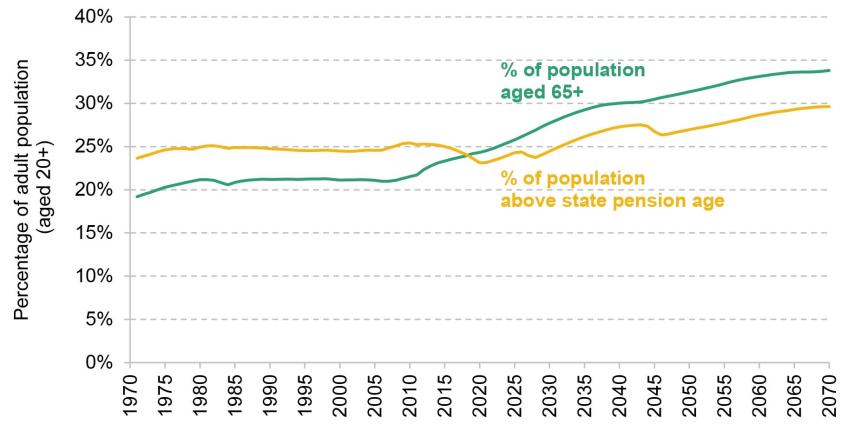
Source: Figure 13 of Cribb et al. (2023).
Official projections suggest that, under current policies, debt as a share of GDP is projected to increase exponentially in the long run. This is shown in Figure 4.16. One key driver of this dynamic is the pressure from an ageing population, which will lead to rising expenditure on pensions, health and social care. The demographic pressures are further exacerbated by rising costs of health and social care, and the estimated effect of the triple lock on pensions.
Figure 4.16. Official projection of ageing-related spending and resulting growth in debt
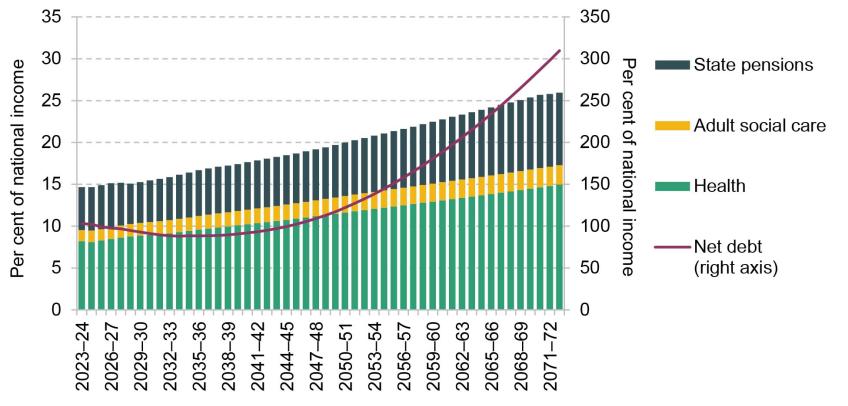
Note: In addition to the effect of ageing, the baseline projection includes the impact of other long-term developments such as declining employment rates, non-demographic cost pressures in health and social care, the effect of the triple lock on pensions, and the transition to net zero.
Source: OBR’s July 2023 Fiscal Risks and Sustainability (detailed long-term fiscal projections, released September 2023).
As a result, ageing-related spending as a share of national income is projected to increase from just below 15% today to 20% in 2050 and to over 25% in 50 years’ time. The increase from 15% to 20% of national income is equivalent to £137 billion in today’s terms, which is around half the amount raised by income tax. Of the 5% of national income rise projected up to 2050, the biggest increase comes from spending on health (an increase of 3.4% of national income) followed by spending on state pensions (1.2% of national income). The latter is despite the state pension age being legislated to rise from 66 to 68 by the mid 2040s. Spending on adult social care and pensioner benefits are also projected to increase, while other spending categories are projected to fall as a share of GDP over the long term, mostly due to the cuts implied by the tight spending totals set out for 2025–26, 2026–27 and 2027–28 (see above), but also because of reforms that will reduce the generosity of public service pensions and falling pupil numbers (which are expected to reduce education spending).
If these spending increases over coming decades are to be accommodated, then either spending would need to be cut back in other areas and/or measures would need to be put in place to increase tax revenues as a share of national income. The Office for Budget Responsibility (2023b) estimates that to keep the public sector net debt at its current level of around 100% of national income would require either a one-off tax rise or spending cut of 4.4% of national income in 2028–29, or tax rises or spending cuts worth 1.5% of national income to be made successively each decade.
How do the UK’s long-term public finance pressures compare?
Even though the situation looks serious, substantial ageing pressures are present in many advanced economies, and the UK’s situation actually appears quite modest relative to other countries. The OECD (Guillemette and Château, 2023) estimated long-term fiscal pressures for 33 countries using a consistent methodology and the UK ranked 11th-lowest in terms of the pressures faced (Figure 4.17) even though our position has slightly deteriorated since its last projection (Guillemette and Turner, 2021). The OECD estimates that UK government revenue will have to increase by around 5% of national income by 206014 in order to keep the debt stable in the long run (absent cuts to spending), compared with an average of over 7% of national income across OECD countries.
Figure 4.17. Ageing-related public finance pressures by source across countries
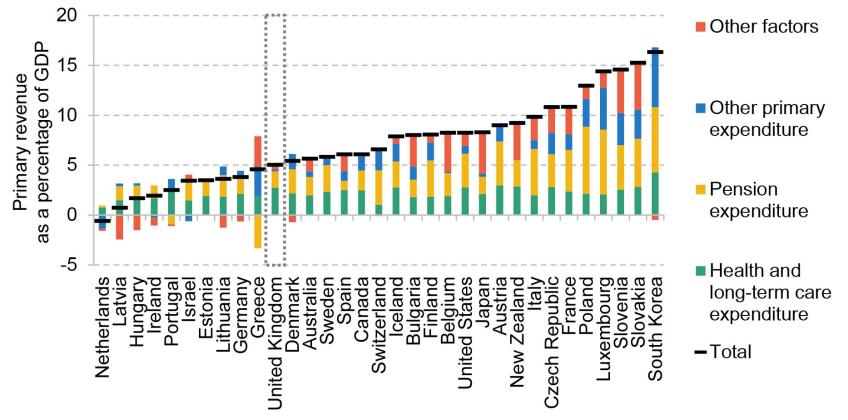
Note: The figure shows how the ratio of structural primary revenue to GDP must evolve between 2024 and 2060 to keep the debt-to-GDP ratio stable near its currently projected value over the projection period. The underlying projected growth rates, interest rates, etc. are from the baseline long-term scenario presented in Guillemette and Château (2023). The necessary change in structural primary revenue is then decomposed into specific spending categories based on the projected growth in spending as a share of GDP. The ‘other factors’ component includes adjustment to the initial fiscal position that must occur to stabilise the public debt ratio, projection of net interest payments, and changes in the differential with economic growth.
Source: Guillemette and Château, 2023.
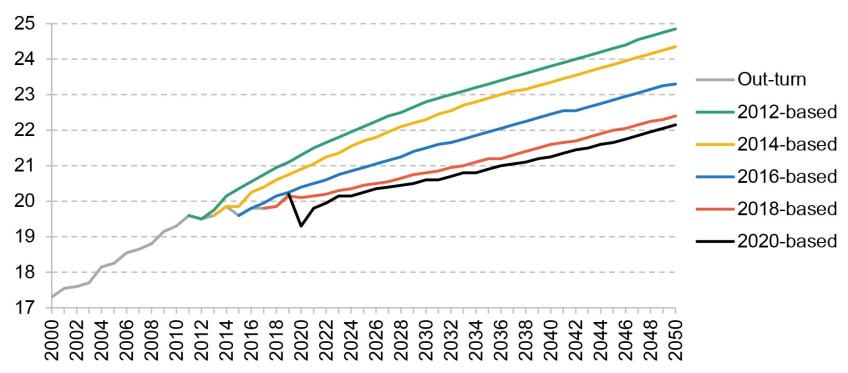
The key driver of the UK’s position relative to other countries is its more favourable demographic outlook. The old-age dependency ratio (defined here as the ratio between the number of people aged 65 and over and the number aged 20–64 years) is set to increase by 24 percentage points (ppt) in the next 50 years compared with an average increase of more than 30ppt in other countries (Figure 4.18). This still means that the ratio of adults aged under 65 to adults aged over 65 in the UK will fall from approximately three-to-one today to below two-to-one by 2070; but this is actually the 8th-most-favourable change out of EU and OECD countries and is not driven by the fact that the UK has already aged. Our old-age dependency ratio is currently at the average of the selected countries and has experienced the 9th-smallest increase since 1980 (Table 4.2). As was shown in Figure 4.15, the share of adults aged 65 and over in the UK was actually relatively stable over the three decades to 2008.
Figure 4.18. Old-age dependency ratio
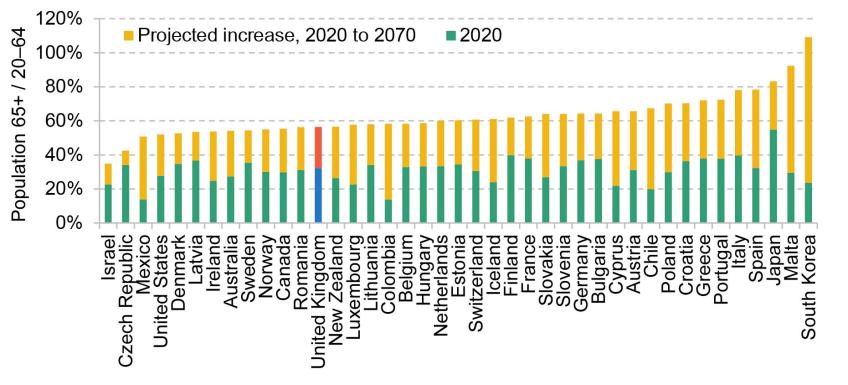
Note: Old-age dependency ratio is defined as the ratio between the number of people aged 65 and over and the number of people aged 20–64 years.
Source: UN World Population Prospects 2022.
Table 4.2. UK’s ageing-related fiscal pressures and old-age dependency ratio relative to other OECD countries
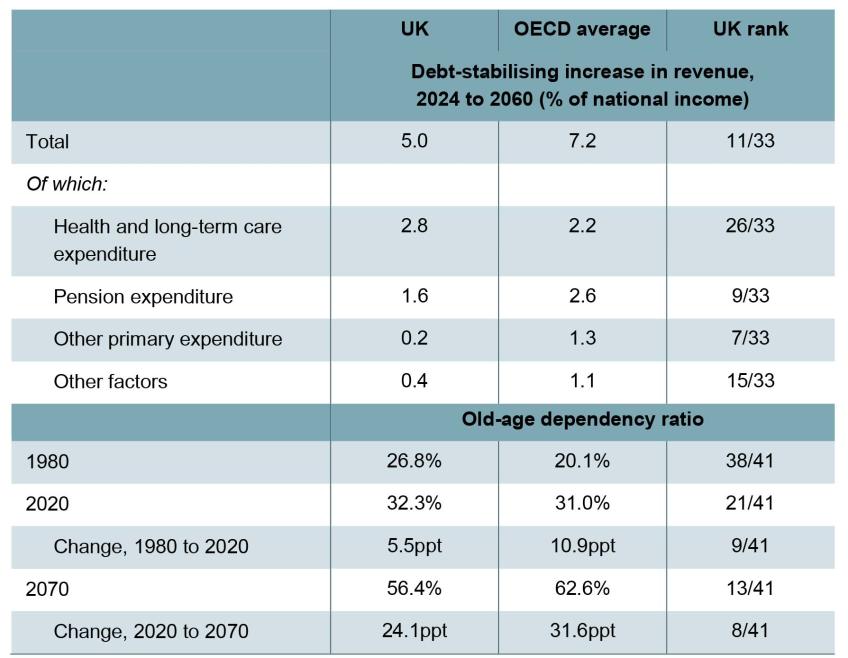
Note: The total debt-stabilising increase in revenue is decomposed into specific spending categories based on the projected growth in spending as a share of GDP. The ‘other factors’ component includes adjustment to the initial fiscal position that must occur to stabilise the public debt ratio, projection of net interest payments, and changes in the differential with economic growth. Countries are ranked in ascending order for each indicator. A higher rank indicates a worse situation from a public finance perspective. For the fiscal pressures, 33 selected OECD countries included in the projection are used in the ranking. For the old-age dependency ratio, a broader set of OECD and EU countries is used.
Source: Guillemette and Château (2023) and UN Population Prospects 2022.
However, the UK is differentially exposed in different areas of ageing-related spending. Public pensions form a relatively smaller share of public expenditure in the UK than other countries. Together with less severe demographic pressures, the projected increase in spending on public pensions is moderate relative to other countries as a result (Figure 4.17 and Table 4.2).
On the other hand, spending on healthcare forms a significant portion of public spending in the UK. In turn, we face the 8th-largest (out of 33) projected increases in healthcare spending in the long run (Figure 4.17 and Table 4.2). As well as population ageing, this projected increase in health spending is also driven by strong projected growth in non-demographic cost pressures – namely, lower productivity growth in the healthcare sector than in the rest of the economy, adoption of new cost-increasing technologies, and rising prevalence of more complex and chronic conditions.
Risks around the OBR’s long-term public finance projections
There are additional risks not incorporated into the latest baseline OBR projections, which could act to decrease or increase the fiscal pressures relative to those projections. On the one hand, there has been a significant increase in net immigration. The number of people moving to the UK minus those leaving reached over 600,000 in 2022, driven mostly by rising non-EU immigration. Even though a significant portion of the increase came through humanitarian and asylum routes (most notably from Ukraine), the number of non-EU work- and study-related immigrants has been steadily increasing since 2021. This has led both the Office for National Statistics (ONS) and the OBR to revise the expected long-term net migration upwards to 245,000 a year, though the future trends remain uncertain. Permanently higher immigration would boost the share of working-age people in the population and thus ease the burden of increasing dependency ratios and the associated public finance pressures.
Working in the opposite direction, together with other advanced economies, we have seen significant and continuous declines in fertility rates in recent years. Each successive population projection by the ONS, which serves as the foundation for the OBR fiscal projections, assumes that this decline will stop in the near future and partially reverse in the longer term (Figure 4.19). However, the latest birth statistics in England and Wales show a 3.1% decline in live births in 2022 compared with the previous year – the lowest level in two decades. If total fertility rates for the whole UK evolve similarly, further downward revisions can be expected when the new long-run population projections are released. Given the unusually large gap between the growth in live births and total fertility rates in 2021, this revision is likely to be even more substantial than the figure presented here and the fertility rate could reach as low as 1.4 for 2022.
Figure 4.19. Fertility rate projections and out-turn
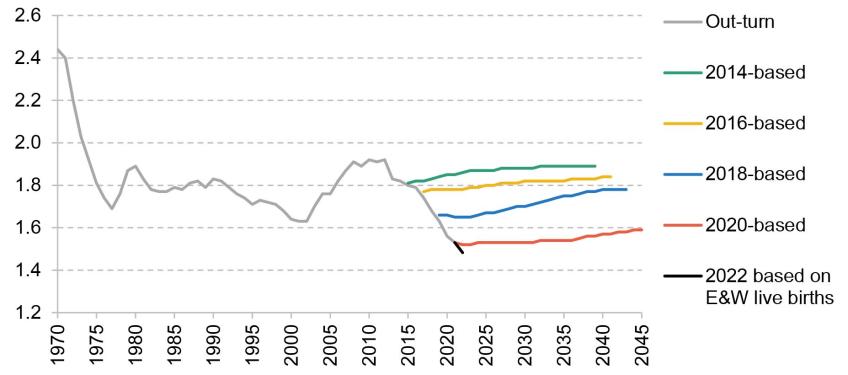
Note: The estimate for 2022 is based on the recent decline of 3.1% in live births in England and Wales (E&W) in 2022, assuming that the population of adult women remains unchanged.
Source: ONS National Population Projections.
Persistently lower fertility rates today will reduce the spending on education and child-related healthcare and welfare transfers in the near future as there are fewer children to support. However, when these children reach adulthood, there will be a lower working-age population in future decades. As the number of pension-age people is unlikely to change substantially in the next 50 years, this will make the financing of increased public spending on health and pensions even more challenging over this period.
Together with lower fertility rates, there has been a steady slowdown in the growth in life expectancy since 2010, with each successive population projection optimistically expecting a quick return to a trend similar to that observed in the past decades (Figure 4.20). Lower life expectancy is bad news in general, but it is favourable for the public finances because it reduces the population of pension-age adults and thus ageing-related spending. However, the latest update (in 2022) revised the population of pensioners in 50 years’ time downwards by only 8%, which is more than outweighed by the negative effects of declining fertility in the long run. In addition, to the extent to which slower growth in longevity leads to the state pension age being pushed up less quickly, this will also offset at least some of the long-term fiscal savings.
Figure 4.20. Life expectancy at age 65: projections and out-turn
Note: Average period life expectancy at age 65 for males and females. This measures how much longer a person who is 65 years old in the given year can expect to live given the current mortality rates. Improvements in mortality rates over the course of one’s life might be expected to add a further 1.0 to 1.5 years to this measure.
Source: ONS National Population Projections.
4.9 Conclusion
In the March Budget, the official forecasts – which are meant to be a central estimate of the outlook for the public finances over the next five years – suggested that public sector net debt would stabilise and then, just about, fall as a share of national income between 2026–27 and 2027–28. On this basis, the Chancellor was complying with his fiscal mandate.
Whether these forecasts are really based on actual government policy is, at best, questionable. That is not to say that the OBR has done something wrong. It is constrained to take government policy as stated. The issue is the extent to which stated government policy is a good representation of actual government policy.
In the case of fuel duties, it is clear it is not. Actual government policy is perhaps best described as a charade along the lines of ‘to always keep fuel duties at their current cash levels, while always pretending that in 12 months’ time any “temporary” cuts to rates will be allowed to expire and the rate will be increased in line with inflation’. Incorporating this actual policy into the forecast would reduce projected revenues by £6 billion in 2027–28. The Chancellor has also said he wants to make his three-year ‘full expensing’ in corporation tax a permanent policy. This could increase borrowing by around £10 billion a year in the near term from March 2026, though this figure overstates what the long-run cost would actually be.
These are perhaps the clearest examples. But another is the plans for day-to-day public service spending beyond March 2025. While these imply overall spending continuing to rise, they are far tighter than the plans that were left in place by Mr Sunak when he was Chancellor just a year earlier. And more fundamentally, they do not appear to be consistent with a reduction in the government’s appetite to spend. After taking account of commitments on the NHS workforce, the huge expansion of state-funded early-years childcare announced in the Budget, increased spending on defence and overseas aid and a likely protection of the schools budget, ‘unprotected’ departments would need to shoulder cuts of 1.5% per year, or £9.4 billion in today’s terms by 2027–28. It seems unlikely, to say the least, that this will be delivered. More likely, by the time we get to a Spending Review, the plans will be topped up; something that Conservative Chancellors have, on average, done to the tune of £14 billion per year at Spending Reviews seen since 2010. It is a similar story on investment spending on public services: Mr Hunt has pencilled in numbers that imply a cash freeze to spending in 2027–28, which would be £13 billion less than implied by the plans he inherited from Mr Sunak’s 2022 Spring Statement. This is despite pressures for additional investment in areas such as defence, schools and hospitals and to support the transition to net zero.
These behaviours – where announced tax and spending policies are not aligned with what policy is actually likely to be – mean that the OBR’s forecasts will no longer be a central forecast. This is harmful for transparency and makes scrutiny of fiscal plans even more difficult.
There are also several other policy risks to the public finances. A clear one relates to the plan to continue to freeze virtually all thresholds in the direct personal tax system. What started out as a four-year freeze to income tax thresholds to raise an estimated £8 billion is now a plan for a six-year freeze – and one that now applies to NICs thresholds as well as income tax – which we estimate would raise £52 billion in 2027–28. The Autumn Statement could see the Chancellor tempted to extend that for a further year, which would raise an additional £6 billion. This extended freeze is set to undo two-thirds of the increase in the personal allowance seen over the 2010s and bring the share of adults paying income tax up to the record two-thirds seen in 2007–08, and lead to almost 80% more adults paying higher (or additional) rates of income tax than had the freezes not been in place. This could put increasing pressure on government to end the freeze before 2027–28. Ending it one year early would reduce receipts in 2027–28 by around £5 billion.
There are also risks around spending on benefits for disabled people and those with health difficulties. Such spending has increased rapidly since the pandemic and this growth is actually forecast to accelerate. The risks – while large – may be two sided, i.e. it is possible spending will undershoot as well as overshoot these forecasts. There are also policy risks. Major reforms to incapacity benefits are planned. Previous attempts to reduce spending in these areas have been far from successful. But the most significant reform – set out in the White Paper in March – while radical and far from risk free, is not motivated by a desire to cut spending, which might reduce the risk of recent history repeating itself.
As well as greater honesty about policy settings over the next five years, the government also needs to set out a strategy for its approach to the longer-term challenges in the public finances. Ageing of the population together with other cost pressures is projected by the OBR to put upwards pressure on the health and state pension budgets. If accommodated, these will require sizeable tax rises or cuts to other spending to finance them. The UK’s public finance challenge, while difficult, does appear not to be as severe as that seen in many other OECD and EU countries. This is due to our relatively low level of state pension spending (with much greater reliance on private pensions) and more favourable demographic projections. There are some uncertainties here, though. Immigration projections have been revised up in the light of recent experience, which we would expect to strengthen the public finances, but the magnitude of such effects is very uncertain. Slowing increases in life expectancy at older ages will also be favourable for the public finances (though less so if the state pension age is raised more slowly as a result). Working in the other direction, it seems very likely that there will be yet another downwards revision to projected fertility rates.
The big picture here is that the long-term public finance challenges – for example, around age-related spending pressures and around the transition to net zero – have been known to be substantial for years. The precise scale of the challenges is inherently uncertain, but their existence is not. And some of the challenges that we typically think of as ‘long-term’ are increasingly posing fiscal risks in the here and now. Rather than further delay and obfuscation, a detailed and coherent government strategy for tackling these pressures over coming decades is urgently needed.
References
Adam, S. and Stroud, R., 2019. A road map for motoring taxation. In C. Emmerson, C. Farquharson and P. Johnson (eds), The IFS Green Budget: October 2019. https://ifs.org.uk/books/road-map-motoring-taxation.
Atkins, G. and Lanskey, L., 2023. The OBR’s forecast performance. Office for Budget Responsibility, Working Paper 19, https://obr.uk/download/working-paper-no-19-the-obrs-forecast-performance/?tmstv=1692112893.
Banks, J., Karjalainen, H. and Waters, T., 2023. Inequalities in disability. IFS Deaton Review of Inequalities, https://ifs.org.uk/inequality/inequalities-in-disability/.
Bourquin, P. and Waters, T., 2020. The temporary benefit increases beyond 2020-21. In C. Emmerson, C. Farquharson and P. Johnson (eds), The IFS Green Budget: October 2020. https://ifs.org.uk/books/temporary-benefit-increases-beyond-2020-21.
Cribb, J., Emmerson, C., Johnson, P., Karjalainen, H. and O’Brien, L., 2023. Challenges for the UK pension system: the case for a pensions review. IFS Report 255, https://ifs.org.uk/publications/challenges-uk-pension-system-case-pensions-review.
Department for Work and Pensions, 2023. Transforming support: the Health and Disability White Paper. https://www.gov.uk/government/publications/transforming-support-the-health-and-disability-white-paper.
Guillemette, Y. and Château, J., 2023. Long-term scenarios update: incorporating the energy transition. OECD Economic Policy Paper 33, forthcoming.
Guillemette, Y. and Turner, D., 2021. The long game: fiscal outlooks to 2060 underline need for structural reform. OECD Economic Policy Paper 29, https://www.oecd.org/economy/growth/scenarios-for-the-world-economy-to-2060.htm.
HM Treasury, 2010. Budget June 2010. https://www.gov.uk/government/publications/budget-june-2010.
HM Treasury, 2023. Spring Budget 2023. https://www.gov.uk/government/publications/spring-budget-2023.
Kennedy, S., Hobson, F. and Mackley, A., 2023. Proposals to abolish the work capability assessment. House of Commons Library Research Briefing 9800, https://commonslibrary.parliament.uk/research-briefings/cbp-9800/.
Office for Budget Responsibility, 2019. Welfare trends report – January 2019. https://obr.uk/wtr/welfare-trends-report-january-2019/.
Office for Budget Responsibility, 2023a. Economic and fiscal outlook – March 2023. https://obr.uk/efo/economic-and-fiscal-outlook-march-2023/.
Office for Budget Responsibility, 2023b. Fiscal risks and sustainability – July 2023. https://obr.uk/frs/fiscal-risks-and-sustainability-july-2023/.
Ray-Chaudhuri, S. and Waters, T., 2023. Freezes in housing support widen geographic disparities for low-income renters. IFS Comment, https://ifs.org.uk/articles/new-data-shows-continued-freezes-housing-support-widen-geographic-disparities-treatment.
Treasury Select Committee, 2023. Fuel duty: fiscal forecast fiction. Eleventh Report of Session 2022–23, https://committees.parliament.uk/publications/33621/documents/183338/default/.
Waters, T. and Wernham, T., 2022. Reforms, roll-outs and freezes in the tax and benefit system. In C. Emmerson, P. Johnson and B. Zaranko (eds), The IFS Green Budget: October 2022. https://ifs.org.uk/publications/reforms-roll-outs-and-freezes-tax-and-benefit-system.
Waters, T. and Wernham, T., 2023. Housing quality and affordability for lower-income households. IFS Report 260, https://ifs.org.uk/publications/housing-quality-and-affordability-lower-income-households.
Wilson, W. and Hobson, F., .2021. The rent safety net: changes since 2010. House of Commons Library Research Briefing 05638, https://researchbriefings.files.parliament.uk/documents/SN05638/SN05638.pdf.
Zaranko, B., 2023. A look under the hood of Labour’s investment plans. IFS Comment, https://ifs.org.uk/articles/look-under-hood-labours-investment-plans.
Endnotes
Authors

Carl Emmerson
Carl, a Deputy Director, is an editor of the IFS Green Budget, is expert on the UK pension system and sits on the Social Security Advisory Committee.

Martin Mikloš
Martin is a research economist at TaxDev and works on taxation in developing countries.

Isabel Stockton
Isabel works in the Healthcare sector, and on the public finances. Their research focuses on retaining and developing the NHS workforce.
More from IFS
Understand this issue


Policy analysis


Academic research


