
Background
Families on low incomes living in rented accommodation are entitled to support with their housing costs which, depending on their income and assets, can be up to 100% of their rent. However, for those renting privately, the maximum support they can receive is capped by their ‘Local Housing Allowance’ (LHA) rate. LHA rates are determined by the size and composition of the household, and rents in their local area. A family whose rent is above their LHA rate will have their support based on this rather than the actual rent they pay. Across the country, around 2 million private renting households – 38% of the total – receive housing support through either Universal Credit or Housing Benefit[1].
Over the past decade, the method employed to update LHA rates has varied. In 2012–13, LHA rates were set to the 30th percentile of rent in the local area for each property size (based upon rents in the previous September), having been reduced from the median rent the year before[2]. That meant that a family on benefits could rent one of the cheapest 30% of homes in their area of the applicable size and (if their income and assets were low enough) have the full rent covered by housing support. But in the subsequent seven years, LHA rates were annually uprated by a combination of CPI inflation, 1%, and zero. These decisions led to a growing gap between actual rents and the amount of housing support families could receive. On top of this, since rental prices do not grow evenly across the country, this gap was much larger for families who lived in areas where rents had grown quickly than for those who lived in areas where they had grown slowly.
In the wake of the COVID-19 pandemic, the government returned all LHA rates to the 30th percentile of local rents (as of September 2019) – only to resume freezing them in each year since. The government has announced that this will continue for 2023–24, meaning that the familiar pattern of growing differences between rent and housing support, to a degree that varies arbitrarily across the country, is re-emerging. Data released on Tuesday show that the 30th percentile of rents of two-bedroom properties in the average area grew by 4% on the year, and by 8% since 2019 (trends are similar for other sized properties[3]. Compared to uprating them to match local rents, the freeze in LHA rates will reduce support for nearly 1.1 million households by an average of £50 per month, saving the government more than £650 million in 2023–24.
Freeze means actual rents continue to diverge from LHA rates
Figure 1 shows how the 2023–24 LHA rates compare to the 30th percentile of rents in each ‘broad rental market area’ (BRMA) – the geographical unit that LHA rates are calculated for – for two-bedroom properties. If LHA rates had been kept at the 30th percentile of local rents, then all the points would lie on the grey 45-degree line. Therefore, any point situated to the right of that line represents a BRMA where the LHA rate is below the 30th percentile of rents. Unsurprisingly, freezing rates at the 2019 level has led to a decline in support relative to actual rent costs. In a small number of cases rents have fallen, meaning that in those areas support can cover more than the cheapest 30% of properties.
While the generosity of support has fallen relative to rents in almost all areas, the amount by which it has fallen varies widely, reflected in the figure by the dots not being arranged along a single line. This leads to bizarre consequences. For example, the 30th percentile of rents in Bristol is £100 more than in Newbury. But the amount of housing support that those who live in Bristol can receive is £12.50 less than those who live in Newbury. The full list of 30th percentile of rents, LHA rates, and difference between the two for every broad rental market area is available in a spreadsheet accompanying this comment.
Reduction in generosity of support, but not spread evenly across recipients
Since rents generally rise over time, keeping LHA rates fixed over a number of years reduces the amount of support that is available as a proportion of families’ actual rental costs. To illustrate the effects of the current freeze, Figure 2 looks at the shortfall in support relative to rent – i.e., the share of rent that households must cover from sources other than housing support – among privately renting households in the bottom 40% of the income distribution. We show this for the current system where LHA rates are based upon 2019 rents, and how this would change if LHA rates returned to using contemporaneous rents. The first thing to note is that two-thirds of lower income privately renting households must cover at least a quarter of their rent from sources other than housing support[4]. And around one in four private renters in the bottom 40% of the income distribution are not entitled to any support for housing costs at all, i.e. they face a shortfall of 100% and must cover rent entirely from other income. If LHA rates were rebased using current rents, this would benefit 1.1 million households – those who are entitled to housing support and whose rent is above their LHA rate[5]. It would mean that the proportion of households with a shortfall of at least a quarter of their rent would fall 4.3 percentage points to 62%.
Figure 2. Shortfall in housing support relative to rent among private renters in bottom 40% of income distribution
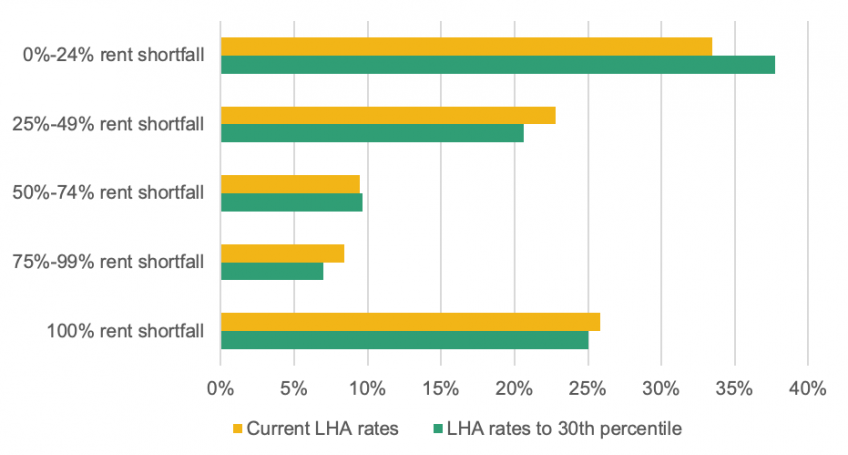
Note: Data for Great Britain. The system where LHA rates are rebased to the 30th percentile maintains the national caps currently imposed. See footnote 4 for more detail on how housing support is calculated. Household income refers to non-housing support income.
Source: Authors’ calculations using the Family Resources Survey 2019–20 and TAXBEN, the IFS tax and benefit microsimulation model.
Freezing rates to reduce the generosity of housing benefit support has the unfortunate consequence of creating arbitrary differences between the support that different families can get depending on where they live. Families living in areas where rent growth has been faster since 2019 will have larger shortfalls than otherwise similar families who live in areas with slower growth. These discrepancies are highlighted in Figure 3. Here, we categorise households according to how fast rents have grown in their local area. We then calculate the impact of freezing LHA rates (vs. maintaining them at the 30th percentile) on the average shortfall between housing support and rent in slower to faster growing areas. The shortfall has increased by 5 percentage points for families living in the highest growth areas such as Nottingham and Manchester, compared to 1 percentage point for the lowest growth areas including Lothian and Sunderland.
Figure 3. Effect of freezing LHA rates on average shortfall between rent and housing support among private renters in the bottom 40% of income distribution, by rent growth quintile
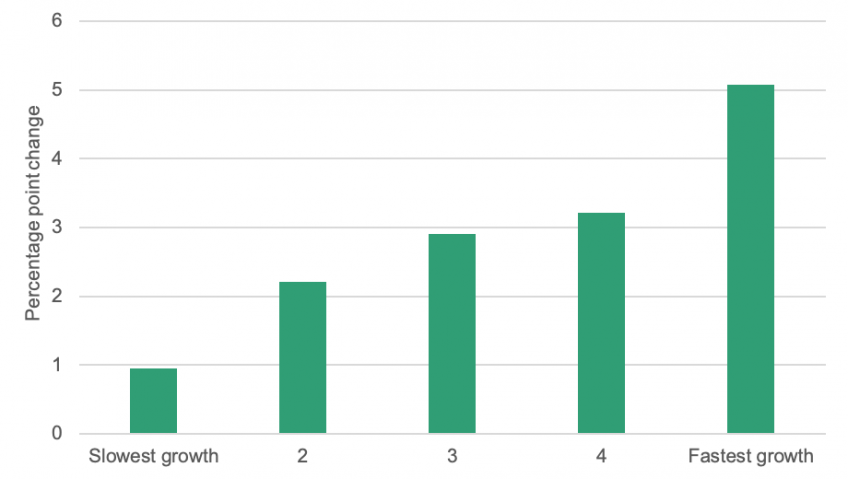
Note: See Figure 2. Rent growth quintile based on rents for two-bedroom properties.
Source: See Figure 2.
Conclusion
Setting housing support policy is no easy task, not least in a world with a much larger private rented sector than in the past. More and more low-income families have become exposed to the cost of private rents, and governments have spent more and more on housing support. The overall level of support for housing costs will remain an unenviable political judgement. But the way that support is structured matters, as well as its overall level, and the current approach makes little sense. It permanently bakes in historic information about differences in rents across the country, while entirely ignoring current information about those differences. Hence it results in (increasingly) large and arbitrary variations in entitlements. This means that while some low-income families see almost no change in the share of housing costs they are required to pay, others will have to cover significantly more than they did previously. Big gaps have already opened up in the space of just three years – they will only widen as time goes on.
Footnotes
[1] Source: Family Resources Survey 2019-20 and DWP Stat-Xplore. There are 270,000 households who report living rent-free. We do not include them here since they cannot receive housing support.
[2] There were also national caps, which functionally meant that LHA rates were lower than the 30th percentile in some parts of London..
[3] The rent information released on Tuesday which we use in this comment relates to the 30th percentile of rents among private renters excluding those receiving housing support.
[4] In the Universal Credit system, housing support is not easily separable from the rest of the benefit – as UC integrates together multiple existing strands of support. We calculate housing support for UC claimants by calculating how much their UC entitlement would change if their housing costs fell to zero. One feature of the UC system is that the ‘work allowance’ – the amount a family can earn before their UC begins to be withdrawn – is higher for those who have no housing support. Thus, if a privately renting household’s rent fell to zero, they would not get any housing support but would see their work allowance rise – increasing their UC entitlement. A consequence of this is that only those households whose earnings are already below their work allowance (principally those out of work) can, by this measure, get 100% of their rent covered by housing support.
[5] The 1.1 million in this statistic does not include those who are subject to the benefit cap, who do not gain from such a rebasing even if their rent is above their LHA rate. It does include households who earn slightly too much to currently be entitled to any housing support (via Universal Credit or housing benefit) but would become entitled if LHA rates were to be rebased.
Authors

Sam Ray-Chaudhuri
Sam joined the IFS in 2022 and works as a research economist in the Income, Work and Welfare sector.

Tom Waters
Tom is an Associate Director at the IFS and Head of the Income, Work and Welfare sector.
More from IFS
Understand this issue


Policy analysis


Academic research


