
A lot has been said about employment, inactivity and job vacancies over the pandemic, but evidence on what’s happened to earnings is only just emerging, not least because the furlough scheme distorted the data. Here we take a first look at trends in earnings using payroll data from HMRC.
There has been a sharp rise in pay in the finance and insurance sector (henceforth ‘finance’) in recent months, at levels not seen in the last decade. Figure 1 shows that between 2014 and 2019, growth in average (mean) monthly pay among finance sector employees broadly tracked average pay growth across all sectors.[1] Since October 2021, however, earnings growth in finance has dramatically pulled ahead of the rest of the economy. By February 2022, average pay in finance was 31% higher than in December 2019 in cash terms, whilst average pay across all sectors was just 14% higher. This implies a real increase of 23% and 7% respectively.[2]
The rapid pay growth in finance is also seen in data from the Monthly Wages and Salaries Survey (MWS), which shows an increase in mean pay of 15% over the same period in the ‘finance and business services’ sector – a wider industry grouping that includes real estate and professional and administrative services – compared to 11% across all sectors.[3]
Figure 1. Mean nominal monthly pay indexed to December 2019, finance and all sectors
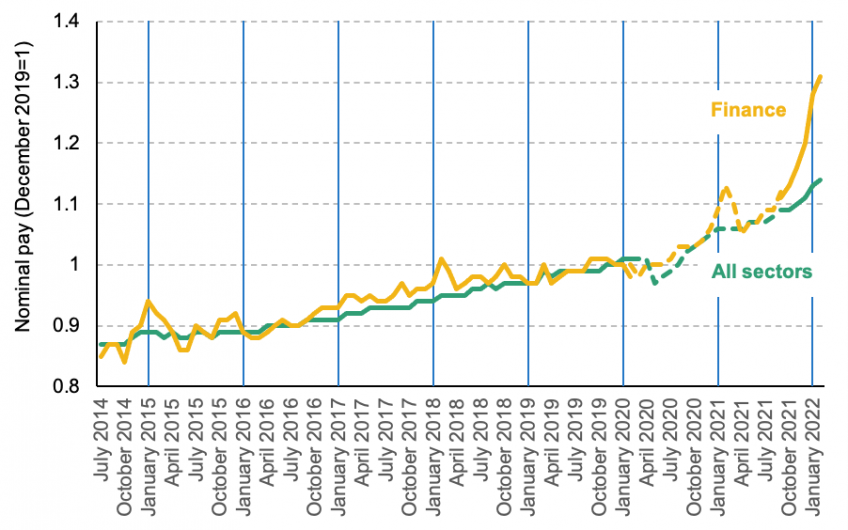
Note: Data restricted to individuals paid through PAYE and do not cover other sources of income such as from pensions, self-employment or investments. Dashed lines indicate months that may be affected by the furlough scheme. January in each year marked by vertical lines.
Source: PAYE RTI data, April 2022
Bonuses in the finance sector are typically paid in January and February, so the latest data could partly capture a rise in bonuses. If so, we would expect average pay to drop in the coming months, meaning that the latest data would overstate the longer-term increase in pay. That said, the gap between finance and other sectors started opening up in autumn 2021 – before bonus season – and the recent surge in pay far exceeds any seasonal trends that can be seen in previous years (see Figure 1). The MWS survey data further suggests that the bulk (nearly 80%) of the pay rise in the ‘finance and business services’ sector is due to an increase in regular pay, rather than bonuses, though the wider industry aggregation might obscure what’s happening in finance specifically.
Pay growth in finance was driven by high-earners in the sector. Figure 2 compares the growth in mean and median pay by industry between December 2019 and February 2022. In most industries, growth in mean pay was higher than in median pay, implying that high-earners in the industry experienced faster pay growth than lower- and middle-earners. However, the contrast is particularly stark in finance: the increase in mean pay (31%) was two thirds higher than the increase in median pay (19%).
Figure 2. Growth in mean and median nominal monthly pay, December 2019 to February 2022
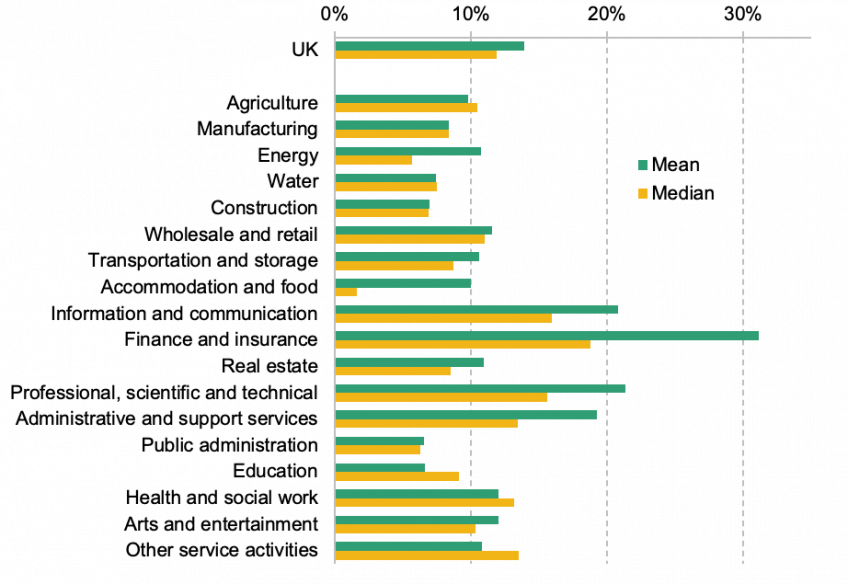
Note: Excludes mining and households and extraterritorial services. Industry names shortened for brevity. Data restricted to individuals paid through PAYE and do not cover other sources of income such as from pensions, self-employment or investments.
Source: PAYE RTI data, April 2022
It is not obvious why pay in the finance sector has increased so much since 2019. There have been reports of very high profits in some large banks, partly down to a surge in mergers and acquisitions (M&A) over the pandemic. While it is difficult to compare profits across sectors, output in the finance sector as a whole does not appear to have increased more than in other sectors. Whilst output (GVA) in finance held up much better than other sectors in the initial stages of the pandemic, by 2021Q4 GVA in the sector was no higher relative to 2019 than in other sectors.
Nor has there been an obvious increase in labour market tightness – which could increase employees’ bargaining power vis-à-vis their employers – over and above what we see in other sectors. Brexit and older workers leaving the workforce have reduced the overall supply of workers in the economy, but the finance sector was no more reliant on EU migrants than the economy as a whole, and 50-70 year olds working in finance have not become more likely to leave the workforce (relative to 2016-2019) than those working in other sectors. The number of vacancies in the finance sector in January-March 2022 was 43% higher than in January-March 2019 – no higher than the economy-wide increase of 52%.
Finance accounts for 29% of employees in the top 1% of earnings, and 44% of those in the top 0.1%. The large rise in pay among high-earning finance workers has therefore contributed to pushing up top pay inequality.[4] Figure 3 shows that across the economy as a whole, the highest-earning employees saw the strongest pay growth over the last two years: between December 2019 and February 2022, monthly pay grew by 10-12% in cash terms across most of the earnings distribution, but the pay of the top 1% of employees grew by nearly 14%. This is in stark contrast to the trend in the years leading up to the pandemic, when low-earners saw bigger increases in pay than middle- and high-earners.
Figure 3. Growth in nominal monthly pay by percentile of pay
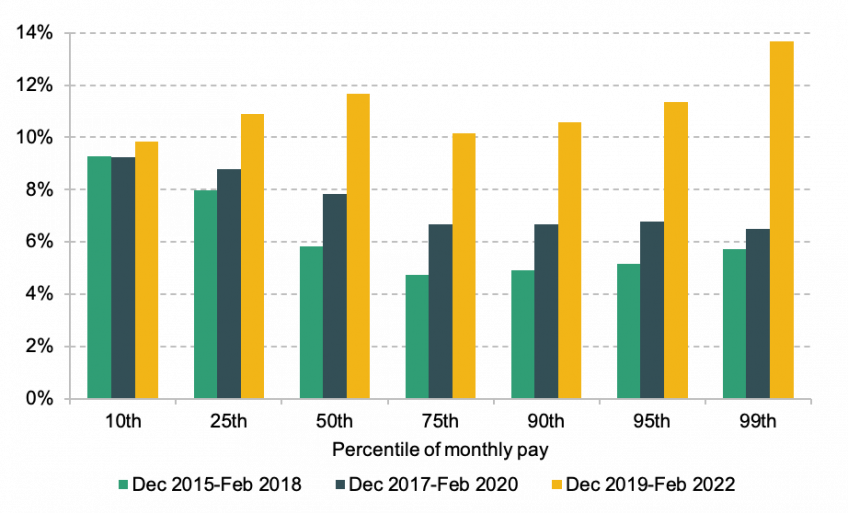
Note: Data restricted to individuals paid through PAYE and do not cover other sources of income such as from pensions, self-employment or investments.
Source: PAYE RTI data, April 2022
The reversal of pre-pandemic trends towards greater pay equality may imply higher inequality in household incomes in the years to come. Government support over the pandemic – including the £20 a week uplift to Universal Credit and the furlough scheme – led to a reduction in household income inequality between the 2019-20 and 2020-21 financial years. Since April 2021, the combination of lower pay growth for low-earners (relative to both high-earners and inflation), below-inflation benefit rises and the withdrawal of the £20 uplift means that prospects for low-income households are now much bleaker. In contrast, strong pay growth among the very highest earners could push up the top 1% share of household incomes, which has remained stable over several years.
[1] Data between March 2020 and September 2021 is affected by the furlough scheme, so comparing sectors is not straightforward.
[2] Earnings are deflated using CPI.
[3] ‘Finance and business services’ includes finance and insurance; real estate; professional, scientific and technical services; and administrative and support services. There are a number of differences between the MWS and PAYE data, including that MWS is seasonally adjusted whereas PAYE is not, and MWS is reported on a job basis whereas PAYE data is on an employee basis. A weighted average across the four sectors in the PAYE data gives a growth rate of 22% over this period.
[4] Two other high-paying sectors – IT and ‘professional, scientific and technical services’ – have also seen rapid pay growth since December 2019 (both 21% in cash terms). They account for 13% and 16% of employees in the top 1% of earnings respectively.
Authors

Xiaowei Xu
Xiaowei joined the IFS in 2018 and works in the Income, Work and Welfare sector.
More from IFS
Understand this issue


Policy analysis


Academic research

