
Today, the Department for Work and Pensions (DWP) released the latest official statistics on household incomes, which cover the first year of the pandemic: the financial year from April 2020 to March 2021. The statistics show that there were falls in incomes for people on middle and high incomes, of between 1% and 2%, which are fairly large compared to historical standards, but small when compared to the massive economic disruption caused by the pandemic. Poorer households actually saw their incomes rise, by around 4% at the 10th percentile of the income distribution driven by the large increases in benefits, such as the temporary £20 uplift to Universal Credit which has now expired. This meant that on a range of measures, in particular for families with children and pensioners, there were sizeable falls in income poverty rates.
There is understandably huge interest in the extent to which household incomes are (or are not) keeping up with rising inflation, in particular with gas prices rising substantially for most people in April. But it is also important to understand how household incomes have fared in the recent past. Until now, it has been difficult to quantify the impact of the pandemic on people’s incomes. This is because without the new household-level data, it was hard to assess how the combination of a huge hit to people’s employment and massive state support for households affected the distribution of income.
Average incomes
Figure 1 shows median (middle) household income in the UK from 2002–03 to 2020–21, both before housing costs are deducted (BHC) and after (AHC). These statistics, and all the others in this observation, adjust for consumer price inflation. The data imply that there was a decrease in median income measured BHC of 1.7% and slightly lower at 1.4% when measured AHC. Although this implies a hit to the incomes for average households, it is notable given the huge economic disruption this period saw, that there was not more of an impact. Despite the pandemic, middle incomes were higher in 2020–21 than they were only two years earlier in 2018–19. It is a testament to the support provided by government through the furlough scheme and other forms of economic support that average incomes did not fall by more.
Figure 1. Median disposable household income, 2002–03 to 2020–21
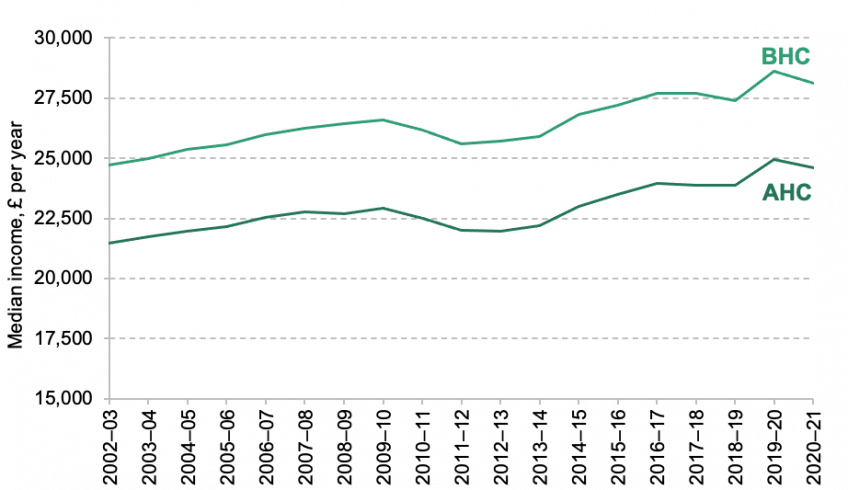
Note: Incomes have been measured net of taxes and benefits, and are expressed in 2020–21 prices. All incomes have been equivalised using the modified OECD equivalence scale and are expressed in terms of equivalent amounts for a childless couple. Source: Department for Work and Pensions, ‘Households Below Average Income: An analysis of the UK income distribution: FYE 1995 to FYE 2021’
Income inequality
As well as considering average incomes, it is also important to consider how richer and poorer people fared in 2020–21. Figure 2 shows the change in incomes for the 10th, 50th (median) and 90th percentiles of the income distribution from 2019–20 to 2020–21, and by way of comparison from 2011–12 to 2019–20 (the period of recovery from the Great Recession). The Figure shows that whilst incomes at the middle fell by 1.7%, they also fell for higher income people, by 1.3% at the 90th percentile. For middle and high income households these falls partially reversed the slow but steady growth in their incomes that had been seen during the recovery from the Great Recession up until 2019–20.
In comparison, the incomes of poorer households performed better during the first year of the pandemic, with growth of 3.8% at the 10th percentile. This is almost certainly driven by the substantial increases in the generosity of Universal Credit and other benefits that poorer households are particularly reliant upon for their incomes. This growth comes in stark contrast to the very low income growth for poor households in prior years – which averaged only 0.5% between 2011 and 2019. However, with the end of the temporary uplift to Universal Credit in autumn of 2021, and rising inflation meaning benefits are not keeping up with inflation currently, the prospects for lower income households in 2021–22 and 2022–23 are much bleaker.
The patterns of income growth seen in 2020–21 imply a reduction in income inequality, at least across most of the income distribution, and the popular “Gini” measure of income inequality showed a fall from 0.35 to 0.34 in 2020–21. However, the data underpinning the new statistics have more difficulty capturing recent income changes at the very top of the income distribution, so it is possible that different trends have occurred for the very highest income households.
Figure 2. Average annual real growth in disposable household income (BHC) at different percentiles
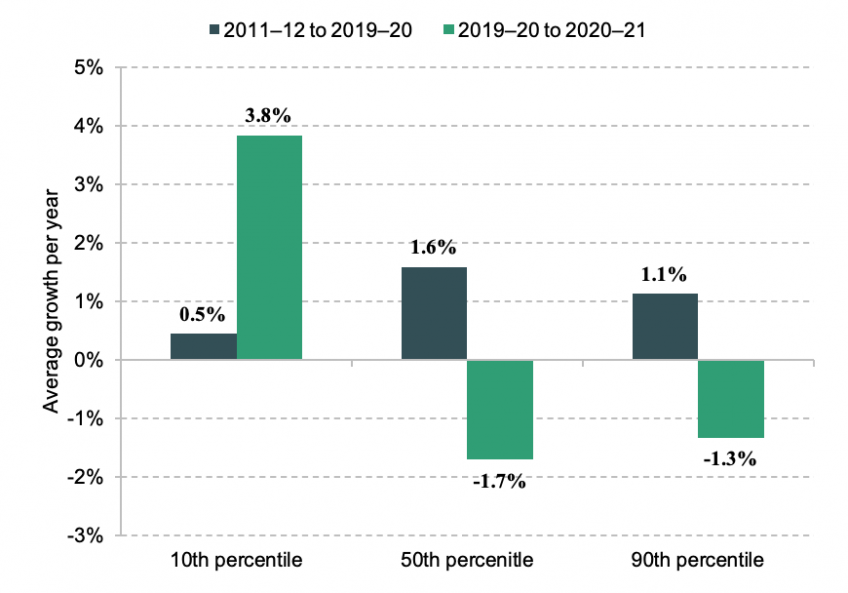
Note: Incomes have been measured before housing costs are deducted. See Figure 1 for source and other notes.
Income poverty
The patterns of income growth during the first year of the pandemic also have important consequences for income poverty. Figures 3 and 4 show income poverty rates since 2002–03 on two measures. “Absolute poverty”, shown in Figure 3, considers the proportion of people living below a poverty line that is fixed in real terms (i.e. it only changes in line with inflation). Income poverty fell on this measure from 18% to 17%, for children from 25% to 23% and for pensioners from 13% to 11%. Poverty for working-age adults fell by less, presumably as they were more exposed to the labour market shock of COVID-19, and were less supported by state benefits than families with children and pensioners.
Figure 3. Absolute poverty (AHC), 2002–03 to 2020–21
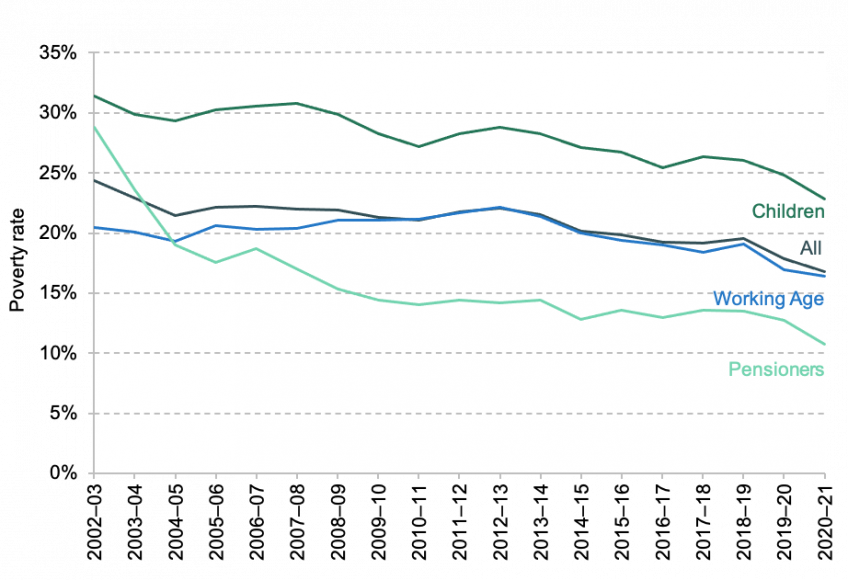
Note: Incomes have been measured after housing costs are deducted. See Figure 1 for source and other notes.
Figure 4. Relative poverty (AHC), 2002–03 to 2020–21
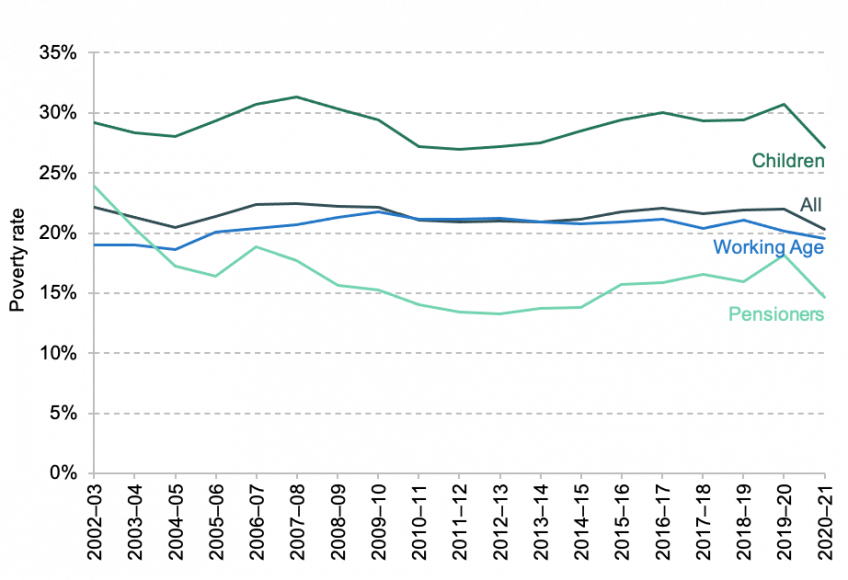
Note: Incomes have been measured after housing costs are deducted. See Figure 1 for source and other notes.
Figure 4 shows falls in relative poverty – which represents the fraction of people whose household income is below 60% of the contemporaneous median. The Figure shows that, in comparison to absolute poverty, the falls in relative poverty are larger. This is because the incomes of poorer households performed even better when compared to the (falling) incomes for people on middle incomes. Overall relative poverty fell from 22% to 20%, with particularly large falls for children (from 31% to 27%), though this only reversed the gradual rises in relative child poverty seen since 2010–11. As noted above, the reductions in the generosity of the benefit system during 2021, and benefits failing to keep up with rising inflation mean that it is likely that these falls in income poverty measures prove to be only temporary.
This observation was written as part of a project funded by the Joseph Rowntree Foundation (JRF). The views expressed in it are, however, those of the authors and not necessarily those of the Foundation. A report into household incomes and income poverty during the pandemic, and in-depth research into other trends facing low income households, funded by JRF, will be published in the Summer. Co-funding from the ESRC-funded Centre for the Microeconomic Analysis of Public Policy (ES/T014334/1) is gratefully acknowledged.
Authors

Jonathan Cribb
Jonathan is an Associate Director and Head of Retirement, Savings and Ageing sector, focusing on pensions, savings and later-life economic activity.

Tom Wernham
Tom is a Research Economist in the Income, Work and Welfare sector, having joined the IFS in 2020.
More from IFS
Understand this issue


Policy analysis


Academic research


